1. Introduction
In order to determine how lean a production process is, or to monitor the effectiveness of the introduction of changes to achieve a leaner production process, it is desirable to monitor three important parameters, namely consumer purchasing behaviour or customer demand, the average cost of the product along the entire logistics chain of the production process, and the movement of stocks along the entire production process.
Consumer behaviour (requirements for quantity and quality) is very important for the sizing of the production process and thus the cost aspect of an investment. The average cost of the product is important, as it allows us to monitor the efficiency and profitability of the production process in the introduction of principles and methodologies aimed at making the production process as lean as possible.
It is crucial to know the consumer behaviour and gather the relevant information, especially regarding the quantity of products that the consumer wants to order. Monitoring the fluctuation of the ACP (average cost of product) for the product along the entire production process or in critical operations gives us information about the fluctuation of production costs for the product, and information on the efficiency, economy and competitiveness of the production process.
From an economic point of view, two important pieces of data on the production process are thus obtained: the quantity and the own price. It is important that interventions in production processes in the introduction of lean production are measurable with relevant indicators. The production process is monitored by following the pull strategy principle, which means starting by the consumer, and continuing to the warehouse of finished products and further along the entire logistics chain to the suppliers.
The paper will outline an analytical method in which a mathematical relationship is determined between the consumer purchasing behaviour E[X] (the average quantity of product demands), the ACP (Average Cost of the Product) and (the optimum initial stock level). The proposed method allows for a real-time analysis of the impact of changes in the production process to achieve lean production on the average cost of the product, depending on the identified or expected changes in consumers.
Experience shows that product manufacturers initially respond to quantitative changes of customers by increasing the inventory of components and finished products, which has a direct impact on the leanness of the production process, and thus on the addi-tional costs. This, of course, is reflected in an increase in ACP.
The limitation of the presented research is that the mathematical model includes only the impact of changes in inventories as a consequence of changes in the market, but not the increase in costs due to other types of waste, which are also related to inventory size.
The fundamental motivation for this study is to answer the research question of whether it is possible to find a mathematical link that makes it possible to quickly and easily analyze the ways in which changes in the customer (changes in product type, quantity, and/or quality) affect the lean production process and thus the ACP. If the proposed model proves itself in practice, it will represent an important scientific and applied contribution to science.
2. Literature Review
Consumer behaviours are rapidly changing with the general globalisation of the market and the possibility of online shopping. Digital and social media are being used in the purchase decision process, and they influence buyer behavior. The classical model of decision making is valid in the description of the decision process of consumers [
1]. The consumer buying decision process consists—according to [
2]—of five stages: problem recognition, information searching, the evaluation of alternatives, the purchase decision, and post-purchase behaviour. Based on the analysis, they concluded that the consumer uses all of the five stages during decision-making process. The transition towards a circular economy is a crucial issue in the pursuit of more sustainable development. In this transition, consumers’ comprehension and engagement are necessary points to guide them towards more environmentally conscious purchases [
3]. Through behavioural studies, however, marketers can find innovative and creative solutions addressing their target market [
4]. Based on research [
5], each country has unique cultural characteristics, and these cultural differences influence consumers’ perceptions, attitudes and purchasing behaviour. Their results show that consumers from different countries exhibit different levels of attention towards the same product, and have different emotional inclinations for the same product feature. Viktor et al. [
6] concluded, in their research, that there is a need for an increased understanding of customers’ behaviour and their reaction to dynamic pricing, and that the product price has a significant positive effect on customer satisfaction [
7].
The economic factors alone do not govern the complex nature of consumer behaviour, but there are several psychological and sociological factors that also play a significant part in determining consumer behaviour, and information plays an important role in the consumer decision-making process. As such, consumer behaviour is a holistic approach [
8].
Ref. [
9] is a powerful value flow visualization tool throughout the logistics chain in production, and it represents one of the basic tools for achieving lean production processes. VSM lists all of the activities (non-value added, necessary non-value added and value added) from suppliers, through the production system to the consumer [
10], in order to increase the process efficiency and to achieve a lean production philosophy by minimizing waste [
11].
Gunduz and Naser [
12] proposed a value flow mapping system for weekly monitoring project implementation, which contributes to an increase in the times for the addition of added value, and consequently a reduction in the production flow times. By combining value stream mapping (VSM) and a cost–time profile, a very effective tool can be obtained for the visualisation of all of the activities within the production flow in terms of their contribution to added value or contribution to waste [
13,
14,
15]. A methodology which integrates VSM, the five-why method, and a scoring system based on fuzzy set theory into a systematic tool that visualizes the supply chain process, identifies waste and root causes, and provides solutions for industry practitioners was proposed by [
16] in order to identify a strategy for the improvement of the supply chain, but didn’t consider costumer behavior. An extension of the VSM concept which is based on the determination of the costs associated with the necessary operations, and the determination, based on said costs, of the total costs of the entire production process is presented in [
17]. The elimination of activities that represent waste, by simulating the total costs, determining the contribution of the implemented measure to the reduction in lead time, and, above all, reducing costs and thus the economic efficiency of the production process can be achieved with this approach. Onofrejova et al. [
18] proposed a qualitative approach to the generation of the data needed to support decision-making on the economic efficiency of the production system. In order to maximise profit from sales, she proposed the use of linear programming methods.
A method for the selection of a best-future-state map using a cost–time profile approach was presented by [
19], with which manufacturing organizations can identify the current value of their products, eliminate waste and improve the value-added time in the production processes. The customer demand is considered as being deterministic in the form of a fixed number. However, considering the industry’s conditions, and in order to respond to customer requirements more flexibly, the author suggested that the customer demand and its impact on VSM should be considered in future research.
The biggest contribution of the cost–time profile is, in fact, in improving the accuracy of the calculation of the direct costs of the product as well as the detection of hidden costs that were not previously considered [
20].
Through optimisation and forecasting, efficient, flexible and responsible supply chains can be built, thus achieving key competitive advantages [
21]. Yang et al. [
22] adds that the production system can be improved, in terms of lean production, by using a genetic algorithm to flexibly change its configuration (the number and location of workers and work equipment).
Hao et al. [
23] showed that the impact of lean bundles (just-in-time, total quality management, and human resource management practices) and servitisation on sustainable performance is much more complicated than was previously thought, and highlighted the value of complementarity thinking in addressing corporate sustainability.
Authors have, in [
24], explored the effect of lean practices on performance measures, and have identified the lean criteria (among them the customer management), that can have a significant impact on the supply chain, and can help decision makers to choose the appropriate strategy in the identification of major practices that influence the lean supply chain.
The results obtained in the research [
25] show support for the influence of firm risk and past operational performance variability in terms of the undertaking of decisions that favour further progress in lean production implementation. The impact of the external and internal environment influences a company’s commitment to increasing its level of lean production implementation and fosters managers’ strategic decision making. Lean implementation could help to guarantee firm survival.
Waqar and Sehrish [
26] concluded, based on the collected data from 140 supply chain professionals, that lean and agile strategies have a significant impact on the robust supply chain and the resilient supply chain. As such, companies need to implement the right combination of both supply chain strategies to create a robust and resilient supply chain.
In the article [
27], the authors proposed a multicriteria decision-making framework that combines the self-confidence aggregation approach and the social trust network.
Based on the literature review and industry needs, the authors decided that the objective of this article would be to find the relationship between customer behaviour and the average cost of the product. Excessive storage in the production process is a type of waste that also causes other waste, such that an optimization of the stock quantity in the warehouse and between operations in the production process is necessary, with appropriate measures influencing the rationalization of the production process. It is well known that the cost of overstocking can have a significant impact on the cost (own price) of a product, which can be controlled using an appropriate mathematical model. In extreme cases, the additional cost of inventory can cause the ACP to be higher than the selling price in the market, such that there is a loss. For this reason, we proposed a new method, which is described in the Methodology section.
3. Methodology
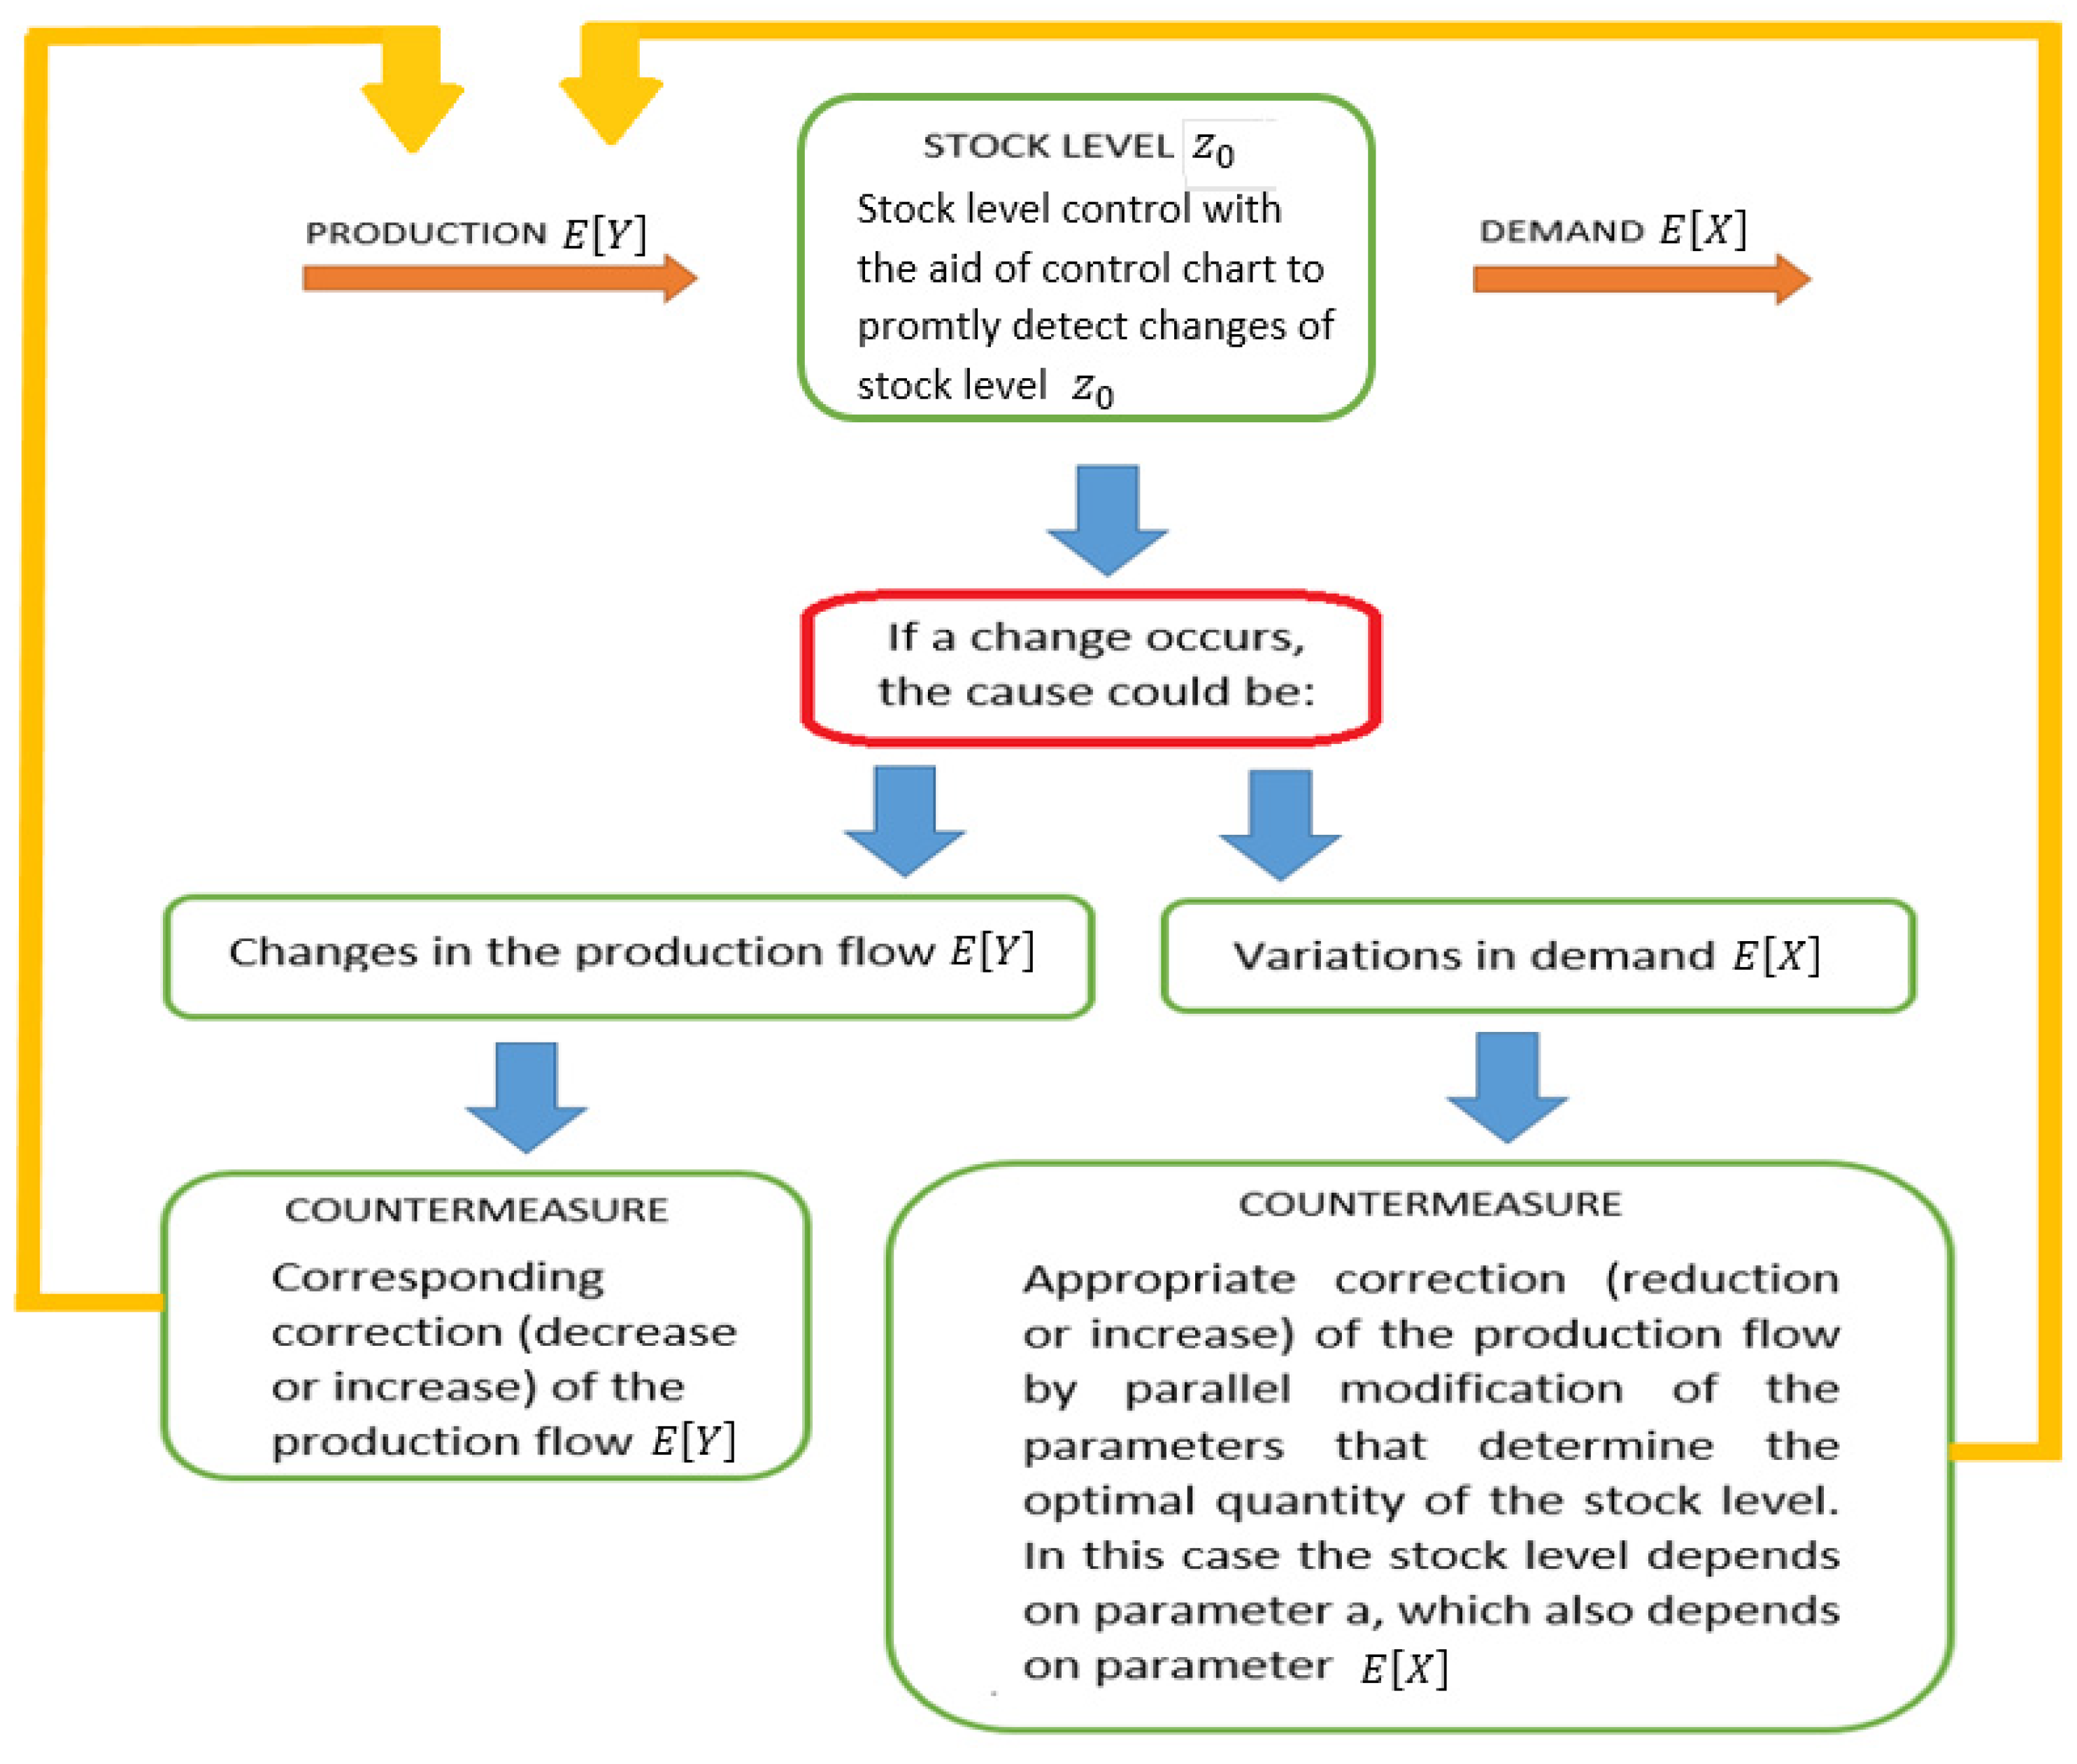
The proposed methodology (
Figure 1) is based on the customer orders and the stock fluctuation in the warehouse regarding the real demand of the consumer.
Figure 1 shows that the detection of a stock level change can be a result of changes in production or fluctuations in customer demand. A correction in production must be made to bring the stock level to an appropriate level. By obtaining data on consumer behaviour that will be useful in monitoring the lean production process, a mathematical model or a probability density function of the demand for a product needs to be created.
The mathematical model will allow us to plan the production process in such a way as to avoid overproduction, which—according to Ohno—is the main waste, as it causes a majority of other waste. This is achieved by including a sales department that can provide us with sales data from past periods and projections of future sales trends. It is desirable that the probability density function of the product demand fX(x) be as close as possible to the actual consumer purchasing behaviour.
For our case, we selected the probability density function of the product demand
.
X is the variable that indicates the level of demand. This function is considered to be a good approximation of the tendency of consumer demand in practice (
Figure 2). The function can be different for some companies, such that the company concerned needs to choose a curve that suits them and use the proposed model through the steps shown. However, in most cases, this proposed curve suits the product demand.
Consumer purchasing behaviour is a random variable denoted by X. The fluctuation of stock in the warehouse of finished products is also a random variable, and is denoted by Z. Y is used to denote the production process as a random variable, but the production process will be defined in the following. This is because it is practically impossible to change the production capacity quickly in the short term.
The fluctuation of stock in the warehouse is shown and marked in
Figure 3, wherein
represents the initial stock level of finished products, and Δ
Z represents the fluctuation of the stock level in the warehouse; it can be defined as the difference between the quantity of products entering and the quantity of products leaving the warehouse.
Δ
Z,
Y and
X are random variables; thus, it can be indicated that the mathematical expectation is
The average value of the stock level change is
, or the value of mathematical expectation equals zero
. If
, then
The average quantity of products entering the warehouse,
, equals the average quantity of products leaving the warehouse,
. The average quantity of product demand,
, cannot be influenced, as this is an external factor; however, we can influence the production process by adjusting the average quantity of manufactured products
that represent the internal organisation of production capacities. Let us assume that the production flow is constant and corresponds to the average quantity of product demand
; it is denoted by
In the ideal case, the product and production demand are constant and equal to
.
In order to immediately respond to a demand, a certain number of products should always be in stock
; this is the initial level of stock. As such, in a certain observed period, the stock level
Z in the warehouse is as follows:
The random variables
Z and
X are interconnected, and if the probability density function of the consumer demand is known, the probability density function of the stock fluctuation in the warehouse can be determined.
Let us determine the upper limit of the function
:
Figure 4 shows the probability density function of the product storage.
The mathematical expectations
and
are defined by integrating the functions
and
:
For a constant production flow
that will equal the theoretical mean value (the mathematical expectation)
,
The parameter
a is determined by equating the theoretical mean value
with the mean value
obtained from real consumer demand data with descriptive statistics.
The determination of the storage costs depending on the stock level is as follows:
g(
z)—the specific cost of the product [EURO/PC],
z—the number of product pieces in the warehouse [pc],
p—the storage cost of a product when it is not in stock [EURO/PC],
h—the storage cost of a product when it is in stock [EURO/PC],
C(
z)—the storage cost [EURO],
z0—the optimum initial stock level [pc],
C[
Oi,j]—the cost of operation
i for product
j [EURO/PC].
Figure 5 shows the storage cost per unit of product
p and
h depending on the stock level in the warehouse.
The cost because the product is not in stock, and additional effort is needed to meet the demand; this costs money.
The mathematical expectation or mean value for the storage cost of the product
E[
C] as a function of
is
The optimum level
of products or semi-products equals
By inserting the values of
p, h and
a into transcendent Equation (21), the optimal
can be calculated using the numerical method. If the obtained
is then inserted into Equation (19), we obtain the optimal cost of the stock (
Figure 6).
The movement of level
can be controlled using a control chart. An example of a control chart can be found in
Figure 7.
Figure 6 shows a control chart
(t), which allows us to monitor the trend of the stock level movement
in time intervals (weeks, months or years).
Finally, according to the previous equations, the optimal average cost of product
ACP equals
QIN—the number of pieces that enter into the operation [
O],
C[
O]—the cost of the operation [
O],
E[
C]—the storage cost of the semi-finished product before entering into the operation,
QOUT—the number of pieces that leave the operation [
O].
The presented mathematical model was tested on a practical example, as shown in the next section.
4. Case Study, Results and Discussion
Using the developed decision-making algorithm, we analysed a case study by taking a closer look at a company that manufactures furniture hardware for the world market, and is a successful and important player in the global market.
We focused on the work operation of assembling (i) the basic hinge (j) (
Figure 8), which is also a critical operation in the production process of said product. The capacity of the assembly system is adequate, namely 68,500 pieces per day, which corresponds to the daily consumer demand, which amounts to an average of
=
E[
X] = 50,000 pcs of the basic hinge daily.
We assumed that all of the fixed and variable costs of the assembly system for making the hinge are covered. This implies the following costs:
The material for the semi-finished products (1, cup; 2, rivet 17; 3, screw; 4, arm; 5, rivet 15; 6, internal link; 7, U-rivet; 8, external link; 9, spring),
depreciation,
work,
direct costs, and
other costs for product assembly.
As such, we obtained the cost of the assembly i for the making of the hinge j 0.10 Euro/pc.
Using transcendent Equation (21), the optimal quantity of stock
for the arm (before entering into the operation of assembly i) was calculated, which amounts to 18,200 pcs daily. Inserting the average value (
) of 50,000 pieces into Equation (12), we find that
a is equal to 0.00004, such that the probability density of demand based on Equation (7) will be
and the storage cost will be
E[
C] = 490.97 Euro/day (Equation (18)), which is clearly evident from
Figure 9. The storage cost for the semi-finished product per piece per day is considered in the model, with
h = 0.01 Euro/(pc/day) when it is in stock, and with
p = 0.03 Euro/(pc/day) when it is not in stock.
We assume that the cost of storing the semi-finished cup, external link and internal link is equal to the storage cost for the arm. This means that the storage cost of the optimal quantity of the arm, cup, external and internal link will be = 4·490.97 Euro/day. Furthermore, it was assumed that the input quantity of the semi-finished products entering the operation is identical to the quantity of products leaving the work operation . For reasons of clarity, the storage costs of rivets 15 and 17, the U-rivet, the spring and the screw were neglected in our calculation.
Based on the data, the
was calculated with Equation (21), for the Basic hinge
j on the work operation assembly (i), which represents the average reference cost.
The calculated cost value represents the reference cost in the production process of the assembly i of product j, provided that the cost of operation assembly includes the optimal cost of ACP from previous operations for products entering the product assembly process.
Let us now look at a practical example in the studied company X.
Figure 10 shows the material value flow for the basic hinge and the stock of the semi-finished products, i.e., the cup, arm, external link and internal link before the assembly operation.
Looking at the material value flow for our case, it can be seen that the stock for all of the four semi-finished products (cup, arm, and inner and outer link) is excessive. Although the consumer’s daily need is an average of 50,000 pieces of the product, and the optimal amount of stock is 18,200 pieces for each semi-finished product, in our case, in the observed unit of time (day), the following stock is as follows: cup, 260,708 pieces; external link, 146,660 pieces; arm, 180,000 pieces; internal link, 123,636 pieces, which is clearly shown by the arrows in
Figure 10.
For the basic hinge, the actual average cost of product
j in operation
i , taking into consideration the actual stocks of the semi-finished products in the observed unit of time (in our case, this is a working day) can now be calculated. The storage cost for the semi-finished product per piece per day is considered with
h = 0.01 Euro/(pc/day). The actual
in the observed unit of time will be:
The average cost of product j in work operation i is 71%, or 0.10 euro per piece, higher than the reference (target) average cost due to the excessive stock of semi-finished products in the observed unit of time. If the storage costs of rivets 15 and 17, the U-rivet, the spring and screw are taken into account too, the actual would be even higher. In this particular case, we are facing overproduction, which is, according to Ohno, the waste that causes the majority of other wastes. This can be a problem for a company.
In order to control the and manage it by applying the lean production tools, control charts of the in the critical working operations of the production process or for the entire production process can be prepared.
An example of a control chart as a function of the time of observation
in our case is shown in
Figure 11.
The control chart (
Figure 11) shows the
control limits. The blue line represents the market price of the product. The target limit represents the goal that the company should pursue by introducing lean business operations, i.e., eliminating waste and thus reducing the cost. The limit represents the allowable cost, leaving us with the projected profit. If we exceed the limit, we move into the range of the selling price, which means a narrowing of the competitive range and thus of the profits. The figure also shows a trend that may be positive (green) (approaching the
target value) or negative (orange), due to waste (in our case, excessive stock), which means that we are approaching the
limit and thus reducing profits as we approach the market price. The black asterisk in
Figure 11 indicates the currently calculated observed
value.
The presented idea, which represents a possible solution to the problem in terms of the cost, competitiveness and efficiency of the production process, arose in a conversation with the managers of an internationally renowned company in the field of furniture hinges. The problem highlighted by the management was related to cost control in the different phases of the production process.
The advantage of the proposed method is that by analyzing the demand, average product cost and inventory movements in the production process, it is possible to measure changes in the process aimed at achieving a lean production process. Measurements using the inventory control chart and the cost control chart can be performed in all of the operations of the production process, or can select only those operations that are most critical. It is important that the interventions in the production process are measurable, which the proposed method allows. The results of the measurements can significantly influence decisions in the direction of the implementation of changes to improve the production process and thus competitiveness, and are also important information for company management.
5. Conclusions
The advantage of the developed decision-making model represented in this paper lies in the fact that, by analysing the consumer purchasing behaviour and monitoring the average cost of the product and the inventory level, the changes in the process can be measured, which are aimed at achieving lean production process. The measurements can be performed on all of the operations of the production process in a company, i.e., on the entire logistics chain starting from the product development, or only the most critical operations can be selected.
As shown for a simple example, the average cost of a product per work operation is 71%, or 0.10 euro per piece, higher than the reference (target) cost due to the excessive stock of semi-finished products in the observed unit of time. As was clearly shown in
Figure 11, the own price can even exceed the market price of our product due to excessive stock, which of course is unacceptable. However, as the example shows, this can happen in practice without the company management being aware of it, as there is no standard tool for the generation of such information.
Therefore, the results of the measurements can have a significant impact on management’s decisions to implement changes to improve the production process, and this is also important information for the company’s management, who must consider changes in the long run. Thus, the development of decision making allows management to prepare actions to reduce costs caused by waste, and then allows them to simulate which actions are optimal due to changing market conditions (customers) and could approach the ACP target value (the own price of the product).
Our further research will focus on the development of a cost analysis model, CASM (cost analysis stream map), which will similarly offer a detailed overview of the entire production process in terms of the demand, the average cost of the product ACP optimal inventory level, and the optimal production process.
The ultimate goal of the research is to develop a simulation module to monitor, analyze, forecast, and control the costs required to optimize lean processes in addition to customer behaviour in Industry 4.0, which could be integrated into ERP or MES companies.
The article can be concluded by stating that the research answered the research question of whether it is possible to find a mathematical connection between changes in the market (at the customer level) and the leanness of the production process, and thus the ACP. The advantage of the model is that it is simple, that it allows the simulation of different scenarios, and that it is useful in an industrial environment. The limitation of the proposed model is that it is possible to analyse only changes in the required quantities for the customer, but it is not possible to analyse changes in the required product quality and the impact of the quality on the leanness of the process. This, however, is a challenge for further research.


