Article

Y(III) Ion Migration in AlF3–(Li,Na)F–Y2O3 Molten Salt

1
School of Materials Science and Engineering, Shenyang University of Technology, Shenyang 110870, China
2
Faculty of material Metallurgical and Chemistry, Jiangxi University of Science and Technology, Ganzhou 341000, China
3
School of Metallurgical Engineering, Northeastern University, Shenyang 110006, China
*
Author to whom correspondence should be addressed.
Appl. Sci. 2022, 12(4), 2200; https://doi.org/10.3390/app12042200
Submission received: 19 December 2021 / Revised: 10 February 2022 / Accepted: 16 February 2022 / Published: 20 February 2022

Abstract

:
In this study, three slots containing an anode chamber, a cathode chamber, and a middle pole chamber were designed by applying the Hittorf method, and a two-way coupling model of the flow field and electric field was established using the COMSOL system. The electric field distribution in the constructed model was simulated, and the model reliability, boundary conditions, and related parameters were verified. A three-chamber tank was utilized to investigate the migration numbers change rule and migration mechanism of Y(III) ions in the AlF3–(Li,Na)F system. The migration number of Y(III) ions in the AlF3–(Li,Na)F–Y2O3 molten salt linearly increased from 0.70 to 0.80 with an increase in temperature from 900 to 1000 °C. When the (Li,Na)F/AlF3 molar ratio was between 2.0 and 2.5, the migration number of Y(III) ions was relatively constant, and its average value was approximately 0.75. Meanwhile, at (Li,Na)F/AlF3 molar ratios higher than 2.5, the migration number of Y(III) ions linearly decreased from 0.75 to 0.45. Finally, in the current density range of 1.0–2.0 A/cm2, the migration number of Y(III) ions increased almost linearly from 0.65 to 0.85.

1. Introduction

Owing to significant progress made in the field of rare earth metals and alloys prepared by molten salt electrolysis in China, this technology has been successfully applied for the production of rare earth aluminum alloys [1,2,3]. Al–Cu alloys exhibit high strength, heat resistance, and processability; however, the low corrosion resistance of these materials considerably limits their practical applications [4]. Recent research studies [5,6] have shown that adding an appropriate amount of rare earth element Y not only improves the high-temperature properties, strength, and conductivity of Al–Cu alloys but also increases the corrosion resistance and acid corrosion resistance of their surfaces. Therefore, the development of Al–Cu–Y alloys with advanced properties is of high practical significance. Previously, the authors of this article prepared an Al–Cu–Y alloy on a consumable copper cathode in the AlF3–(Li,Na)F fluoride salt system using Al2O3 and Y2O3 as the raw materials [7]. To further study the migration and transformation of rare earth Y2O3 species, it is necessary to examine the electrical transport properties of Y(III) ions in the AlF3–(Li,Na)F salt system. The ion migration number denotes the ratio of the number of migrating ions to the total number of ions in solution. The conductivity of an electrolyte solution strongly depends on the directional migration of ions; therefore, the ion migration number is an important parameter for measuring the ionic conductivity of an electrolyte [8]. Consequently, studying the variation of the migration number of Y(III) ions in the AlF3–NaF–LiF molten salt is important for controlling the Y content during the Al–Cu–Y alloy electrolysis process [9,10]. Common methods for determining the ion migration number include the Hittorf method [11], interfacial movement method [12], and electromotive force method [13]. Among these techniques, the Hittorf method, which calculates the migration number from the concentration change near the electrode surface caused by the current passing through the electrolyte, is most suitable for estimating the migration number of molten salt ions and has been adopted by many researchers [14,15,16]. In this study, three slots consisting of an anode chamber, a cathode chamber, and a middle pole chamber were designed by applying the Hittorf method to measure the variation in the migration number of anions and cations. In addition, the migration mechanism of Y(III) ions in the AlF3–(Li,Na)F system was elucidated.

2. Materials and Methods

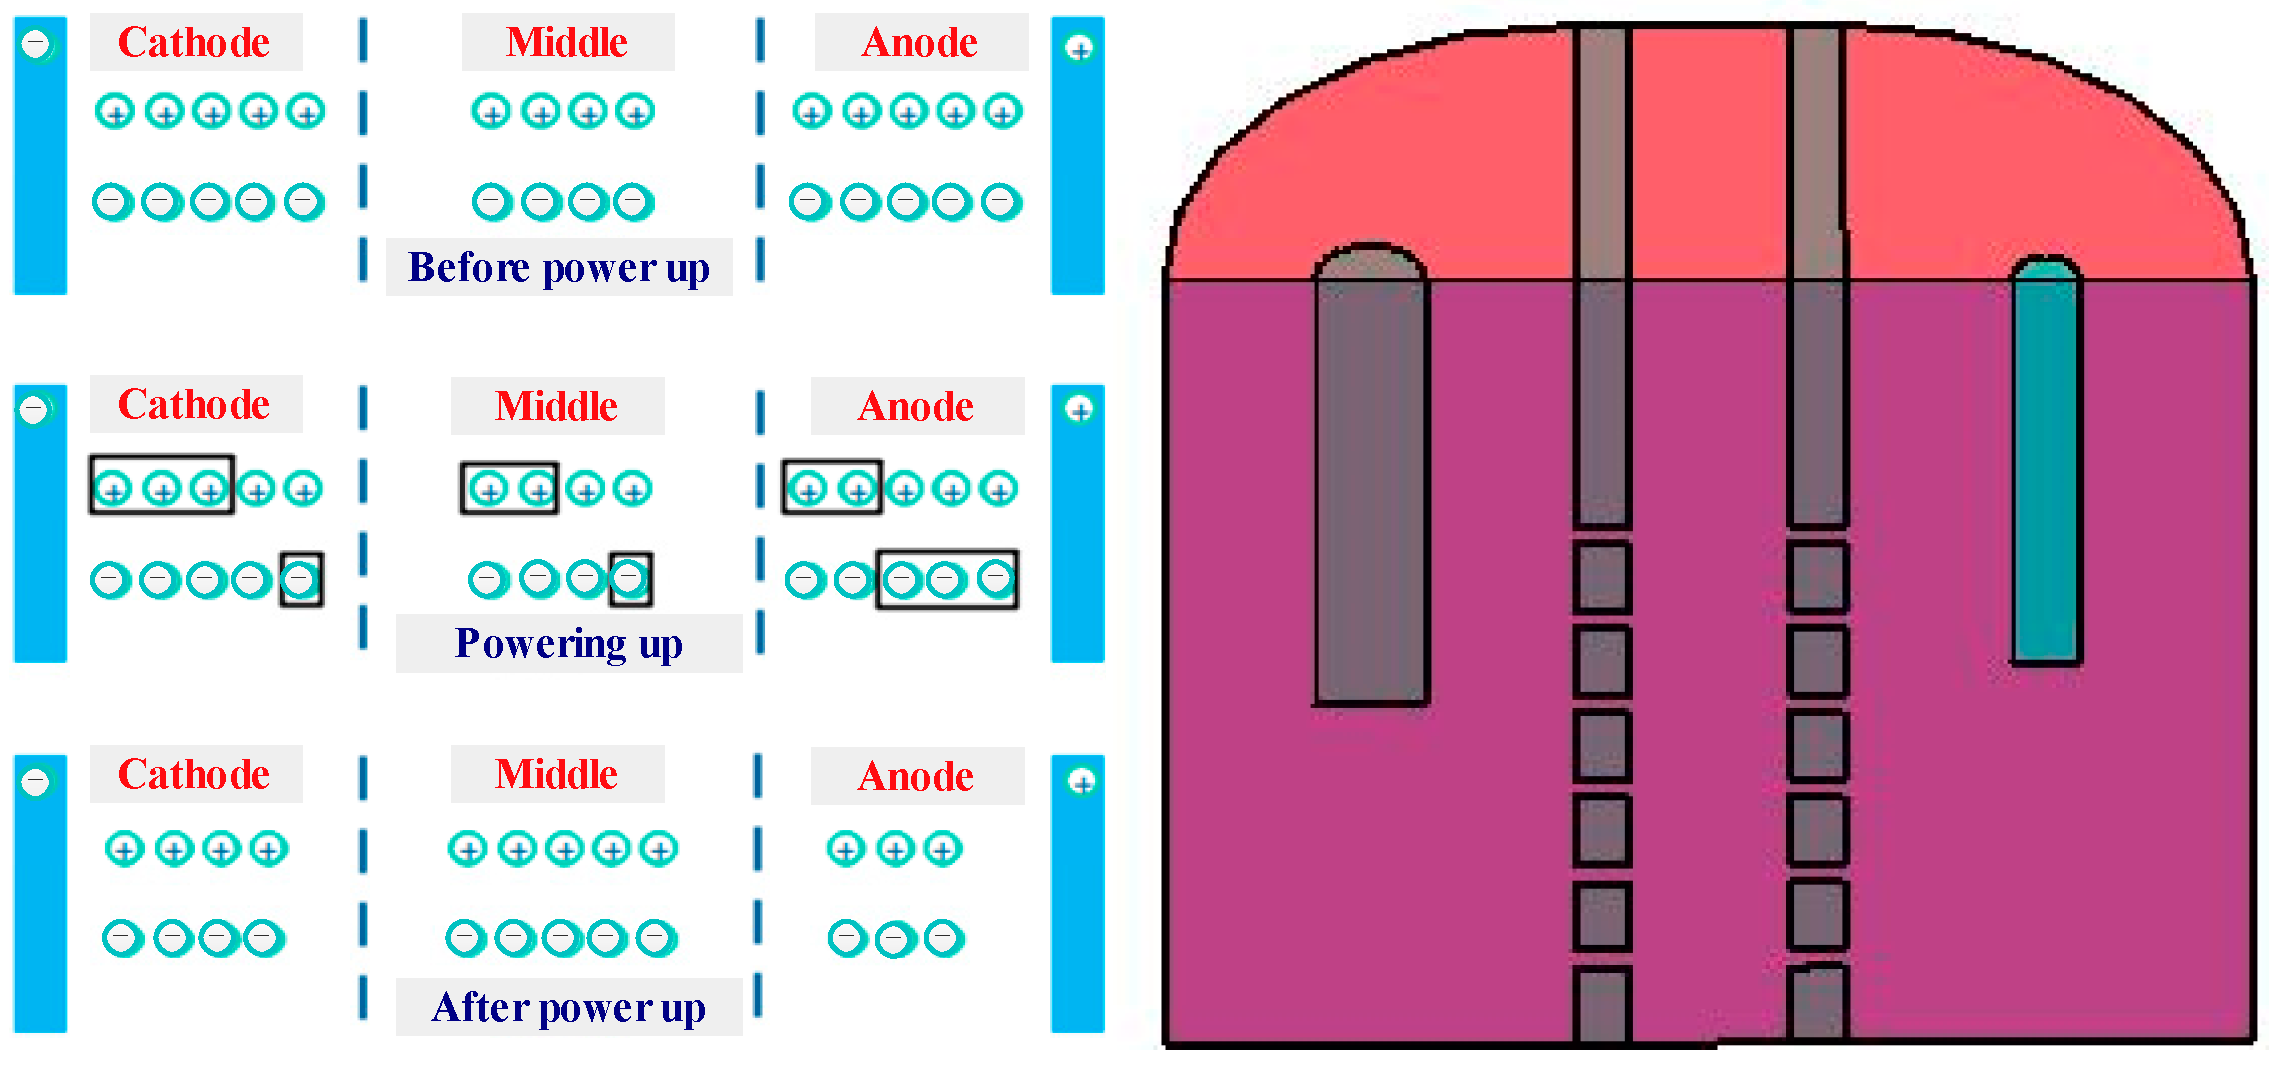
2.1. Measuring Principle

According to the definition of an ion migration number, the Y(III) ion migration number (tY) is the ratio of the current it carries to the total current. Therefore, the quantity of the Y (III) ion migration material nMigrate,Y and the total electric quantity neq passing through the electrode are measured respectively. The migration number of the Y(III) ion can be calculated by tY = Z nMigrate,Y/neq. Because Y(III) ion is +3 valence, here, Z = 3.
In this study, the Hittorf method was employed to determine the Y(III) ion migration number by calculating the number of cations that migrate out of the anode region or the number of anions that migrate out of the cathode region, the quantity of materials undergoing electrode reactions, and the current generated in the electrolyte near the electrode using Equation (1). For this purpose, a three-chamber tank containing an anode chamber, a cathode chamber, and a middle electrode chamber (Figure 1) was designed to study the variation in the migration number of anions and cations [17].
nAfter,Y = nBefore,Y ± nPowering,Y ± nMigrate,Y
In this formula, nAfter,Y is the number of Y(III) ions after the reaction; nBefore,Y is the number of Y(III) ions before the reaction; nPowering,Y is the increase in the number of Y(III) ions due to the electrode reaction or the amount of the reduced compound (here, “+” denotes increase, “−” denotes decrease, and 0 represents non-reaction); nMigrate,Y is the number of migrated Y(III) ions (“+” denotes “moving in” and “−” designates “moving out”).
During the electrolysis process, an oxidation reaction occurs in the anode area, which produces Y(III) positive ions and leads to a positive nPowering,Y term. When these ions move out of the anode area, the nMigrate,Y term has a negative sign. Meanwhile, a reduction reaction occurs in the cathode area, which decreases the number of Y(III) positive ions, leading to a negative nPowering,Y term. When Y(III) ions enter the cathode area, the nMigrate,Y term becomes positive.

2.2. Experimental Method

The ion migration number of Y(III) ions in the AlF3–(Li,Na)F system was measured at current densities of 1–2 A/cm2, (Na,Li)F/AlF3 molar ratios of 2.0–3.0, and temperatures of 900–1000 °C.
Analytically pure AlF3, NaF, LiF, and Y2O3 compounds were dried at 150 °C for 48 h. The electrolyte was added to the three-chamber electrolytic cell and sealed to reduce volatilization, and the temperature was controlled by an electric furnace under the protection of high-purity nitrogen. After reaching a predetermined melting temperature, the electrolyte was thoroughly stirred and allowed to stand for 5 min. A tungsten rod was used as the cathode, and graphite was employed as the anode. The electrolysis was performed under the condition of constant current I, which was controlled by a DC-regulated power supply (Statron 16V/32a, Germany). After completing the electrolysis for a certain time t, the total electromigration neq of the electrolysis process was determined through neq = It.
Supernatants were collected from the negative and positive electrode cells. The cooled supernatant solid sample was dissolved by a nitric acid solution (10 mol/L) and the Y content (mass fraction) in the sample was measured by an inductive coupled plasma emission spectrometer (ICP, IRIS intrepid II, Waltham MA USA).

3. Results and Discussion

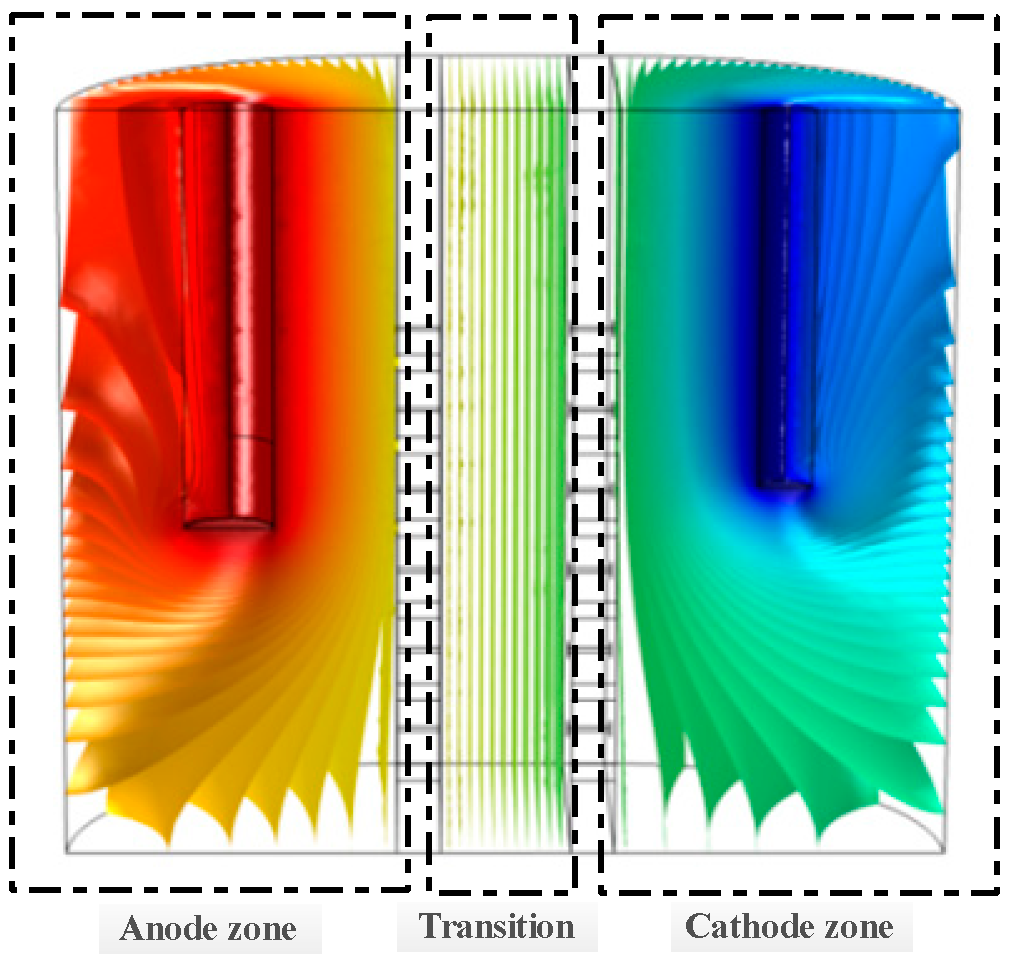
3.1. Simulation Analysis of the Migration Tank

Before measuring the ion migration number, the electric field distribution in the electromigration cell must be simulated to evaluate cell reliability. Considering the experimental tank as a prototype, a two-way coupling model of the flow field and electric field was established using the COMSOL system. An internal electric field distribution was obtained, and the model reliability, boundary conditions, and related parameters were determined.

3.1.1. Model Construction

(1)
Physical Model of the Electromigration Tank [18,19]
All currents flowed through the anode and cathode. The influence of the voltage drop of the cathode on the electric field was ignored. The anode was uniformly consumed in the height direction, and the amount of liquid cathode was uniformly increased. The electrolytic cell was symmetrical, and one half of it was used as the research object. The diameters of the cathode and anode were 25 mm; the insertion depths of the cathode and anode were 12 mm; the depth of the molten pool was 30 mm.
The process conditions included (1) a working current of 2 A, electrolysis temperature of 1035 °C, AlF3–AlF3–LiF–Y2O3 electrolysis system, molten salt density of 6.20 g/cm3, molten salt viscosity of 0.020 Pa•S, surface tension of 0.28 N/m, and conductivity of 2.30 S/cm.
Unstructured mesh was used to densify the chemical reaction boundary and contact area, mainly including the contact surface between graphite anode and electrolyte, the contact surface between tungsten cathode and electrolyte, and the top of tungsten cathode. The grid parameters are as follows:
The number of vertex units is 20, the number of side elements is 1600, and the number of boundary elements is 112586.
Special encryption location (maximum unit is 0.003 m and minimum unit is 1.5) × 10−5 m, the maximum unit growth rate is 1.1, the curvature factor is 0.2, and narrow area resolution (0.6).
Location of ordinary grid (maximum unit is 0.016 m and minimum unit is 7) × 10−4 m, the maximum unit growth rate is 1.1, the curvature factor is 0.3, and narrow area (resolution 0.90).
(2)
Preset Conditions [20]
The driving force of the electrolyte flow was the buoyancy of bubbles; the interaction force between different bubbles was ignored, and the bubble size was uniform. The electrolytic cell had no leakage. The current flowed from the anode to the cathode, and the electrolyte was an incompressible fluid with a uniform temperature. The anode surface generated the bubbles at a gas production rate of 0.21 m3/(s•m2). The electrolyte surface was in contact with the atmosphere, and the graphite crucible had no-slip walls.
(3)
Control Equations [21,22,23]
Equation (1), continuity equation:
ρ t + ( ρ u x ) x + ( ρ u y ) y = 0
where ux is the velocity component in the X direction, m•s1; uy is the velocity component in the Y direction, m•s1; t is the time, s.
Equation (2), momentum equations:
ρ u x t + ( ρ u x u ) = ρ x + τ x x x + τ x y y + ρ f x
ρ u y t + ( ρ u y u ) = ρ y + τ x x x + τ y y y + ρ f y
where ux is the velocity component in the X direction, uy is the velocity component in the Y direction, m•s1; t is the time, s; ρ is the density, kg•m3; fx, and fy are the X- and Y-directional mass forces, respectively, m•s2; τxx and τyy are the components of the viscous stress generated on the surface of an infinitesimal body, Pa.
Equation (3), kε turbulent double equation:
k equation:
( ρ k ) t + ( ρ k u i ) x i = x j [ ( μ + μ t σ k ) k x j ] + G k + G b ρ ε Y M + S K
ε equation:
( ρ ε ) t + ( ρ ε u i ) x i = x j [ ( μ + μ t σ ε ) ε x j ] + G 1 ε ε k ( G K + C 3 e G b ) C 2 ε ρ ε 2 k + S ε
where C1ε = 1.44, C2ε = 1.92, and C3ε = 0.09; GK is the stress source term due to velocity; σk is the Prandtl number of the turbulent kinetic energy k, 1.0; σε is the Prandtl number corresponding to the dissipation rate, 1.3; μt is the turbulent nest viscosity coefficient; Gb is the turbulent kinetic energy k produced by the influence of buoyancy; Sε is the user-defined heat source term; YM is the diffusion term of the compressible turbulent pulsation.
Equation (4), electric field equations (Laplace equations):
x 2 A x 2 + y 2 A y 2 + z 2 A z 2 = 0
Σ A = Σ I R
( σ φ ) = 0
J = σ φ
Q = J J σ
σ = σ 1 ( 1 ε ) 1.5
where A is the scalar unit, V; φ is the potential, V; J is the current density, A/m2; σ is the mixed phase conductivity, S/m; σ1 is the liquid phase conductivity, S/m; Q is the thermal energy rate.

3.1.2. Simulation Results and Their Analysis

According to the obtained simulation data (Figure 2), the electric field in the measuring cell can be separated into three areas: a cathode area (tungsten rod, blue region), an anode area (carbon rod, red region), and a transition area. The potentials of the cathode tungsten rod and anode carbon rod remain unchanged, making the cell an equipotential body. Under the action of the flow field in the electrolytic cell, the latter can be divided into three complete areas owing to the isolation effect of the baffle in the middle zone.
Assuming uniform electrolyte conductivity in the electrolytic cell, the electric potential in the cell is evenly distributed, and the equipotential line between the anode and the anode is perpendicular to the ground. However, owing to the effect of flow field, the conductivity of the molten pool in the tank varies slightly. Therefore, the electric field and current distribution change on both sides of the electrode. The potentials of the cathode and anode near the intermediate transition isolation zone are stable, and there is a linear gradient along the vertical direction of the electrode. The intermediate transition zone exhibits a high gradient, which satisfies the requirements for determining the electromigration number.
During the electromigration process, a dynamic gas layer is formed on the anode surface, and the gas layer becomes thicker as the height of the anode increases. The conductivity of the electrolyte near the anode is affected by the gas layer and increases with increasing gas content [24,25]. After coupling the electric field with the flow field, the flow field gradient between the surface of the molten salt and the inside of the molten pool decreases due to the floating and stirring of gas molecules.
In addition, the tiny area at the bottom of the anode, because of weak electric field intensity and low current density at the anode bottom before coupling, becomes a stagnant area with a low flow field gradient. Owing to the electric field coupling effect and gas generation, the electric field distribution at the bottom of the tank is uniform, and the field intensity gradient and current density increase; as a result, the flow field gradient at the anode bottom increases more than the electrostatic field. Because of the presence of the electric field between the anode and the cathode, the rate of the gas generation on the anode surface depends only on the current density; therefore, the electric field produces a negligible effect on the flow field. The main reason for the observed high flow field intensity on the anode surface is the strengthening of the adsorption–desorption effect in this region caused by gas generation. Owing to the low gas density, the rising process causes a strong convective movement, which accelerates the fluid movement. Due to the stable electric field at the bottom of the electrolytic cell, there is no large electrode polarization; therefore, the relative velocity of the melt in this area is small, and the convection effect is weak.

3.2. Influence of Temperature on the Migration Number of Y(III) Ions

In this section, the AlF3–(Li,Na)F–3wt.%Y2O3 molten salt system with a (Li,Na)F/AlF3 molar ratio of 2.5 is examined at a current of 3 A; cathode current density of 1.60 A/cm2; electrolysis time of 1 h; and temperatures of 900, 920, 960, 980, and 1000 °C. The relationship between the electrolysis temperature and the active Y(III) ion mobility is displayed in Figure 3. In the temperature range of 900–1000 °C, the migration number of Y(III) ions increases with temperature from 0.70 to 0.80 almost linearly (Equation (13)). The results show that with an increase in temperature, the migration rate (mass transfer rate) of Y(III) ions dissolved in AlF3-(Li,Na)F molten salt system will increase, and the electroreduction reaction of Y(III) ions at the cathode will become faster and easier, which leads to the increase of the number of Y(III) ions in the system.
NMigrate = −0.183 + 9.81 × 10⁻⁴T

3.3. Influence of the (Li,Na)F/AlF3 Molar Ratio on the Migration Number of Y(III) Ions

In this section, AlF3–(Li,Na)F–3wt.%Y2O3 molten salt is studied at a temperature of 950 °C, current of 2 A, cathode current density of 1.25 A/cm2, electrolysis time of 1 h, and (Li,Na)F/AlF3 molar ratios of 2.0–3.0. The active Y(III) ion mobility is plotted as a function of the (Li,Na)F/AlF3 molar ratio in Figure 4. When the (Li,Na)F/AlF3 molar ratio varies between 2.0 and 2.5, the migration number of Y(III) ions is relatively stable, and its average value is equal to approximately 0.75. When the (Li,Na)F/AlF3 molar ratio exceeds 2.5, the migration number of Y(III) ions decreases from 0.75 to 0.45, suggesting that the ion composition of the studied system is strongly affected by the (Li,Na)F/AlF3 molar ratio. The compositions of anions and cations in the system are mainly determined by Equations (14) and (15). When the (Li,Na)F/AlF3 molar ratio increases, reaction (14) shifts to the right, and the (Li,Na)3AlF6 content increases. Meanwhile, the number of AlF 6 3 ions in the system increases, and reaction (15) shifts to the right, increasing the number of free fluoride ions. (When the molar ratio of system (Li,Na)F/AlF3 is lower than 2.5, with an increase in the system (Li,Na)F ratio, the free fluorine ions in the system mainly fluorinate with Y2O3 in the system, the number of active Y(III) ions in the system increases, and the share of conductivity increases. At the same time, the number of Li+, Na+, and F ions in the system also increases, and the share of conductivity also increases. The comprehensive effect is that the electric transfer number of Y(III) ions does not change significantly. When the molar ratio of system (Li,Na)F/AlF3 is higher than 2.5, with a further increase in the system (Li,Na)F ratio, the number of active Y(III) ions in the system reaches saturation; Li+, Na+, and F ions in the system become the main carrier of current; the proportion of active Y(III) ions participating in conductivity decreases; and the number of electric transfer decreases approximately linearly.
The obtained experimental data also show that when the (Li,Na)F/AlF3 ratio exceeds 2.5, the mobility number of Y(III) ion decreases sharply.
AlF3 + 3(Li,Na)F → (Li,Na)3AlF6
AlF63− → AlF4 + 2F

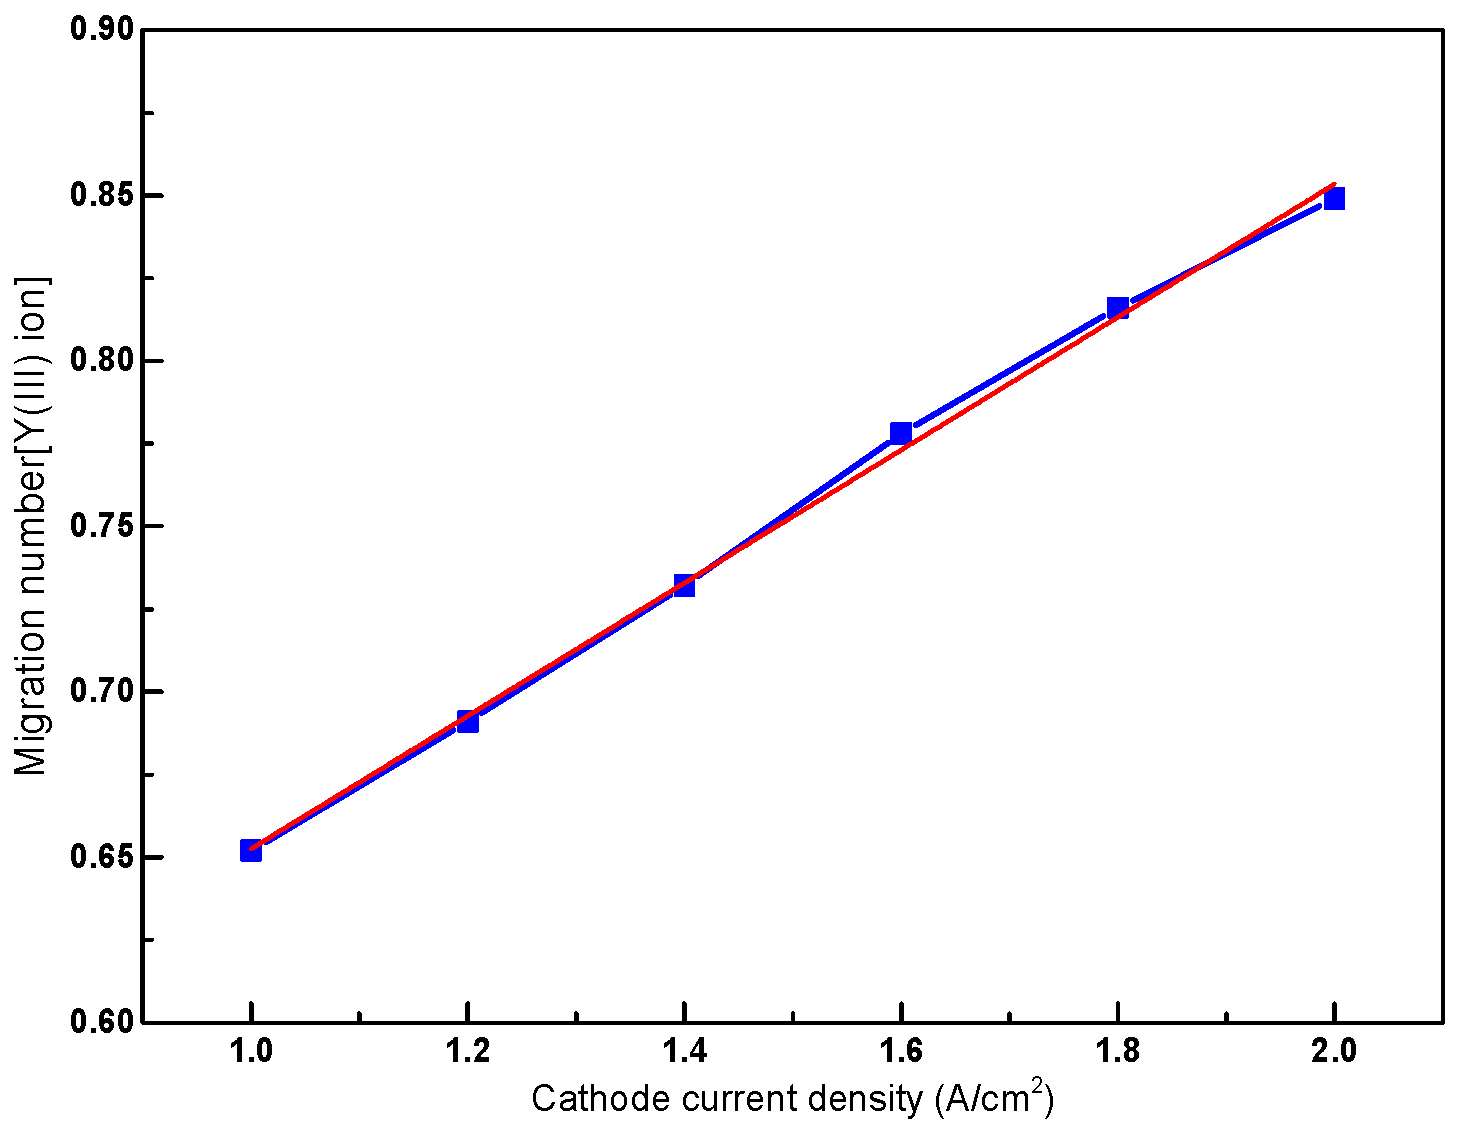
3.4. Influence of Current Density on the Migration Number of Y(III) Ions

In this section, AlF3–(Li,Na)F–3wt.%Y2O3 molten salt is studied at a temperature of 950 °C, electrolysis time of 1 h, and current densities of 1.0–2.0 A/cm2. The relationship between the current density and the ion migration number is displayed in Figure 5. In the current density range of 1.0–2.0 A/cm2, the migration number of Y(III) ions increases from 0.65 to 0.85 almost linearly (Equation (16)). As the current density increases, the cathode potential, electrochemical reaction rate, polarization intensity of active complexed Y(III) ions, current-carrying capacity, and ion migration rate increase. Furthermore, the higher diffusion rate of Y(III) ions and number of compounds participating in the electrode reaction also increase the migration number of Y(III) ions.
NMigrate = 0.452 + 0.2T
The obtained data are fitted using the least squares method, and the linear relationships between the Y(III) ion migration number and temperature, (Li,Na)F/AlF3 molar ratio, and current density are represented by Equations (17) and (18).
n = 0.572 + 1.05 × 10⁻⁴T + 0.13I
n = 0.852 + 1.12 × 10⁻⁴T − 0.22M + 1.15I
where n is the migration number of Y(III) ions; T is the temperature, 900–1000 °C; M is the (Li,Na)F/AlF3 molar ratio, 2.0–3.0; I is the cathode current density, 1.0–2.0 A/cm2.

4. Conclusions

(1) Based on Hittorf’s principle of measuring the ion migration number, a three-chamber cell is constructed in this study. Using the COMSO software, a flow field and electric field two-way coupling model is established to simulate electric field distributions in the anode, cathode, and middle electrode chambers. Under the action of the flow field in the electrolytic cell, the latter can be divided into three areas owing to the isolation effect of the baffle in the middle zone. The tank body consists of a well-defined cathode area, an anode area, and a transition area. The potentials of the cathode W rod and anode carbon rod remain unchanged, and the cell is considered to be an equipotential body. The electric field and current distributions vary on both electrode sides. The cathode and anode potentials near the intermediate transition isolation zone are stable, and there is a linear gradient along the vertical direction of the electrode. The intermediate transition zone exhibits a relatively high gradient, which satisfies the measurement requirements for the electromigration number.
(2) In the AlF3–(Li,Na)F–Y2O3 molten salt system, the migration number of Y(III) ions increases from 0.70 to 0.8 with an increase in temperature from 900 to 1000 °C, which represents an almost linear relationship. When the (Li,Na)F/AlF3 molar ratio varies from 2.0 to 2.5, the migration number of Y(III) ions is relatively stable and equal to approximately 0.75. However, when the (Li,Na)F/AlF3 molar ratio exceeds 2.5, the migration number of Y(III) ions decreases linearly from 0.75 to 0.45. In the current density range of 1.0–2.0 A/cm2, the migration number of Y(III) ions increases from 0.65 to 0.85 almost linearly.
(3) For AlF3–(Li,Na)F–Y2O3 molten salt, the linear relationships between the Y(III) ion migration number and temperature, (Li,Na)F/AlF3 molar ratio, and current density can be expressed by two different formulas: At (Li,Na)F/AlF3 molar ratios of 2.1–2.5, n = 0.572 + 1.05 × 10⁻⁴T + 0.13I; however, when the (Li,Na)F/AlF3 molar ratio exceeds 2.5, n = 0.852 + 1.12 × 10⁻⁴T − 0.22M + 1.15I.

Author Contributions

Conceptualization, X.W. and Y.Z.; methodology, X.W.; formal analysis, X.W. and T.H.; investigation, X.W. and T.H.; data curation, T.H.; writing—original draft preparation, T.H.; writing—review and editing, T.H.; supervision, Y.C.; project administration, X.W. All authors have read and agreed to the published version of the manuscript.

Funding

This work was financially supported by the National Natural Science Foundation of China (No.51864018 and No.52074134) and the project of Jiangxi Provincial Department of Education (No. GJJ150666).

Institutional Review Board Statement

Not applicable.

Informed Consent Statement

Not applicable.

Data Availability Statement

Not applicable.

Acknowledgments

This work was financially supported by the National Natural Science Foundation of China (No. 51864018 and No.52074134) and the project of Jiangxi Provincial Department of Education (No. GJJ150666).

Conflicts of Interest

The authors declare no conflict of interest.

References

  1. Pang, S.; Yan, S.; Li, Z.; Chen, D.; Xu, L.; Zhao, B. Development on Molten Salt Electrolytic Methods and Technology for Preparing Rare Earth Metals and Alloys in China. Rare Met. 2011, 35, 440–450. [Google Scholar]
  2. Guo, T.; Wang, S.; Ye, X.; Li, Q.; Liu, H.; Guo, M.; Wu, Z. Research Progress in Preparation of Rare Earth Alloys by Molten Salt Electrolysis. Sci. Sin. Chim. 2012, 42, 1328–1336. [Google Scholar]
  3. Wang, X.-S.; Wang, Z.-Q.; Chen, D.-H.; Pang, S.-M.; Xu, L.-H.; Li, Z.-A.; Yan, S.-H. Development and Status quo of Rare Earth Metals Preparation Technologies. Chin. Rare Earths 2015, 36, 123–132. [Google Scholar]
  4. Lu, Y.; Yuan, L.; Li, W.; Jin, Y. Corrosion resistance of Cu14%Al-X aibronze alloy in 3.5% NaCl solution. J. Mech. Eng. 2005, 41, 42–45. [Google Scholar] [CrossRef]
  5. Cao, D.; Shi, Z.; Yang, S. Effects of Rare Earth on Aluminium and Its Alloys. Chin. Rare Earths 2006, 27, 88–93. [Google Scholar]
  6. Wang, H.; An, Y.; Li, C.; Chao, B. The Research Progress of Rare Earth Application in Aluminum and Aluminum Alloys. Chin. Rare Earths 2012, 33, 74–78. [Google Scholar]
  7. Xu, W.; Chunfa, L.; Jiao, Y.; Tang, H. Cathodic reduction process of Al-Cu-Y alloy in fluoride-oxide eutectic system via molten salt electrolysis. J. Rare Earths 2018, 36, 324–330. [Google Scholar]
  8. Gheribi, A.E.; Machado, K.; Zanghi, D.; Bessada, C.; Salanne, M.; Chartrand, P. On the determination of ion transport numbers in molten salts using molecular dynamics. Electrochim. Acta 2018, 274, 266–273. [Google Scholar] [CrossRef]
  9. Lv, X.; Xu, Z.; Li, J.; Chen, J.; Liu, Q. Molecular dynamics investigation on structural and transport properties of Na3AlF6–Al2O3 molten salt. J. Mol. Liq. 2016, 221, 26–32. [Google Scholar] [CrossRef]
  10. Feng, N.; Kvande, H. Calculation of molar volume, equivalent conductance and migration number of sodium fluoride-aluminum fluoride melt. Non-Ferr. Met. 1988, 40, 60–64. [Google Scholar]
  11. Vink, H. A new modified Hittorf method for the determination of transport numbers in polyelectrolyte solutions. J. Chem. Soc. Faraday Trans. 1984, 80, 1297–1304. [Google Scholar] [CrossRef]
  12. Li, X.; Ding, H.H.; Li, G.H.; Wang, Y.; Fang, Z.M.; Yang, S.F.; Ju, H.X.; Zhu, J.F. In situ investigations of interfacial degradation and ion migration at CH3-NH3-PbI3 perovskite/Ag interface. Chin. J. Chem. Phys. 2019, 32, 299–305. [Google Scholar] [CrossRef] [Green Version]
  13. Ottoy, M.; Forland, F.; Ratkje, S.K.; Moller-Holst, S. Membrane transference numbers from a new emf method. J. Membr. Sci. 1992, 74, 1–8. [Google Scholar] [CrossRef]
  14. Kontturi, K.; Mafé, S.; Manzanares, J.A.; Pellicer, J.; Vuoristo, M. A new method for determining transport numbers of charged membranes from convective diffusion experiments. J. Electroanal. Chem. 1994, 378, 111–116. [Google Scholar] [CrossRef]
  15. Zugmann, S.; Fleischmann, M.; Amereller, M.; Gschwind, R.M.; Wiemhofer, H.D.; Gores, H.J. Measurement of transference numbers for lithium ion electrolytes via four different methods, a comparative study. Electrochim. Acta 2011, 56, 3926–3933. [Google Scholar] [CrossRef]
  16. Macinnes, D.A.; Dole, M. The transference numbers of potassium chloride. New determinations by the hittorf method and comparison with results obtained by the moving boundary method. J. Am. Chem. Soc. 2002, 53, 1357–1364. [Google Scholar] [CrossRef]
  17. Yang, J.; Zhu, J.; Gao, W.; Chun, Y. Influence of the Shape of Transfer Tube on Determining Ion Transference Number by Hittorf Method. Univ. Chem. 2017, 32, 45–50. [Google Scholar] [CrossRef]
  18. Nie, J.; Chen, Y. Numerical modeling of three-dimensional two-phase gas–liquid flow in the flow field plate of a PEM electrolysis cell. Int. J. Hydrog. Energy 2010, 35, 3183–3197. [Google Scholar] [CrossRef]
  19. Xu, Y.; Li, J.; Yin, C.; Yang, S.; Zhang, H.; Lu, X. Method of strongly coupled modeling and computing for thermal-electrical field in aluminium reduction cells. Chin. J. Nonferrous Met. 2014, 24, 239–245. [Google Scholar]
  20. Liu, Z.; Li, Z.; Zhang, X.; Pang, S.; Chen, D.; Wang, Z. Numerical simulation of flow field in rare earth electrolysis cell. Chin. J. Nonferrous Met. 2015, 11, 3209–3215. [Google Scholar]
  21. Zhou, N.J.; Mei, C.; Jiang, C.; Zhou, P. Coupled computation method of physics fields in aluminium reduction cells. Trans. Nonferrous Met. Soc. China 2013, 13, 431–437. [Google Scholar]
  22. Peipei, S.; Qianqian, S.; Yang, Z.; Zeng, G.; Xu, H.; Li, X.; Xiong, W. Numerical simulation and exploration of electrocoagulation process for arsenic and antimony removal: Electric field, flow field, and mass transfer studies. J. Environ. Manage. 2018, 228, 336–345. [Google Scholar]
  23. Wu, Y.; Ju, Y.; Liu, Z.; Hu, Y.; Han, W. Numerical Simulation of Flow Field-electric Field Coupling in Rare Earth Electrolytic Cell. Chin. Rare Earths 2015, 36, 76–80. [Google Scholar]
  24. Liu, Q.; Tang, W.; Wang, L. Numerical Simulation of Anode Bubble Behavior in Rare Earth Electrolysis Cell. J. Chin. Soc. Rare Earths 2015, 33, 737–746. [Google Scholar]
  25. Zoric, J.; Solheim, A. On gas bubbles in industrial aluminium cells with prebaked anodes and their influence on the current distribution. J. Appl. Electro-Chem. 2000, 30, 787–794. [Google Scholar] [CrossRef]
Figure 1. Measuring principle and experimental setup for the determination of the Y(III) ion mobility number.
Applsci 12 02200 g001
Figure 2. Potential distribution diagram of the three-electrode area.
Applsci 12 02200 g002
Figure 3. Variation of the Y(III) ion migration number with temperature.
Applsci 12 02200 g003
Figure 4. Variation of the ion mobility number with the (Li,Na)F/AlF3 molar ratio.
Applsci 12 02200 g004
Figure 5. Relationship between the cathode current density and the Y(III) ion mobility.
Applsci 12 02200 g005
Publisher’s Note: MDPI stays neutral with regard to jurisdictional claims in published maps and institutional affiliations.

