Article

Sous Vide Cooking Effects on Physicochemical, Microbiological and Sensory Characteristics of Pork Loin

by
Lidia Kurp
1,*,
Marzena Danowska-Oziewicz
1,* and
Lucyna Kłębukowska
2
1
Department of Human Nutrition, Faculty of Food Science, University of Warmia and Mazury in Olsztyn, 10-718 Olsztyn, Poland
2
Department of Industrial and Food Microbiology, Faculty of Food Science, University of Warmia and Mazury in Olsztyn, 10-718 Olsztyn, Poland
*
Authors to whom correspondence should be addressed.
Appl. Sci. 2022, 12(5), 2365; https://doi.org/10.3390/app12052365
Submission received: 12 January 2022 / Revised: 19 February 2022 / Accepted: 22 February 2022 / Published: 24 February 2022

Abstract

:
Pork loin slices were sous vide cooked at 60 °C and 65 °C for 2 h, 3 h and 4 h, and at 70 °C and 75 °C for 1 h, 1.5 h and 2 h. The cooking loss of the meat samples significantly increased with the temperature and time of heat treatment, but no correlation between cooking loss and moisture content in the samples was noted. All samples showed similar pH and water activity values. Regarding colour parameters, only yellowness showed significant differences between the samples and was affected by the temperature and time of cooking. Texture profile analysis revealed the lowest hardness of the samples cooked at 60 °C. Sensory analysis showed that cooking at 60 or 65 °C for 4 h ensured the most acceptable sensory features of the investigated samples, and tenderness and juiciness influenced the overall acceptability in the highest degree. All samples were microbiologically safe for consumption.

Graphical Abstract

1. Introduction

Sous vide cooking was adopted as a heat treatment technique in catering industries in the 1970s, and since that time, with increasing access to less expensive cooking equipment, it is gaining popularity in industrial food processing, gastronomy and home cooking [1,2,3]. This technique involves vacuum packaging a food item, cooking it in a water bath or a steam chamber at a relatively low temperature for a relatively long time, and finally rapid cooling, for example in an ice-water bath [4] or a blast chiller. The main feature of this technique is precise cooking temperature control which leads to reproducible culinary procedures and together with vacuum packaging facilitates the handling of ready-to-eat foods [3,5,6]. Sous vide cooking preserves nutritive compounds in food products and ensures their adequate texture, juiciness and flavour, the former due to the mild conditions of cooking and therefore limited changes in food components and the latter due to mild changes in protein structures and keeping moisture and volatile compounds within bags [7]. In addition, sous vide processing inhibits oxidative changes in products as a result of the lack of oxygen in bags [1,3,8] and allows food preparation that is microbiologically safe and prevented from cross contamination after cooking [8,9].
The advantage of sous vide cooked meat is its appealing texture and colour [10], while its flavour intensity is described as low [11]. The relatively low temperatures used in sous vide cooking were reported to positively affect the tenderness and juiciness of meat. Nevertheless, it was observed that particularly long cooking times resulted in more tender but less juicy meat [11]. The myofibrillar proteins begin to denature at 35–40 °C, causing shrinkage of muscle fibres, and this process continues to 80 °C [12]. The extent of myofibrillar protein coagulation influences the final texture of cooked meat as the shrinking of these proteins leads to an increase in meat toughness [3]. Collagen, a main protein of the connective tissue, requires long cooking and a temperature of at least 55 °C to hydrolyze, which leads to reduction in interfibre adhesion and to meat tenderness [3,12]. Christensen et al. [13] observed that meat toughness increased between 40 and 50 °C and then between 60 and 80 °C, while toughness decline occurred between 50 and 60 °C. The authors explained the reduction in toughness as a result of decreased breaking strength of the perimysial connective tissue caused by partial denaturation and shrinkage of the collagen fibres.
Colour determines the doneness of meat and therefore can affect the consumer’s acceptance of a meat product [14,15]. The well-done state of meat requires reaching internal meat temperature of around 70 °C [12]. In raw meat, meat pigment myoglobin exists in three forms, i.e., oxymyoglobin, deoxymyoglobin and metmyoglobin, which show bright red, purple-red and brown colour, respectively. As a result of heat treatment, globin denaturates and precipitates with other meat proteins, and red ferrohemochrome and brown ferrihemochrome are formed. Denaturation of myoglobin begins between 55 °C and 65 °C and is almost completed by 80 °C [16,17]. Lien et al. [15] observed a 51.9% myoglobin denaturation in pork loin chops cooked to 62.8 °C end point temperature and its gradual increase to 85.3% when end point temperature reached 82.2 °C. Christensen et al. [11] suggested that when prolonged cooking time is applied, denaturation of myoglobin occurs below 60 °C.
The crucial factor in the sous vide technique is a balanced combination of temperature and cooking time [18,19]. Sánchez del Pulgar et al. [3] reported that chefs cook pork primals at 60–63 °C, while catering temperatures used for pork are around 75–80 °C. In the literature, sous vide cooking temperatures of pork for eating quality studies start at 48 °C [20] and reach 71 °C [21], while cooking times are between 45 min [21] and 32 h [11]. For a study of physical aspects, Zielbauer et al. [22] cooked pork at 45–74 °C for 10–2880 min. Most publications on sous vide cooking of pork investigate the quality of meat when temperatures between 50 and 60 °C are applied. Vaudagna et al. [23] suggested that beef sous vide cooking at 60–65 °C assures its safety and desirable yield and tenderness. In relation to pork safety, recommended end point temperatures range between 65 and 75 °C [24].
As the literature shows, the ranges of temperature and time regimes applied even to the same meat cuts are very wide, which makes the practical use of this technique quite difficult. Moreover, the emphasis on long cooking times to ensure microbiological safety of meat makes this technique time and energy consuming. In addition, combined scientific data on physicochemical and microbiological characteristics as well as sensory properties of sous vide cooked pork are scarce. Having in mind the practical application of sous vide cooking of meat in gastronomy and other catering services, the objective of the present study was to investigate the effect of different temperature-time combinations, featuring relatively shorter cooking times than usually applied in sous vide pork cooking, on cooking loss, instrumentally measured colour and texture, microbiological quality as well as sensory properties of pork loin. Correlation coefficients between selected physiochemically, instrumentally and sensorially assessed features of meat samples were also investigated.

2. Materials and Methods

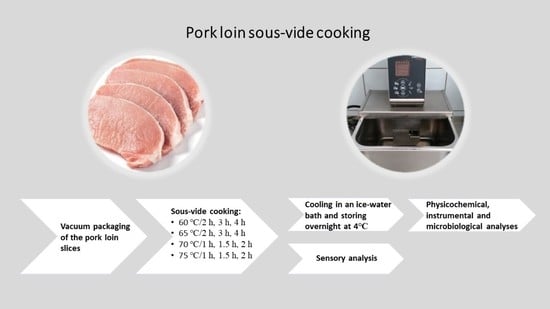
2.1. Preparation of Samples

Pork loins (M. longissimus thoracis et lumborum) of commercial crossbred pigs PIC (5–6 month-old female pigs of around 110 kg weight) were purchased 24 h after slaughter from a local meat supplier and transported to the laboratory in chilled conditions, vacuum packed and stored at 4 °C for 4 days. After storage each muscle was trimmed and cut into 2.5 cm thick slices. The slices were individually weighed and vacuum-packed in PA/PE pouches (15 μm polyamide/60 μm polyethylene; heat resistance of −20 °C/+110 °C; Hendi, Austria) using chamber vacuum sealer (Edesa VAC-20 DT, Barcelona, Spain). Seven slices were randomly assigned to each treatment.
Sous vide cooking was performed using a water bath with an immersion circulator equipped with a temperature sensor (Diamond Z, Julabo GmbH, Seelbach, Germany). The samples were heat-treated at 60 °C and 65 °C for 2 h, 3 h and 4 h, and at 70 °C and 75 °C for 1 h, 1.5 h and 2 h, after the sample core reached the temperature set for the water bath. Cooking temperatures and times were selected on the basis of preliminary study and the literature data [5,11,12,21]. After cooking, the samples destined for physicochemical, instrumental and microbiological analyses were cooled in an ice-water bath and stored overnight at 4 °C before analysis. The samples destined for sensory analysis were served after cooking. Three independent replicate trials of the whole experiment, with the use of meat purchased on three separate occasions, were conducted.

2.2. Cooking Loss

Cooking loss was calculated on the basis of the difference in meat weight before and after heat treatment.

2.3. Moisture Content

Moisture content in raw and cooked comminuted meat samples was determined by drying to constant weight at 105 °C according to AOAC procedure 950.46 [25] using a forced draught laboratory oven (UF55; Memmert, Schwabach, Germany).

2.4. pH Measurement

Five grams of comminuted raw and cooked meat samples was homogenized with 45 mL of distilled water using the HO 4 A homogenizer (Edmund Bühler GmbH, Hechingen, Germany) for 2 min at 5000 rpm, and the measurements were registered after the equilibrium was reached using a pH meter (pH 210, Hanna Instruments, Woonsocket, RI, USA) calibrated with pH 4 and pH 7 buffers.

2.5. Water Activity

Water activity was determined at 20 °C on comminuted raw and cooked meat samples placed in measuring containers in the analyzer chamber (AWC-200, Novasina, Pfäffikon, Switzerland) calibrated with a set of Novasina humidity sources.

2.6. Colour Determination

Coordinates L* (lightness/darkness), a* (redness/greenness) and b* (yellowness/blueness) of the CIE L*a*b* colour space were measured on the surface of raw and heat-treated samples using a CR-400 Chroma meter (Konica Minolta Sensing Inc., Osaka, Japan) equipped with standard observer 2° and illuminant D65 and calibrated with a white ceramic tile supplied by the manufacturer. Six measurements were taken for each treatment. Chroma (C*), hue angle () and total colour difference (ΔE*) were calculated according to the following equations:
C * = a * 2 + b * 2
h° = arctg(b*/a*) × (360°/2 × 3.14)
Δ E * = Δ L * 2 + Δ a * 2 + Δ b * 2  

2.7. Instrumental Texture Analysis

Texture analysis of cooked meat samples was based on shear test and texture profile analysis (TPA) using TA.TXplus Texture Analyzer (Stable Micro Systems Ltd., Godalming, UK) equipped with a 50 kg load cell. Shear test was performed with a Warner-Bratzler shear blade with a v-shaped notch. The crosshead speed during the test was 250 mm/min. The TPA test was a two-cycle compression using the P/100 compression platen of 50 mm diameter, with sample deformation to 50% of its original height. The crosshead speed was 50 mm/min. For each treatment, 20 specimens cut parallel to the muscle fibres (10 × 10 × 25 mm for the shear test and 16 mm diameter, 20 mm height cores for the TPA) were analyzed.

2.8. Microbiological Analysis

The total number of mesophilic microorganisms [26], the number of coagulase-positive staphylococci [27] and the number of Enterobacteriaceae [28] were determined in the raw and cooked meat samples. For this purpose, 10 g of meat was homogenized with 90 mL sterile 0.1% peptone in a Stomacher (Lab Blender, Model 400, Seward Medical, London, UK) for 120 s. Appropriate dilutions were made with 0.1% peptone broth, and 1 mL was plated onto the culture media and incubated under optimal conditions: total mesophilic counts on a Plate Count Agar (PCA, Oxoid) for 72 h at 30 °C; coagulase-positive staphylococci on a Baird Parker Agar RPF (Baird Parker Rabbit Plasma Fibrinogen Agar; BPA, RPF RPF Agar; Merck) for 72 h at 37 °C and Enterobacteriaceae on a VRBD Agar (Violet Red Bile Dextrose; Merck) for 24 h at 37 °C. Typical colonies for each media were counted in plates from the dilution with 10–150 colonies.
The presence of pathogens Salmonella spp. [29] and Listeria monocytogenes [30] in the meat was also determined. The presence of Salmonella spp. was determined in 25 g of meat. The sample was homogenized in 225 mL of buffered peptone water and incubated at 37 °C for 24 h. Then, 1 mL of the culture was transferred to a GranuCult™ RVS Broth (RAPPAPORT-VASSILIADIS-Soya; Merck) and incubated at 37 °C. After 24 h of incubation, the XLD Agar (Xylose Lysine Deoxycholate Agar; Merck) and BPLS Agar (Brilliant-green Phenol-red Lactose Sucrose; Merck) media were inoculated. The presence of Listeria monocytogenes in 25 g of meat was determined after precultivation in Half-Fraser broth (Merck) and cultivation in Full Fraser broth (Merck) on Chromocult® Listeria Agar; ALOA (Merck) and Palcam Listeria Selective Agar (Merck).

2.9. Sensory Analysis

The evaluation was conducted in the sensory analysis laboratory of the Department of Human Nutrition. The sensory panel consisted of 15 employees of the Faculty of Food Science, trained according to [31] and experienced in sensory evaluation of food. Before evaluation two training sessions familiarized the panelists with the samples represented in the experiment. The assessment of experimental samples was repeated twice during each experiment replication. The panelists were provided water and bread to clean the palate between samples. Cooked meat samples were diagonally cut into 1 cm thick slices and served one slice per assessor. Each panelist received all treatments in random order. Samples were evaluated using a 10 cm structured graphic scale, according to [32], for overall appearance, flavour acceptability and overall acceptability (0–not acceptable, 10–very acceptable), colour uniformity (0–not uniform, 10–highly uniform), aroma intensity and meat flavour intensity (0–low, 10–very intense), tenderness (0–tough, 10–tender) and juiciness (0–low and 10–very high).

2.10. Statistical Analysis

The results of the study were presented as mean values and standard error of the mean (SEM). The experiment was conducted using randomized factorial design with temperature and treatment time as fixed effects and experiment replicates as random effects. In each experiment replicate, when not otherwise stated, the measurements were conducted in three replications. Data were analyzed using the General Linear Model procedure of Statistica 13 (TIBCO Software Inc., Tulsa, OK, USA). The results of the measurements were subjected to two-way ANOVA to identify the effects of cooking temperature, cooking time and their interaction on the investigated features of meat samples. The means were separated with the Tukey’s test, and differences were considered significant if p < 0.05. Additionally, to examine potential relationships between selected attributes of the samples, Pearson’s correlation coefficients were calculated.

3. Results and Discussion

3.1. Cooking Loss

The cooking losses of the meat samples subjected to sous vide cooking were in the range 18.16–36.66%, and they increased significantly with temperature and cooking time (p < 0.001; Table 1).
The interaction of temperature and cooking time also showed a significant effect (p < 0.05) on cooking losses. Our results confirmed the observations of other authors [3,9,18,33]. Christensen et al. [11] noted a significant effect of temperature on cooking loss of pork and beef and a significant effect of temperature and time of processing on cooking loss of chicken. Different effects of temperature and time on the cooking loss of pork loin were observed by Hwang et al. [34]. Cooking losses tended to be higher when higher temperatures were applied, However, longer cooking time at 50 °C resulted in lower cooking loss, while at higher temperatures the cooking time effect was not significant.
Cooking loss is caused mainly by water loss during cooking, together with other meat components such as myofibrillar and sarcoplasmic proteins, collagen, lipids, vitamins, minerals and flavour compounds [35,36]. Most of the water is held in muscles within structures of myofibrillar proteins which undergo denaturation and shrinkage during heating, followed by water liberation and loss from meat [18,33,37,38]. The intensity of these processes increases with increasing temperature up to 90 °C. Collagen denaturation and subsequent shrinkage occur between 53 and 63 °C and between 60 and 70 °C, respectively. Further heating causes collagen solubilization and gelatine formation which also influence water loss from meat [7,9,37,39]. As the temperatures applied in our study were in the range 60–75 °C, the above changes can explain our observations.

3.2. Moisture Content

The moisture content in the raw meat was 72.45%, and as a result of cooking it declined significantly (p < 0.05) to 62.32–68.91% (Table 1). Meat cooked at 60 °C/2 h showed the highest moisture retention, and the lowest moisture retention was observed in samples heated at 75 °C/2 h. The significant effect (p < 0.001) of both temperature and time of cooking on the moisture content was noted, while the interaction of these parameters was not significant. Similar moisture contents in pork hams sous vide cooked at 61 and 71 °C and significantly higher moisture contents in meat cooked at lower temperatures were reported by Jeong et al. [21]. Limited differences in moisture content with increasing temperature of sous vide cooking and no significant effect of cooking time of lamb loins were noted by Roldan et al. [9]. The present results are in accordance with observations of Zielbauer et al. [22], who reported that higher temperatures and longer cooking times lead to increased water losses. The authors suggested that temperatures above 74 °C and cooking times longer than 240 min do not increase further moisture liberation from meat.
Loss of water in cooked meat is caused by a leakage of cellular juice under the influence of elevated temperature. Additionally, myofibrillar protein shrinkage, which starts at 40 °C, leads to a subsequent decline in the interfibrillar volume which in turn reduces myofibril’s ability to hold water. Finally, compression of the muscle fiber bundles due to the contraction of the perimysial connective tissue at temperatures 56–62 °C contributes to water release from meat [3,36]. Low temperatures applied during sous vide cooking, and consequently low end point internal meat temperatures, apparently favor the meat’s ability to retain water in its structures due to lower meat fiber shrinkage.

3.3. Water Activity

Water activity of food product is a useful indicator of its susceptibility to degradation processes caused by the growth of microorganisms and the intensity of biochemical and chemical reactions [1,40,41]. It is particularly important when the food is intended for storage. Water activity of raw meat was 0.996. No significant differences were noted between raw and cooked samples in the present study (Table 1). The values observed for heat-treated samples were between 0.991 and 0.995 and corresponded to the values obtained for a sous vide cooked turkey cutlet by Akoğlu et al. [1] and Bıyklı et al. [42]. Slightly lower value of 0.92 were reported for sous vide cooked pork loin by Díaz et al. [43]. Nevertheless, all values observed in our study were high and could not affect diversity in storage stability of investigated samples, particularly in terms of microbiological spoilage [40].

3.4. pH Value

The pH value of meat influences its water-holding capacity [14] and the reaction pathways of the Maillard reaction, and therefore affects flavour and consequently storage stability of cooked meat [41]. Analysis of pH values did not reveal significant differences between raw (5.78) and cooked meat samples (5.80–5.91; Table 1). Díaz et al. [43] reported similar pH values for pork loin sous vide cooked at 70 °C/12 h after initial roasting. Our observation does not support that of Hwang et al. [34] who noted a significant increase in pH values of sous vide cooked pork loin (5.79–6.04) compared to raw meat (5.68). The probable reason for different pattern of pH changes in both experiments could be different cooking parameters applied by Hwang et al. [34], particularly the longer cooking times, namely 12 and 24 h vs. 1–4 h investigated in our study. It suggests that at shorter cooking time, processes in protein fraction that are related to distinct pH changes are limited. A slight increase in the pH of chicken breast fillets affected by the temperature and the interaction between temperature and cooking time was noted by Haghighi et al. [44].
According to other authors, the pH increase of heated meat may be ascribed to the loss of the free acidic group associated with protein denaturation [14,38,45]; cleavage of bonds involving imidazole, sulphydryl and hydroxyl groups [36]; an exposure of basic amino residues [34] and formation of free hydrogen sulfide when cooking takes place at temperatures above 80 °C [45]. Becker et al. [14] ascribed lower pH values of pork cooked at 60 °C/2 h than samples cooked at 53 °C/20 h, 58 °C/20 h or 180 °C/50 min, to a lower protein denaturation.

3.5. Colour

Colour parameters of the raw and cooked samples are presented in Table 2. Lightness values L* of heat-treated meats (70.05–71.63) were significantly higher (p < 0.05) than L* value of the raw meat (54.72). No significant differences were noted between heated meats. However, slightly higher values were observed with increased heating temperatures. Similar observations were made by Haghighi et al. [44] regarding poultry meat and in relation to pork by Becker et al. [18], Hwang et al. [34] and Jeong et al. [21].
Roldan et al. [9] pointed out an opposite pattern of L* values for lamb, namely slightly higher values for meat cooked at the lowest temperature. Lightness of cooked meats is affected by myofibrillar protein denaturation and aggregation [20,21] as well as moisture presence on the meat surface [18]. According to Bojarska et al. [46] a deeper penetration of light into muscle tissue with greater hydration of muscular proteins results in darker colour, which might explain our observations related to L* and moisture content.
Changes in meat redness (a*) as a result of cooking are related to the myoglobin content and the degree of its denaturation. In the present study, no significant differences were observed between a* values of all investigated samples, including the raw meat (a* = 8.35 for the raw meat and 7.44–7.86 for the cooked meats). It was reported that the higher the cooking temperature, the lower the a* values [18,20,23,44,47] due to more intensive pigment denaturation [44]. In the study on myoglobin denaturation in aqueous muscle extracts, Geileskey et al. [16] observed that over 50% of the myoglobin was still present in the extract at 60 °C, while at 70 and 80 °C it was almost completely precipitated. Our observations regarding redness of cooked samples probably could be explained by the longer cooking times applied at lower cooking temperatures, namely 2, 3 and 4 h at 60 and 65 °C, while 1, 1.5 and 2 h were cooking times at 70 and 75 °C, and as result, we observed a similar extent of myoglobin changes in those two groups of samples. Such an explanation seems to support the findings of Hwang et al. [34], who did not observe the differences in L*, a* and b* colour values of pork loin sous vide cooked at 50, 55 and 60 °C for 12 and 24 h compared to meat heated at 75 °C for 30 min.
The yellowness (b*) of samples increased significantly (p < 0.005) due to the heat treatment from 5.30 noted in Table 2 for raw meat with values from 13.41–14.72 as determined for cooked meats. The significant effect of both temperature and time (p < 0.001) of cooking on the b* values was observed, but the temperature/time interaction effect was not significant. In the study of Becker et al. [18] the b* values of pork loins increased with temperature and prolonged time of cooking. Higher b* values of cooked meat can be ascribed to an increase in metmyoglobin level, which results in a more brownish colour [48].
Chroma (C*, saturation) and hue angle () are colour indicators that reflect colour intensity and tone, respectively, considering both redness and yellowness coordinates. In our study the C* values of cooked samples were relatively low (15.44–16.55) and significantly affected by the temperature (p < 0.001) and time (p < 0.05) of cooking but not their interaction. Similar effects of cooking parameters were noted on the values of samples (p < 0.001 and p < 0.01, resp.). Actual values of cooked meats (59.71–63.03) indicated a lower share of redness and a higher share of yellowness in sample colour as hue angle values close to 0° indicate redder colour, while values close to 90° indicate more yellow appearance [49,50]. Total colour differences ΔE*, calculated for the cooked samples in relation to the raw meat, showed high values (15.56–25.61), which means that regardless of cooking parameters applied, colour changes were recognizable for an unexperienced observer [51].

3.6. Instrumental Texture Analysis

3.6.1. Shear Force

Low shear force values of cooked meat are desirable as they reflect greater tenderness of ready to eat product. Tenderness is related to myofibrils and connective tissue proteins and their changes during heat treatment, mainly denaturation of myofibrillar proteins and solubilization of connective tissue [33].
The maximum force noted during a shear test was selected to characterize the texture of the samples (Table 3). The highest shear force was noted for meat cooked at 60 °C/4 h (25.61 N), and the lowest for the sample cooked at 65 °C/3 h (13.29 N). At two lower temperatures, i.e., 60 and 65 °C, the most tender meats were obtained when heating was conducted for 3 h (17.63 and 13.29 N, respectively), while at two higher temperatures, i.e., 70 and 75 °C, the lowest shear force values were observed for meats cooked for 2 h (14.66 and 14.61 N, resp.). It can be pointed out that when the same cooking time at all temperatures was taken into consideration (2 h), the shear force values decreased with increased temperature of the heat treatment. Both temperature and time of cooking had a significant effect (p < 0.001) on meat shear force, but their interaction effect was not significant.
Our results are partially in agreement with the experiment of Christensen et al. [20], where the shear force values of pork Longissimus dorsi were in the range 12.6–41.1 N and decreased with cooking temperature increases, while the effect of cooking time was not uniform and depended on the cooking temperature. In the study by Hwang et al. [34], the shear force of pork loin was affected by process temperature, but process time had significant effect on meat tenderness only at 50 °C. It was suggested that the tenderization of longer cooked (24 vs. 12 h) meat was supported by activity of intrinsic proteases which remained active at this low temperature. Thermal inactivation of proteases at temperatures higher than 55 °C was the probable reason that heat induced structural changes of meat proteins had a decisive role in meat tenderness formation. Correlation between cathepsins activity and shear force of pork has been recently reported by Dominguez-Hernandez et al. [19]. Likewise, Jeong et al. [21] observed a significant effect of cooking temperature on the shear force values of pork ham sous vide cooked at 61 °C and 71 °C, while cooking time effect was noted for meat cooked at 71 °C. Increased meat tenderness upon cooking is associated with the collagen conversion to gelatin [38,45]. Ismail et al. [52] reported increasing collagen solubility in beef cooked at 45, 65 and 75 °C, while Vasanthi et al. [45] observed an increase in collagen solubility with temperature (80–100 °C) and time of cooking (30–60 min). In our study temperatures higher than 55 °C were applied. Therefore, changes in meat texture apparently have been a result of heating and not of proteases activity.

3.6.2. Texture Profile Analysis (TPA)

TPA delivers more information on the texture of meat products than shear force which in turn is a useful indicator of initial meat tenderness [48].
Texture profile attributes are presented in Table 3. The treatment temperature that resulted in the lowest hardness was 60 °C, and the values declined with prolonged cooking time from 60.26 N to 54.77 N. Comparable hardness was observed for the samples cooked at 65 °C for 3 or 4 h and at 70 °C for 1 h. In general, the higher the cooking temperature, the higher the hardness of samples noted. Similar increases with increased temperature of process were observed in other texture attributes of samples. It is worth noting that at 60 and 65 °C, hardness and chewiness values tended to decline with prolonged cooking time, while the opposite tendency occurred at 70 and 75 °C. This observation presumably could be explained by the relatively mild myofibrillar protein denaturation at lower temperatures and increasing collagen hydrolyzation with prolonged cooking time while at higher temperatures the changes in myofibrillar proteins predominated, leading to increased meat toughness. Likewise in the case of shear force, temperature and time of treatment influenced meat hardness significantly (p < 0.001), but not their interaction. Other texture attributes were affected by temperature and cooking time as well as their interaction.
Jeong et al. [21] noted lower hardness and chewiness of pork ham sous vide cooked at 61 °C and 71 °C for 45 and 90 min, compared to the control samples boiled in a pot for 45 min. Sánchez del Pulgar et al. [3] did not observe any significant effect of cooking at 60 °C for 5 or 12 h on texture attributes of pork cheeks, while during treatment at 80 °C, increasing cooking time from 5 to 12 h caused a decline in these parameters. These finding were supported by the histological analyses which showed a bigger formation of completely denatured collagen fibres of the samples cooked at 80 °C than at 60 °C. Brüggemann et al. [53] observed collagen shrinkage at 57 °C and collagen denaturation between 59 °C and 61 °C. Palka et al. [54] ascribed a lower hardness, cohesiveness and chewiness of beef cooked at 60 °C than at 70 or 80 °C to the myosin and actin denaturation (at 40–60 °C and 66–73 °C, respectively) and shrinking of collagen (56–62 °C), which might as well be an explanation of observations made in the present study.

3.7. Microbiological Analyses

The microbial counts in raw and cooked meat are shown in Table 4. The samples of raw loins showed counts for mesophilic bacteria at about 3.59 log CFU/g. The number of Enterobacterioceae was determined in similar values (3.07 log CFU/g), whereas for coagulase-positive staphylococci it was 1.95 log CFU/g. This means that the main contamination of the raw pork loin was fecal microflora. The presence of pathogens belonging to Salmonella spp. and Listeria monocytogenes has not been detected. These results are within the standards specified in [55]. The obtained results are consistent with the values determined by Roldan et al. [9] who tested lamb loins.
After heat treatment, the total number of aerobic microorganisms was reduced by about 2 logs and ranged from 1.10 to 2.01 log CFU/g. Fecal microflora, Enterobacteriaceae and coagulase-positive staphylococci were determined in the population at the level <1 log CFU/g. The results obtained in the research indicate that the applied parameters of the sous vide processing were sufficient to reduce the microflora in the pork loin. The inactivation effects of Gram-negative Enterobacteriaceae are particularly satisfactory. Other authors also obtained a reduction of the Enterobacteriaceae population in pork loin to <1 log CFU/g [43]. The study of Jeong et al. [21] indicated the effectiveness of sous vide treatment in relation to fecal microflora, while only a part of the Enterobacteriaceae family coliforms was determined.

3.8. Sensory Analysis

The investigation of organoleptic properties of cooked meats showed that the highest scores for meat flavour intensity, flavour acceptability and overall acceptability, were given to the sample heated at 60 °C/4 h (Table 5). In respect to meat flavour intensity, this sample was significantly different from the sample heated at 60 °C/2 h. In terms of flavour acceptability, this sample was very different from the sample cooked at 75 °C/2 h. In terms of overall acceptability, this sample was superior to the samples cooked at 75 °C/1.5 h and at 75 °C/2 h. The highest perception of juiciness was noted in meat cooked at 60 °C/2 h, but a significant difference was shown, mainly compared to the samples cooked at 75 °C. The sample cooked at 65 °C/4 h received the highest scores for other sensory traits considered in the study, namely overall appearance, colour uniformity, aroma intensity and tenderness. No significant differences were observed between samples in respect to aroma intensity. The scores for juiciness, tenderness, flavour acceptability and overall acceptability slightly declined with increased treatment temperature. According to the analysis of variance, the temperature of cooking significantly affected tenderness, juiciness, flavour acceptability and overall acceptability. Time of treatment showed a significant effect on overall appearance, tenderness, juiciness, meat flavour intensity and overall acceptability. Interaction of cooking parameters influenced meat traits related to visual quality, namely overall appearance and colour uniformity.
Our results regarding meat flavour intensity agree with those of Christensen et al. [11], who observed increasing intensity of meaty flavour of pork with increased temperature and cooking time using temperatures below 60 °C. Aaslyng et al. [56] pointed out that meat dish flavour is a complex phenomenon with origins from animal breed and handling before and after slaughter and then is related to meat processing, including heat treatment. The presence of precursors resulting from the type of meat cut and its origin, as well as temperature and treatment time determine the composition of flavour compounds. The Maillard reaction and a degradation of fatty acids are main sources of numerous volatile flavour compounds generated during heat treatment of meat. In addition, some importance to pork aroma may be ascribed to thiamine degradation [41]. The non-volatile compounds present in meat, such as monosodium glutamate, inosine monophosphate which originates from ATP breakdown, organic acids e.g., lactate [56] as well as derivatives of sulphur amino acids transformations [57] also contribute to meat flavour. In our study, cooking temperatures below 100 °C were applied, which significantly limited the extent of the Maillard reactions [4,41,56,58]. Anderson et al. [59] did not observe significant differences in beef lipids, based on fatty acids analysis between raw beef and beef cooked at 70 °C. Therefore, the limited extent of the above mentioned reactions at temperatures applied in our study presumably was the reason that no significant differences were observed between samples with regard to their aroma intensity. Moreover, Clausen et al. [6] did not observe a change in the free glutamate content in beef tenderloin sous vide cooked at 54 and 64 °C, which together with aroma volatile compounds delivering reactions might account for only small differences in sample flavour acceptability in the present study. On the other hand, Rotola-Pukkila et al. [60] reported lower glutamic and aspartic acid concentrations in pork loins sous vide cooked at 70 °C than at 60 and 80 °C, no effect of cooking parameters on inosine monophosphate and increased concentration of adenosine monophosphate with increased temperature and time of treatment.
The lowest juiciness of the samples cooked at 75 °C in our experiment confirms the findings of Christensen et al. [11] and agrees with the hypothesis verified by Becker et al. [14]. The hypothesis implied that transversal and longitudinal meat shrinkages, which take place at 45–60 °C and 60–90 °C, resp., decrease the water holding capacity of meat and as a result reduce its juiciness.
In our study, cooking at 75 °C produced a less tender meat than cooking at lower temperatures. These results correspond to those of TPA hardness, cohesiveness and chewiness. According to Baldwin [12], meat tenderness increases when cooked between 50 °C and 65 °C and then declines with temperature increases up to 80 °C. Clausen et al. [6] observed a slight decrease in beef tenderloin tenderness with longer cooking time both at 54 and 64 °C, and increased temperature. In the experiment of Christensen et al. [11] tenderness of pork increased both with temperature and cooking time.

3.9. Relationships between Selected Attributes of Cooked Samples

Correlation coefficients between selected quality attributes of sous vide cooked pork loin samples are presented in Table 6.
Overall acceptability of cooked meat was positively and significantly correlated with sensorially assessed tenderness and juiciness (r = 0.561 and r = 0.662, resp.), while negatively and significantly, it was correlated with cooking loss (r = −0.275) and instrumentally measured texture attributes (correlation coefficients from −0.312 to −0.197). Other high correlation coefficients (r > 0.5; p < 0.001) were noted for hardness and chewiness (r = 0.588), chewiness and springiness (r = 0.512), chewiness and cohesiveness (r = 0.504), springiness and cohesiveness (r = 0.583) and finally for tenderness and juiciness (r = 0.617). Significant correlation coefficients (data not shown in the table) were also observed for overall acceptability and other features, such as meat flavour intensity (r = 0.236; p < 0.01), flavour acceptability (r = 0.370; p < 0.001) and chroma (r = 0.208; p < 0.01).
Only a few studies reported the relationships between investigated features of sous vide cooked pork. Díaz et al. [43] observed that appearance, meaty odour and meaty flavour were the main features that contributed positively and significantly to overall acceptance of pork stored for 5 or 10 weeks (r > 0.6), while the negative correlation coefficients were noted between overall acceptance and rancid, warmed-over and acidic odours and flavours. Jeong et al. [21] noted a similar tendency of changes in moisture content and shear force of experimental material. The positive relationship between shear force and moisture content in meat was also reported by Botinestean et al. [48], Roldan et al. [61] and Souza et al. [62], as well as observed in our own study (r = 0.261, p < 0.01). It is interesting that the correlation coefficient between cooking loss and moisture content in our study was low and insignificant. This observation could confirm that increased cooking losses might not agree with moisture reduction due to the loss of other meat components such as soluble proteins e.g., collagen [4].

4. Conclusions

The quality of cooked meat is a multidimensional feature, which is affected by meat cut characteristics and physico-chemical and sensorial properties as well as microbiological safety of final products. The research presented in the literature most often deal with selected aspects of the sous vide method: different meat cut quality, e.g., storage stability of pork loin cooked at only one temperature/time combination and assessed on the basis of physico-chemical and sensory analyses [43]; physico-chemical properties of pork cheeks cooked using different combinations of two temperatures and two times of heat treatment [3] or physico-chemical and basic microbiological quality aspects of pork ham cooked using combinations of two temperatures, two times and two vacuum degrees [21].
The present study, where we applied a wide range of cooking parameter combinations and a wide range of analyses (physico-chemical, sensorial and microbiological), revealed that cooking at 60 or 65 °C for 4 h ensured the most attractive and acceptable sensory traits of pork loin, which was also partially confirmed by the results of TPA analysis. Instrumentally measured hardness, cohesiveness and chewiness showed the lowest values for the 60 °C/4 h sample, while the lowest springiness was observed for the 65 °C/4 h sample. The sensory features that influenced the overall acceptability of sous vide cooked pork loin in the highest degree were tenderness and juiciness, as can be seen based on coefficients of correlation. That means the texture attributes were the most important for sous vide cooked pork perception. Regarding cooking loss, meat preparation at 60 °C/4 h was more beneficial than at 65 °C/4 h, however it was not reflected in moisture content and sensorially assessed juiciness. The results obtained in the research indicate that the applied parameters of the sous vide processing were sufficient to reduce the microflora in the pork loin to the level safe for consumption.

Author Contributions

Conceptualization, experiment design, writing—review and editing, funding acquisition, supervision—L.K. (Lidia Kurp), M.D.-O.; project administration—M.D.-O.; methodology, formal analysis, data analysis, writing—original draft—L.K. (Lidia Kurp), L.K. (Lucyna Kłębukowska). All authors have read and agreed to the published version of the manuscript.

Funding

Project financially supported by the Minister of Education and Science in the range of the program entitled “Regional Initiative of Excellence” for the years 2019–2022, Project No. 010/RID/2018/19, amount of funding 12.000.000 PLN.

Data Availability Statement

Not applicable.

Conflicts of Interest

The authors declare no conflict of interest.

References

  1. Akoğlu, I.T.; Bıyklı, M.; Akoğlu, A.; Kurhan, Ş. Determination of the quality and shelf life of sous vide cooked turkey cutlet stored at 4 and 12 °C. Rev. Bras. Cienc. Avic. 2018, 20, 1–8. [Google Scholar] [CrossRef]
  2. Bhat, Z.F.; Morton, J.D.; Zhang, X.; Mason, S.L.; Bekhit, A.E.A. Sous-vide cooking improves the quality and in-vitro digestibility of Semitendinosus from culled dairy cows. Food Res. Int. 2020, 127, 108708. [Google Scholar] [CrossRef] [PubMed]
  3. Sánchez del Pulgar, J.; Gázquez, A.; Ruiz-Carrascal, J. Physico-chemical, textural and structural characteristics of sous-vide cooked pork cheeks as affected by vacuum, cooking temperature, and cooking time. Meat Sci. 2012, 90, 828–835. [Google Scholar] [CrossRef] [PubMed]
  4. Dominguez-Hernandez, E.; Salaseviciene, A.; Ertbjerg, P. Low-temperature long-time cooking of meat: Eating quality and underlying mechanisms. Meat Sci. 2018, 143, 104–113. [Google Scholar] [CrossRef] [Green Version]
  5. Bryan, E.E.; Smith, B.N.; Dilger, R.N.; Dilger, A.C.; Boler, D.D. Technical note: A method for detection of differences in cook loss and tenderness of aged pork chops cooked to differing degrees of doneness using sous-vide. J. Anim. Sci. 2019, 97, 3348–3353. [Google Scholar] [CrossRef]
  6. Clausen, M.P.; Christensen, M.; Djurhuus, T.H.; Duelund, L.; Mouritsen, O.G. The quest for umami: Can sous vide contribute? Int. J. Gastron. Food Sci. 2018, 129–133. [Google Scholar] [CrossRef] [Green Version]
  7. James, B.J.; Yang, S.W. Effect of cooking method on the toughness of bovine M. Semitendinosus. Int. J. Food Eng. 2012, 8, 1–18. [Google Scholar] [CrossRef]
  8. Hong, G.E.; Kim, J.H.; Ahn, S.J.; Lee, C.H. Changes in meat quality characteristics of the sous-vide cooked chicken breast during refrigerated storage. Korean J. Food Sci. Anim. Resor. 2015, 35, 757–764. [Google Scholar] [CrossRef] [Green Version]
  9. Roldán, M.; Antequera, T.; Martin, A.; Mayoral, A.I.; Ruiz, J. Effect of different temperature-time combinations on physicochemical, microbiological, textural and structural features of sous-vide cooked lamb loins. Meat Sci. 2013, 93, 572–578. [Google Scholar] [CrossRef]
  10. Christensen, L.; Ertbjerg, P.; Løje, H.; Risbo, J.; van den Berg, F.W.J.; Christensen, M. Relationship between meat toughness and properties of connective tissue from cows and young bulls treated at low temperatures for prolonged times. Meat Sci. 2013, 93, 787–795. [Google Scholar] [CrossRef]
  11. Christensen, L.; Gunvig, A.; Tørngren, M.A.; Aaslyng, M.D.; Knøchel, S.; Christensen, M. Sensory characteristics of meat cooked for prolonged times at low temperature. Meat Sci. 2012, 90, 485–489. [Google Scholar] [CrossRef] [PubMed]
  12. Baldwin, D.E. Sous vide cooking: A review. Int. J. Gastron. Food Sci. 2012, 1, 15–30. [Google Scholar] [CrossRef] [Green Version]
  13. Christensen, M.; Purslow, P.P.; Larsen, L.M. The effect of cooking temperature on mechanical properties of whole meat, single muscle fibres and perimysial connective tissue. Meat Sci. 2000, 55, 301–307. [Google Scholar] [CrossRef]
  14. Becker, A.; Boulaaba, A.; Pingen, S.; Krischek, C.; Klein, G. Low temperature cooking of pork meat—Physicochemical and sensory aspects. Meat Sci. 2016, 118, 82–88. [Google Scholar] [CrossRef]
  15. Lien, R.; Hunt, M.C.; Anderson, S.; Kropf, D.H.; Loughin, T.M.; Dikeman, M.E.; Velazco, J. Effects of endpoint temperature on the internal color of pork loin chops of different quality. J. Food Sci. 2002, 67, 1007–1010. [Google Scholar] [CrossRef]
  16. Geileskey, A.; King, R.D.; Corte, D.; Pinto, P.; Ledward, D.A. The kinetics of cooked meat haemoprotein formation in meat and model systems. Meat Sci. 1998, 48, 189–199. [Google Scholar] [CrossRef]
  17. King, N.J.; Whyte, R. Does it look cooked? A review of factors that influence cooked meat color. J. Food Sci. 2006, 71, R31–R40. [Google Scholar] [CrossRef]
  18. Becker, A.; Boulaaba, A.; Pingen, S.; Röhner, A.; Klein, G. Low temperature, long time treatment of porcine M. longissimus thoracis et lumborum in a combi steamer under commercial conditions. Meat Sci. 2015, 110, 230–235. [Google Scholar] [CrossRef]
  19. Dominguez-Hernandez, E.; Ertbjerg, P. Effect of LTLT heat treatment on cathepsin B and L activities and denaturation of myofibrillar proteins of pork. Meat Sci. 2021, 175, 108454. [Google Scholar] [CrossRef]
  20. Christensen, L.; Ertbjerg, P.; Aaslyng, M.D.; Christensen, M. Effect of prolonged heat treatment from 48 °C to 63 °C on toughness, cooking loss and color of pork. Meat Sci. 2011, 88, 280–285. [Google Scholar] [CrossRef]
  21. Jeong, K.O.H.; Shin, S.Y.; Kim, Y.S. Effects of sous-vide method at different temperatures, times and vacuum degrees on the quality, structural, and microbiological properties of pork ham. Meat Sci. 2018, 143, 1–7. [Google Scholar] [CrossRef] [PubMed]
  22. Zielbauer, B.I.; Franz, J.; Viezens, B.; Vilgis, T.A. Physical aspects of meat cooking: Time dependent thermal protein denaturation and water loss. Food Biophys. 2016, 11, 34–42. [Google Scholar] [CrossRef]
  23. Vaudagna, S.R.; Pazos, A.A.; Guidi, S.M.; Sanchez, G.; Carp, D.J.; Gonzales, C.B. Effect of salt addition on sous vide cooked whole beef muscles from Argentina. Meat Sci. 2008, 79, 470–482. [Google Scholar] [CrossRef] [PubMed]
  24. Ángel-Rendón, S.V.; Filomena-Ambrosio, A.; Hernández-Carrión, M.; Llorca, E.; Hernando, I.; Quiles, A.; Sotelo-Díaz, I. Pork meat prepared by different cooking methods. A microstructural, sensorial and physicochemical approach. Meat Sci. 2020, 163, 108089. [Google Scholar] [CrossRef] [PubMed]
  25. AOAC International. Official methods of analysis 950.46. In Moisture in Meat, 18th ed.; AOAC International: Gaithersburg, MD, USA, 2005. [Google Scholar]
  26. ISO 4833-1:2013; Microbiology of the Food Chain—Horizontal Method for the Enumeration of Microorganism—Part 1: Colony Count at 30 °C by the Pour Plate Technique. 2005. Available online: https://www.iso.org/standard/59509.html (accessed on 11 January 2022).
  27. ISO/DIS 6888-2:2020; Microbiology of the Food Chain—Horizontal Method for the Enumeration of Coagulase-Positive Staphylococci (Staphylococcus aureus and Other Species)—Part 2: Technique Using Rabbit Plasma Fibrinogen Agar Medium. Available online: https://webstore.ansi.org/standards/iso/isodis68882020-2405117 (accessed on 11 January 2022).
  28. ISO 21528-2:2017; Microbiology of the Food Chain—Horizontal Method for the Detection and Enumeration of Enterobacteriaceae —Part 2: Colony—Count Technique. Available online: https://www.iso.org/standard/63504.html (accessed on 11 January 2022).
  29. ISO 6579-1:2017; Microbiology of the Food Chain—Horizontal Method for the Detection, Enumeration and Serotyping of Salmonella—Part 1: Detection of Salmonella spp. Available online: https://www.iso.org/obp/ui/#iso:std:iso:6579:-1:ed-1:v1:en (accessed on 11 January 2022).
  30. ISO 11290-1:2017; Microbiology of the Food Chain—Horizontal Method for the Detection, and Enumeration of Listeria monocytogenes and of Listeria spp.—Part 1: Detection Method. Available online: https://www.iso.org/standard/60313.html (accessed on 11 January 2022).
  31. PN-EN ISO 8586:2014-03; Sensory Analysis. General Guidance for Selection, Training and Monitoring of Selected Assessors and Experts. Polish Committee for Standardization: Warsaw, Poland, 2014.
  32. ISO 4121:2003; Sensory Analysis—Guidelines for the Use of Quantitative Response Scales. Available online: https://www.iso.org/standard/33817.html (accessed on 11 January 2022).
  33. Ayub, H.; Ahmad, A. Physiochemical changes in sous-vide and conventionally cooked meat. Int. J. Gastron. Food Sci. 2019, 17, 100145. [Google Scholar] [CrossRef]
  34. Hwang, S.I.; Lee, E.J.; Hong, G.P. Effects of temperature and time on the cookery properties of sous-vide processed pork loin. Food Sci. Anim. Resour. 2019, 39, 65–72. [Google Scholar] [CrossRef]
  35. Gerber, N.; Scheeder, M.R.L.; Wenk, C. The influence of cooking and fat trimming on the actual nutrient intake from meat. Meat Sci. 2009, 81, 148–154. [Google Scholar] [CrossRef]
  36. Oz, F.; Aksu, M.; Turan, M. The effects of different cooking methods on some quality criteria and mineral composition of beef steaks. J. Food Process. Pres. 2017, 41, e13008. [Google Scholar] [CrossRef]
  37. Tornberg, E. Effect of heat on meat proteins—Implications on structure and quality of meat products. Meat Sci. 2005, 70, 493–508. [Google Scholar] [CrossRef]
  38. Lawrie, R.A.; Ledward, D.A. Lawrie’s Meat Science; Woodhead Publishing Limited: Cambridge, UK, 2006. [Google Scholar]
  39. Purslov, P.P.; Oiseth, S.; Hughes, J.; Warner, R.D. The structural basis of cooking loss in beef: Variations with temperature and ageing. Food Res. Int. 2016, 89, 739–748. [Google Scholar] [CrossRef]
  40. Park, Y.W. Moisture and water activity. In Handbook of Processed Meat and Poultry Analysis, 1st ed.; Nollet, L.M.L., Toldra, F., Eds.; CRC Press: Boca Raton, FL, USA; London, UK; New York, NY, USA, 2008; pp. 35–40. [Google Scholar]
  41. Resconi, V.C.; Escudero, A.; Campo, M.M. The development of aromas in ruminant meat. Molecules 2013, 18, 6748–6781. [Google Scholar] [CrossRef] [PubMed] [Green Version]
  42. Bıyklı, M.; Akoğlu, A.; Kurhan, Ş.; Akoğlu, I.T. Effect of different sous vide cooking temperature-time combinations on the physicochemical, microbiological, and sensory properties of turkey cutlet. Int. J. Gastron. Food Sci. 2020, 20, 100204. [Google Scholar] [CrossRef]
  43. Díaz, P.; Nieto, G.; Garrido, M.D.; Bañón, S. Microbial, physical-chemical and sensory spoilage during the refrigerated storage of cooked pork loin processed by the sous vide method. Meat Sci. 2008, 80, 287–292. [Google Scholar] [CrossRef] [PubMed]
  44. Haghighi, H.; Belmonte, A.M.; Masino, F.; Minelli, G.; Lo Fiego, D.P.; Pulvirenti, A. Effect of time and temperature on physicochemical and microbiological properties of sous vide chicken breast fillets. Appl. Sci. 2021, 11, 3189. [Google Scholar] [CrossRef]
  45. Vasanthi, C.; Venkataramanujam, V.; Dushyanthan, K. Effect of cooking temperature and time on the physico-chemical, histological and sensory properties of female carabeef (buffalo) meat. Meat Sci. 2007, 76, 274–280. [Google Scholar] [CrossRef]
  46. Bojarska, U.; Batura, J.; Cierach, M. The effect of measurement site on the evaluation of tom breast muscle color. Pol. J. Food Nutr. Sci. 2003, 53, 45–49. [Google Scholar]
  47. Vaudagna, S.R.; Sánchez, G.; Neira, M.S.; Insani, E.M.; Picallo, A.B.; Gallinger, M.M.; Lasta, J.A. Sous vide cooked beef muscles: Effects of low temperature–long time (LT–LT) treatments on their quality characteristics and storage stability. Int. J. Food Sci. Tech. 2002, 37, 425–441. [Google Scholar] [CrossRef]
  48. Botinestean, C.; Keenan, D.F.; Kerry, J.P.; Hamill, R.M. The effect of thermal treatments including sous-vide, blast freezing and their combinations on beef tenderness of M. Semitendinosus steaks targeted at elderly consumers. LWT Food Sci. Technol. 2016, 74, 154–159. [Google Scholar] [CrossRef]
  49. Smith, D.S. Quantifying color variation: Improved formulas for calculating hue with segment classification. Appl. Plant Sci. 2014, 2, 1300088. [Google Scholar] [CrossRef]
  50. Sun, S.; Rasmussen, F.D.; Cavender, G.A.; Sullivan, G.A. Texture, color and sensory evaluation of sous-vide cooked beef steaks processed using high pressure processing as method of microbial control. LWT Food Sci. Technol. 2019, 103, 169–177. [Google Scholar] [CrossRef]
  51. Mokrzycki, W.; Tatol, M. Color difference Delta E—A survey. Mach. Graph. Vis. 2011, 20, 383–411. [Google Scholar]
  52. Ismail, I.; Hwang, Y.-H.; Bakhsh, A.; Joo, S.-T. The alternative approach of low temperature-long time cooking on bovine semitendinosus meat quality. Asian-Australas. J. Anim. Sci. 2019, 32, 282–289. [Google Scholar] [CrossRef] [PubMed] [Green Version]
  53. Brüggemann, D.A.; Brewer, J.; Risbo, J.; Bagatolli, L. Second harmonic generation microscopy: A tool for spatially and temporally resolved studies of heat induced structural changes in meat. Food Biophys. 2010, 5, 1–8. [Google Scholar] [CrossRef]
  54. Palka, K.; Daun, H. Changes in texture, cooking losses, and myofibrillar structure of bovine M. semitendinosus during heating. Meat Sci. 1999, 51, 237–243. [Google Scholar] [CrossRef]
  55. Commission Regulation (EC) No. 2073/2005 of 15 November 2005 on Microbiological criteria for foodstuffs. Official Journal of the European Union, L 388, 48, 1-26. The Commission of the European Communities: Brussels, Belgium, 2005; Available online: https://eur-lex.europa.eu/legal-content/EN/TXT/PDF/?uri=OJ:L:2005:338:FULL&from=EN (accessed on 14 September 2021).
  56. Aaslyng, M.D.; Meinert, L. Meat flavor in pork and beef—From animal to meal. Meat Sci. 2017, 132, 112–117. [Google Scholar] [CrossRef]
  57. Przybylski, W.; Jaworska, D.; Kajak-Siemaszko, K.; Sałek, P.; Pakuła, K. Effect of heat treatment by the sous-vide method on the quality of poultry meat. Foods 2021, 10, 1610. [Google Scholar] [CrossRef]
  58. Chansataporn, W.; Nopharatana, M.; Samuhasaneetoo, S.; Siriwattanayotin, S.; Tangduangdee, C. Effects of temperature on the main intermediates and products of the Maillard reaction in the chicken breast meat model system. Int. J. Agric. Technol. 2019, 15, 539–556. [Google Scholar]
  59. Anderson, D.B.; Breidenstein, B.B.; Kauffan, R.G.; Cassens, R.G.; Bray, R.W. Effect of cooking on fatty acid composition of beef lipids. Int. J. Food Sci. Technol. 1971, 6, 141–152. [Google Scholar] [CrossRef]
  60. Rotola-Pukkila, M.; Pihlajaviita, S.T.; Kaimainen, M.; Hopia, A. Concentration of umami compounds in pork meat and cooking juice with different cooking times and temperatures. J. Food Sci. 2015, 80, C2711–C2716. [Google Scholar] [CrossRef]
  61. Roldán, M.; Antequera, T.; Armenteros, M.; Ruiz, J. Effect of different temperature-time combinations on lipid and protein oxidation of sous-vide cooked lamb loins. Food Chem. 2014, 149, 129–136. [Google Scholar] [CrossRef]
  62. Souza, C.M.; Boler, D.D.; Clark, D.L.; Kutzler, L.W.; Holmer, S.F.; Summerfield, J.W.; Cannon, J.E.; Smit, N.R.; McKeith, F.K.; Killefer, J. The effects of high pressure processing on pork quality, palatability, and further processed products. Meat Sci. 2011, 87, 419–427. [Google Scholar] [CrossRef] [PubMed]
Table 1. Cooking loss, moisture content, water activity and pH value of sous vide cooked pork loin (mean ± SEM).
SampleCooking Loss (%)Moisture Content (%)Water Activity (-)pH (-)
Raw pork loinnd72.45 ± 0.34 i0.993 ± 0.001 a5.78 ± 0.01 a
60 °C
2 h18.16 ± 1.07 a68.91 ± 0.28 h0.995 ± 0.003 a5.80 ± 0.37 a
3 h21.13 ± 1.12 abc67.54 ± 0.58 fgh0.993 ± 0.002 a5.81 ± 0.10 a
4 h22.46 ± 1.05 bc67.50 ± 0.41 fgh0.991 ± 0.004 a5.80 ± 0.10 a
65 °C
2 h19.55 ± 0.46 ab68.16 ± 0.20 gh0.993 ± 0.002 a5.81 ± 0.22 a
3 h24.41 ± 0.54 cd66.90 ± 0.11 efg0.993 ± 0.002 a5.82 ± 0.11 a
4 h29.64 ± 0.74 def66.31 ± 0.14 defg0.994 ± 0.001 a5.80 ± 0.07 a
70 °C
1 h25.21 ± 1.52 cde65.91 ± 0.37 cdef0.993 ± 0.003 a5.84 ± 0.17 a
1.5 h28.79 ± 0.46 def64.00 ± 0.28 abc0.994 ± 0.001 a5.86 ± 0.02 a
2 h30.58 ± 0.43 f65.27 ± 0.34 cde0.995 ± 0.002 a5.85 ± 0.14 a
75°C
1 h29.05 ± 1.06 ef64.90 ± 0.29 bcd0.994 ± 0.002 a5.88 ± 0.09 a
1.5 h31.61 ± 0.54 fg63.24 ± 0.53 ab0.994 ± 0.003 a5.90 ± 0.03 a
2 h36.66 ± 0.63 g62.32 ± 0.70 a0.994 ± 0.001 a5.91 ± 0.01 a
Level of significance
Temperature******NSNS
Time******NSNS
Temperature × time interaction*NSNSNS
a, b, c, d, e, f, g, h, i—mean values in columns with different superscripts differ significantly at p < 0.05 according to the Turkey’s test; * p < 0.05; *** p < 0.001; NS-not significant; nd–not determined.
Table 2. CIE L*a*b* colour parameters of sous vide cooked pork loin (mean ± SEM).
SampleColour L*Colour a*Colour b*Chroma C*Hue Angle E*
Raw pork loin54.72 ± 0.8 b8.35 ± 0.33 b5.30 ± 0.22 d9.89 ± 0.44 c32.40 ± 0.79 cnd
60 °C
2 h70.16 ± 1.05 a7.45 ± 0.20 a14.60 ± 0.12 c15.59 ± 0.15 ab59.71 ± 0.61 ab21.20
3 h70.05 ± 1.01 a7.53 ± 0.18 a14.72 ± 0.10 c15.93 ± 0.11 ab60.88 ± 0.58 ab21.28
4 h70.61 ± 0.71 a7.44 ± 0.06 a14.65 ± 0.21 c15.44 ± 0.19 a60.41 ± 0.38 a19.44
65 °C
2 h70.68 ± 0.56 a7.45 ± 0.06 a14.59 ± 0.08 c15.58 ± 0.08 ab60.72 ± 0.18 ab25.61
3 h71.02 ± 1.05 a7.49 ± 0.43 a14.43 ± 0.36 bc15.99 ± 0.47 ab61.71 ± 1.07 ab21.92
4 h70.61 ± 0.33 a7.49 ± 0.10 a14.34 ± 0.20 abc16.04 ± 0.21 ab61.82 ± 0.34 ab18.96
70 °C
1 h70.89 ± 0.82 a7.57 ± 0.21 a14.13 ± 0.31 abc16.18 ± 0.35 ab62.41 ± 0.51 ab15.56
1.5 h70.57 ± 0.08 a7.58 ± 0.08 a14.08 ± 0.07 abc16.33 ± 0.08 ab62.93 ± 0.26 ab15.82
2 h70.81 ± 0.74 a7.62 ± 0.15 a13.58 ± 0.15 ab16.38 ± 0.17 ab62.95 ± 0.48 ab16.07
75 °C
1 h71.21 ± 0.58 a7.63 ± 0.19 a13.41 ± 0.20 a16.44 ± 0.25 ab63.00 ± 0.45 b19.68
1.5 h71.63 ± 0.94 a7.76 ± 0.20 a13.90 ± 0.11 abc16.55 ± 0.15 b62.94 ± 0.62 ab19.15
2 h71.45 ± 0.10 a7.86 ± 0.04 a13.46 ± 0.09 abc16.41 ± 0.09 ab63.03 ± 0.19 b17.01
Level of significance
TemperatureNSNS*********nd
TimeNSNS******nd
Temperature × time interactionNSNSNSNSNSnd
a, b, c, d—mean values in columns with different superscripts differ significantly at p < 0.05 according to the Turkey’s test; * p < 0.05; ** p < 0.01; *** p < 0.001; NS—not significant; nd—not determined.
Table 3. Texture characteristics of sous vide cooked pork loin on the basis of shear force and TPA test (mean ± SEM).
SampleShear Force [N]Hardness [N]Springiness [cm]Cohesiveness [-]Chewiness [N × cm]
60 °C
2 h23.80 ± 0.95 ef60.26 ± 3.33 a0.50 ± 0.01 abc0.56 ± 0.01 de17.51 ± 0.01 ab
3 h17.63 ± 1.70 abcd58.84 ± 3.67 a0.46 ± 0.01 ab0.51 ± 0.01 ab16.00 ± 0.01 ab
4 h25.61 ± 0.68 f54.77 ± 4.19 a0.46 ± 0.02 ab0.51 ± 0.02 a13.65 ± 0.01 a
65 °C
2 h18.24 ± 1.39 bcd79.29 ± 4.06 bcde0.53 ± 0.01 cd0.57 ± 0.01 cd24.01 ± 0.01 cde
3 h13.29 ± 1.01 a71.12 ± 4.23 abc0.51 ± 0.01 abcd0.59 ± 0.01 def21.19 ± 0.01 bcd
4 h19.95 ± 0.52 cde72.91 ± 2.85 abcd0.45 ± 0.01 a0.52 ± 0.01 abc17.34 ± 0.01 abc
70 °C
1 h22.47 ± 1.30 def69.20 ± 2.22 ab0.52 ± 0.01 bcd0.60 ± 0.00 def21.32 ± 0.01 bcd
1.5 h18.40 ± 1.19 abcd90.11 ± 3.46 cdef0.49 ± 0.01 abc0.55 ± 0.01 abcd24.14 ± 0.01 bcde
2 h14.66 ± 0.53 ab90.04 ± 2.92 def0.53 ± 0.01 cd0.60 ± 0.01 def28.13 ± 0.01 def
75 °C
1 h21.97 ± 1.20 def95.29 ± 5.68 ef0.57 ± 0.01 d0.62 ± 0.01 ef34.34 ± 0.01 f
1.5 h17.98 ± 0.36 abcd121.84 ± 5.42 g0.57 ± 0.01 d0.64 ± 0.01 f45.22 ± 0.00 g
2 h14.61 ± 0.44 abc107.46 ± 3.28 fg0.51 ± 0.01 abcd0.56 ± 0.01 bcd31.85 ± 0.01 ef
Level of significance
Temperature***************
Time***************
Temperature × time interactionNSNS*********
a, b, c, d, e, f, g—mean values in columns with different superscripts differ significantly at p < 0.05 according to the Turkey’s test; *** p < 0.001; NS—not significant.
Table 4. The microflora of raw and sous vide cooked pork loin (mean ± SEM).
SampleTotal Mesophilic MicroorganismsCoagulase-Positive StaphylococciEnterobacteriaceaeSalmonella spp.Listeria Monocytogenes
[log cfu/g]Presence in 25 g
Raw pork loin3.59 ± 0.21 c1.95 ± 0.26 b3.07 ± 0.09 bNPNP
60 °C
2 h1.79 ± 0.16 a<1.00 a<1.00 aNPNP
3 h1.33 ± 0.45 a<1.00 a<1.00 aNPNP
4 h2.01 ± 0.79 b<1.00 a<1.00 aNPNP
65 °C
2 h1.43 ± 0.31 a<1.00 a<1.00 aNPNP
3 h1.16 ± 0.22 a<1.00 a<1.00 aNPNP
4 h1.20 ± 0.16 a<1.00 a<1.00 aNPNP
70 °C
1 h1.65 ± 0.40 a<1.00 a<1.00 aNPNP
1.5 h1.73 ± 0.04 a<1.00 a<1.00 aNPNP
2 h1.10 ± 0.14 a<1.00 a<1.00 aNPNP
75 °C
1 h1.30 ± 0.25 a<1.00 a<1.00 aNPNP
1.5 h1.43 ± 0.31 a<1.00 a<1.00 aNPNP
2 h1.10 ± 0.14 a<1.00 a<1.00 aNPNP
a, b, c—mean values in columns with different superscripts differ significantly at p < 0.05 according to the Turkey’s test; NP—not present.
Table 5. Sensory attributes of sous vide cooked pork loin (mean ± SEM).
SampleOverall Appearance 1Colour Uniformity 2Aroma Intensity 3Tenderness 4Juiciness 5Meat Flavour Intensity 3Flavour Acceptability 1Overall Acceptability 1
60 °C
2 h7.79 ± 0.33 a8.36 ± 0.27 abc6.79 ± 0.46 a6.14 ± 0.38 abc7.43 ± 0.25 d6.86 ± 0.31 a7.50 ± 0.20 ab7.36 ± 0.27 ab
3 h8.29 ± 0.19 ab8.14 ± 0.35 abc7.29 ± 0.37 a6.50 ± 0.59 abc6.57 ± 0.42 cd7.64 ± 0.41 ab8.14 ± 0.21 b7.79 ± 0.15 ab
4 h8.71 ± 0.24 ab7.79 ± 0.46 ab7.64 ± 0.60 a7.00 ± 0.51 bc6.43 ± 0.44 bcd8.64 ± 0.27 b8.43 ± 0.33 b8.14 ± 0.35 b
65 °C
2 h8.23 ± 0.20 ab7.77 ± 0.26 ab7.15 ± 0.32 a7.00 ± 0.28 bc6.54 ± 0.40 bcd7.23 ± 0.38 ab7.23 ± 0.36 ab7.08 ± 0.35 ab
3 h8.00 ± 0.23 a7.46 ± 0.31 a7.77 ± 0.32 a6.15 ± 0.62 abc4.54 ± 0.57 abc7.85 ± 0.30 ab6.85 ± 0.48 ab6.69 ± 0.43 ab
4 h9.17 ± 0.21 b9.33 ± 0.19 c8.33 ± 0.26 a8.17 ± 0.53 c6.42 ± 0.53 bcd8.50 ± 0.40 ab7.08 ± 0.38 ab7.25 ± 0.49 ab
70 °C
1 h7.81 ± 0.23 a7.94 ± 0.30 abc6.88 ± 0.40 a6.31 ± 0.37 abc5.56 ± 0.52 abcd7.94 ± 0.21 ab7.25 ± 0.50 ab6.50 ± 0.41 ab
1.5 h8.92 ± 0.23 ab9.08 ± 0.26 bc8.08 ± 0.26 a7.00 ± 0.49 abc6.17 ± 0.42 bcd8.25 ± 0.35 ab7.17 ± 0.34 ab7.33 ± 0.31 ab
2 h8.27 ± 0.14 ab8.55 ± 0.25 abc7.64 ± 0.31 a6.00 ± 0.62 abc5.36 ± 0.51 abcd7.82 ± 0.35 ab6.64 ± 0.43 ab6.36 ± 0.53 ab
75 °C
1 h8.07 ± 0.21 ab8.53 ± 0.19 abc7.33 ± 0.40 a4.67 ± 0.41 a4.40 ± 0.46 ab7.40 ± 0.40 ab6.67 ± 0.54 ab6.33 ± 0.47 ab
1.5 h7.93 ± 0.27 a8.20 ± 0.24 abc7.80 ± 0.30 a5.00 ± 0.52 ab3.80 ± 0.43 a7.93 ± 0.32 ab6.80 ± 0.60 ab6.20 ± 0.55 a
2 h8.67 ± 0.19 ab9.00 ± 0.21 bc7.67 ± 0.41 a5.50 ± 0.54 ab4.58 ± 0.53 abc8.08 ± 0.36 ab6.00 ± 0.44 a6.00 ± 0.49 a
Level of significance
TemperatureNSNSNS******NS******
Time***NSNS******NS*
Temperature × time interaction*****NSNSNSNSNSNS
a, b, c, d—mean values in columns, with different superscripts differ significantly at p < 0.05 according to the Turkey’s test; * p < 0.05; ** p < 0.01; *** p < 0.001; NS—not significant; Scale 1 (0—not acceptable, 10—very acceptable); Scale 2 (0—not uniform, 10—highly uniform); Scale 3 (0—not detectable, 10—very intense); Scale 4 (0—tough, 10—tender); Scale 5 (0—low, 10—very high).
Table 6. Correlation coefficients between selected attributes of sous vide cooked pork loin.
AttributeMoisture ContentShear ForceHardnessChewinessSpringinessCohesivinessTendernessJuicinessOverall Acceptability
Cooking loss−0.031−0.1570.369 ***0.411 ***0.280 **0.316 ***−0.172−0.322 ***−0.275 **
Moisture content-0.261 **−0.150−0.193−0.216 *−0.160−0.153−0.0440.016
Shear force--−0.077−0.064−0.131 *−0.212 ***0.0560.0680.122
Hardness---0.588 ***0.392 ***0.336 ***−0.156 *−0.162 *−0.197 *
Chewiness----0.512 ***0.504 ***−0.162 *−0.219 **−0.312 ***
Springiness-----0.583 ***0.008−0.092−0.200 *
Cohesiviness------−0.090−0.091−0.240 **
Tenderness-------0.617 ***0.561 ***
Juiciness--------0.662 ***
* p < 0.05, ** p < 0.01, *** p < 0.001.
Publisher’s Note: MDPI stays neutral with regard to jurisdictional claims in published maps and institutional affiliations.

