
Peak Energy Reduction in Flow Shop including Switch-Off Policies and Battery Storage


Abstract
:1. Introduction and Motivations
2. Literature Review
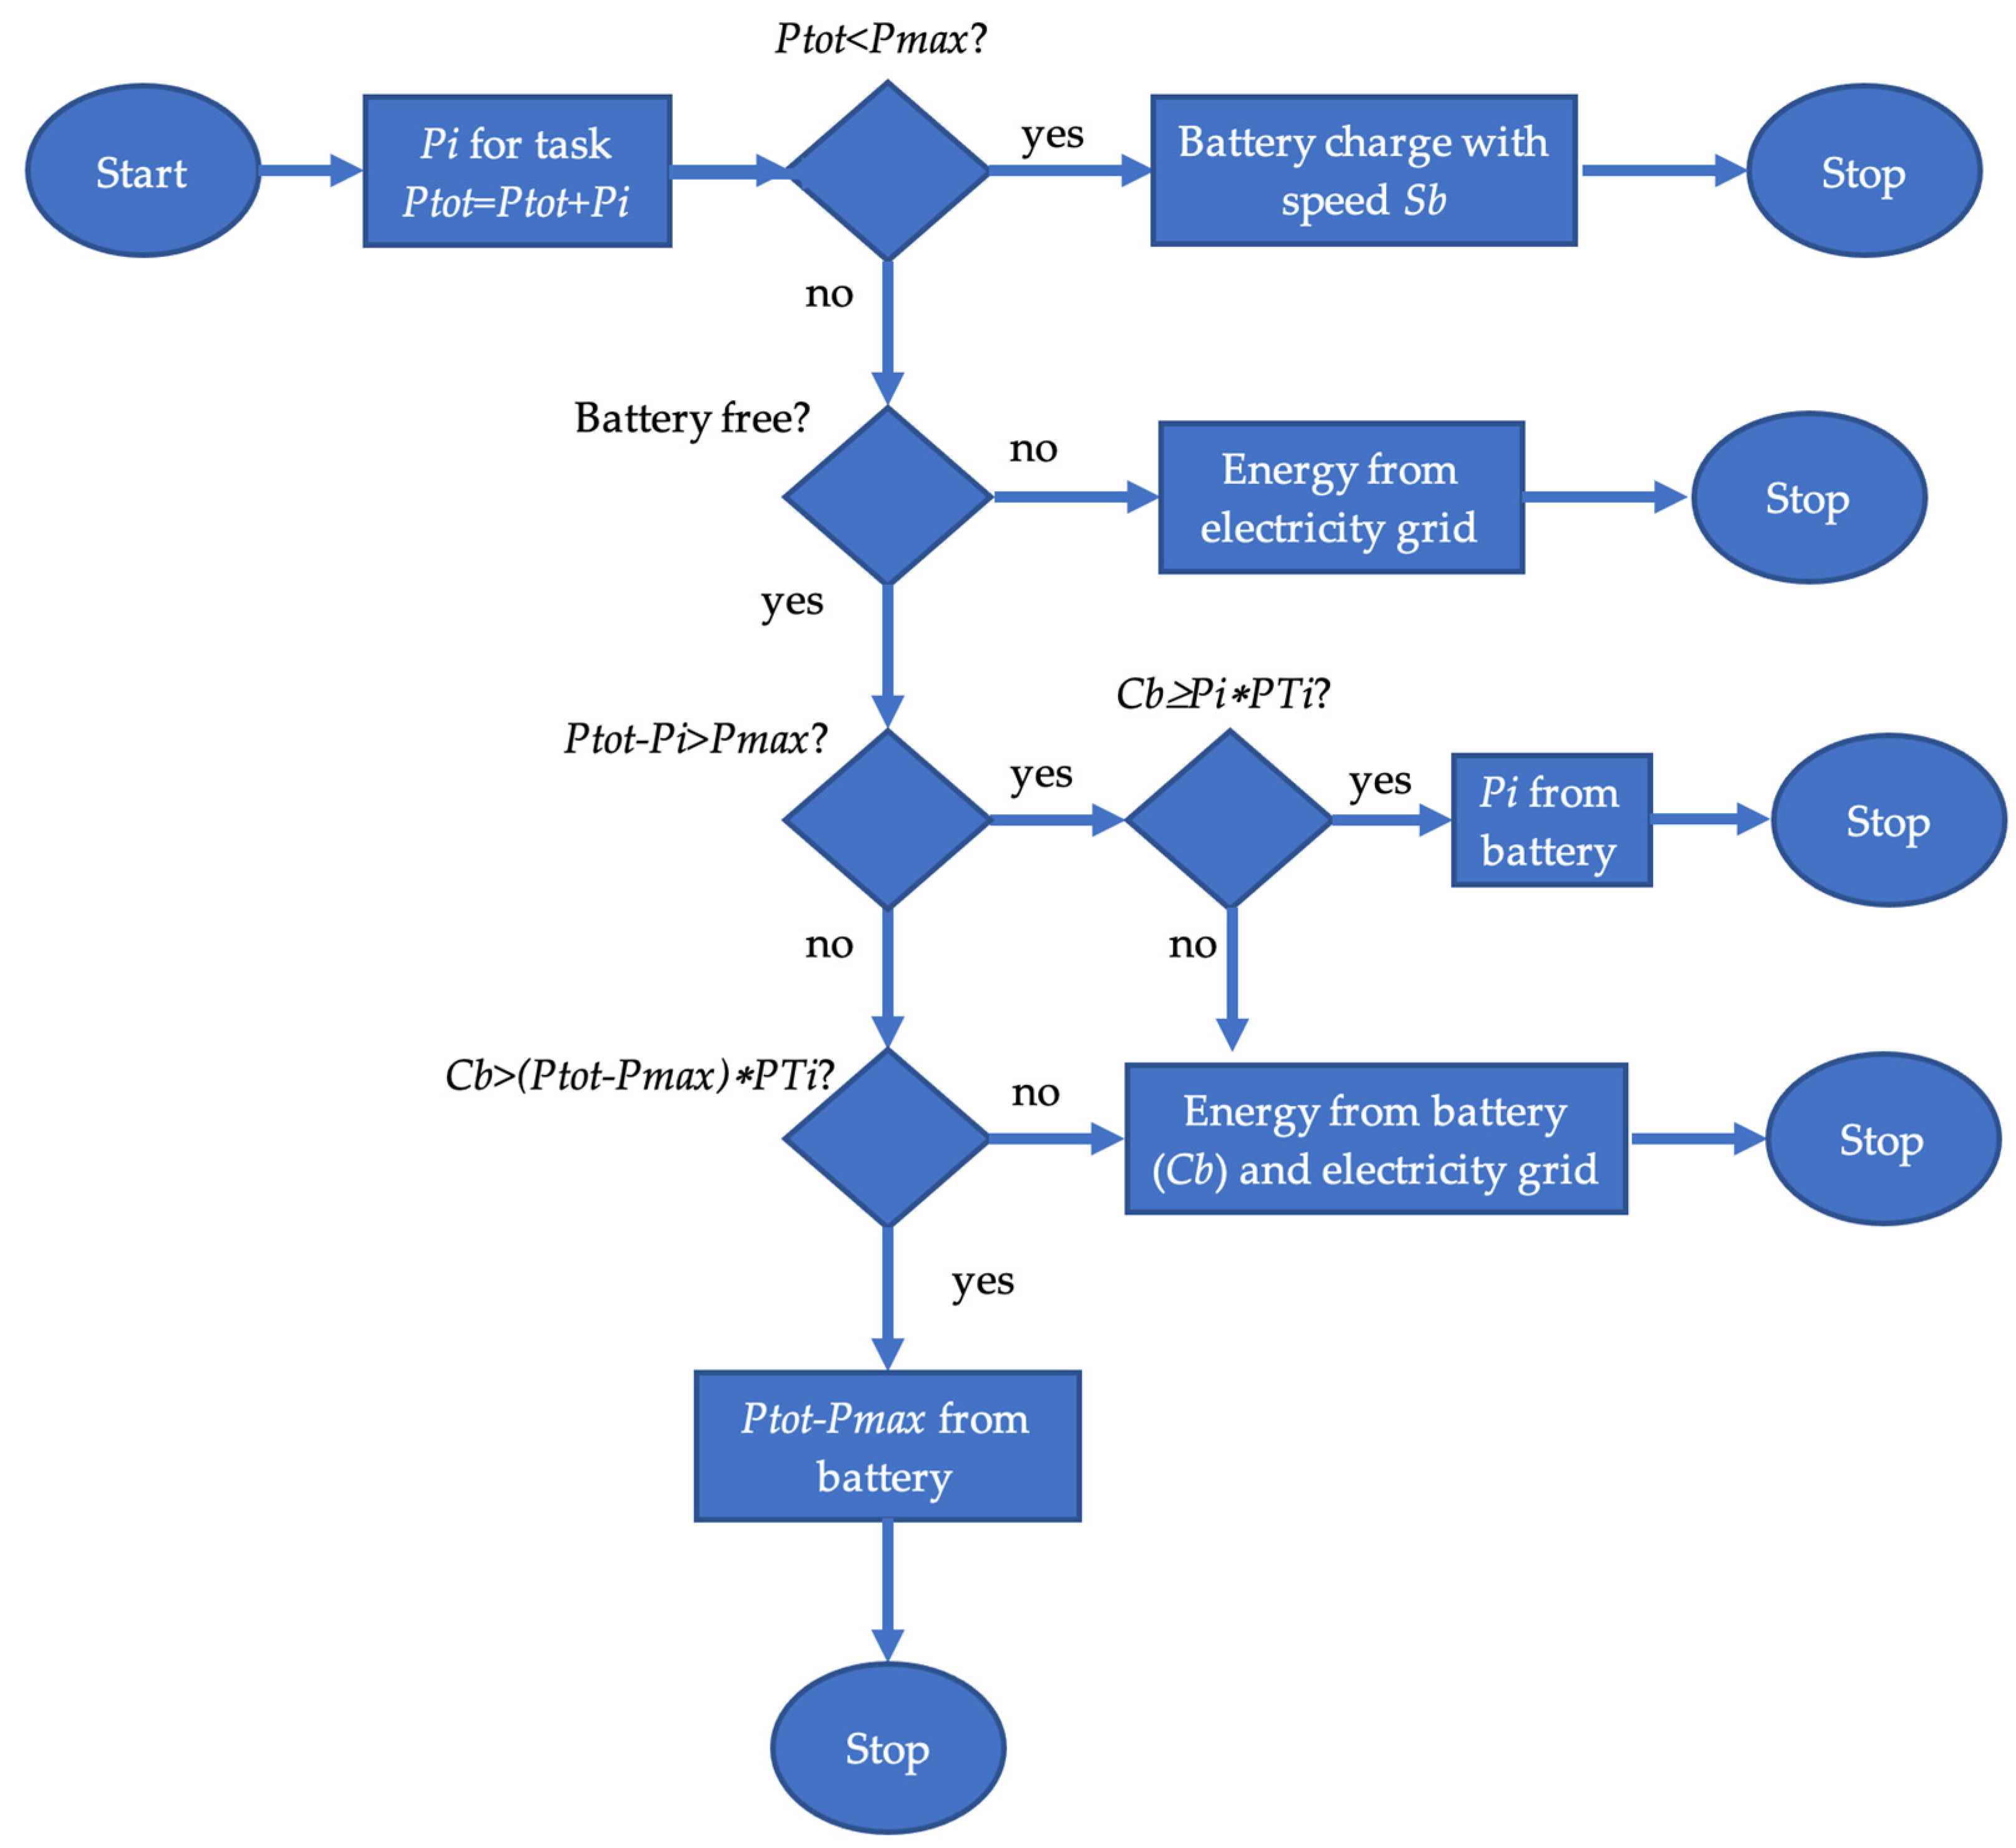
3. Reference Context and Proposed Approach
4. Simulation Experiments
- -
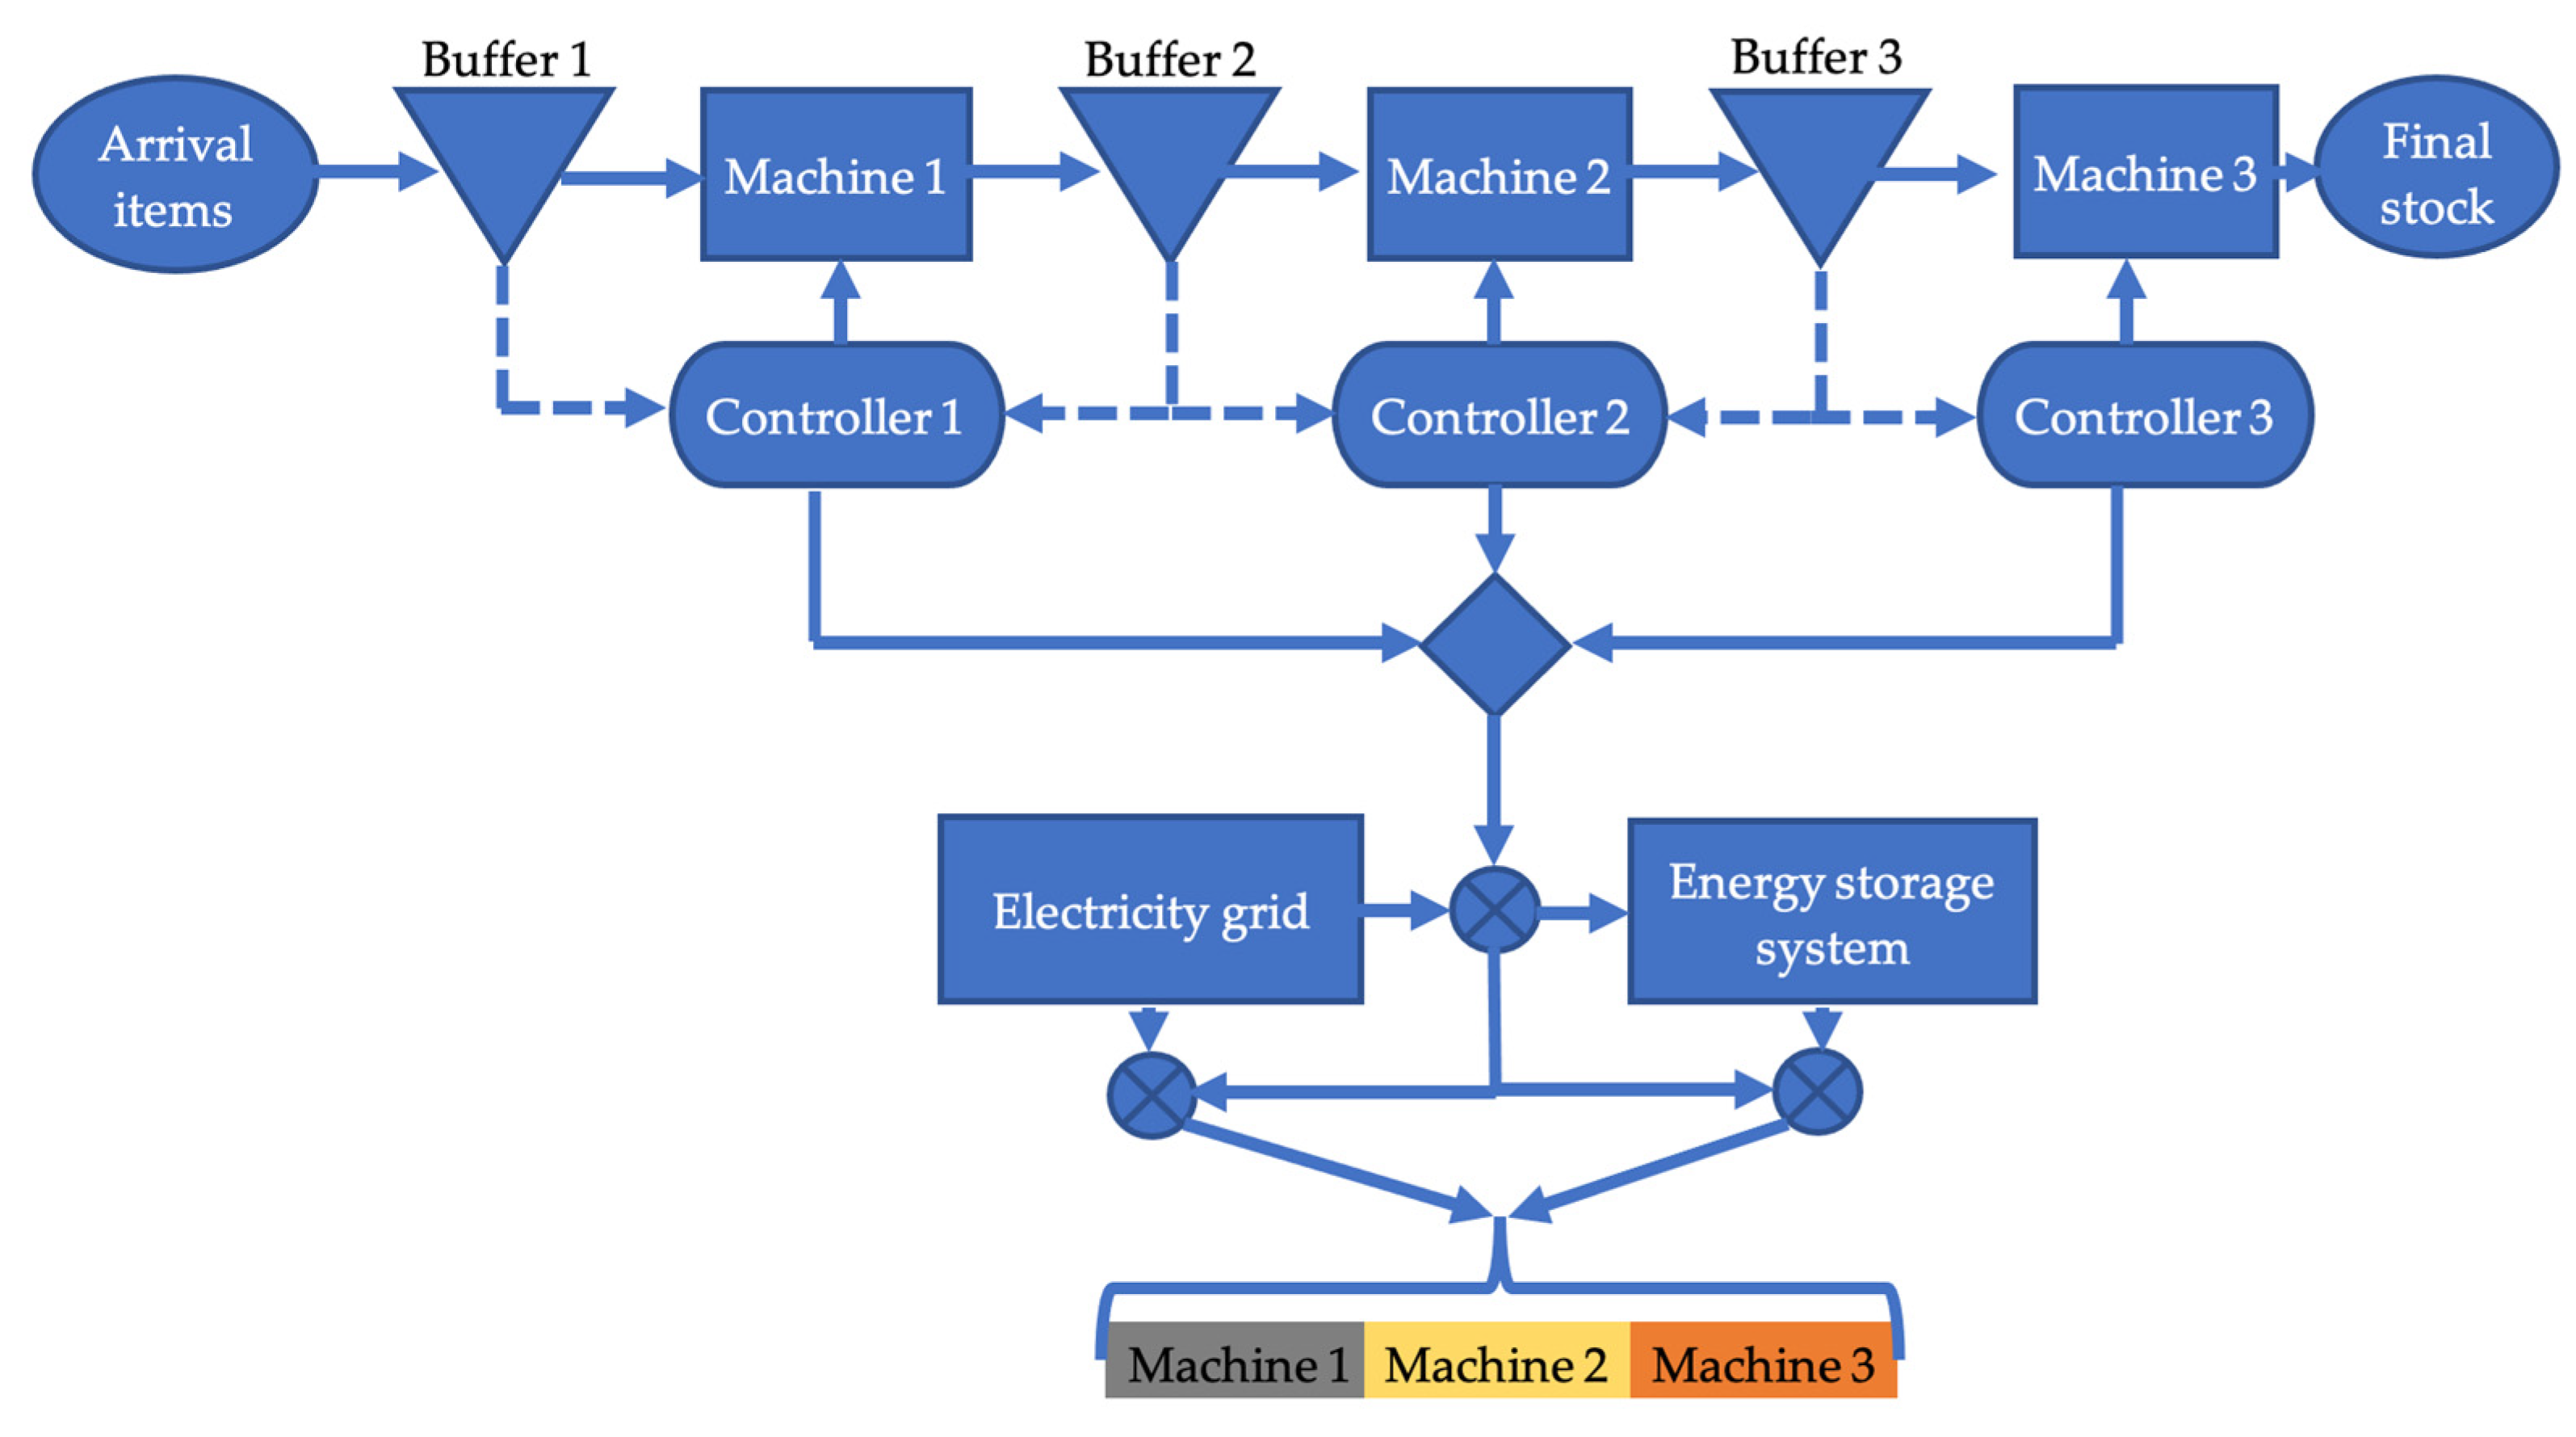
- The flow line with machines and buffers that emulates the physical manufacturing system;
- -
- each machine has a controller that performs the activities described in the previous section;
- -
- the electricity grid where the information of the controllers defines the electricity load;
- -
- the energy storage system that is charged by the electricity grid and support the machines based on the decisions of the controllers;
- -
- the integration of the electricity grid and the energy storage system to provide the energy to the machines.
- -
- machines always on;
- -
- machines with upstream policy;
- -
- machines with the upstream and downstream policy.
- -
- Upstream policy considers one item to switch off and 3 items to switch on in the upstream buffer;
- -
- Upstream and downstream policy considers the same parameters of the upstream policy and one item to switch on and 3 items to switch off in the downstream buffer.
- -
- Throughput of the manufacturing system; this performance is monitored to obtain the same throughput level of the models studied;
- -
- The energy used over the peak power constraint (energy peak); this performance allows to evaluate the penalty costs;
- -
- The peak power as the maximum value of the electricity grid load;
- -
- Average electricity grid utilization to evaluate the uniformity of the load on the electricity grid;
- -
- The average battery utilization and the percentage capacity use of the battery.
5. Numerical Analysis
- -
- The introduction of the battery reduces drastically the energy used over the peak power; moreover, the introduction of the battery leads to a more uniform load of the electricity grid.
- -
- The switch-off policy allows to further reduce this part of energy. The introduction of the switch allows to improve this performance with lower battery performance and therefore with lower costs. The UP&D policy performs better when the power fluctuation is higher. The switch-off policy improves the performance when the charging speed is slow.
- -
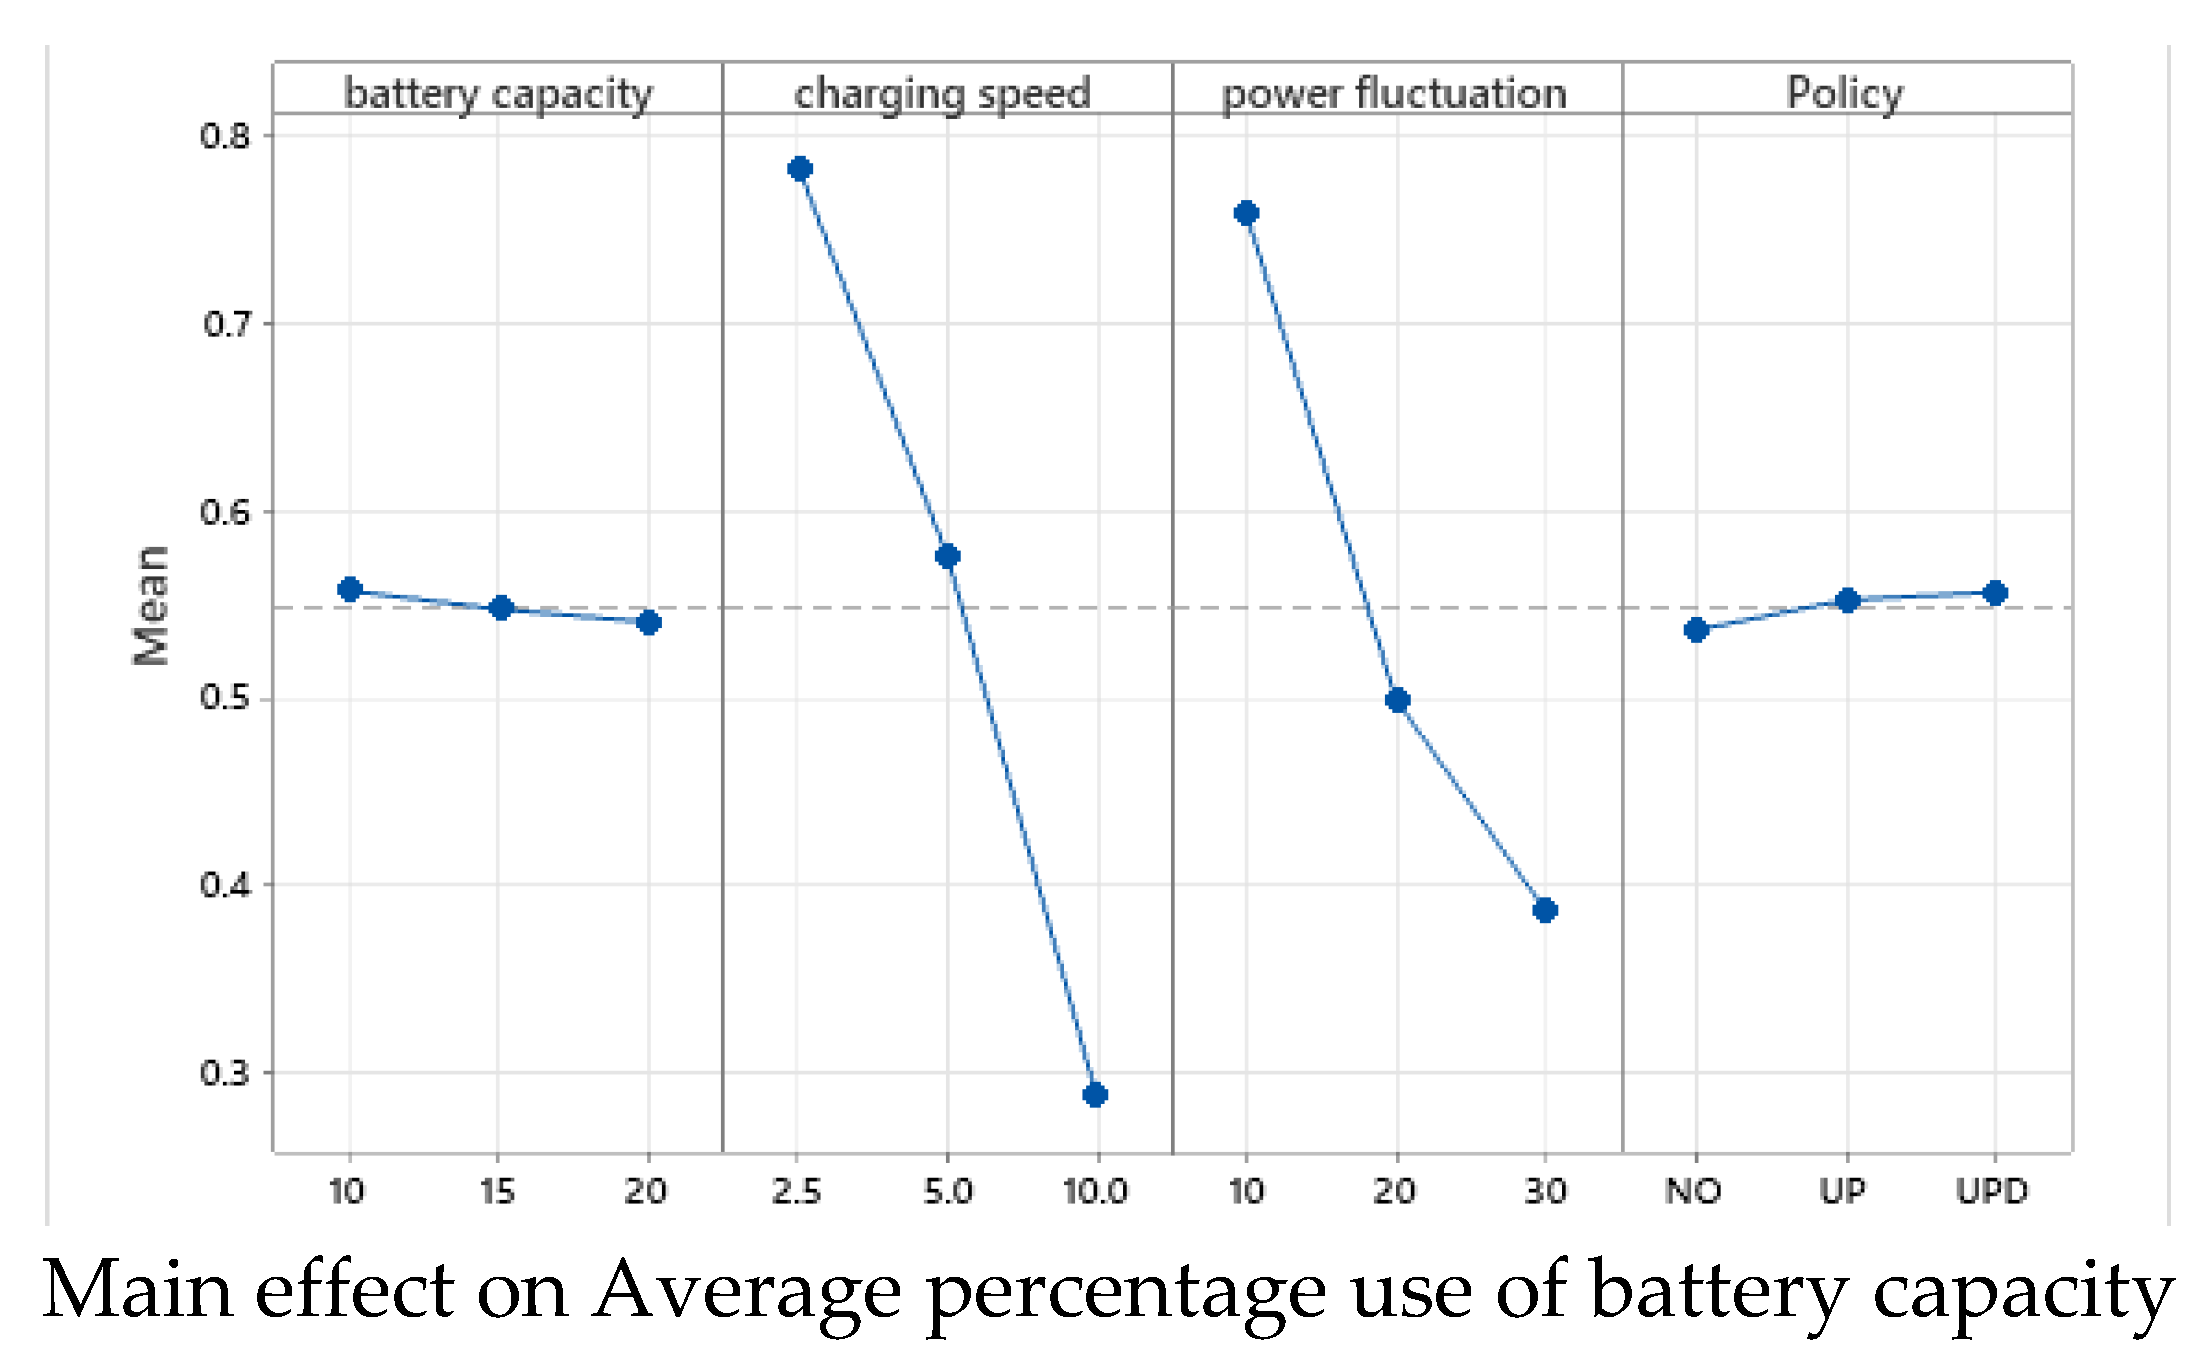
- The charge rate and power fluctuation are the more important factors; moreover, these factors are relevant for the average utilization of the battery. Therefore, the definition of these parameters can affect the deterioration of the battery over the medium horizon.
6. Conclusions and Future Development
Author Contributions
Funding
Institutional Review Board Statement
Informed Consent Statement
Data Availability Statement
Acknowledgments
Conflicts of Interest
Appendix A

| Battery vs. No Battery | |||
|---|---|---|---|
| Power 10% | |||
| Battery capacity→ | |||
| Charging speed↓ | 10 | 15 | 20 |
| 10 | −58.14% | −59.94% | −60.91% |
| 5 | −71.02% | −71.02% | −71.74% |
| 2.5 | −70.92% | −71.04% | −71.29% |
| Power 20% | |||
| Battery capacity→ | |||
| Charging speed↓ | 10 | 15 | 20 |
| 10 | −38.19% | −41.58% | −40.99% |
| 5 | −62.41% | −64.81% | −66.53% |
| 2.5 | −76.49% | −80.58% | −81.70% |
| Power 30% | |||
| Battery capacity→ | |||
| Charging speed↓ | 10 | 15 | 20 |
| 10 | −28.67% | −29.27% | −30.07% |
| 5 | −46.79% | −50.45% | −51.41% |
| 2.5 | −65.03% | −71.86% | −75.63% |
| Exp. No. | Battery Capacity | Charge Rate | Power Variability | Switch-Off Policy | Energy Over Peak | Average Grid Utilization | Peak Grid Power | Battery Utilization |
|---|---|---|---|---|---|---|---|---|
| 1 | 10 | 10 | 10 | NO | 15,487.78 | 53.52 | 65.48 | 4.45 |
| 2 | 15 | 10 | 10 | NO | 14,821.92 | 53.47 | 65.44 | 6.36 |
| 3 | 20 | 10 | 10 | NO | 14,464.80 | 53.46 | 65.41 | 8.26 |
| 4 | 10 | 5 | 10 | NO | 10,724.26 | 53.30 | 64.10 | 8.20 |
| 5 | 15 | 5 | 10 | NO | 10,721.66 | 53.30 | 62.72 | 12.97 |
| 6 | 20 | 5 | 10 | NO | 10,457.28 | 53.29 | 61.14 | 17.70 |
| 7 | 10 | 2.5 | 10 | NO | 10,759.10 | 53.29 | 61.46 | 9.29 |
| 8 | 15 | 2.5 | 10 | NO | 10,714.18 | 53.28 | 60.04 | 14.29 |
| 9 | 20 | 2.5 | 10 | NO | 10,620.86 | 53.28 | 60.00 | 19.19 |
| 10 | 10 | 10 | 20 | NO | 34,001.28 | 53.43 | 71.23 | 2.64 |
| 11 | 15 | 10 | 20 | NO | 32,135.33 | 53.39 | 71.22 | 3.34 |
| 12 | 20 | 10 | 20 | NO | 32,462.21 | 53.38 | 71.21 | 3.97 |
| 13 | 10 | 5 | 20 | NO | 20,674.94 | 52.91 | 70.59 | 4.95 |
| 14 | 15 | 5 | 20 | NO | 19,357.92 | 52.81 | 70.50 | 6.95 |
| 15 | 20 | 5 | 20 | NO | 18,412.70 | 52.76 | 70.45 | 8.87 |
| 16 | 10 | 2.5 | 20 | NO | 12,932.35 | 52.55 | 69.68 | 7.32 |
| 17 | 15 | 2.5 | 20 | NO | 10,684.22 | 52.45 | 69.02 | 11.51 |
| 18 | 20 | 2.5 | 20 | NO | 10,064.74 | 52.41 | 68.29 | 15.89 |
| 19 | 10 | 10 | 30 | NO | 53,500.03 | 53.41 | 76.92 | 2.25 |
| 20 | 15 | 10 | 30 | NO | 53,051.90 | 53.38 | 76.92 | 2.73 |
| 21 | 20 | 10 | 30 | NO | 52,449.98 | 53.35 | 76.92 | 3.14 |
| 22 | 10 | 5 | 30 | NO | 39,907.87 | 52.80 | 76.30 | 3.96 |
| 23 | 15 | 5 | 30 | NO | 37,167.26 | 52.71 | 76.26 | 5.15 |
| 24 | 20 | 5 | 30 | NO | 36,446.69 | 52.65 | 76.24 | 6.23 |
| 25 | 10 | 2.5 | 30 | NO | 26,228.45 | 52.22 | 75.55 | 6.03 |
| 26 | 15 | 2.5 | 30 | NO | 21,108.67 | 52.00 | 75.30 | 8.93 |
| 27 | 20 | 2.5 | 30 | NO | 18,281.66 | 51.88 | 75.08 | 11.87 |
| 28 | 10 | 10 | 10 | UP | 13,950.72 | 53.45 | 65.47 | 4.70 |
| 29 | 15 | 10 | 10 | UP | 13,303.30 | 53.41 | 65.41 | 6.83 |
| 30 | 20 | 10 | 10 | UP | 12,942.72 | 53.38 | 65.39 | 8.95 |
| 31 | 10 | 5 | 10 | UP | 9851.90 | 53.26 | 63.94 | 8.34 |
| 32 | 15 | 5 | 10 | UP | 9628.99 | 53.25 | 62.40 | 13.16 |
| 33 | 20 | 5 | 10 | UP | 9732.96 | 53.26 | 60.87 | 17.89 |
| 34 | 10 | 2.5 | 10 | UP | 9581.47 | 53.25 | 61.23 | 9.35 |
| 35 | 15 | 2.5 | 10 | UP | 9809.57 | 53.25 | 60.04 | 14.34 |
| 36 | 20 | 2.5 | 10 | UP | 9802.08 | 53.25 | 60.00 | 19.23 |
| 37 | 10 | 10 | 20 | UP | 31,786.85 | 53.37 | 71.22 | 2.81 |
| 38 | 15 | 10 | 20 | UP | 30,857.18 | 53.33 | 71.21 | 3.61 |
| 39 | 20 | 10 | 20 | UP | 30,343.68 | 53.30 | 71.21 | 4.33 |
| 40 | 10 | 5 | 20 | UP | 19,221.98 | 52.85 | 70.51 | 5.13 |
| 41 | 15 | 5 | 20 | UP | 17,640.29 | 52.76 | 70.43 | 7.29 |
| 42 | 20 | 5 | 20 | UP | 16,418.88 | 52.71 | 70.36 | 9.38 |
| 43 | 10 | 2.5 | 20 | UP | 12,159.36 | 52.52 | 69.54 | 7.43 |
| 44 | 15 | 2.5 | 20 | UP | 10,495.01 | 52.41 | 68.82 | 11.70 |
| 45 | 20 | 2.5 | 20 | UP | 9298.66 | 52.39 | 68.03 | 16.13 |
| 46 | 10 | 10 | 30 | UP | 48,734.21 | 53.35 | 76.91 | 2.41 |
| 47 | 15 | 10 | 30 | UP | 48,320.06 | 53.30 | 76.90 | 2.97 |
| 48 | 20 | 10 | 30 | UP | 47,577.31 | 53.28 | 76.90 | 3.43 |
| 49 | 10 | 5 | 30 | UP | 35,508.38 | 52.75 | 76.23 | 4.12 |
| 50 | 15 | 5 | 30 | UP | 33,134.69 | 52.64 | 76.19 | 5.43 |
| 51 | 20 | 5 | 30 | UP | 33,224.26 | 52.59 | 76.16 | 6.62 |
| 52 | 10 | 2.5 | 30 | UP | 23,346.43 | 52.19 | 75.44 | 6.16 |
| 53 | 15 | 2.5 | 30 | UP | 19,425.60 | 51.97 | 75.18 | 9.15 |
| 54 | 20 | 2.5 | 30 | UP | 17,107.20 | 51.85 | 74.94 | 12.21 |
| 55 | 10 | 10 | 10 | UPD | 12,900.10 | 53.34 | 65.20 | 5.06 |
| 56 | 15 | 10 | 10 | UPD | 12,056.26 | 53.31 | 65.12 | 7.27 |
| 57 | 20 | 10 | 10 | UPD | 11,716.13 | 53.29 | 65.07 | 9.31 |
| 58 | 10 | 5 | 10 | UPD | 10,317.89 | 53.22 | 63.22 | 8.62 |
| 59 | 15 | 5 | 10 | UPD | 10,365.98 | 53.22 | 60.94 | 13.55 |
| 60 | 20 | 5 | 10 | UPD | 10,113.98 | 53.22 | 60.12 | 18.36 |
| 61 | 10 | 2.5 | 10 | UPD | 10,129.82 | 53.21 | 60.72 | 9.37 |
| 62 | 15 | 2.5 | 10 | UPD | 10,110.24 | 53.22 | 60.01 | 14.37 |
| 63 | 20 | 2.5 | 10 | UPD | 10,143.07 | 53.21 | 60.00 | 19.28 |
| 64 | 10 | 10 | 20 | UPD | 27,890.50 | 53.26 | 71.09 | 2.45 |
| 65 | 15 | 10 | 20 | UPD | 27,611.42 | 53.23 | 71.08 | 2.79 |
| 66 | 20 | 10 | 20 | UPD | 27,270.72 | 53.23 | 71.07 | 3.07 |
| 67 | 10 | 5 | 20 | UPD | 17,529.41 | 52.69 | 70.27 | 5.39 |
| 68 | 15 | 5 | 20 | UPD | 14,987.81 | 52.60 | 70.09 | 7.84 |
| 69 | 20 | 5 | 20 | UPD | 13,716.29 | 52.55 | 69.95 | 10.19 |
| 70 | 10 | 2.5 | 20 | UPD | 11,439.36 | 52.45 | 69.15 | 7.62 |
| 71 | 15 | 2.5 | 20 | UPD | 9792.29 | 52.36 | 68.05 | 12.12 |
| 72 | 20 | 2.5 | 20 | UPD | 9072.58 | 52.35 | 66.59 | 16.79 |
| 73 | 10 | 10 | 30 | UPD | 45,658.08 | 53.24 | 76.74 | 2.01 |
| 74 | 15 | 10 | 30 | UPD | 44,876.16 | 53.23 | 76.74 | 2.21 |
| 75 | 20 | 10 | 30 | UPD | 45,399.17 | 53.22 | 76.73 | 2.38 |
| 76 | 10 | 5 | 30 | UPD | 31,851.36 | 52.57 | 76.02 | 4.14 |
| 77 | 15 | 5 | 30 | UPD | 29,591.14 | 52.45 | 75.94 | 5.31 |
| 78 | 20 | 5 | 30 | UPD | 28,547.42 | 52.40 | 75.90 | 6.20 |
| 79 | 10 | 2.5 | 30 | UPD | 20,074.46 | 52.06 | 75.14 | 6.32 |
| 80 | 15 | 2.5 | 30 | UPD | 15,473.66 | 51.82 | 74.70 | 9.60 |
| 81 | 20 | 2.5 | 30 | UPD | 13,120.13 | 51.70 | 74.25 | 13.08 |
References
- Ritchie, H.; Roser, M. CO2 and Greenhouse Gas Emissions. Our World in Data. 2020. Available online: https://ourworldindata.org/co2-and-other-greenhouse-gas-emissions (accessed on 24 January 2022).
- IRENA. Reaching Zero with Renewables: Eliminating CO2 Emissions from Industry and Transport in Line with the 1.50C Climate Goal. Abu Dhabi, 2020. Available online: https://www.irena.org/publications/2020/Sep/Reaching-Zero-with-Renewables (accessed on 24 January 2022).
- Gutowski, T.; Dahmus, J.; Thiriez, A. Electrical energy requirements for manufacturing processes. In Proceedings of the 13th CIRP International Conference on Life Cycle Engineering, Leuven, Belgium, 31 May–2 June 2006; pp. 623–628. [Google Scholar]
- Chen, C.-Y.; Liao, C.-J. A linear programming approach to the electricity contract capacity problem. Appl. Math. Model. 2011, 35, 4077–4082. [Google Scholar] [CrossRef]
- McLaren, J.; Gagnon, P.; Zimny-Schmitt, D.; DeMinco, M.; Wilson, E. Maximum Demand Charge Rates for Commercial and Industrial Electricity Tariffs in the United States; National Renewable Energy Laboratory, 2017. Available online: https://data.nrel.gov/submissions/74 (accessed on 6 January 2022).
- Zubi, G.; Dufo-López, R.; Carvalho, M.; Pasaoglu, G. The lithium-ion battery: State of the art and future perspectives. Renew. Sustain. Energy Rev. 2018, 89, 292–308. [Google Scholar] [CrossRef]
- Ahmadi, L.; Young, S.B.; Fowler, M.; Fraser, R.A.; Achachlouei, M.A. A cascaded life cycle: Reuse of electric vehicle lithium-ion battery packs in energy storage systems. Int. J. Life Cycle Assess. 2017, 22, 111–124. [Google Scholar] [CrossRef]
- Costa, C.M.; Barbosa, J.C.; Gonçalves, R.; Castro, H.; Campo, F.J.D.; Lanceros-Méndez, S. Recycling and environmental issues of lithium-ion batteries: Advances, challenges and opportunities. Energy Storage Mater. 2021, 37, 433–465. [Google Scholar] [CrossRef]
- Renna, P.; Materi, S. A Literature Review of Energy Efficiency and Sustainability in Manufacturing Systems. Appl. Sci. 2021, 11, 7366. [Google Scholar] [CrossRef]
- Islam, M.M.; Nagrial, M.; Rizk, J.; Hellany, A. Dual stage microgrid energy resource optimization strategy considering renewable and battery storage systems. Int. J. Energy Res. 2021, 45, 21340–21364. [Google Scholar] [CrossRef]
- Mohammadi-Ivatloo, B.; Jabari, F. Operation, Planning, and Analysis of Energy Storage Systems in Smart Energy Hubs; Springer: Cham, Switzerland, 2018. [Google Scholar] [CrossRef]
- Materi, S.; D’Angola, A.; Enescu, D.; Renna, P. Reducing energy costs and CO2 emissions by production system energy flexibility through the integration of renewable energy. Prod. Eng. 2021, 15, 667–681. [Google Scholar] [CrossRef]
- Fernandez, M.; Li, L.; Sun, Z. “Just-for-Peak” buffer inventory for peak electricity demand reduction of manufacturing systems. Int. J. Prod. Econ. 2013, 146, 178–184. [Google Scholar] [CrossRef]
- Fang, K.; Uhan, N.A.; Zhao, F.; Sutherland, J.W. Flow shop scheduling with peak power consumption constraints. Ann. Oper. Res. 2013, 206, 115–145. [Google Scholar] [CrossRef]
- Liu, C.-H.; Nanthapodej, R.; Hsu, S.-Y. Scheduling two interfering job sets on parallel machines under peak power constraint. Prod. Eng. 2018, 12, 611–619. [Google Scholar] [CrossRef]
- Wang, J.; Wang, L. Decoding methods for the flow shop scheduling with peak power consumption constraints. Int. J. Prod. Res. 2019, 57, 3200–3218. [Google Scholar] [CrossRef]
- Sun, Z.; Li, L.; Fernandez, M.; Wang, J. Inventory control for peak electricity demand reduction of manufacturing systems considering the tradeoff between production loss and energy savings. J. Clean. Prod. 2014, 82, 84–93. [Google Scholar] [CrossRef]
- Frigerio, N.; Matta, A. Energy Efficient Control Strategy for Machine Tools with Stochastic Arrivals and Time Dependent Warm-up. Procedia CIRP 2014, 15, 56–61. [Google Scholar] [CrossRef] [Green Version]
- Frigerio, N.; Matta, A. Energy-Efficient Control Strategies for Machine Tools With Stochastic Arrivals. IEEE Trans. Autom. Sci. Eng. 2015, 12, 50–61. [Google Scholar] [CrossRef] [Green Version]
- Su, H.; Frigerio, N.; Matta, A. Energy Saving Opportunities and Value of Information: A Trade-off in a Production Line. Procedia CIRP 2016, 48, 301–306. [Google Scholar] [CrossRef] [Green Version]
- Jia, Z.; Zhang, L.; Arinez, J.; Xiao, G. Performance analysis of Bernoulli serial production lines with switch-on/off machine control. In Proceedings of the 2015 IEEE International Conference on Automation Science and Engineering (CASE), Gothenburg, Sweden, 24–28 August 2015; IEEE: Gothenburg, Sweden, 2015; pp. 477–482. [Google Scholar] [CrossRef]
- Jia, Z.; Zhang, L.; Arinez, J.; Xiao, G. Performance analysis for serial production lines with Bernoulli Machines and Real-time WIP-based Machine switch-on/off control. Int. J. Prod. Res. 2016, 54, 6285–6301. [Google Scholar] [CrossRef]
- Fei, Z.; Li, S.; Chang, Q.; Wang, J.; Huang, Y. Fuzzy Petri Net Based Intelligent Machine Operation of Energy Efficient Manufacturing System. In Proceedings of the 2018 IEEE 14th International Conference on Automation Science and Engineering (CASE), Munich, Germany, 20–24 August 2018; pp. 1593–1598. [Google Scholar] [CrossRef]
- Wang, J.; Xue, J.; Duque, E.T.; Li, S.; Chang, Q. Fuzzy decision of machine switch on-off for energy efficient operation of manufacturing system. In Proceedings of the 2017 13th IEEE Conference on Automation Science and Engineering (CASE), Xi’an, China, 20–23 August 2017; pp. 1158–1162. [Google Scholar] [CrossRef]
- Wang, J.; Fei, Z.; Chang, Q.; Fu, Y.; Li, S. Energy-Saving Operation of Multistage Stochastic Manufacturing Systems Based on Fuzzy Logic. Int. J. Simul. Model. 2019, 18, 138–149. [Google Scholar] [CrossRef]
- Wang, J.; Fei, Z.; Chang, Q.; Li, S.; Fu, Y. Multi-state decision of unreliable machines for energy-efficient production considering work-in-process inventory. Int. J. Adv. Manuf. Technol. 2019, 102, 1009–1021. [Google Scholar] [CrossRef] [Green Version]
- Duque, E.T.; Fei, Z.; Wang, J.; Li, S.; Li, Y.F. Energy Consumption Control of One Machine Manufacturing System with Stochastic Arrivals Based on Fuzzy Logic. In Proceedings of the 2018 IEEE International Conference on Industrial Engineering and Engineering Management (IEEM), Bangkok, Thailand, 16–19 December 2018; pp. 1503–1507. [Google Scholar] [CrossRef]
- Marzano, L.; Frigerio, N.; Matta, A. Energy Efficient State Control of Machine Tools: A Time-Based Dynamic Control Policy. In Proceedings of the 2019 IEEE 15th International Conference on Automation Science and Engineering (CASE), Vancouver, BC, Canada, 22–26 August 2019; pp. 596–601. [Google Scholar] [CrossRef]
- Renna, P. Energy saving by switch-off policy in a pull-controlled production line. Sustain. Prod. Consum. 2018, 16, 25–32. [Google Scholar] [CrossRef]
- Sun, Z.; Li, L. Opportunity Estimation for Real-Time Energy Control of Sustainable Manufacturing Systems. IEEE Trans. Autom. Sci. Eng. 2013, 10, 38–44. [Google Scholar] [CrossRef]
- Renna, P.; Materi, S. Switch off policies in job-shop manufacturing systems including workload evaluation. Int. J. Manag. Sci. Eng. Manag. 2021, 16, 254–263. [Google Scholar] [CrossRef]
- Schulze, C.; Blume, S.; Siemon, L.; Herrmann, C.; Thiede, S. Towards energy flexible and energy self-sufficient manufacturing systems. Procedia CIRP 2019, 81, 683–688. [Google Scholar] [CrossRef]
- Frigerio, N.; Matta, A. Analysis of an Energy Oriented Switching Control of Production Lines. Procedia CIRP 2015, 29, 34–39. [Google Scholar] [CrossRef]
- Frigerio, N.; Matta, A. Analysis on Energy Efficient Switching of Machine Tool With Stochastic Arrivals and Buffer Information. IEEE Trans. Autom. Sci. Eng. 2016, 13, 238–246. [Google Scholar] [CrossRef]

| Exp. No. | Battery Capacity Cb | Charge Rate Factor K | Power Variability vi |
|---|---|---|---|
| 1 | 10 | 10 | 10 |
| 2 | 15 | 10 | 10 |
| 3 | 20 | 10 | 10 |
| 4 | 10 | 5 | 10 |
| 5 | 15 | 5 | 10 |
| 6 | 20 | 5 | 10 |
| 7 | 10 | 2.5 | 10 |
| 8 | 15 | 2.5 | 10 |
| 9 | 20 | 2.5 | 10 |
| 10 | 10 | 10 | 20 |
| 11 | 15 | 10 | 20 |
| 12 | 20 | 10 | 20 |
| 13 | 10 | 5 | 20 |
| 14 | 15 | 5 | 20 |
| 15 | 20 | 5 | 20 |
| 16 | 10 | 2.5 | 20 |
| 17 | 15 | 2.5 | 20 |
| 18 | 20 | 2.5 | 20 |
| 19 | 10 | 10 | 30 |
| 20 | 15 | 10 | 30 |
| 21 | 20 | 10 | 30 |
| 22 | 10 | 5 | 30 |
| 23 | 15 | 5 | 30 |
| 24 | 20 | 5 | 30 |
| 25 | 10 | 2.5 | 30 |
| 26 | 15 | 2.5 | 30 |
| 27 | 20 | 2.5 | 30 |
| Source of Variance | Sum of Square | Degree of Freedom | Mean of Square | F-Ratio | p-Value |
|---|---|---|---|---|---|
| Energy Peak | |||||
| Battery Capacity | 62,729,371 | 2 | 31,364,685 | 1.28 | 0.285 |
| charge rate | 4,203,607,727 | 2 | 2,101,803,863 | 85.48 | 0.000 |
| Power fluctuations | 7,152,612,496 | 2 | 3,576,306,248 | 145.45 | 0.000 |
| Models | 207,676,538 | 2 | 103,838,269 | 4.22 | 0.018 |
| Error | 1,770,323,905 | 72 | 24,587,832 | ||
| Peak Power | |||||
| Battery Capacity | 8.37 | 2 | 4.18 | 6.63 | 0.002 |
| charge rate | 130.52 | 2 | 65.26 | 103.48 | 0.000 |
| Power fluctuations | 2430.02 | 2 | 1215.01 | 1926.46 | 0.000 |
| Models | 3.85 | 2 | 1.93 | 3.06 | 0.053 |
| Error | 45.41 | 72 | 0.63 | ||
| Average electricity grid utilization | |||||
| Battery Capacity | 0.1549 | 2 | 0.07743 | 1.60 | 0.209 |
| charge rate | 8.6491 | 2 | 4.32456 | 89.24 | 0.000 |
| Power fluctuations | 6.4681 | 2 | 3.23404 | 66.74 | 0.000 |
| Models | 0.3074 | 2 | 0.15371 | 3.17 | 0.048 |
| Error | 3.4890 | 72 | 0.04846 | ||
| Average battery utilization | |||||
| Battery Capacity | 370.50 | 2 | 185.250 | 64.53 | 0.000 |
| charge rate | 783.19 | 2 | 391.594 | 136.42 | 0.000 |
| Power fluctuations | 464.77 | 2 | 232.384 | 80.95 | 0.000 |
| Models | 1.42 | 2 | 0.708 | 0.25 | 0.782 |
| Error | 206.68 | 72 | 2.871 | ||
| Capacity battery percentage utilization | |||||
| Battery Capacity | 0.00383 | 2 | 0.00192 | 0.55 | 0.581 |
| charge rate | 3.34384 | 2 | 1.67192 | 477.15 | 0.000 |
| Power fluctuations | 1.98410 | 2 | 0.99205 | 283.12 | 0.000 |
| Models | 0.00629 | 2 | 0.00314 | 0.90 | 0.412 |
| Error | 0.25228 | 72 | 0.00350 | ||
| Power 10% | UP Policy | UP&D Policy | |||||
|---|---|---|---|---|---|---|---|
| Battery capacity[kW∗PTi]→ | Battery capacity[kW∗PTi]→ | ||||||
| Charging speed K[kW*PTi/minute]↓ | 10 | 15 | 20 | Charging speed K[kW*PTi/minute] ↓ | 10 | 15 | 20 |
| 10 | −9.92% | −10.25% | −10.52% | 10 | −16.71% | −18.66% | −19.00% |
| 5 | −8.13% | −10.19% | −6.93% | 5 | −3.79% | −3.32% | −3.28% |
| 2.5 | −10.95% | −8.44% | −7.71% | 2.5 | −5.85% | −5.64% | −4.50% |
| Power 20% | UP policy | UP&D policy | |||||
| Battery capacity[kW∗PTi]→ | Battery capacity[kW∗PTi]→ | ||||||
| Charging speed K[kW*PTi/minute] ↓ | 10 | 15 | 20 | Charging speed K[kW*PTi/minute] ↓ | 10 | 15 | 20 |
| 10 | −6.51% | −3.98% | −6.53% | 10 | −17.97% | −14.08% | −15.99% |
| 5 | −7.03% | −8.87% | −10.83% | 5 | −15.21% | −22.58% | −25.51% |
| 2.5 | −5.98% | −1.77% | −7.61% | 2.5 | −11.54% | −8.35% | −9.86% |
| Power 30% | UP policy | UP&D policy | |||||
| Battery capacity[kW∗PTi] → | Battery capacity [kW∗PTi] → | ||||||
| Charging speed K[kW*PTi/minute] ↓ | 10 | 15 | 20 | Charging speed K [kW*PTi/minute] ↓ | 10 | 15 | 20 |
| 10 | −8.91% | −8.92% | −9.29% | 10 | −14.66% | −15.41% | −13.44% |
| 5 | −11.02% | −10.85% | −8.84% | 5 | −20.19% | −20.38% | −21.67% |
| 2.5 | −10.99% | −7.97% | −6.42% | 2.5 | −23.46% | −26.70% | −28.23% |
| Battery vs. No Battery | |||
|---|---|---|---|
| Power 10% | |||
| Battery capacity[kW*PTi] → | |||
| Charging speed K [kW*PTi/minute]↓ | 10 | 15 | 20 |
| 10 | −1.59% | −1.68% | −1.70% |
| 5 | −1.99% | −1.99% | −2.01% |
| 2.5 | −2.01% | −2.02% | −2.03% |
| Power 20% | |||
| Battery capacity[kW*PTi]→ | |||
| Charging speed K [kW*PTi/minute]↓ | 10 | 15 | 20 |
| 10 | −1.74% | −1.82% | −1.84% |
| 5 | −2.71% | −2.88% | −2.97% |
| 2.5 | −3.35% | −3.55% | −3.62% |
| Power 30% | |||
| Battery capacity[kW*PTi]→ | |||
| Charging speed K [kW*PTi/minute]↓ | 10 | 15 | 20 |
| 10 | −1.79% | −1.86% | −1.90% |
| 5 | −2.92% | −3.08% | −3.19% |
| 2.5 | −3.99% | −4.40% | −4.62% |
| Exp. No. | % Battery | Exp. No. | % Battery | Exp. No. | % Battery |
|---|---|---|---|---|---|
| 1 | 44.53% | 28 | 46.99% | 55 | 50.56% |
| 2 | 42.42% | 29 | 45.55% | 56 | 48.49% |
| 3 | 41.29% | 30 | 44.73% | 57 | 46.56% |
| 4 | 82.01% | 31 | 83.36% | 58 | 86.17% |
| 5 | 86.50% | 32 | 87.74% | 59 | 90.33% |
| 6 | 88.49% | 33 | 89.43% | 60 | 91.78% |
| 7 | 92.94% | 34 | 93.47% | 61 | 93.73% |
| 8 | 95.23% | 35 | 95.59% | 62 | 95.78% |
| 9 | 95.93% | 36 | 96.15% | 63 | 96.38% |
| 10 | 26.36% | 37 | 28.09% | 64 | 24.46% |
| 11 | 22.26% | 38 | 24.09% | 65 | 18.58% |
| 12 | 19.84% | 39 | 21.63% | 66 | 15.36% |
| 13 | 49.47% | 40 | 51.26% | 67 | 53.91% |
| 14 | 46.36% | 41 | 48.62% | 68 | 52.25% |
| 15 | 44.37% | 42 | 46.92% | 69 | 50.94% |
| 16 | 73.18% | 43 | 74.29% | 70 | 76.21% |
| 17 | 76.72% | 44 | 78.00% | 71 | 80.83% |
| 18 | 79.46% | 45 | 80.66% | 72 | 83.97% |
| 19 | 22.52% | 46 | 24.13% | 73 | 20.09% |
| 20 | 18.19% | 47 | 19.81% | 74 | 14.71% |
| 21 | 15.70% | 48 | 17.17% | 75 | 11.90% |
| 22 | 39.63% | 49 | 41.23% | 76 | 41.35% |
| 23 | 34.32% | 50 | 36.22% | 77 | 35.38% |
| 24 | 31.13% | 51 | 33.08% | 78 | 31.02% |
| 25 | 60.34% | 52 | 61.56% | 79 | 63.15% |
| 26 | 59.51% | 53 | 61.01% | 80 | 64.00% |
| 27 | 59.37% | 54 | 61.05% | 81 | 65.41% |
Publisher’s Note: MDPI stays neutral with regard to jurisdictional claims in published maps and institutional affiliations. |
© 2022 by the authors. Licensee MDPI, Basel, Switzerland. This article is an open access article distributed under the terms and conditions of the Creative Commons Attribution (CC BY) license (https://creativecommons.org/licenses/by/4.0/).
Share and Cite
Renna, P.; Materi, S. Peak Energy Reduction in Flow Shop including Switch-Off Policies and Battery Storage. Appl. Sci. 2022, 12, 2448. https://doi.org/10.3390/app12052448
Renna P, Materi S. Peak Energy Reduction in Flow Shop including Switch-Off Policies and Battery Storage. Applied Sciences. 2022; 12(5):2448. https://doi.org/10.3390/app12052448
Chicago/Turabian StyleRenna, Paolo, and Sergio Materi. 2022. "Peak Energy Reduction in Flow Shop including Switch-Off Policies and Battery Storage" Applied Sciences 12, no. 5: 2448. https://doi.org/10.3390/app12052448