
Interfacial Pockels Effect of Solvents with a Larger Static Dielectric Constant than Water and an Ionic Liquid on the Surface of a Transparent Oxide Electrode


Abstract
:Featured Application
Abstract
1. Introduction
2. Materials and Methods
3. Results
3.1. Analysis Methods
3.1.1. Estimation of from Electro-Modulation Spectra Simulated by Transfer Matrix Method
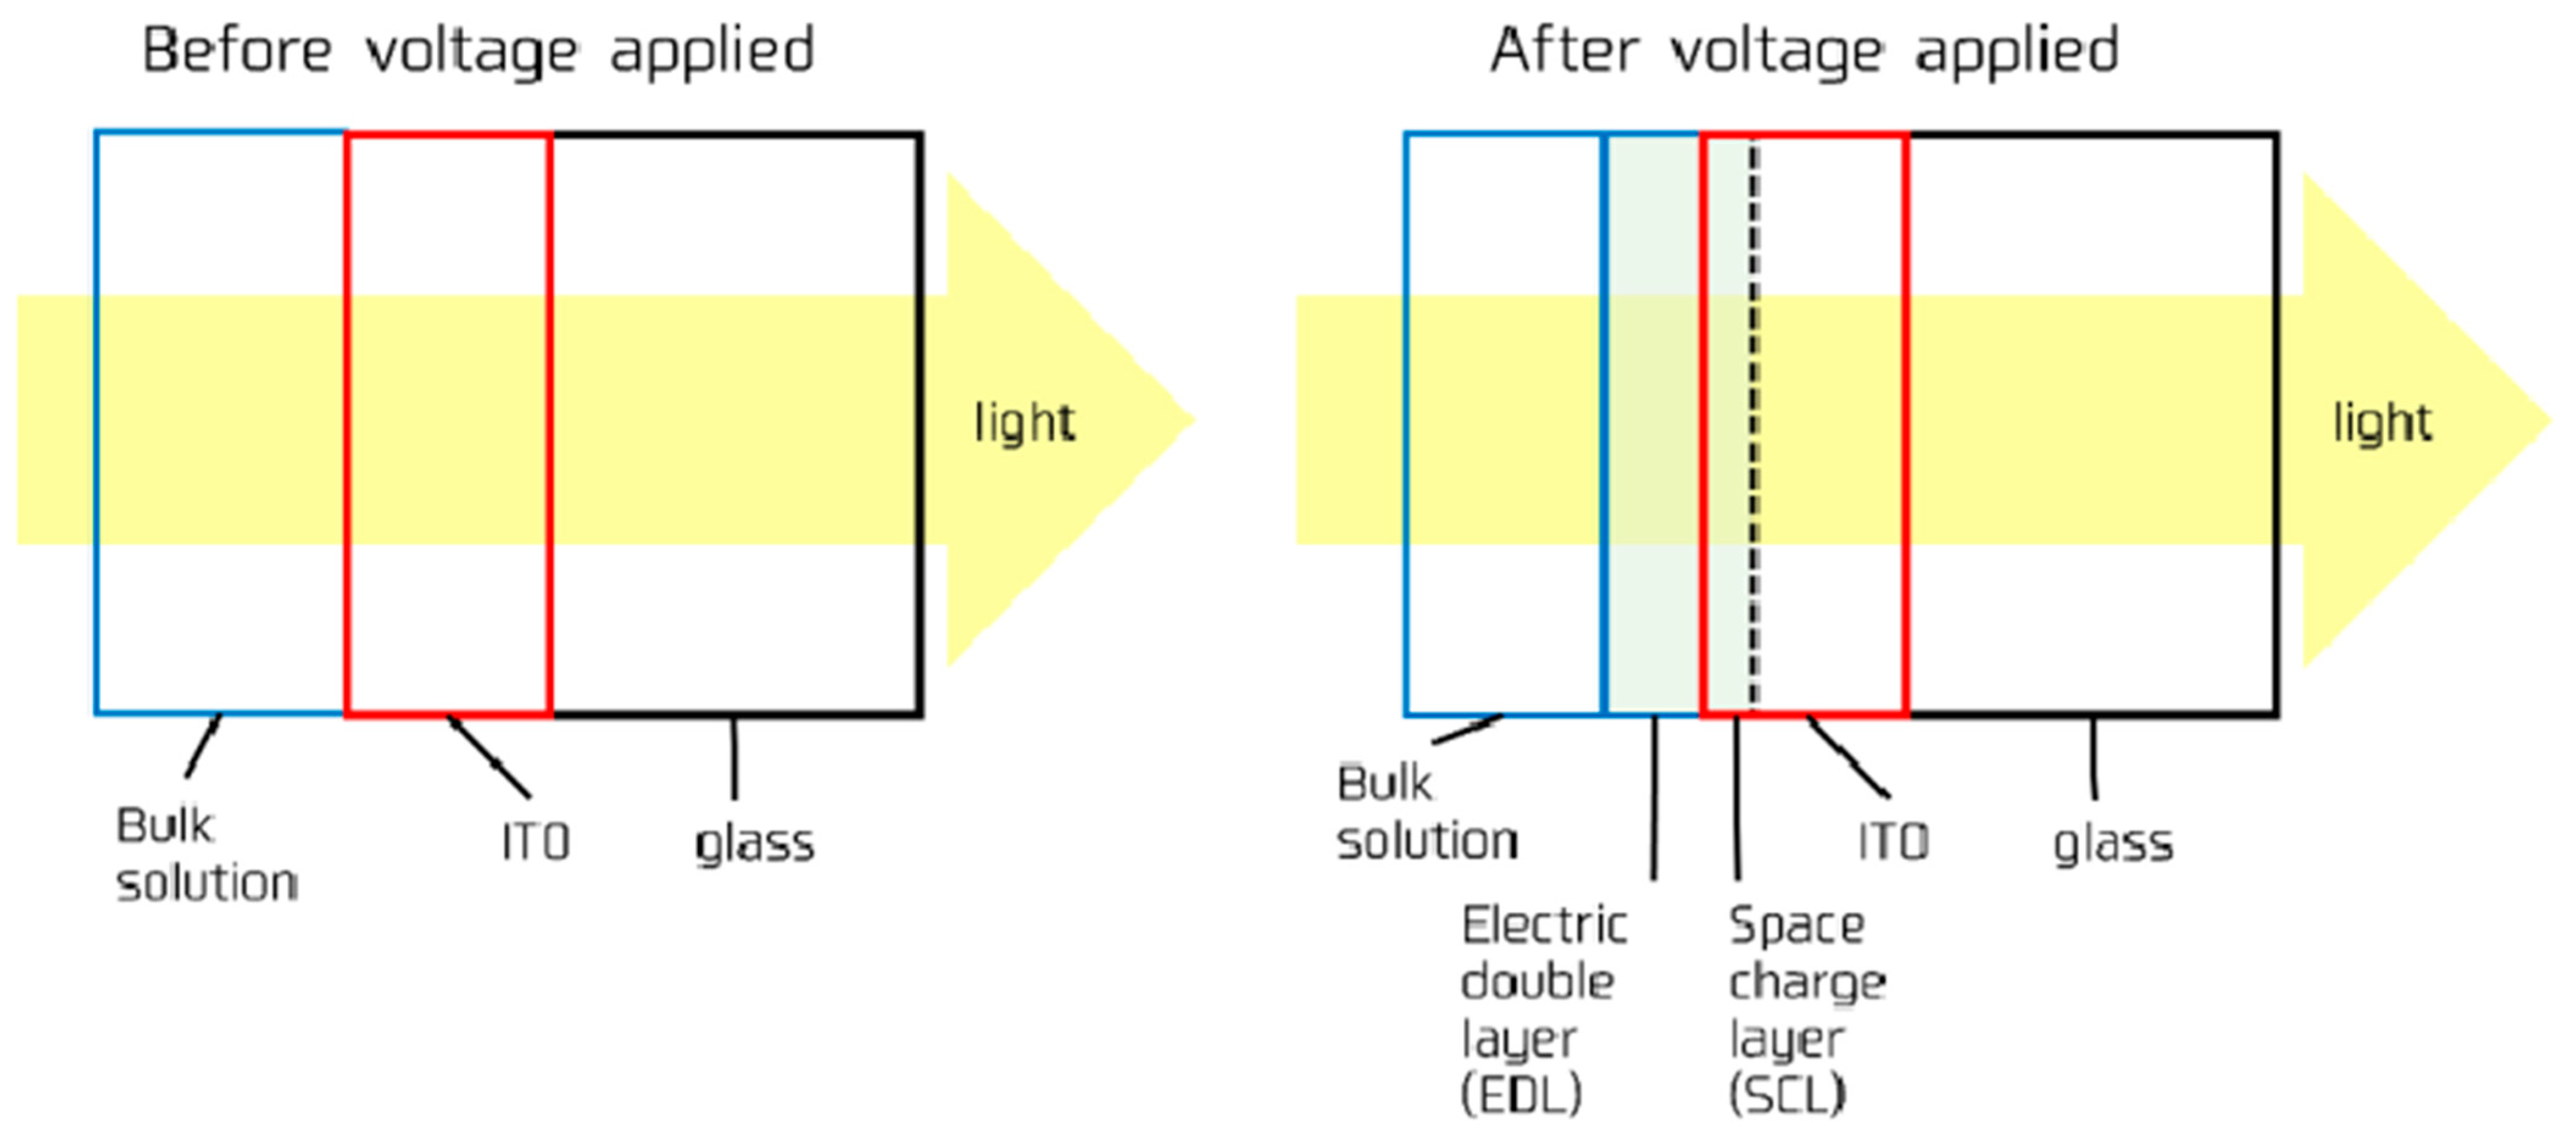
3.1.2. Estimation of Electric Field in Electric Double Layer by Equivalent Circuit and Evaluation of Pockels Coefficient
4. Discussion
5. Conclusions and Prospect
Author Contributions
Funding
Data Availability Statement
Conflicts of Interest
Appendix A

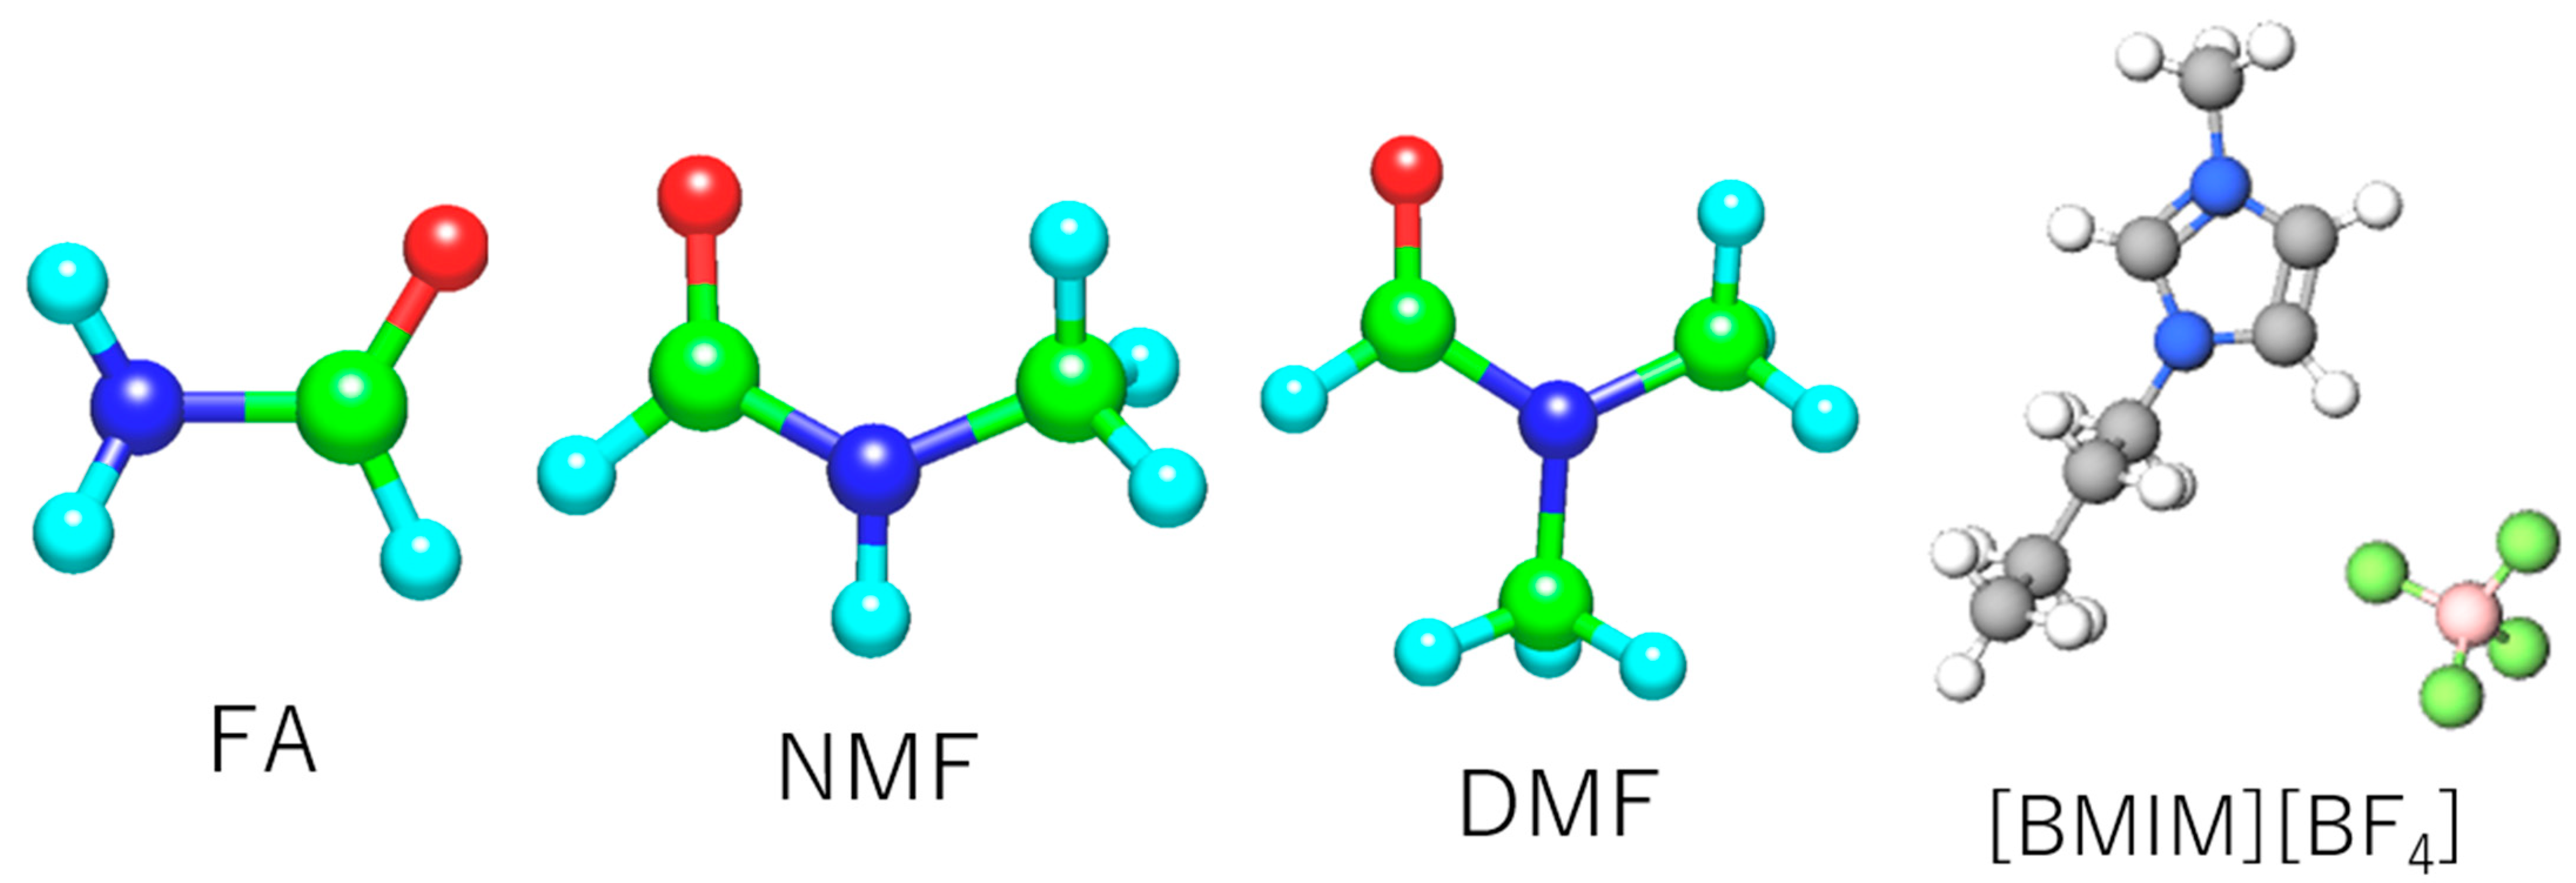
| Water | FA | DMF | NMF | [BMIM] [BF4] |
|---|---|---|---|---|
| Bulk | ||||
| r1 = 29.16 | r1 = 23.85 | r1 = 41.28 | r1 = 31.04 | r1 = 28.17 |
| EDL | ||||
| CPE-t1 = 1.5571 × 10⁻⁵ | CPE-t1 = 1.7448 × 10⁻⁵ | CPE-t1 = 1.5076 × 10⁻⁵ | CPE-t1 = 1.6946 × 10⁻⁵ | CPE-t1 = 1.4051 × 10⁻⁵ |
| CPE-p1 = 0.96306 | CPE-p1 = 0.92312 | CPE-p1 = 0.93415 | CPE-p1 = 0.92243 | CPE-p1 = 0.89908 |
| r2 = 8.349 | r2 = 49.68 | r2 = 39.91 | r2 = 31.77 | r2 = 27.78 |
| CPE-t2 = 8.92 × 10⁻⁸ | CPE-t2 = 9.1887 × 10⁻¹⁰ | CPE-t2 = 1.5238 × 10⁻⁸ | CPE-t2 = 1.6568 × 10⁻⁹ | CPE-t2 = 1.409 × 10⁻⁹ |
| CPE-p2 = 0.83177 | CPE-p2 = 1 | CPE-p2 = 1 | CPE-p2 = 1 | CPE-p2 = 1 |
| SCL | ||||
| r3 = 32.75 | r3 = 82.61 | r3 = 29.49 | r3 = 51.14 | r3 = 12.59 |
| CPE-t3 = 0.00023749 | CPE-t3 = 7.4832 × 10⁻⁵ | CPE-t3 = 2.5267 × 10⁻⁵ | CPE-t3 = 2.6216 × 10⁻⁵ | CPE-t3 = 4.4851 × 10⁻⁵ |
| CPE-p3 = 0.69759 | CPE-p3 = 0.83291 | CPE-p3 = 1 | CPE-p3 = 1 | CPE-p3 = 1 |


References
- Schmickler, W. Electronic effects in the electric double layer. Chem. Rev. 1996, 96, 3177–3200. [Google Scholar] [CrossRef] [PubMed]
- Brown, G.E.; Henrich, V.E.; Casey, W.H.; Clark, D.L.; Eggleston, C.; Felmy, A.; Goodman, D.W.; Grätzel, M.; Maciel, G.; McCarthy, M.I.; et al. Metal oxide surfaces and their interactions with aqueous solutions and microbial organisms. Chem. Rev. 1999, 99, 77–174. [Google Scholar] [CrossRef] [PubMed] [Green Version]
- Burt, R.; Birkett, G.; Zhao, X.S. A review of molecular modelling of electric double layer capacitors. Phys. Chem. Chem. Phys. 2014, 16, 6519–6538. [Google Scholar] [CrossRef]
- Shimotani, H.; Asanuma, H.; Tsukazaki, A.; Ohtomo, A.; Kawasaki, M.; Iwasa, Y. Insulator-to-metal transition in ZnO by electric double layer gating. Appl. Phys. Lett. 2007, 91, 082106. [Google Scholar] [CrossRef]
- Scherwitzl, R.; Zubko, P.; Lezama, I.G.; Ono, S.; Morpurgo, A.F.; Catalan, G.; Triscone, J.-M. Electric-field control of the metal-insulator transition in ultrathin NdNiO3 films. Adv. Mater. 2010, 22, 5517–5520. [Google Scholar] [CrossRef] [PubMed]
- Electrically Induced Ferromagnetism at Room Temperature in Cobalt-Doped Titanium Dioxide|Science. Available online: https://science.sciencemag.org/content/332/6033/1065 (accessed on 22 June 2021).
- Ueno, K.; Nakamura, S.; Shimotani, H.; Ohtomo, A.; Kimura, N.; Nojima, T.; Aoki, H.; Iwasa, Y.; Kawasaki, M. Electric-field-induced superconductivity in an insulator. Nat. Mater. 2008, 7, 855–858. [Google Scholar] [CrossRef]
- Bazant, M.Z.; Storey, B.D.; Kornyshev, A.A. Double layer in ionic liquids: Overscreening versus crowding. Phys. Rev. Lett. 2011, 106, 046102. [Google Scholar] [CrossRef] [PubMed] [Green Version]
- Yamamoto, R.; Morisaki, H.; Sakata, O.; Shimotani, H.; Yuan, H.; Iwasa, Y.; Kimura, T.; Wakabayashi, Y. External electric field dependence of the structure of the electric double layer at an ionic liquid/Au interface. Appl. Phys. Lett. 2012, 101, 053122. [Google Scholar] [CrossRef]
- Fedorov, M.V.; Kornyshev, A.A. Ionic liquids at electrified interfaces. Chem. Rev. 2014, 114, 2978–3036. [Google Scholar] [CrossRef] [Green Version]
- Zhao, Z.; Zhang, G.; Yin, Y.; Dong, C.; Liu, Y.D. The electric field responses of inorganic ionogels and poly(ionic liquid)s. Molecules 2020, 25, 4547. [Google Scholar] [CrossRef]
- Tokunaga, E.; Nosaka, Y.; Hirabayashi, M.; Kobayashi, T. Pockels effect of water in the electric double layer at the interface between water and transparent electrode. Surf. Sci. 2007, 601, 735–741. [Google Scholar] [CrossRef]
- Nosaka, Y.; Hirabayashi, M.; Kobayashi, T.; Tokunaga, E. Gigantic optical pockels effect in water within the electric double layer at the electrode-solution interface. Phys. Rev. B 2008, 77, 241401. [Google Scholar] [CrossRef] [Green Version]
- Weis, R.S.; Gaylord, T.K. Lithium niobate: Summary of physical properties and crystal structure. Appl. Phys. A 1985, 37, 191–203. [Google Scholar] [CrossRef]
- Meng, X.Y.; Wang, Z.Z.; Zhu, Y.; Chen, C.T. Mechanism of the electro-optic effect in the perovskite-type ferroelectric KNbO3 and LiNbO3. J. Appl. Phys. 2007, 101, 103506. [Google Scholar] [CrossRef]
- Kanemaru, H.; Yukita, S.; Namiki, H.; Nosaka, Y.; Kobayashi, T.; Tokunaga, E. Giant pockels effect of polar organic solvents and water in the electric double layer on a transparent electrode. RSC Adv. 2017, 7, 45682–45690. [Google Scholar] [CrossRef] [Green Version]
- Yukita, S.; Suzuki, Y.; Shiokawa, N.; Kobayashi, T.; Tokunaga, E. Mechanisms of the anomalous pockels effect in bulk water. Opt. Rev. 2018, 25, 205–214. [Google Scholar] [CrossRef]
- Nishi, Y.; Watanabe, R.; Sasaki, S.; Okada, A.; Seto, K.; Kobayashi, T.; Tokunaga, E. Electric-field induced shift in the plasmon resonance due to the interfacial pockels effect of water on a silver surface. Appl. Sci. 2021, 11, 2152. [Google Scholar] [CrossRef]
- Hayama, D.; Seto, K.; Yamashita, K.; Yukita, S.; Kobayashi, T.; Kobayashi, T.; Kobayashi, T.; Tokunaga, E.; Tokunaga, E. Giant pockels effect in an electrode-water interface for a “liquid” light modulator. OSA Contin. 2019, 2, 3358–3373. [Google Scholar] [CrossRef]
- Teng, P.; Luo, M.; Yang, X.; Gao, D.; Copner, N.; Liu, Z.; Liu, Z.; Yang, J.; Li, Z.; Gao, S.; et al. All-fiber bidirectional optical modulator derives from the microfiber coated with ITO electrode. Opt. Lett. 2021, 46, 2497–2500. [Google Scholar] [CrossRef]
- Kanemaru, H.; Nosaka, Y.; Hirako, A.; Ohkawa, K.; Kobayashi, T.; Tokunaga, E. Electrooptic effect of water in electric double layer at interface of GaN electrode. Opt. Rev. 2010, 17, 352–356. [Google Scholar] [CrossRef]
- Puranik, S.M.; Kumbharkhane, A.C.; Mehrotra, S.C. Dielectric study of formamide, N-methyl-formamide and N, N-dimethylformamide. Indian J. Chem.–Sect. A 1993, 32, 613–615. [Google Scholar]
- Richardi, J.; Krienke, H.; Fries, P.H. Dielectric constants of liquid formamide, N-methylformamide and dimethylformamide via molecular ornstein-zernike theory. Chem. Phys. Lett. 1997, 273, 115–121. [Google Scholar] [CrossRef]
- Deetlefs, M.; Seddon, K.R.; Shara, M. Predicting physical properties of ionic liquids. Phys. Chem. Chem. Phys. 2006, 8, 642–649. [Google Scholar] [CrossRef] [PubMed]
- Tomida, D.; Kumagai, A.; Qiao, K.; Yokoyama, C. Viscosity of [Bmim][PF6] and [Bmim][BF4] at high pressure. Int. J. Thermophys. 2006, 1, 39–47. [Google Scholar] [CrossRef]
- Ludwig, R. Water: From clusters to the bulk. Angew. Chem. Int. Ed. 2001, 40, 1808–1827. [Google Scholar] [CrossRef]
- Neumann, M. Dielectric relaxation in water. Computer simulations with the TIP4P potential. J. Chem. Phys. 1986, 85, 1567–1580. [Google Scholar] [CrossRef]
- Toda, S.; Clark, R.; Welton, T.; Shigeto, S. Observation of the pockels effect in ionic liquids and insights into the length scale of potential-induced ordering. Langmuir 2021, 37, 5193–5201. [Google Scholar] [CrossRef]
- Huang, M.-M.; Jiang, Y.; Sasisanker, P.; Driver, G.W.; Weingärtner, H. Static relative dielectric permittivities of ionic liquids at 25 °C. J. Chem. Eng. Data 2011, 56, 1494–1499. [Google Scholar] [CrossRef]
- Born, M.; Wolf, E. Principles of Optics: 60th Anniversary Edition, 7th ed.; Cambridge University Press: Cambridge, UK, 2019; ISBN 978-1-108-47743-7. [Google Scholar]
- Hamberg, I.; Granqvist, C.G.; Berggren, K.-F.; Sernelius, B.E.; Engström, L. Band-gap widening in heavily Sn-doped In2O3. Phys. Rev. B 1984, 30, 3240–3249. [Google Scholar] [CrossRef] [Green Version]
- Glosser, R.; Seraphin, B.O. Band-population effects in the electroreflectance spectrum of InSb. Phys. Rev. 1969, 187, 1021–1024. [Google Scholar] [CrossRef]
- Bottka, N.; Johnson, D.L.; Glosser, R. Band-population interference phenomena in the electroreflectance of narrow-gap semiconductors under heavy surface accumulation. Phys. Rev. B 1977, 15, 2184–2194. [Google Scholar] [CrossRef]
- Ozaki, Y.; Morisawa, Y.; Ikehata, A.; Higashi, N. Far-ultraviolet spectroscopy in the solid and liquid states: A review. Appl. Spectrosc. 2012, 66, 1–25. [Google Scholar] [CrossRef] [Green Version]
- Morisawa, Y.; Yasunaga, M.; Fukuda, R.; Ehara, M.; Ozaki, Y. Electronic transitions in liquid amides studied by using attenuated total reflection far-ultraviolet spectroscopy and quantum chemical calculations. J. Chem. Phys. 2013, 139, 154301. [Google Scholar] [CrossRef] [PubMed]
- Ozaki, Y.; Morisawa, Y.; Tanabe, I.; Beć, K.B. ATR-far-ultraviolet spectroscopy in the condensed phase—The present status and future perspectives. Spectrochim. Acta Part A Mol. Biomol. Spectrosc. 2021, 253, 119549. [Google Scholar] [CrossRef] [PubMed]


| Static Dielectric Constant | Dipole Moment [D] | Boiling Point [°C] | Melting Point [°C] | Refractive Index | Molecular Weight | |||
|---|---|---|---|---|---|---|---|---|
| water | 80.2 | 1.85 | 0.998 | 1.00 | 100 | 0 | 1.333 | 18.015 |
| MeOH | 33.0 | 1.66 | 0.792 | 0.59 | 64.7 | −97.6 | 1.329 | 32.05 |
| EtOH | 25.3 | 1.44 | 0.789 | 1.2 | 78.37 | −114.1 | 1.361 | 46.07 |
| FA | 109.5 [22,23] | 3.37 | 1.133 | 3.23 (25 °C) | 210 | 2–3 | 1.447 | 45.04 |
| NMF | 186.0 [22,23] | 3.83 | 1.011 | 1.72 (25 °C) | 198~199 | −4 | 1.43 | 59.07 |
| DMF | 37.4 [22,23] | 3.82 | 0.944 | 0.71 (25 °C) | 153 | −61 | 1.43 | 73.09 |
| DMSO | 47.2 | 3.96 | 1.10 | 1.99 | 189 | 19 | 1.479 | 78.14 |
| [BMIM] [BF4] | 13.9 [29] | 1.21 (20 °C) | 132 (20 °C) [25] | 1.41 | 226.02 |
| Solvent | FA | NMF | DMF | [BMIM] [BF4] | Water |
|---|---|---|---|---|---|
| Relative permittivity | 109.5 | 186.0 | 37.4 | 13.9 | 80.2 |
| Density [] | 1.133 | 1.011 | 0.944 | 1.21 | 0.998 |
| Viscosity [mPa⋅s] | 3.23 | 1.72 | 0.71 | 132 | 1.00 |
| Refractive index | 1.447 | 1.43 | 1.43 | 1.41 | 1.333 |
| Refractive index change | |||||
| Intralayer electric field [V/m] | |||||
| Pockels coefficient [pm/V] | 83 | 80 | 120 | 55 | 165 |
Publisher’s Note: MDPI stays neutral with regard to jurisdictional claims in published maps and institutional affiliations. |
© 2022 by the authors. Licensee MDPI, Basel, Switzerland. This article is an open access article distributed under the terms and conditions of the Creative Commons Attribution (CC BY) license (https://creativecommons.org/licenses/by/4.0/).
Share and Cite
Okada, A.; Kobayashi, T.; Tokunaga, E. Interfacial Pockels Effect of Solvents with a Larger Static Dielectric Constant than Water and an Ionic Liquid on the Surface of a Transparent Oxide Electrode. Appl. Sci. 2022, 12, 2454. https://doi.org/10.3390/app12052454
Okada A, Kobayashi T, Tokunaga E. Interfacial Pockels Effect of Solvents with a Larger Static Dielectric Constant than Water and an Ionic Liquid on the Surface of a Transparent Oxide Electrode. Applied Sciences. 2022; 12(5):2454. https://doi.org/10.3390/app12052454
Chicago/Turabian StyleOkada, Akihiro, Takayoshi Kobayashi, and Eiji Tokunaga. 2022. "Interfacial Pockels Effect of Solvents with a Larger Static Dielectric Constant than Water and an Ionic Liquid on the Surface of a Transparent Oxide Electrode" Applied Sciences 12, no. 5: 2454. https://doi.org/10.3390/app12052454