Article

Characterization of a Continuous Muon Source for the Non-Destructive and Depth-Selective Elemental Composition Analysis by Muon Induced X- and Gamma-rays

by
Sayani Biswas
1,*,
Lars Gerchow
1,*,
Hubertus Luetkens
1,
Thomas Prokscha
1,
Aldo Antognini
1,2,
Niklaus Berger
3,
Thomas Elias Cocolios
4,
Rugard Dressler
1,
Paul Indelicato
5,
Klaus Jungmann
6,
Klaus Kirch
1,2,
Andreas Knecht
1,
Angela Papa
1,7,
Randolf Pohl
8,
Maxim Pospelov
9,10,
Elisa Rapisarda
1,
Peter Reiter
11,
Narongrit Ritjoho
1,2,
Stephanie Roccia
12,
Nathal Severijns
4,
Alexander Skawran
1,2,
Stergiani Marina Vogiatzi
1,2,
Frederik Wauters
3,
Lorenz Willmann
6 and
Alex Amato
1,*
add Show full author list remove Hide full author list
1
Paul Scherrer Institute, 5232 Villigen PSI, Switzerland
2
Institute for Particle Physics and Astrophysics, ETH Zürich, 8093 Zürich, Switzerland
3
PRISMA+ Cluster of Excellence, Institute of Nuclear Physics, Johannes Gutenberg Universität Mainz, 55128 Mainz, Germany
4
KU Leuven, Instituut voor Kern-en Stralingfysica, B-3001 Leuven, Belgium
5
Laboratoire Kastler Brossel, Sorbonne Université, CNRS, ENS-PSL Research University, Collège de France, F-75005 Paris, France
6
Van Swinderen Institute for Particle Physics and Gravity, University of Groningen, Zernikelaan 25, 9747AA Groningen, The Netherlands
7
Departimento di Fisica, Univeristà di Pisa and INFN sez. Pisa, Largo B. Pontecorvo 3, 56127 Pisa, Italy
8
QUANTUM and Cluster of Excellence PRISMA+, Institute of Physics, Johannes Gutenberg Universität Mainz, 55128 Mainz, Germany
9
Perimeter Institute, Waterloo, ON N2J 2W9, Canada
10
Department of Physics and Astronomy, University of Victoria, Victoria, BC V8P 5C2, Canada
11
Institut für Kernphysik, Universität zu Köln, Zülpicher Str. 77, D-50937 Köln, Germany
12
Laboratoire de Physique Subatomique Cosmologie-IN2P3, Grenoble INP, CNRS, Universit Grenoble Alpes, 38026 Grenoble, France
*
Authors to whom correspondence should be addressed.
Appl. Sci. 2022, 12(5), 2541; https://doi.org/10.3390/app12052541
Submission received: 31 January 2022 / Revised: 23 February 2022 / Accepted: 25 February 2022 / Published: 28 February 2022
(This article belongs to the Special Issue Non-destructive Techniques for Cultural Heritage Characterization)

Abstract

:
The toolbox for material characterization has never been richer than today. Great progress with all kinds of particles and interaction methods provide access to nearly all properties of an object under study. However, a tomographic analysis of the subsurface region remains still a challenge today. In this regard, the Muon Induced X-ray Emission (MIXE) technique has seen rebirth fueled by the availability of high intensity muon beams. We report here a study conducted at the Paul Scherrer Institute (PSI). It demonstrates that the absence of any beam time-structure leads to low pile-up events and a high signal-to-noise ratio (SNR) with less than one hour acquisition time per sample or data point. This performance creates the perspective to open this technique to a wider audience for the routine investigation of non-destructive and depth-sensitive elemental compositions, for example in rare and precious samples. Using a hetero-structured sample of known elements and thicknesses, we successfully detected the characteristic muonic X-rays, emitted during the capture of a negative muon by an atom, and the gamma-rays resulting from the nuclear capture of the muon, characterizing the capabilities of MIXE at PSI. This sample emphasizes the quality of a continuous beam, and the exceptional SNR at high rates. Such sensitivity will enable totally new statistically intense aspects in the field of MIXE, e.g., elemental 3D-tomography and chemical analysis. Therefore, we are currently advancing our proof-of-concept experiments with the goal of creating a full fledged permanently operated user station to make MIXE available to the wider scientific community as well as industry.

1. Introduction

Elemental analysis of materials, qualitative and quantitative, is used in a broad range of scientific fields. Depending on the type of application, several elemental analysis techniques have been developed over the years, broadly categorized into two types: destructive and non-destructive. The different destructive methods include Auger Electron Spectroscopy [1], Scanning Electron Microscopy/Energy Dispersive X-ray Spectrometry [2], Secondary Ion Mass Spectrometry [3], Inductive Coupled Plasma Atomic Emission Spectroscopy [4] and Inductive Coupled Plasma Mass Spectroscopy [5]. With these destructive techniques, one can study trace elements (down to parts per quadrillion (ppq) levels) near the surface of the material, but this comes with the cost that the investigated sample cannot be retained in its original form. Thus, such techniques are not appropriate with rare and precious samples for which even a partial destruction is excluded. The different non-destructive techniques include X-ray Photoelectron Spectroscopy [6], X-ray Fluorescence (XRF) [7], Proton-induced X-ray Emission (PIXE) [8], Rutherford Backscattering Spectrometry (RBS) [9], Nuclear Reaction Analysis (NRA) [10], Prompt Gamma-ray neutron Activation Analysis (PGAA) [11], Neutron Activation Analysis (NAA) [12], and Neutron Depth Profiling [13]. All these non-destructive techniques, with the exception of PGAA and NAA, are able to provide information from near (i.e., up to ∼10 micrometer) the surface of the material only. On the other hand, the PGAA and NAA techniques are bulk measurements and not depth-sensitive, and the sensitivity is strongly isotope dependent. The technique of Muon Induced X-ray Emission (MIXE) (Reference [14] called this technique as Muonic X-ray Analysis (MXA). The Refs. [15,16,17] used Muon Induced X-ray Emission (MIXE), while the Ref. [18] used Muonic Atom X-ray Spectroscopy (MAXRS); all of which describe the same technique), a non-destructive technique, which was developed more than 40 years ago [14,19,20,21], has recently been used extensively with pulsed muon beams for elemental analysis [16,18,22,23,24,25,26,27,28,29,30,31,32,33,34]. The advantage of this technique is that it is able to probe deep into the material, up to a few millimeters, and does not lead to a severe radiation damage of the sample. The aim of the present manuscript is to demonstrate the performance of the MIXE technique using a continuous muon beam.

2. The MIXE Technique

The muon is a lepton of mass m μ = 105.66 MeV/c 2 , and thus 207 times heavier than the electron ( m e = 0.511 MeV/c 2 ). There are two kinds of muons, namely positive muons ( μ + , antiparticle) and negative muons ( μ , particle). For research on condensed matter and material science, spin polarized μ + are routinely used in different experiments such as muon spin rotation, relaxation and resonance studies ( μ SR) [35]. The advantage of μ + is that these stop at interstitial sites in a sample, acting as localized magnetic probes by making use of the asymmetric emission of positrons when they decay. The μ can also be used for μ SR studies [36]. However, as the negative muons do not stop at an interstitial site but are rather captured by the atoms of the sample, due to the electromagnetic interaction with the nucleus, they form the so-called muonic atoms. Hence, the interpretation of μ SR data can be quite difficult, hampering a large use of this technique.
An alternative use of μ is to study the formation process of muonic atoms. When a μ is captured by an atom, the resulting muonic atom is typically created in an excited state, with the muon in an muonic orbit principal quantum number n μ 14 [37]. Subsequently, the muon relaxes in a time-scale of the order of 10 13 s to the lowest n μ = 1 muonic orbit by emitting a series of so called muonic X-rays ( μ -X rays) [38]. The energy of the μ -X rays, which can be used to investigate the charge radius of the nucleus [39,40,41], is a fingerprint of the type of atom having captured the muon. Hence, the determination of the μ -X ray energies provides information about the presence of the different atomic species. Correcting the intensities of the observed μ -X rays, for various processes, allows to quantify the weight percentages of the elements present in the sample under study. The processes to take into account are the branching ratio of the μ -X rays, competing Coulomb capture probabilities of the different elements (generally heavier atoms have a higher capture probability) and X-ray absorption effects inside the sample.
Due to their higher mass, muons exhibit a different stopping profile in matter than X-rays or electrons. Their energy loss distribution is similar to that of protons, a Bragg curve. The mean penetration depth of muons depends on the density of the target material and the incoming muon momentum [42]. This allows to deduce the elemental composition of a material deep below the surface in the range from tens of μ m to mm and profiling with step sizes down to 10 μ m to 100 μ m, respectively. As an example, for a muon beam with a mean momentum of 30 MeV/c (corresponding to a kinetic energy of 4.18 MeV) and a momentum distribution characterized by a momentum bite Δ p / p = 2 % ( σ = Δ p ), the stopping depth is 260 ± 20   μ m in a copper target.
Also owing to the heavier mass, a μ -X ray has an energy 207 times higher than that associated with the corresponding electronic transition (neglecting finite size effects). This much higher μ -X ray energy and the correspondingly smaller mass attenuation coefficient has the consequence that the created μ -X rays have a much higher probability to pass through the target material from much deeper regions than the characteristic X-rays of electronic transitions.
In analogy to the Moseley law [43] for the electrons, and by assuming a point-charge nucleus, one can express the Bohr model energy of the μ -X ray created between transitions between states with principal quantum numbers n i (initial) and n f (final) as:
E i f , μ = m μ ¯ m e R y ( Z S s c r , μ ) 2 ( 1 n f 2 1 n i 2 ) m μ ¯ m e E i f , e 207 × E i f , e ,
where m ¯ μ is the reduced mass of the system formed by the muon and the nucleus and R y is the Rydberg constant. Note that by analogy with the Moseley law, we replace the atomic number Z by Z e f f = ( Z S s c r , μ ) . We have S s c r , μ = 0 since there is no screening of the charge of the nucleus seen by the muon involved in the transition, as solely one μ is present at a given time in the sample. Though the S s c r , μ = 0 , the electron screening also affects the energy of the μ -X rays. While this effect can lead to energy shifts ranging from a fraction of eV to few hundreds of eV (depending on the muonic transition and the element), these are of the order of permille or less [44]. The situation is however different for the case of electrons where for K α transitions ( 2 p 1 s ), for example, one has S s c r , e = 1 as already one electron is present in the 1 s level. This difference explains the first approximation in Equation (1). Note that the Bohr model ignores the fine structure of the levels, which is determined by relativistic effects and the spin-orbit coupling. Hence, all states with the same principal quantum number n and different azimuthal quantum number have the same binding energy in this model. Note also that for heavy nuclei, the μ -X ray energy will be smaller than the one predicted by Equation (1), as the size of the nucleus cannot be neglected anymore with respect to the characteristic radius of the muonic state. This deviation will be smaller for large values of n f , corresponding to a large radius of the muonic state.
Concluding, by measuring the μ -X ray energy one can identify the element (similar to the XRF technique), which had captured the muon. However, the fundamental differences compared to the XRF technique are, that the muon momentum can be tuned to implant the muons at controlled depths deep inside the material (from tens of micrometers to several millimeters), and that the created μ -X rays have enough energy to escape the material and being detected (We note here that for pure iron an X-ray created by the muonic transition K α 2 will have a range three orders of magnitude larger than the corresponding X-ray created by an electronic transition). This technique is referred to as the Muon Induced X-ray Emission (MIXE) technique. MIXE can be applied to carry out non-destructive elemental analysis deep inside a material, which is not possible by XRF or PIXE.
Once the muon has reached its ground state, i.e., n f = 1 , it either decays or gets captured by the nucleus. The respective branching probabilities will depend on the overlap between the muonic and nuclear wavefunctions. The probability of the capture by the nucleus increases with Z through the reaction
μ + p n + ν μ .
This leads to a decrease of the muon lifetime, as the muon lifetime τ is given by
1 τ = 1 τ decay + 1 τ nuclear capture .
For low Z muonic atoms the muon lifetime is essentially identical to that of the free muon (∼2.2 μ s), whereas for heavy atoms it can be lower than 100 ns [45].
The capture of the μ by the nucleus (Equation (2)) results in the formation of a Z 1 nucleus in an excited state, which will relax through different possible processes, for which some are connected with the emission of characteristic gamma-rays. By determining the energy of the gamma-rays, one obtains an additional confirmation of the type of atom having captured the μ . We note here that the possible nuclear capture of the muon (i.e., a muon not experiencing a normal decay) may lead to the formation of a radioactive nucleus and therefore questioning the claim of MIXE as a non-destructive method. We nevertheless note that a typical experiment requires about 10 6 muons implanted into the sample, and depending on the nucleus, a fraction of these will be captured by it. Such a low number of possibly created radioactive nuclei is negligible in comparison to the number of atoms present in a typical sample, which is of the order of the Avogadro number.
Presently, there are multiple applied research muon beam facilities in the world in operation: (i) Paul Scherrer Institute (PSI), Switzerland; (ii) ISIS, Rutherford Appleton Laboratory (RAL), United Kingdom; (iii) TRI Univeristy Meson Facility (TRIUMF), Canada; (iv) Japan Proton Accelerator Research Complex, MUon Science Establishment (J-PARC MUSE) and (v) MUon Science Innovative Channel (MuSIC), Japan. The interested reader is referred to comprehensive review of Hillier et al. [46] about accomplishments, present research and future capabilities at the institutes listed above. The cyclotron-based high beam duty factor facilities at PSI, TRIUMF, and MuSIC provide continuous muon beams to the experimental areas. The continuous muon beams allow detecting each incident muon impinging on the experimental target one-at-a-time. In our experiments, the next muon arrives on average after >10 muon lifetimes, allowing sufficient time for the previous muon to decay or be captured by the nucleus and therefore minimizing event pile-up in the germanium detectors, which are used to detect the μ -X rays.
In the following, we will demonstrate that a continuous muon source, such as PSI, is the ideal place to perform fast and precise MIXE measurements and that within a few minutes of data collection one obtains a clear elemental identification. This enables systematic measurements of a large number of samples in a short period of time. We would like to stress that the use of the MIXE technique to perform elemental analysis at PSI already started decades ago [47,48,49], but was hampered by the available muon rates at that time. Nevertheless, already very promising results were obtained. Nowadays, the beam intensity is at least a factor of 20 higher, opening new application possibilities of this technique.

3. Experimental Details and Results

The MIXE experiment was performed using the π E1 beamline, fed by the High Intensity Proton Accelerator (HIPA) [50] of the Paul Scherrer Institute (PSI), Switzerland. This beamline is capable of delivering positive or negative muons [51]. With this beamline, we could achieve typical muon rates of ∼1.5 kHz and ∼60 kHz at momentum p = 20 and 45 MeV/c, respectively, with momentum bite Δ p / p = 2% ( σ = Δ p ). We also observed a pile-up of ∼1% with the muon rates of ∼60 kHz. Even at momentum bite of 0.5%, we could obtain reasonable muon rates, which would be ideal for the investigation of thin samples. As the π E1 beamline of the HIPA accelerator complex at PSI delivers a continuous beam, one has to detect the individual arrival time of each muon using a muon entrance detector, made of polyvinyltoluene (BC-400), and of 200 μ m thickness. In addition, a 5 mm thick BC-400 muon counter with a 18 mm (diameter) hole was placed just before the muon entrance counter. This detector served as a collimator and veto detector at the same time. Together with a 1.5 m drift tube, from the last quadrupole of the beamline to the muon detector arrangement, this guaranteed that the long focal distance resulted in a similar sized beam spot on target. The experimental apparatus (see Figure 1 and [52]) was originally developed for the muX experiment [53]. It consisted of a planar detector and a stand-alone coaxial detector (efficiency, ϵ 70%) from PSI; a stand-alone coaxial detector ( ϵ 75%) from KU Leuven; one MINIBALL cluster module, with three detector crystals ( ϵ 60% each), from KU Leuven [54]; seven compact coaxial detectors ( ϵ 60%) from the IN2P3/STFC French/UK Ge Pool [55]; and a low-energy detector from ETH Zürich. So, in total we had twelve coaxial and two low-energy Ge detectors. Out of the above-mentioned detectors, two of these had a BGO anti-Compton shield. The timing resolution of this setup was ∼50 ns and ∼20 ns at 200 keV and 1 MeV, respectively. The energy and efficiency calibrations for this detector setup was done using the standard radioactive sources of 152 Eu, 88 Y, 60 Co and 137 Cs. The target consisted of a three-layered sandwich sample of iron (Fe), titanium (Ti), and copper (Cu) plates and was placed in vacuum. Each layer was 500 μ m thick with a diameter of 26.5 mm. There were two main purposes of measuring such a sandwich sample consisting of pure elements: (i) to demonstrate the possibility of measuring the different μ -X rays and gamma-rays for different elements, (ii) to determine if by changing the muon momentum, we are able to probe the element present at different depths inside the sample and how such measurements correlate with simulations for penetration depths of negative muons. Hence, the measurement of such a simple sample acts as proof of principle for later precise measurements on actual samples like archaeological artefacts, battery and meteorite samples where the depth-dependent elemental compositions are of interest. The simple geometry of the sample was also chosen to benchmark our results with the ones obtained in a similar sample at the pulsed muon source ISIS [29].
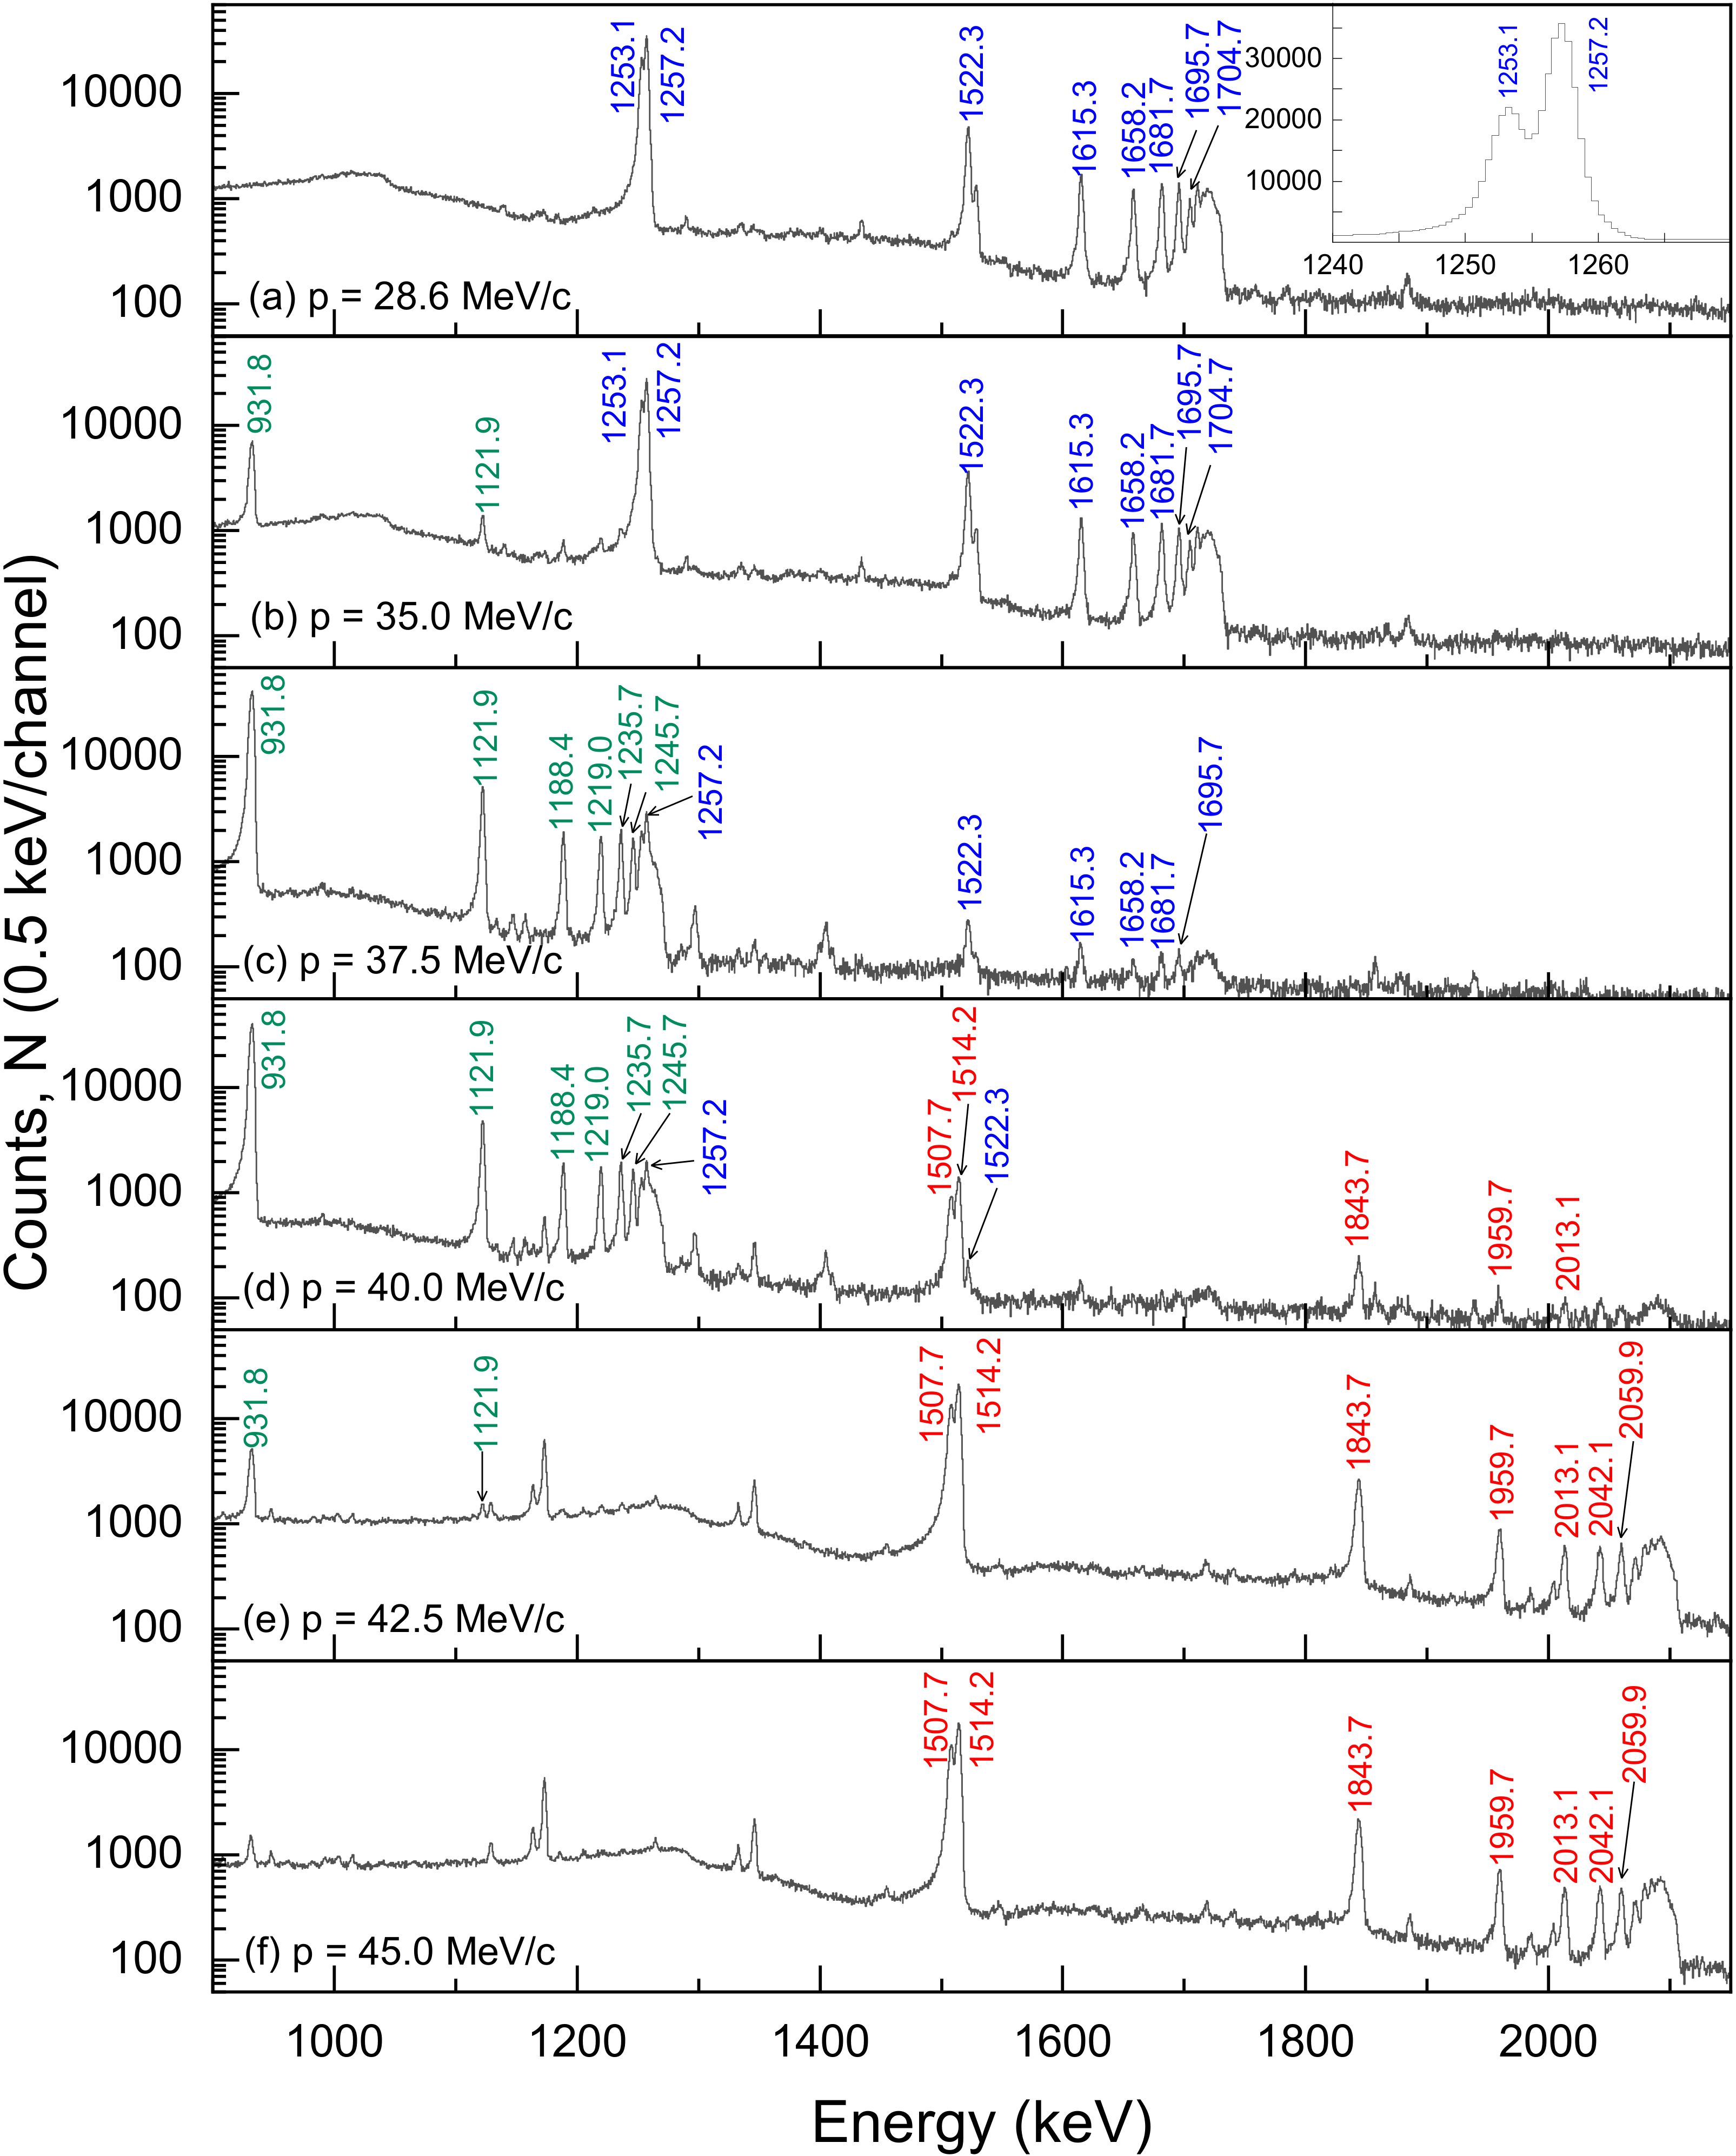
The sample was measured at six different muon momenta, p = 28.6, 35.0, 37.5, 40.0, 42.5, and 45.0 MeV/c, with momentum bite Δ p / p = 2% ( σ = Δ p ). A data collection time of 30 min was used for each muon momentum. The statistical uncertainty of the presented raw spectra follows the Poisson statistics ( σ = N ) and is therefore omitted in the figures for visibility of the smaller peaks. A comparison of the presented spectra to data, taken at other facilities can be performed, by taking into account the according bin widths (stated in the y-labels). Figure 2 shows the μ -X ray spectra of the muonic K-series, measured with all the twelve coaxial Ge detectors, for the six different muon momenta, in the energy range 900 < E < 2150 keV. At the lowest momentum (p = 28.6 MeV/c) (Figure 2a), all the muons stop in the first sample layer and one is able to observe the entire K-series of the μ -X rays from Fe. In addition, the 2 p 3 / 2 1 s 1 / 2 (K α 1 ) and the 2 p 1 / 2 1 s 1 / 2 (K α 2 ) transitions at 1257.2 keV and 1253.1 keV are resolved, as shown in the inset of Figure 2a.
Upon increasing the muon momentum, one detects first the μ -X rays from both the Fe and Ti layers (p = 35.0 and 37.5 MeV/c, see Figure 2b,c); then the ones from all the three Fe, Ti and Cu layers (p = 40.0, see Figure 2d). At p = 42.5 MeV/c (Figure 2e), one looses the Fe-signal and only Ti and Cu μ -X rays are observed. At p = 45.0 MeV/c (Figure 2f), only the Cu muonic X-rays are observed. It should be noted that the photopeak signal-to-noise ratio (SNR) is ∼20 for the K α line of Cu (see Figure 2f).
To perform the analysis and estimate where the muons are stopping, we have chosen the characteristic μ -X ray peaks of the three layers as follows: (i) K α 1 (1253.1 keV) and K α 2 (1257.2 keV) lines of Fe, (ii) K α (931.8 keV) of Ti, and (iii) K α 1 (1507.7 keV) and K α 2 (1514.2 keV) lines of Cu. The intensity of these peaks was obtained by dividing the area under these peaks (after a proper background subtraction, as described in Ref. [56]) by the efficiency at the corresponding energies.
Since at p = 28.6 MeV/c, we see only the Fe lines, the total intensity of the K α 1 (1253.1 keV) and K α 2 (1257.2 keV) peaks is normalized to 100. At p = 35.0 MeV/c, as both Fe and Ti lines are present, the intensities of the peaks of Fe and Ti are normalized in such a manner that both sum up to 100. The same procedure is followed for the rest of the muon momenta. By analyzing the relative intensities of the different peaks, we are thus able to estimate experimentally the fraction of the muon ensemble stopping in the different layers at a given muon momentum.
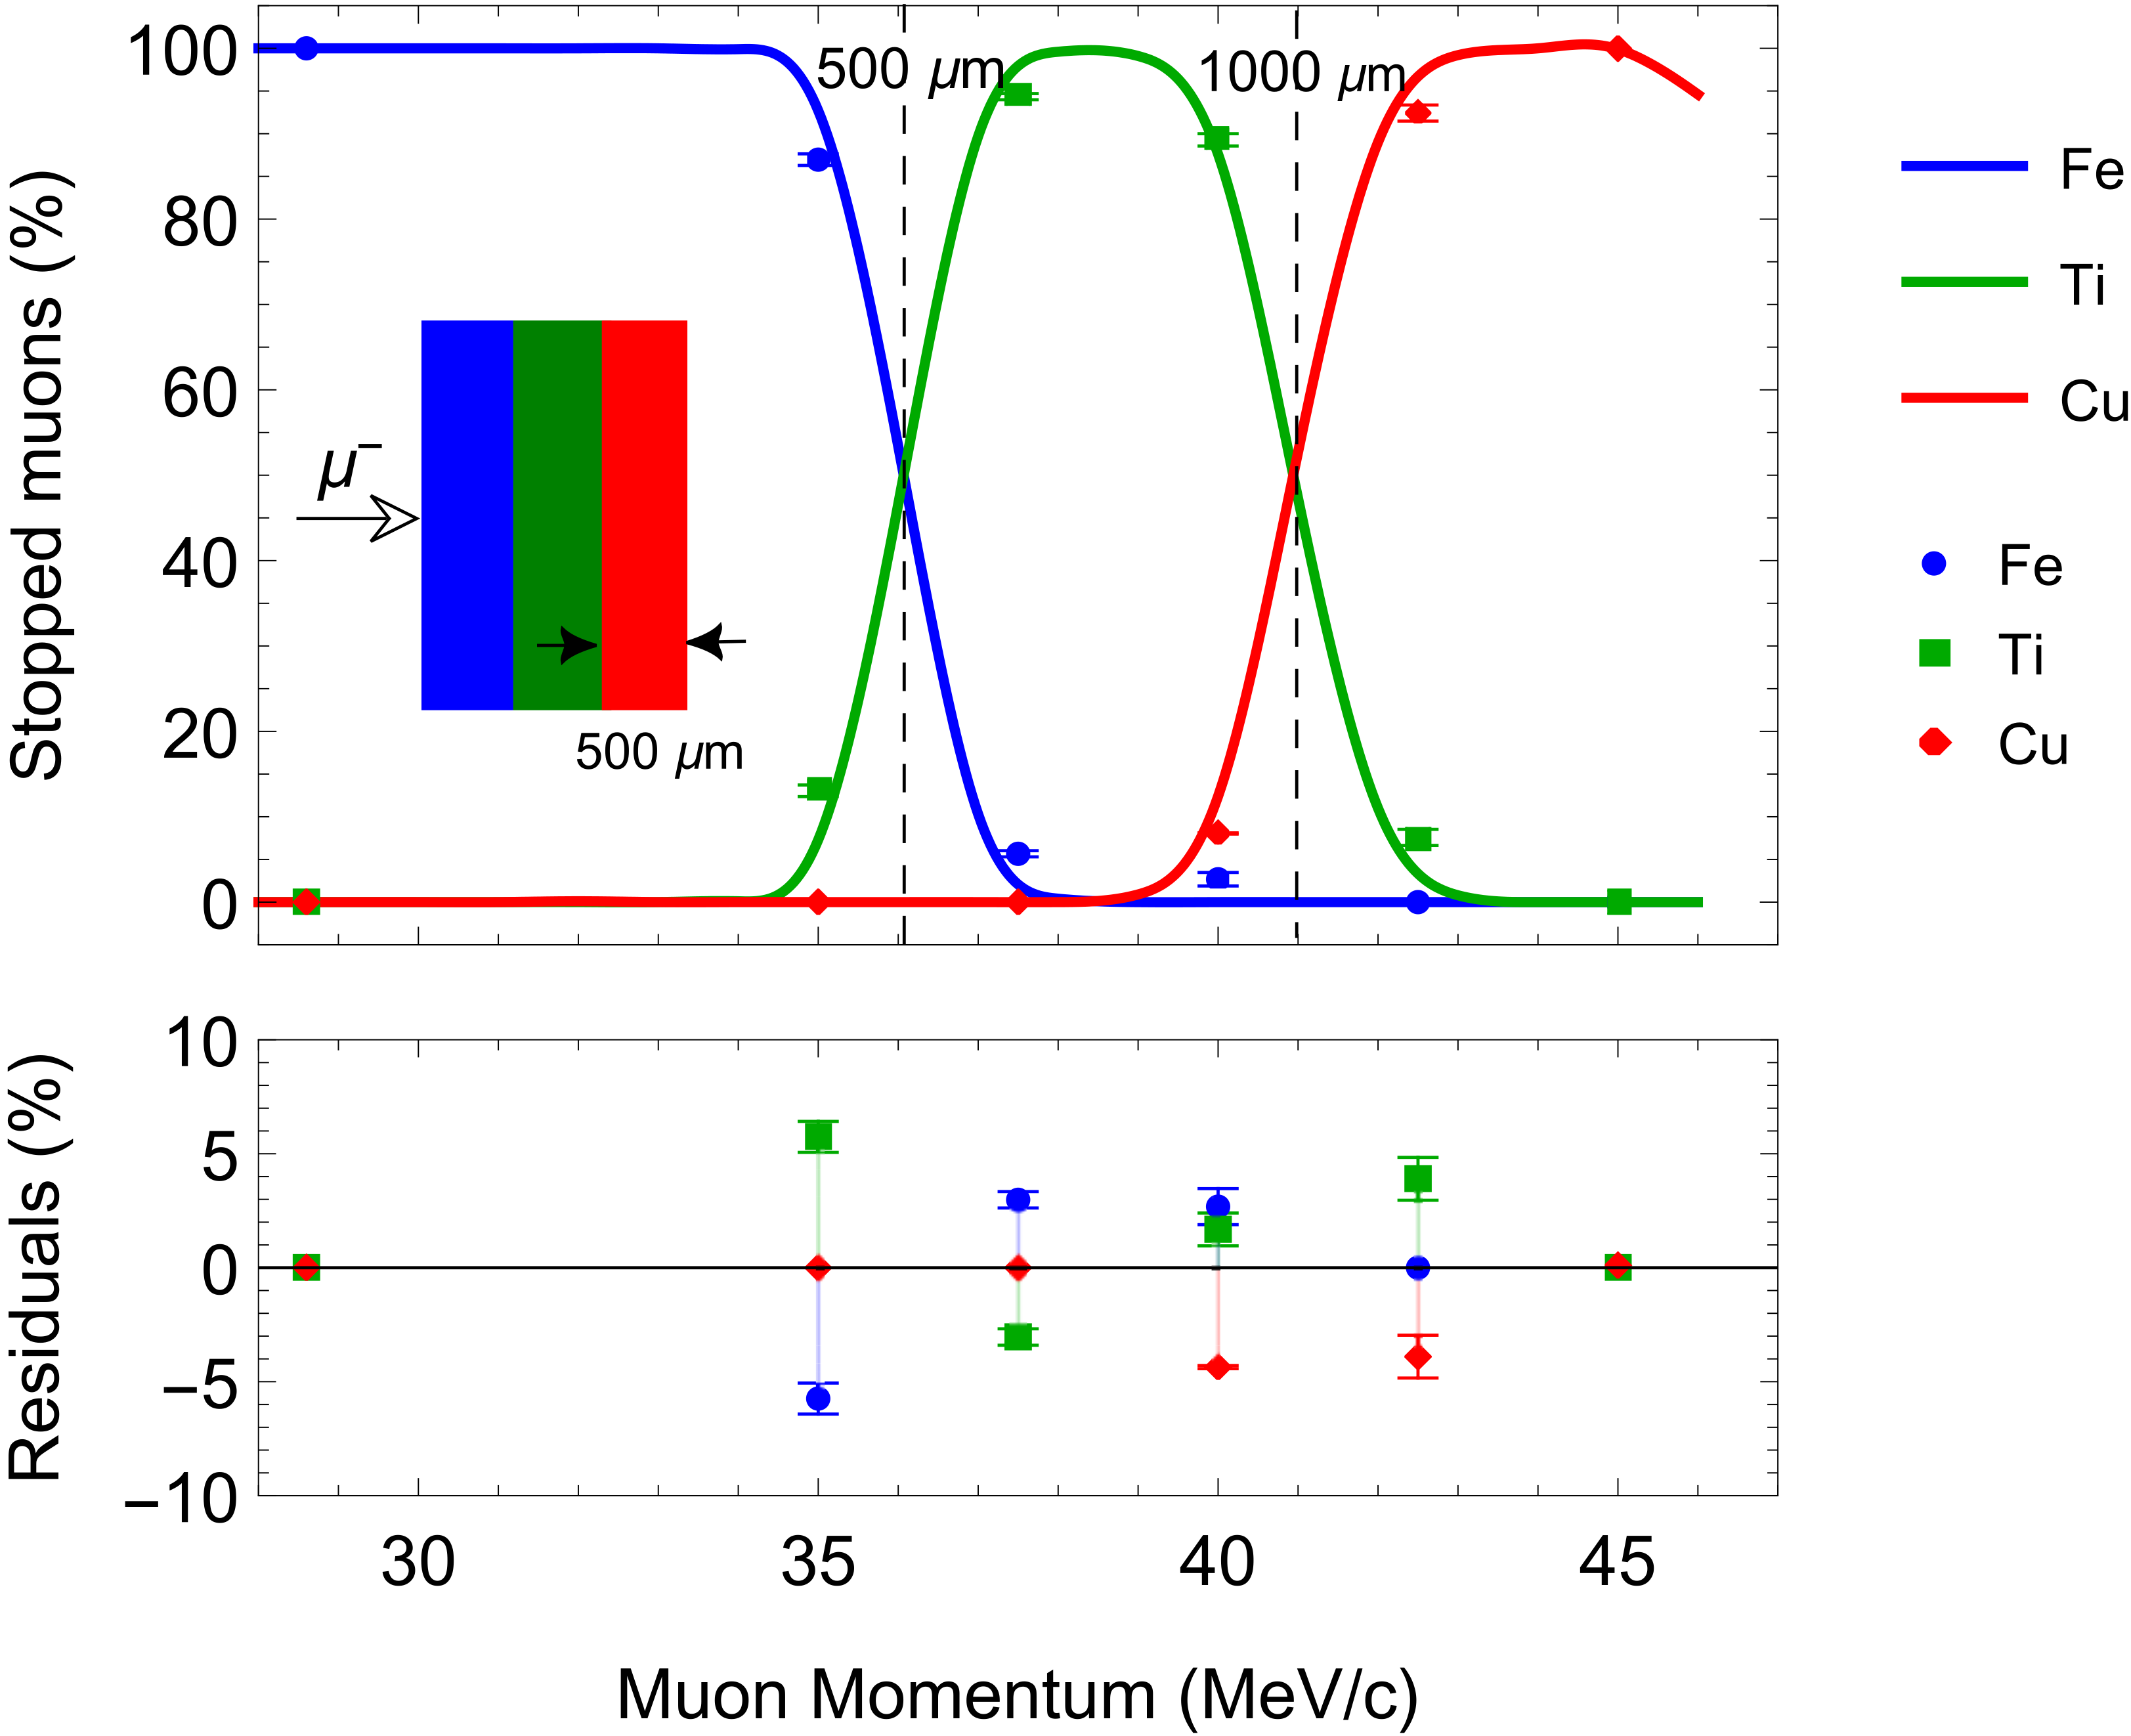
To validate our approach, we compared our results with stopping profile simulations obtained with the Particle and Heavy Ion Transport code System (PHITS) simulation tool (ver. 2.88) [57,58]. The PHITS simulations were used to represent the interaction of the negative muon beam, with a given muon momentum (p) and a Gaussian momentum distribution with standard deviation σ = Δ p (relative width Δ p / p = 2 % ), on the three-layered sandwich sample (Fe, Ti, and Cu) placed in vacuum, including the 200- μ m-thick muon entrance detector. The simulations were carried out from p = 28 to 46 MeV/c, at intervals of 1 MeV/c to obtain the percentage of muons stopping in a given layer and the penetration depths of the muons. The interpolated simulated data points (using Hermite interpolation of order three) are shown as solid lines (blue for Fe, green for Ti, and red for Cu) in Figure 3a. The efficiency corrected and normalized intensities (as described in the previous paragraph) of the muonic K α lines of Fe, Ti, and Cu were used to estimate the percentage of muons stopping in each layer. They are shown in the figure as blue filled circles, green filled squares and red filled diamonds, respectively. The difference between the experimental and the simulated points, called the residuals, at the six different muon momenta is shown in Figure 3 (bottom panel). From this plot, one can see that we obtain a very good agreement, within ∼10%.
The high rates, low pile-up and excellent SNR (see Figure 2) allows the analysis of elemental composition in a short time scale (30–60 min). This opens the possibility of statistically intense applications like an elemental 3D-tomography employing a transmission muon tracker (a hodoscope similar to the one described in Ref. [18]). The continuous muon beam of PSI will allow the unique feature of individual muon tracking. Therefore, in contrast to scanning techniques by collimation, a 3D tomography at PSI will not hamper any rates or efficiencies discussed in this manuscript. Thus, the overall acquisition time scales only with the chosen discretization. The use of such a hodoscope would also allow a superior offline collimation compared to the common practice of physical collimation, as employed with our veto counter. An adapted collimation on a sample-by-sample basis is e.g., important for cases of in-planar inhomogeneity and/or for a region-of-interest smaller than the beam spot.
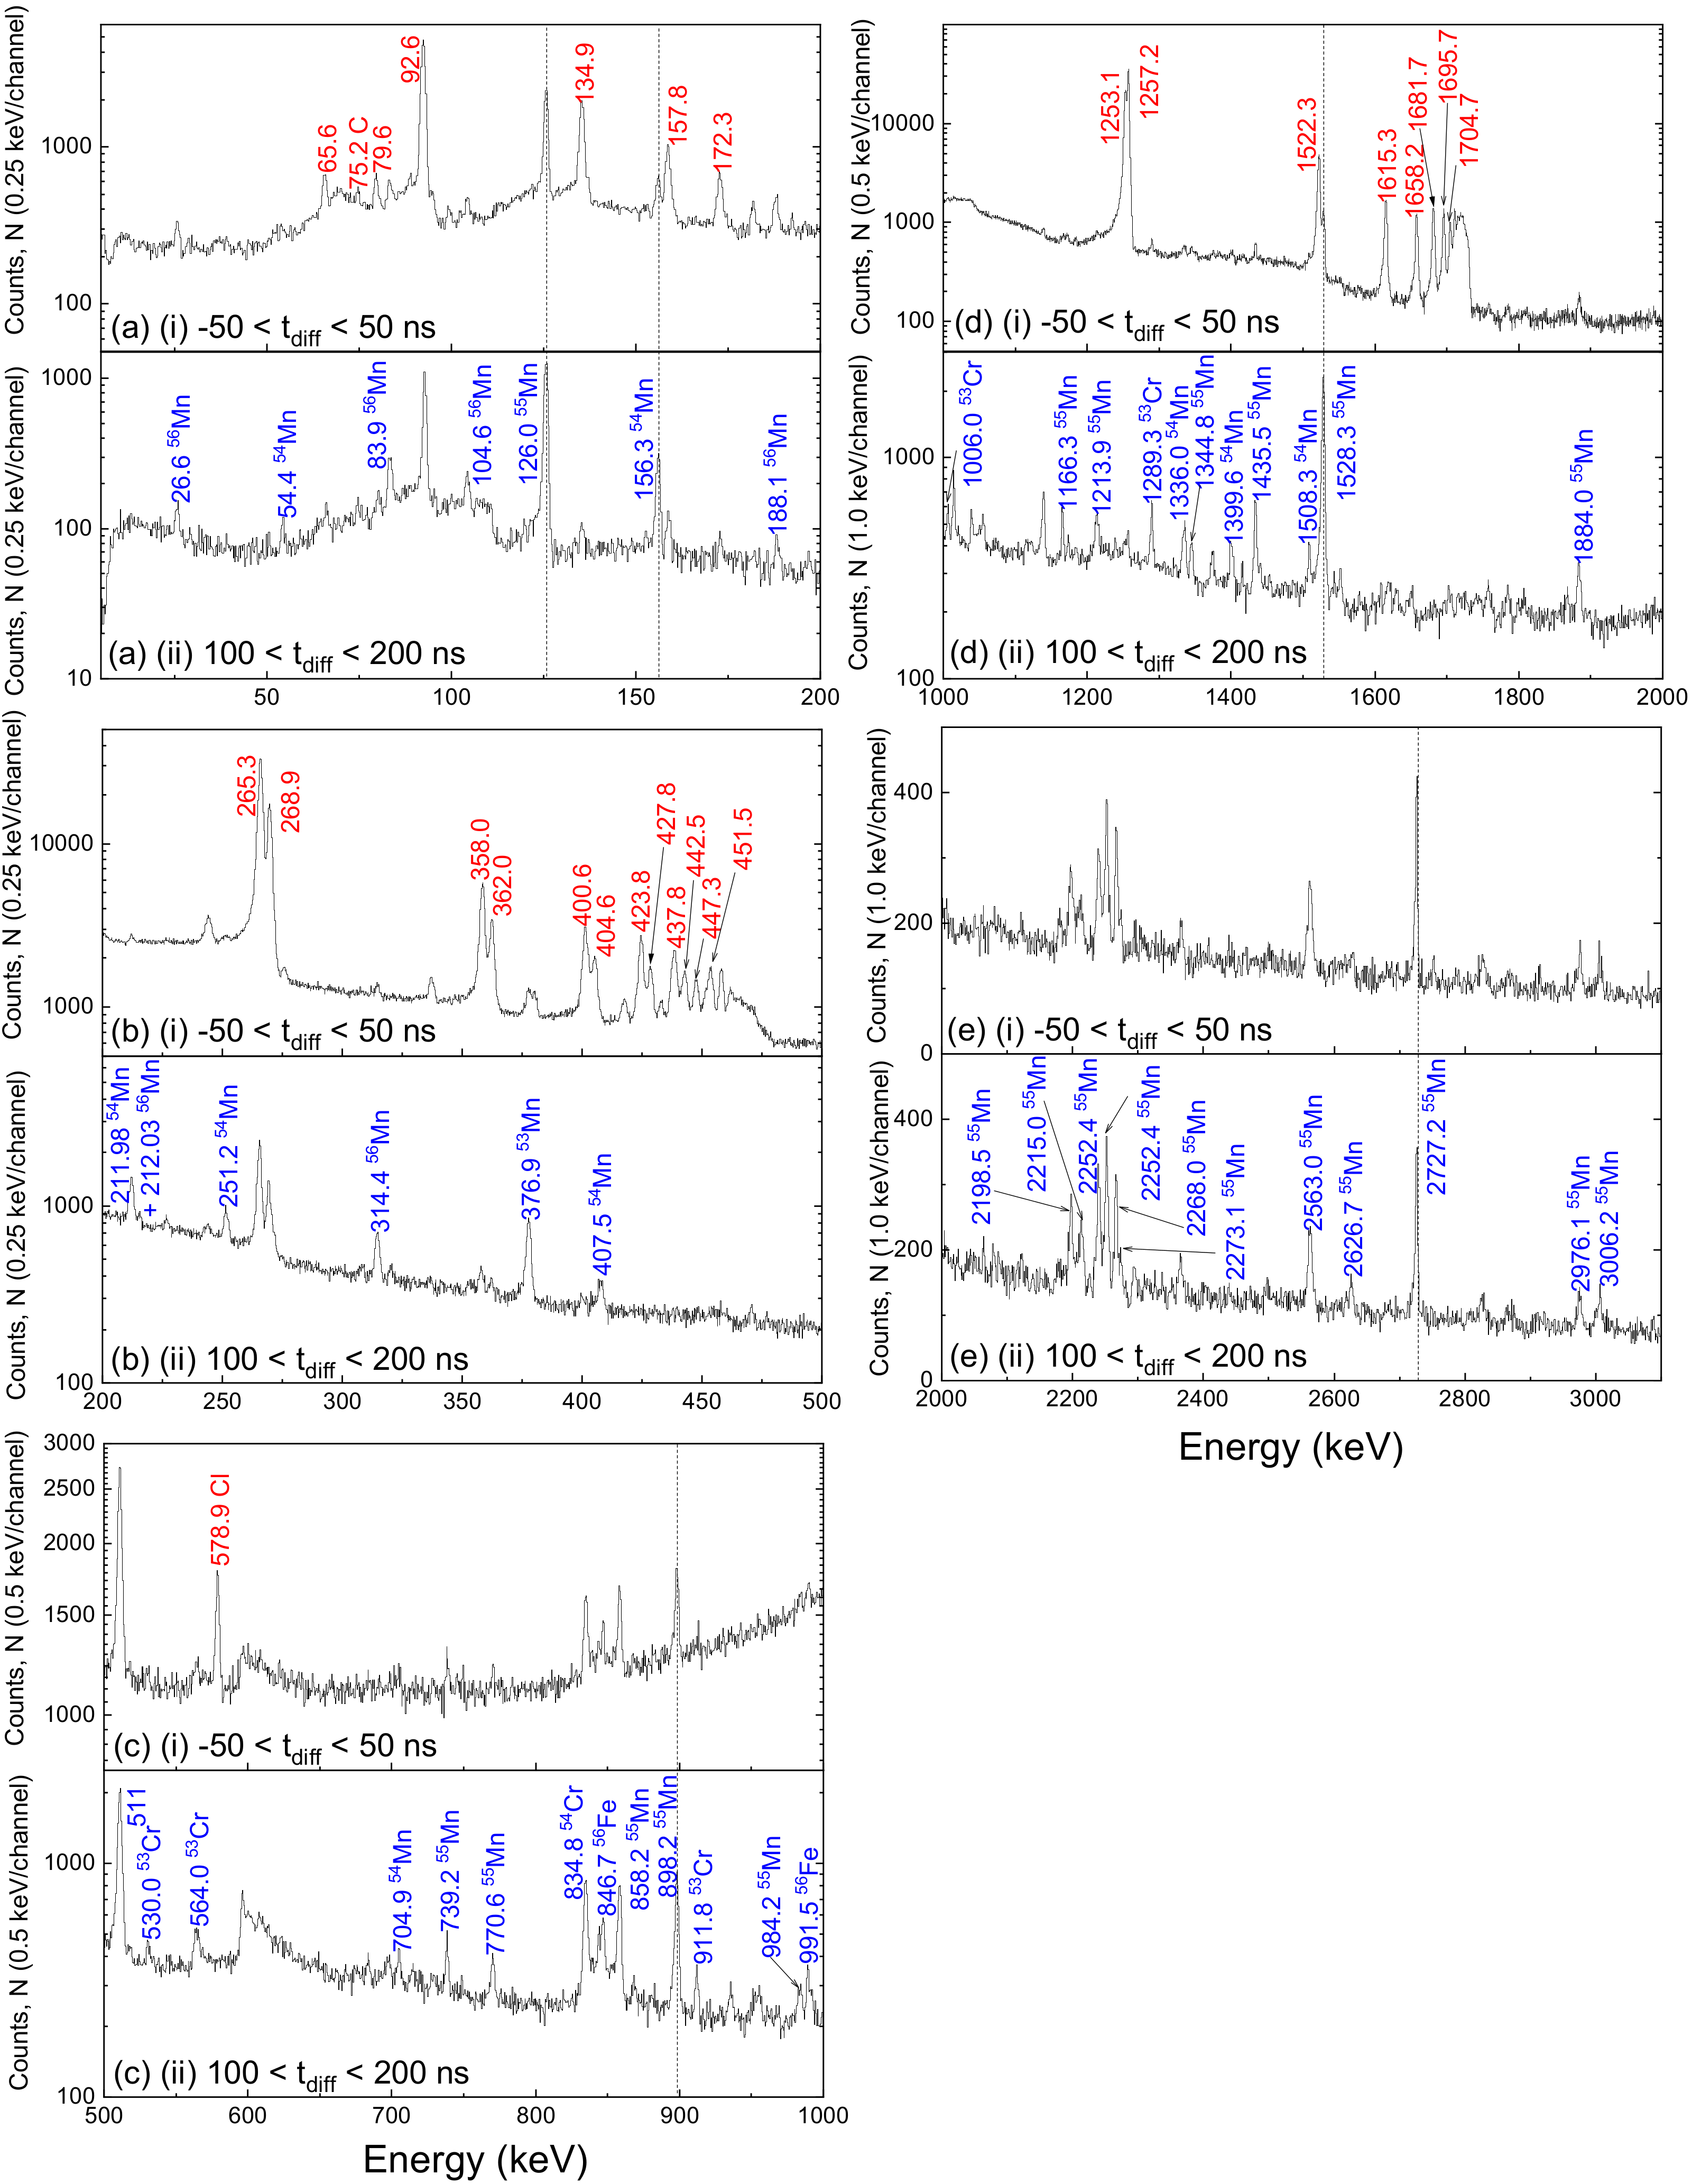
In addition to the μ -X rays, the gamma-rays produced after the nuclear capture of muons have also been observed in the present experiment. We show this for the data measured at the muon momentum of p = 28.6 MeV/c, where all the muons stop in the very first Fe layer. The gamma-rays, resulting from the nuclear capture in Fe, were previously studied in Ref. [61] and Ref. [60]. In Ref. [61], only six gamma-rays were detected in the Fe spectrum, resulting from the isotopes 56 Fe ( μ , ν γ )   56 Mn, 56 Fe ( μ , ν n γ )   55 Mn, 56 Fe ( μ , ν 3 n γ )   53 Mn, and 56 Fe ( μ , ν p n γ )   54 Cr. A gamma-ray at 847 keV was observed, due to the decay of the first excited state of 56 Fe, in both the prompt μ -X ray and the delayed gamma-ray spectra. The presence of this 847 keV in the delayed spectrum was explained to be arising due to the inelastic scattering of the 56 Fe nucleus by neutrons following the muon capture. In the other Ref. [60], up to forty-nine gamma-rays originating from the de-excitation of the 56 Fe ( μ , ν γ )   56 Mn, 56 Fe ( μ , ν n γ )   55 Mn, 56 Fe ( μ , ν 2 n γ )   54 Mn, 56 Fe ( μ , ν 3 n γ )   53 Mn and 56 Fe ( μ , ν p n γ )   54 Cr isotopes were observed. From our analysis, we observed all the gamma-rays mentioned in the previous two references. In addition, we also observe the gamma rays from 56 Fe ( μ , ν p 2 n γ )   53 Cr or 54 Fe ( μ , ν p γ )   53 Cr.
Figure 4a shows the μ -X ray and gamma-ray spectra from Fe in the energy range 0–200 keV, measured using the two low-energy germanium detectors. In order to differentiate between these two spectra, a time-gate cut has been applied. As the muon cascade down to the 1 s ground state is almost instantaneous after its capture by an atom, the associated μ -X ray emission will happen basically in coincidence with the muon entrance time. Therefore, by applying a time-cut of −50 ns < t d i f f < 50 ns one selects primarily the μ -X rays of Fe (see Figure 4(ai), where the μ -X rays of the N-series at 65.6 , and 79.6 keV and of the M-series at 92.6 , 134.9 , 157.8 , and 172.3 keV are observed, already reported in Refs. [59,62]). Here, t d i f f is the time difference between the muon entrance counter and the germanium detector. Similarly, by using a time cut of 100 ns < t d i f f < 200 ns, i.e., a time range where the μ -X rays have already been emitted, the μ -X rays are no more present in the histogram and solely the gamma-rays are obtained (see Figure 4(aii)). Figure 4(aii), exhibits the gamma-rays from the 54 56 Mn nuclei. None of those have been reported in previous works, probably because these transitions are at low energy. The energy values of these gamma-rays were taken from the adopted level schemes in National Nuclear Data Center (NNDC) [63]. Some uncertainty was related to the existence of the 126 keV state [61], as the observation of a 858 keV gamma-ray was reported, which is a result of the decay from 984 keV state to the 126 keV state. Our present data clearly confirms the existence of the 126 keV state, since we observed the 126 keV gamma-ray. Since the time difference between the emission of the μ -X rays and the gamma-rays is very small, one would still observe the gamma-rays (but with much lower intensity compared to the μ -X rays) also in the prompt μ -X ray spectrum. We observe this in Figure 4a and some of these peaks are marked with a black dashed line.
Figure 4(bi,ii) shows the μ -X ray and gamma-ray spectra from Fe in the energy range 200–500 keV, measured using all the twelve coaxial detectors. We observe μ -X rays of the L-series at 265.3, 268.9, 358.0, 362.0, 400.6, 404.6, 423.8, 427.8, 437.8, 442.5, 447.3, and 451.5 keV, as observed in Ref. [47]. The gamma-rays are from the 53 , 54 , 56 Mn isotopes. Figure 4c shows the μ -X ray and gamma-ray spectra from Fe in the energy range 500–1000 keV, measured using again all the twelve coaxial detectors. Figure 4(ci) shows a μ X-ray of 578.9 keV, but this does not belong to Fe. This is the muonic K α line of Cl, which is present in the plastic (PVC), a cylindrical shaped plastic sample holder. It is to be noted that we also observed the muonic K α line of C at 75.2 keV (Figure 4(ai)). The gamma-rays are from 54 , 55 Mn, 53 , 54 Cr, and 56 Fe isotopes, as shown in Figure 4(cii). All these gamma-rays, except those of 53 Cr, were observed in the previous references. Figure 4d exhibits the μ X-ray and gamma-ray spectra from Fe in the energy range 1000–2000 keV. The μ X-rays of the K-series at 1253.06 , 1257.19 , 1522.3 , 1615.3 , 1658.2 , 1681.7 , 1695.7 , and 1704.7 keV are observed (see also Ref. [60]). The gamma-rays originate from 53 , 54 , 55 Mn and 53 Cr isotopes. All these gamma-rays, except those of 53 Cr, were observed in the previous references.
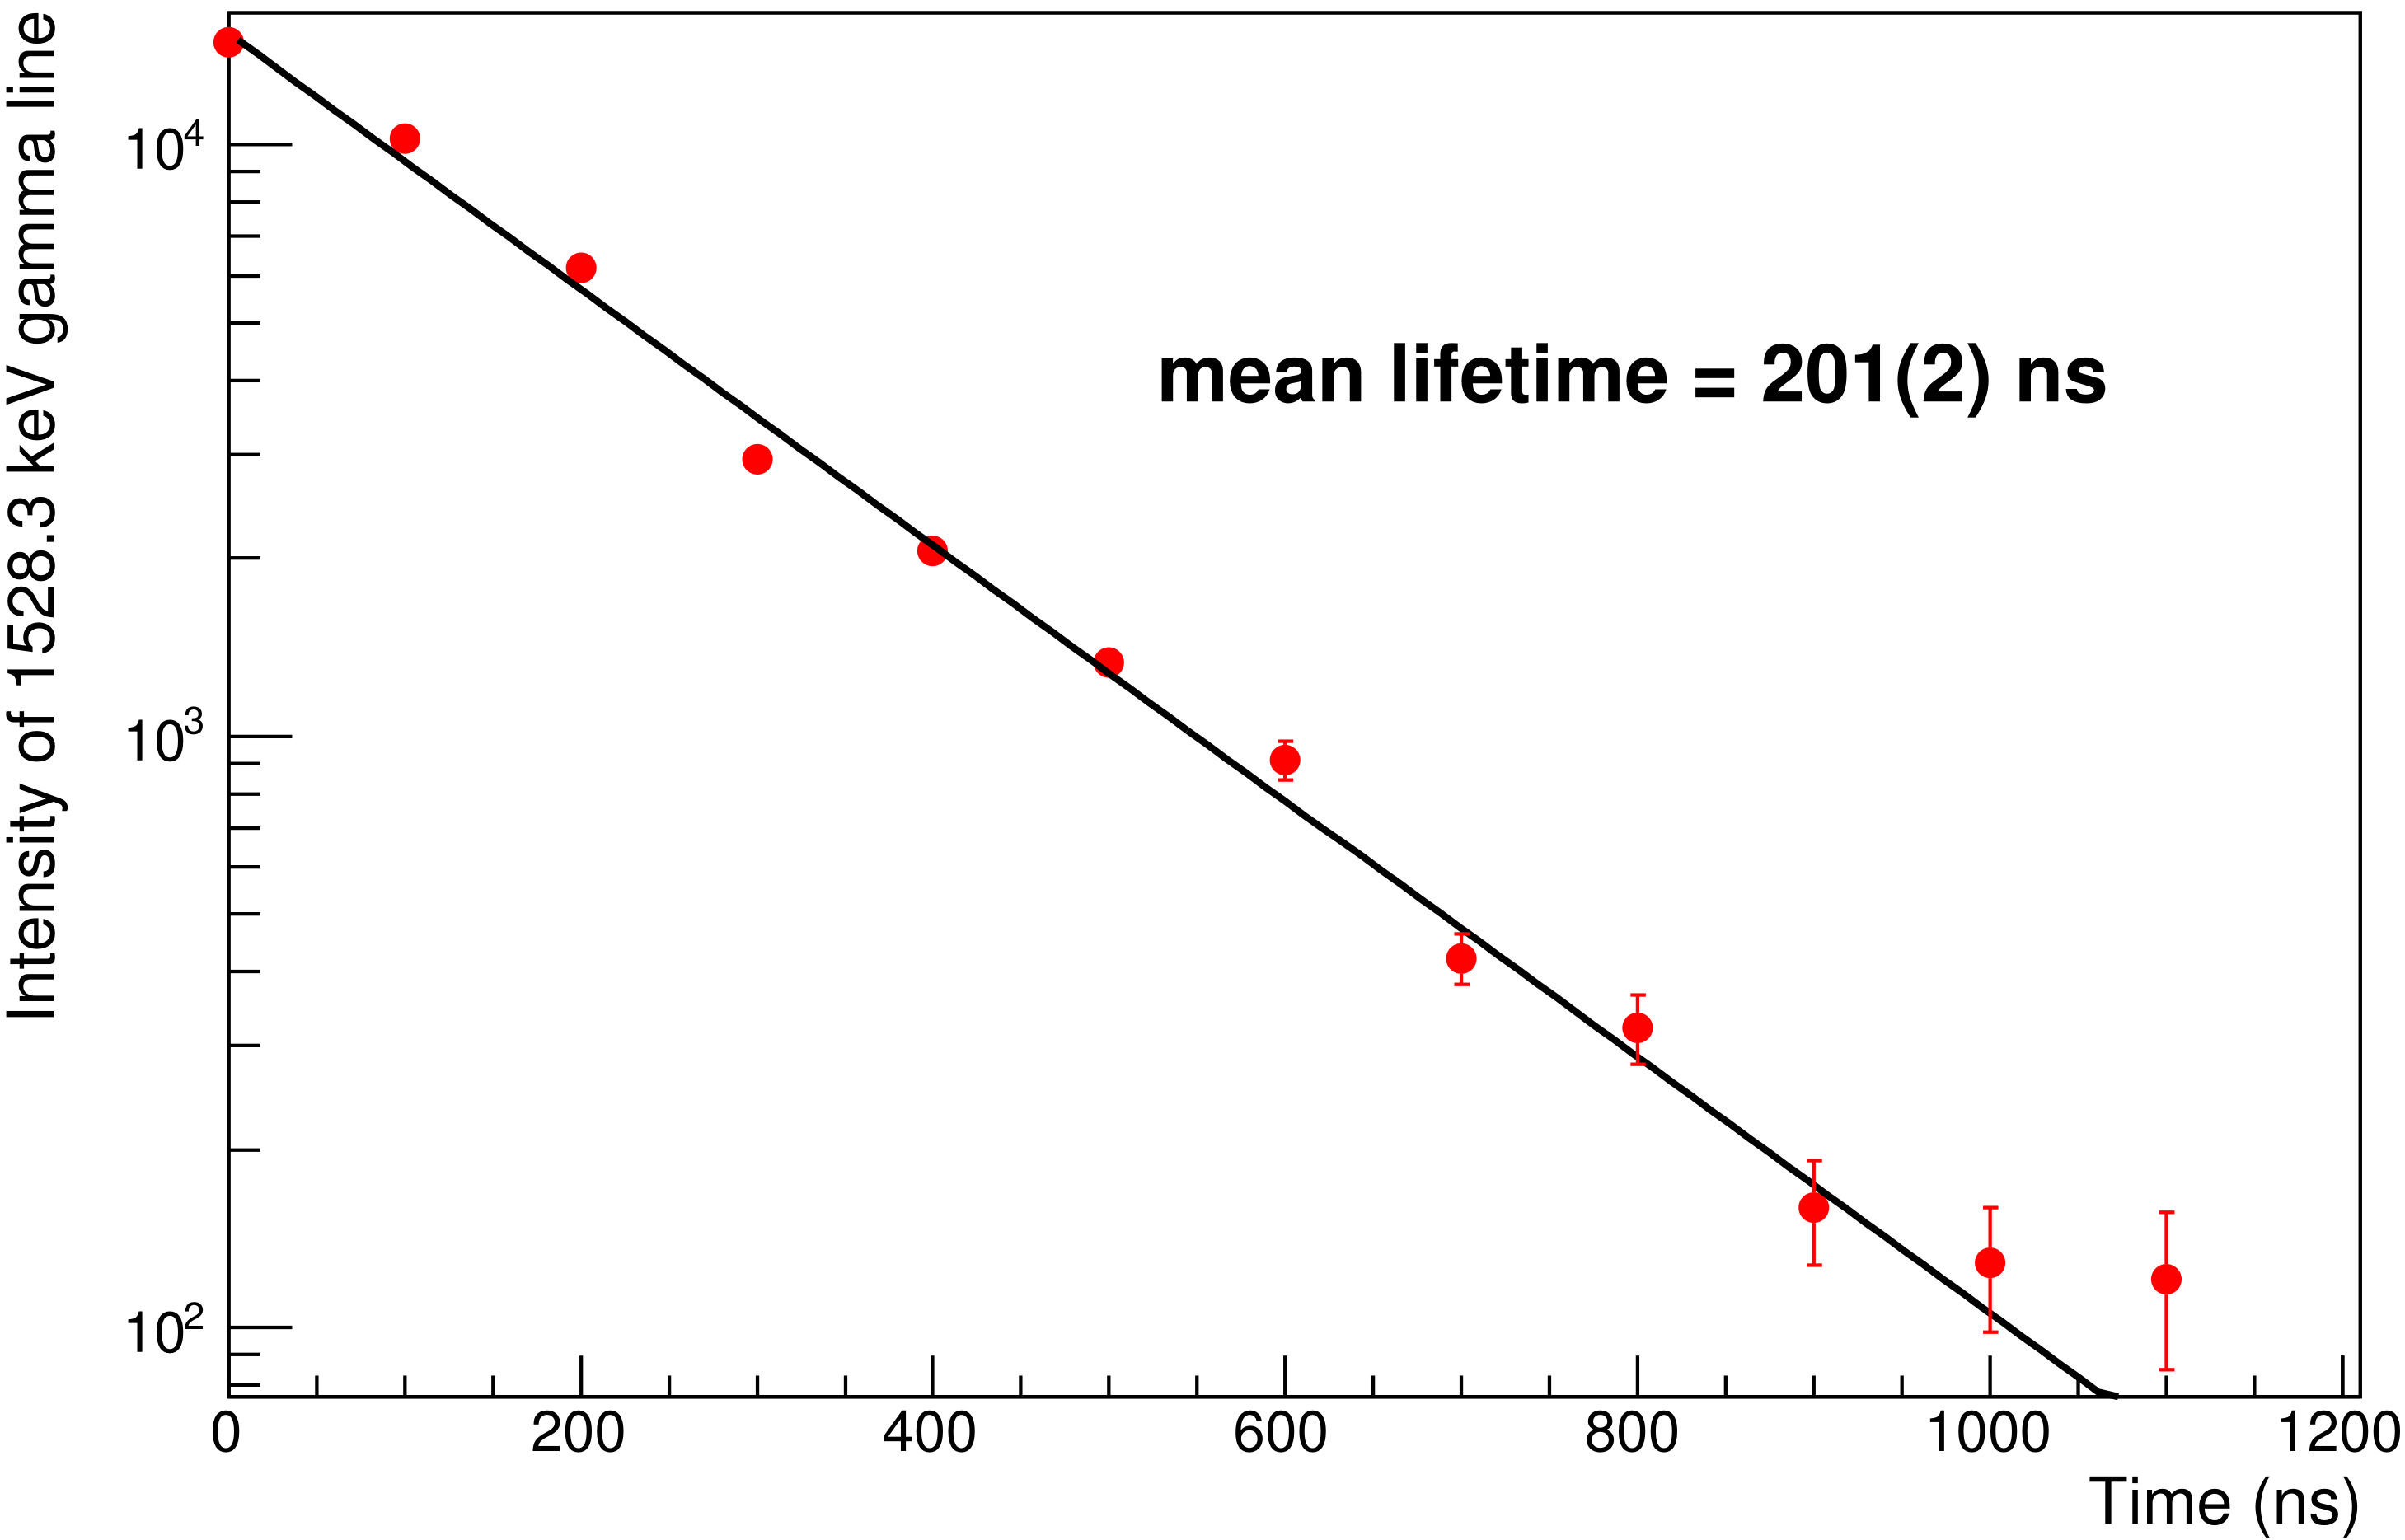
With respect to the muon lifetime ( τ μ = 2.2 μ s), the emission of muonic X-rays ( τ X - ray < 10 13 s) can be seen as in coincidence with the formation of the muonic atom, while the emission of gamma-rays ( τ γ < 10 12 s) in coincidence with the nuclear capture of the muon. Therefore, the measurement of the gamma-rays as a function of time can be used to determine the muon lifetime in a particular element in the sample. As an example, we report here in Figure 5 the intensity of the 1528.3 keV gamma-ray (from muon capture in Fe at p = 28.6 MeV/c) as a function of the time of the Ge detector signals (in 100 ns wide windows). The fit of this plot results in a mean lifetime of muon in Fe to be 201(2) ns, which is in good agreement with the values of 201(4) [64], 207(3) [65], 206.7(2.4) [66] and 206.0(1.0) ns [45]. We note here that this muon lifetime determination was not our primary goal and that a measurement as short as 30 min already provides an excellent precision. Hence, it appears that the identification of the gamma-rays and the determination of the mean lifetime of the muon act as additional proofs for the elemental identification. And we stress again that the determination of the mean lifetime of all elements is only possible due to the continuous muon beam, where each muon arrival time is measured.

4. Summary and Conclusions

By measuring a three-layered sandwich sample of known elements, we demonstrated the advantages of using the Muon Induced X-ray Emission (MIXE) technique at continuous muon beams, available at PSI. The presence of the characteristic muonic X-rays ( μ -X rays) from these known elements provides a detailed picture of the elemental composition of the different elements as a function of depth. The good agreement between the experimental and simulated data validates our data acquisition and analysis procedures. Moreover, it will allow us to utilize the simulation to design future experiments and implement a more sophisticated iterative simulation procedure, which would take into account the absorption of μ -X rays in irregular shaped samples of non-uniform densities. The missing time structure of the beam resulting in the low SNR of <1% combined with the high rates will allow the tracking of individual muons with a transmission hodoscope. This opens the possibility of the future application of elemental 3D-tomography by discretizing the impact positions while scanning momentum for different implantation depths. Such configuration can utilize the full rate of the PSI beamline and, therefore, the acquisition time will merely scale with the desired 3D voxelization. Moreover, it will allow an offline collimation to adapt the analysis on a by-sample basis.
The possibility to detect gamma rays of the excited daughter isotopes after nuclear capture of the muon, in addition to the μ -X rays, provides a further confirmation of the identification of the elements. Relying on this success, it is clear that this technique, applied at continuous muon beams, appears as a very powerful tool to analyze different types of samples, which could be precious (as archaeological artefacts) or rare (as meteorite or “returned” samples). By exploiting the depth-dependent elemental identification and the short measurement times, we foresee to even perform experiments in operando devices, such as batteries, to track elemental composition changes.

Author Contributions

Conceptualization, A.A. (Alex Amato), H.L., A.K.; formal analysis, S.B., A.A. (Alex Amato); methodology & investigation, A.A. (Aldo Antognini), N.B., T.E.C., R.D., P.I., K.J., K.K., A.K., A.P., R.P., M.P., E.R., P.R., N.R., S.R., A.S., N.S., S.M.V., F.W., L.W.; software, A.K., A.S., F.W.; resources, K.K., A.K., E.R., S.R.; data curation, H.L., A.K., S.M.V.; writing—original draft preparation, S.B., A.A. (Alex Amato); writing—review and editing, S.B., L.G., A.A. (Alex Amato), T.P., H.L., T.E.C., A.K., S.R., K.K., S.M.V., F.W.; funding acquisition, A.A. (Alex Amato). All authors have read and agreed to the published version of the manuscript.

Funding

Our research was funded by the Swiss National Science Foundation, Sinergia project “Deep μ ”, Grant: 193691 (https://www.psi.ch/en/smus/muon-induced-x-ray-emission-mixe-project, accessed on 30 November 2021). The germanium detector array was installed and operated by the muX collaboration (https://www.psi.ch/en/ltp/mux accessed on 30 November 2021) funded by FWO-Vlaanderen (Belgium), the Paul Scherrer Institute through the Career Return Programme, the Cluster of Excellence “Precision Physics, Fundamental Interactions, and Structure of Matter” (PRISMA EXC 1098 and PRISMA+ EXC 2118/1) funded by the German Research Foundation (DFG) within the German Excellence Strategy (Project ID 39083149), the German Research Foundation (DFG) under Project WA 4157/1, and the Swiss National Science Foundation through the Marie Heim-Vögtlin Grant no. 164515 and project Grant no. 200021_165569.

Institutional Review Board Statement

Not applicable.

Informed Consent Statement

Not applicable.

Data Availability Statement

The data presented in this study are available on request from [67].

Acknowledgments

Use of Ge detectors of the French-UK IN2P3-STFC Gamma Loan Pool is acknowledged.

Conflicts of Interest

The authors declare no conflict of interest.

References

  1. Lannon, J.M., Jr.; Stinespring, C.D. Auger Electron Spectroscopy in Analysis of Surfaces. In Encyclopedia of Analytical Chemistry; American Cancer Society: Carthage, MO, USA, 2006; p. 1. [Google Scholar] [CrossRef]
  2. Newbury, D.E.; Ritchie, N.W.M. Is Scanning Electron Microscopy/Energy Dispersive X-ray Spectrometry (SEM/EDS) Quantitative? Scanning 2013, 35, 141–168. [Google Scholar] [CrossRef]
  3. Colton, R.J. Molecular Secondary Ion Mass Spectrometry. J. Vac. Sci. Technol. 1981, 18, 737. [Google Scholar] [CrossRef]
  4. Barnes, R.M. Inductively coupled plasma atomic emission spectroscopy: A review: In the less than 10 years since the commercial introduction of inductively coupled plasma (ICP) instruments, ICP atomic emission spectroscopy (AES) has developed into one of the most used new analytical tools of the decade. TrAC Trends Anal. Chem. 1981, 1, 51–55. [Google Scholar] [CrossRef]
  5. Pröfrock, D.; Prange, A. Inductively Coupled PlasmaMass Spectrometry (ICP-MS) for Quantitative Analysis in Environmental and Life Sciences: A Review of Challenges, Solutions, and Trends. Appl. Spectrosc. 2012, 66, 843–868. [Google Scholar] [CrossRef] [PubMed]
  6. Aziz, M.; Ismail, A. Chapter 5—X-ray Photoelectron Spectroscopy (XPS). In Membrane Characterization; Hilal, N., Ismail, A.F., Matsuura, T., Oatley-Radcliffe, D., Eds.; Elsevier: Amsterdam, The Netherlands, 2017; pp. 81–93. [Google Scholar] [CrossRef]
  7. Potts, P.J.; Webb, P.C. X-ray fluorescence spectrometry. J. Geochem. Explor. 1992, 44, 251–296. [Google Scholar] [CrossRef]
  8. Henley, E.; Kassouny, M.; Nelson, J. Proton-induced X-ray emission analysis of single human hair roots. Science 1977, 197, 277–278. [Google Scholar] [CrossRef]
  9. Herman, M.H. Applications of Rutherford backscattering spectrometry to refractory metal silicide characterization. J. Vac. Sci. Technol. B Microelectron. Process. Phenom. 1984, 2, 748–755. [Google Scholar] [CrossRef]
  10. Amsel, G.; Lanford, W.A. Nuclear Reaction Techniques in Materials Analysis. Annu. Rev. Nucl. Part. Sci. 1984, 34, 435–460. [Google Scholar] [CrossRef]
  11. Im, H.J.; Song, K. Applications of Prompt Gamma ray Neutron Activation Analysis: Detection of Illicit Materials. Appl. Spectrosc. Rev. 2009, 44, 317–334. [Google Scholar] [CrossRef]
  12. Druyan, R.; Mitchell, T.G.; King, E.R.; Spencer, R.P. Neutron Activation Analysis. Radiology 1958, 71, 856–859. [Google Scholar] [CrossRef]
  13. Trunk, M.; Wetjen, M.; Werner, L.; Gernhäuser, R.; Märkisch, B.; Révay, Z.; Gasteiger, H.; Gilles, R. Materials science applications of Neutron Depth Profiling at the PGAA facility of Heinz Maier-Leibnitz Zentrum. Mater. Charact. 2018, 146, 127–134. [Google Scholar] [CrossRef]
  14. Reidy, J.J.; Hutson, R.L.; Daniel, H.; Springer, K. Use of muonic X-rays for nondestructive analysis of bulk samples for low Z constituents. Anal. Chem. 1978, 50, 40–44. [Google Scholar] [CrossRef]
  15. Papa, A. Search for the Lepton Flavour Violation in μ+e+γ. The Calibration Methods for the MEG Experiment. Ph.D. Thesis, Univeristy of Pisa, Edizioni ETS, Pisa, Italy, 2009. [Google Scholar]
  16. Ninomiya, K. Non-destructive, position-selective, and multi-elemental analysis method involving negative muons. J. Nucl. Radiochem. Sci. 2019, 19, 8–13. [Google Scholar] [CrossRef]
  17. Ninomiya, K.; Kajino, M.; Inagaki, M.; Terada, K.; Sato, A.; Tomono, D.; Kawashima, Y.; Shinohara, A. Per atom muon capture ratios and effects of molecular structure on muon capture by γ-Fe2O3 and Fe3O4. J. Radioanal. Nucl. Chem. 2020, 324, 403–408. [Google Scholar] [CrossRef]
  18. Clemenza, M.; Bonesini, M.; Carpinelli, M.; Cremonesi, O.; Fiorini, E.; Gorini, G.; Hillier, A.; Ishida, K.; Menegolli, A.; Mocchiutti, E.; et al. Muonic atom X-ray spectroscopy for non-destructive analysis of archeological samples. J. Radioanal. Nucl. Chem. 2019, 322, 1357–1363. [Google Scholar] [CrossRef]
  19. Köhler, E.; Bergmann, R.; Daniel, H.; Ehrhart, P.; Hartmann, F. Application of muonic X-ray techniques to the elemental analysis of archeological objects. Nucl. Instrum. Methods Phys. Res. 1981, 187, 563–568. [Google Scholar] [CrossRef]
  20. Hutson, R.L.; Reidy, J.J.; Springer, K.; Daniel, H.; Knowles, H.B. Tissue Chemical Analysis with Muonic X rays. Radiology 1976, 120, 193–198. [Google Scholar] [CrossRef]
  21. Taylor, M.C.; Coulson, L.; Phillips, G.C. Observation of Muonic X-rays from Bone. Radiat. Res. 1973, 54, 335–342. [Google Scholar] [CrossRef]
  22. Terada, K.; Ninomiya, K.; Osawa, T.; Tachibana, S.; Miyake, Y.; Kubo, M.K.; Kawamura, N.; Higemoto, W.; Tsuchiyama, A.; Ebihara, M.; et al. A new X-ray fluorescence spectroscopy for extraterrestrial materials using a muon beam. Sci. Rep. 2014, 4, 5072. [Google Scholar] [CrossRef] [Green Version]
  23. Ninomiya, K.; Kubo, M.K.; Strasser, P.; Nagatomo, T.; Kobayashi, Y.; Ishida, K.; Higemoto, W.; Kawamura, N.; Shimomura, K.; Miyake, Y.; et al. Elemental Analysis of Bronze Artifacts by Muonic X-ray Spectroscopy. JPS Conf. Proc. 2015, 8, 033005. [Google Scholar] [CrossRef] [Green Version]
  24. Terada, K.; Sato, A.; Ninomiya, K.; Kawashima, Y.; Shimomura, K.; Yoshida, G.; Kawai, Y.; Osawa, T.; Tachibana, S. Non-destructive elemental analysis of a carbonaceous chondrite with direct current Muon beam at MuSIC. Sci. Rep. 2017, 7, 15478. [Google Scholar] [CrossRef] [PubMed] [Green Version]
  25. Ninomiya, K.; Kitanaka, M.; Shinohara, A.; Tampo, M.; Miyake, Y.; Sakai, Y.; Kubo, M.K. Muonic X-ray measurements on mixtures of CaO/MgO and Fe3O4/MnO. J. Radioanal. Nucl. Chem. 2018, 316, 1107–1111. [Google Scholar] [CrossRef]
  26. Umegaki, I.; Higuchi, Y.; Nozaki, H.; Ninomiya, K.; Kubo, M.K.; Tampo, M.; Hamada, K.; Doiuchi, S.; Strasser, P.; Kawamura, N.; et al. Detection of Li in Li-ion Battery Electrode Materials by Muonic X-ray. JPS Conf. Proc. 2018, 21, 011041. [Google Scholar] [CrossRef] [Green Version]
  27. Ninomiya, K.; Kudo, T.; Strasser, P.; Terada, K.; Kawai, Y.; Tampo, M.; Miyake, Y.; Shinohara, A.; Kubo, K.M. Development of non-destructive isotopic analysis methods using muon beams and their application to the analysis of lead. J. Radioanal. Nucl. Chem. 2019, 320, 801–805. [Google Scholar] [CrossRef] [Green Version]
  28. Umegaki, I.; Higuchi, Y.; Kondo, Y.; Ninomiya, K.; Takeshita, S.; Tampo, M.; Nakano, H.; Oka, H.; Sugiyama, J.; Kubo, M.K.; et al. Nondestructive High-Sensitivity Detections of Metallic Lithium Deposited on a Battery Anode Using Muonic X-rays. Anal. Chem. 2020, 92, 8194–8200. [Google Scholar] [CrossRef]
  29. Hillier, A.; Paul, D.; Ishida, K. Probing beneath the surface without a scratch—Bulk non-destructive elemental analysis using negative muons. Microchem. J. 2016, 125, 203–207. [Google Scholar] [CrossRef]
  30. Brown, K.L.; Stockdale, C.P.J.; Luo, H.; Zhao, X.; Li, J.F.; Viehland, D.; Xu, G.; Gehring, P.M.; Ishida, K.; Hillier, A.D.; et al. Depth dependant element analysis of PbMg1/3Nb2/3O3 using muonic X-rays. J. Phys. Condens. Matter 2018, 30, 125703. [Google Scholar] [CrossRef] [Green Version]
  31. Clemenza, M.; Baldazzi, G.; Ballerini, G.; Bonesini, M.; Carpinelli, M.; Cremonesi, O.; Di Stefano, E.; Fiorini, E.; Gorini, G.; Hillier, A.; et al. CHNET-TANDEM experiment: Use of negative muons at RIKEN-RAL Port4 for elemental characterization of “Nuragic votive ship” samples. Nucl. Instruments Methods Phys. Res. Sect. A Accel. Spectrometers Detect. Assoc. Equip. 2019, 936, 27–28. [Google Scholar] [CrossRef] [Green Version]
  32. Hampshire, B.V.; Butcher, K.; Ishida, K.; Green, G.; Paul, D.M.; Hillier, A.D. Using Negative Muons as a Probe for Depth Profiling Silver Roman Coinage. Heritage 2019, 2, 28. [Google Scholar] [CrossRef] [Green Version]
  33. Aramini, M.; Milanese, C.; Hillier, A.D.; Girella, A.; Horstmann, C.; Klassen, T.; Ishida, K.; Dornheim, M.; Pistidda, C. Using the Emission of Muonic X-rays as a Spectroscopic Tool for the Investigation of the Local Chemistry of Elements. Nanomaterials 2020, 10, 1260. [Google Scholar] [CrossRef]
  34. Green, G.A.; Ishida, K.; Hampshire, B.V.; Butcher, K.; Pollard, A.; Hillier, A.D. Understanding Roman Gold Coinage Inside Out. J. Archaeol. Sci. 2021, 134, 105470. [Google Scholar] [CrossRef]
  35. Blundell, S.J.; De Renzi, R.; Lancaster, T.; Pratt, F.L. (Eds.) Muon Spectroscopy—An Introduction; Oxford University Press: Oxford, UK, 2021. [Google Scholar]
  36. Sugiyama, J.; Umegaki, I.; Nozaki, H.; Higemoto, W.; Hamada, K.; Takeshita, S.; Koda, A.; Shimomura, K.; Ninomiya, K.; Kubo, M.K. Nuclear Magnetic Field in Solids Detected with Negative-Muon Spin Rotation and Relaxation. Phys. Rev. Lett. 2018, 121, 087202. [Google Scholar] [CrossRef] [PubMed]
  37. Nagamine, K. Introductory Muon Science; Cambridge University Press: Cambridge, UK, 2003. [Google Scholar] [CrossRef]
  38. Measday, D. The nuclear physics of muon capture. Phys. Rep. 2001, 354, 243–409. [Google Scholar] [CrossRef]
  39. Anderson, H.L.; Hargrove, C.K.; Hincks, E.P.; McAndrew, J.D.; McKee, R.J.; Barton, R.D.; Kessler, D. Precise Measurement of the Muonic X rays in the Lead Isotopes. Phys. Rev. 1969, 187, 1565–1596. [Google Scholar] [CrossRef]
  40. Knecht, A.; Skawran, A.; Vogiatzi, S.M. Study of nuclear properties with muonic atoms. Eur. Phys. J. Plus 2020, 135, 777. [Google Scholar] [CrossRef]
  41. Krauth, J.J.; Schuhmann, K.; Ahmed, M.A.; Amaro, F.D.; Amaro, P.; Biraben, F.; Chen, T.L.; Covita, D.S.; Dax, A.J.; Diepold, M.; et al. Measuring the α-particle charge radius with muonic helium-4 ions. Nature 2021, 589, 527–531. [Google Scholar] [CrossRef]
  42. Groom, D.E.; Mokhov, N.V.; Striganov, S.I. Muon stopping power and range tables 10 MeV–100 TeV. At. Data Nucl. Data Tables 2001, 78, 183–356. [Google Scholar] [CrossRef] [Green Version]
  43. Moseley, H.G.J. XCIII. The high-frequency spectra of the elements. Lond. Edinb. Dublin Philos. Mag. J. Sci. 1913, 26, 1024–1034. [Google Scholar] [CrossRef] [Green Version]
  44. Borie, E.; Rinker, G.A. The energy levels of muonic atoms. Rev. Mod. Phys. 1982, 54, 67–118. [Google Scholar] [CrossRef]
  45. Suzuki, T.; Measday, D.F.; Roalsvig, J.P. Total nuclear capture rates for negative muons. Phys. Rev. C 1987, 35, 2212–2224. [Google Scholar] [CrossRef]
  46. Hillier, A.D.; Blundell, S.J.; McKenzie, I.; Umegaki, I.; Shu, L.; Wright, J.A.; Prokscha, T.; Bert, F.; Shimomura, K.; Berlie, A.; et al. Muon spin spectroscopy. Nat. Rev. Methods Prim. 2022, 2, 4. [Google Scholar] [CrossRef]
  47. Hartmann, F.J.; von Egidy, T.; Bergmann, R.; Kleber, M.; Pfeiffer, H.J.; Springer, K.; Daniel, H. Measurement of the Muonic X-ray Cascade in Metallic Iron. Phys. Rev. Lett. 1976, 37, 331–334. [Google Scholar] [CrossRef]
  48. Daniel, H.; Denk, W.; Hartmann, F.J.; Wilhelm, W.; von Egidy, T. Empirical Intensity Correlations in Muonic X-ray Spectra of Oxides. Phys. Rev. Lett. 1978, 41, 853–855. [Google Scholar] [CrossRef]
  49. Von Egidy, T.; Denk, W.; Bergmann, R.; Daniel, H.; Hartmann, F.J.; Reidy, J.J.; Wilhelm, W. Muonic Coulomb capture ratios and X-ray cascades in oxides. Phys. Rev. A 1981, 23, 427–440. [Google Scholar] [CrossRef]
  50. Grillenberger, J.; Baumgarten, C.; Seidel, M. The High Intensity Proton Accelerator Facility. SciPost Phys. Proc. 2021, 5, 002. [Google Scholar] [CrossRef]
  51. πE1 Beam Line. Available online: https://www.psi.ch/en/sbl/pie1-beamline (accessed on 30 November 2021).
  52. Skawran, A.A. Development of a New Method to Perform Muonic Atom Spectroscopy with Microgram Targets. Ph.D. Thesis, ETH Zürich, Zürich, Switzerland, 2021. [Google Scholar]
  53. Wauters, F.; Knecht, A.; on behalf of the muX collaboration. The muX project. SciPost Phys. Proc. 2021, 5, 022. [Google Scholar] [CrossRef]
  54. Warr, N.; Van de Walle, J.; Albers, M.; Ames, F.; Bastin, B.; Bauer, C.; Bildstein, V.; Blazhev, A.; Bönig, S.; Bree, N.; et al. The Miniball spectrometer. Eur. Phys. J. A 2013, 49, 40. [Google Scholar] [CrossRef] [Green Version]
  55. IN2P3/STFC French/UK Ge Pool. Available online: https://gepool.in2p3.fr (accessed on 30 November 2021).
  56. Morháč, M.; Kliman, J.; Matoušek, V.; Veselský, M.; Turzo, I. Background elimination methods for multidimensional coincidence γ-ray spectra. Nucl. Instruments Methods Phys. Res. Sect. A Accel. Spectrometers Detect. Assoc. Equip. 1997, 401, 113–132. [Google Scholar] [CrossRef]
  57. Sato, T.; Iwamoto, Y.; Hashimoto, S.; Ogawa, T.; Furuta, T.; Ichiro Abe, S.; Kai, T.; Tsai, P.E.; Matsuda, N.; Iwase, H.; et al. Features of Particle and Heavy Ion Transport code System (PHITS) version 3.02. J. Nucl. Sci. Technol. 2018, 55, 684–690. [Google Scholar] [CrossRef] [Green Version]
  58. Iwamoto, Y.; Sato, T.; Hashimoto, S.; Ogawa, T.; Furuta, T.; Ichiro Abe, S.; Kai, T.; Matsuda, N.; Hosoyamada, R.; Niita, K. Benchmark study of the recent version of the PHITS code. J. Nucl. Sci. Technol. 2017, 54, 617–635. [Google Scholar] [CrossRef] [Green Version]
  59. μ X-rays Catalogue. Available online: http://muxrays.jinr.ru/ (accessed on 30 November 2021).
  60. Measday, D.F.; Stocki, T.J. γ rays from muon capture in natural Ca, Fe, and Ni. Phys. Rev. C 2006, 73, 045501. [Google Scholar] [CrossRef]
  61. Evans, H. Gamma-rays following muon capture. Nucl. Phys. A 1973, 207, 379–400. [Google Scholar] [CrossRef]
  62. Zinatulina, D.; Briançon, C.; Brudanin, V.; Egorov, V.; Perevoshchikov, L.; Shirchenko, M.; Yutlandov, I.; Petitjean, C. Electronic catalogue of muonic X-rays. EPJ Web Conf. 2018, 177, 03006. [Google Scholar] [CrossRef] [Green Version]
  63. National Nuclear Data Center. Available online: https://www.nndc.bnl.gov/ (accessed on 30 November 2021).
  64. Sens, J.C. Capture of Negative Muons by Nuclei. Phys. Rev. 1959, 113, 679–687. [Google Scholar] [CrossRef]
  65. Blair, I.M.; Muirhead, H.; Woodhead, T. A Measurement of the Capture Rate of Negative Muons in Various Elements. Proc. Phys. Soc. 1962, 80, 945–946. [Google Scholar] [CrossRef]
  66. Eckhause, M.; Siegel, R.; Welsh, R.; Filippas, T. Muon capture rates in complex nuclei. Nucl. Phys. 1966, 81, 575–584. [Google Scholar] [CrossRef]
  67. Amato, A. MIXE 2018 Fe/Ti/Cu Sandwich Sample Raw Data. Available online: https://doi.org/10.16907/24ee1f7e-f047-4973-95bf-656943d63774 (accessed on 30 November 2021).
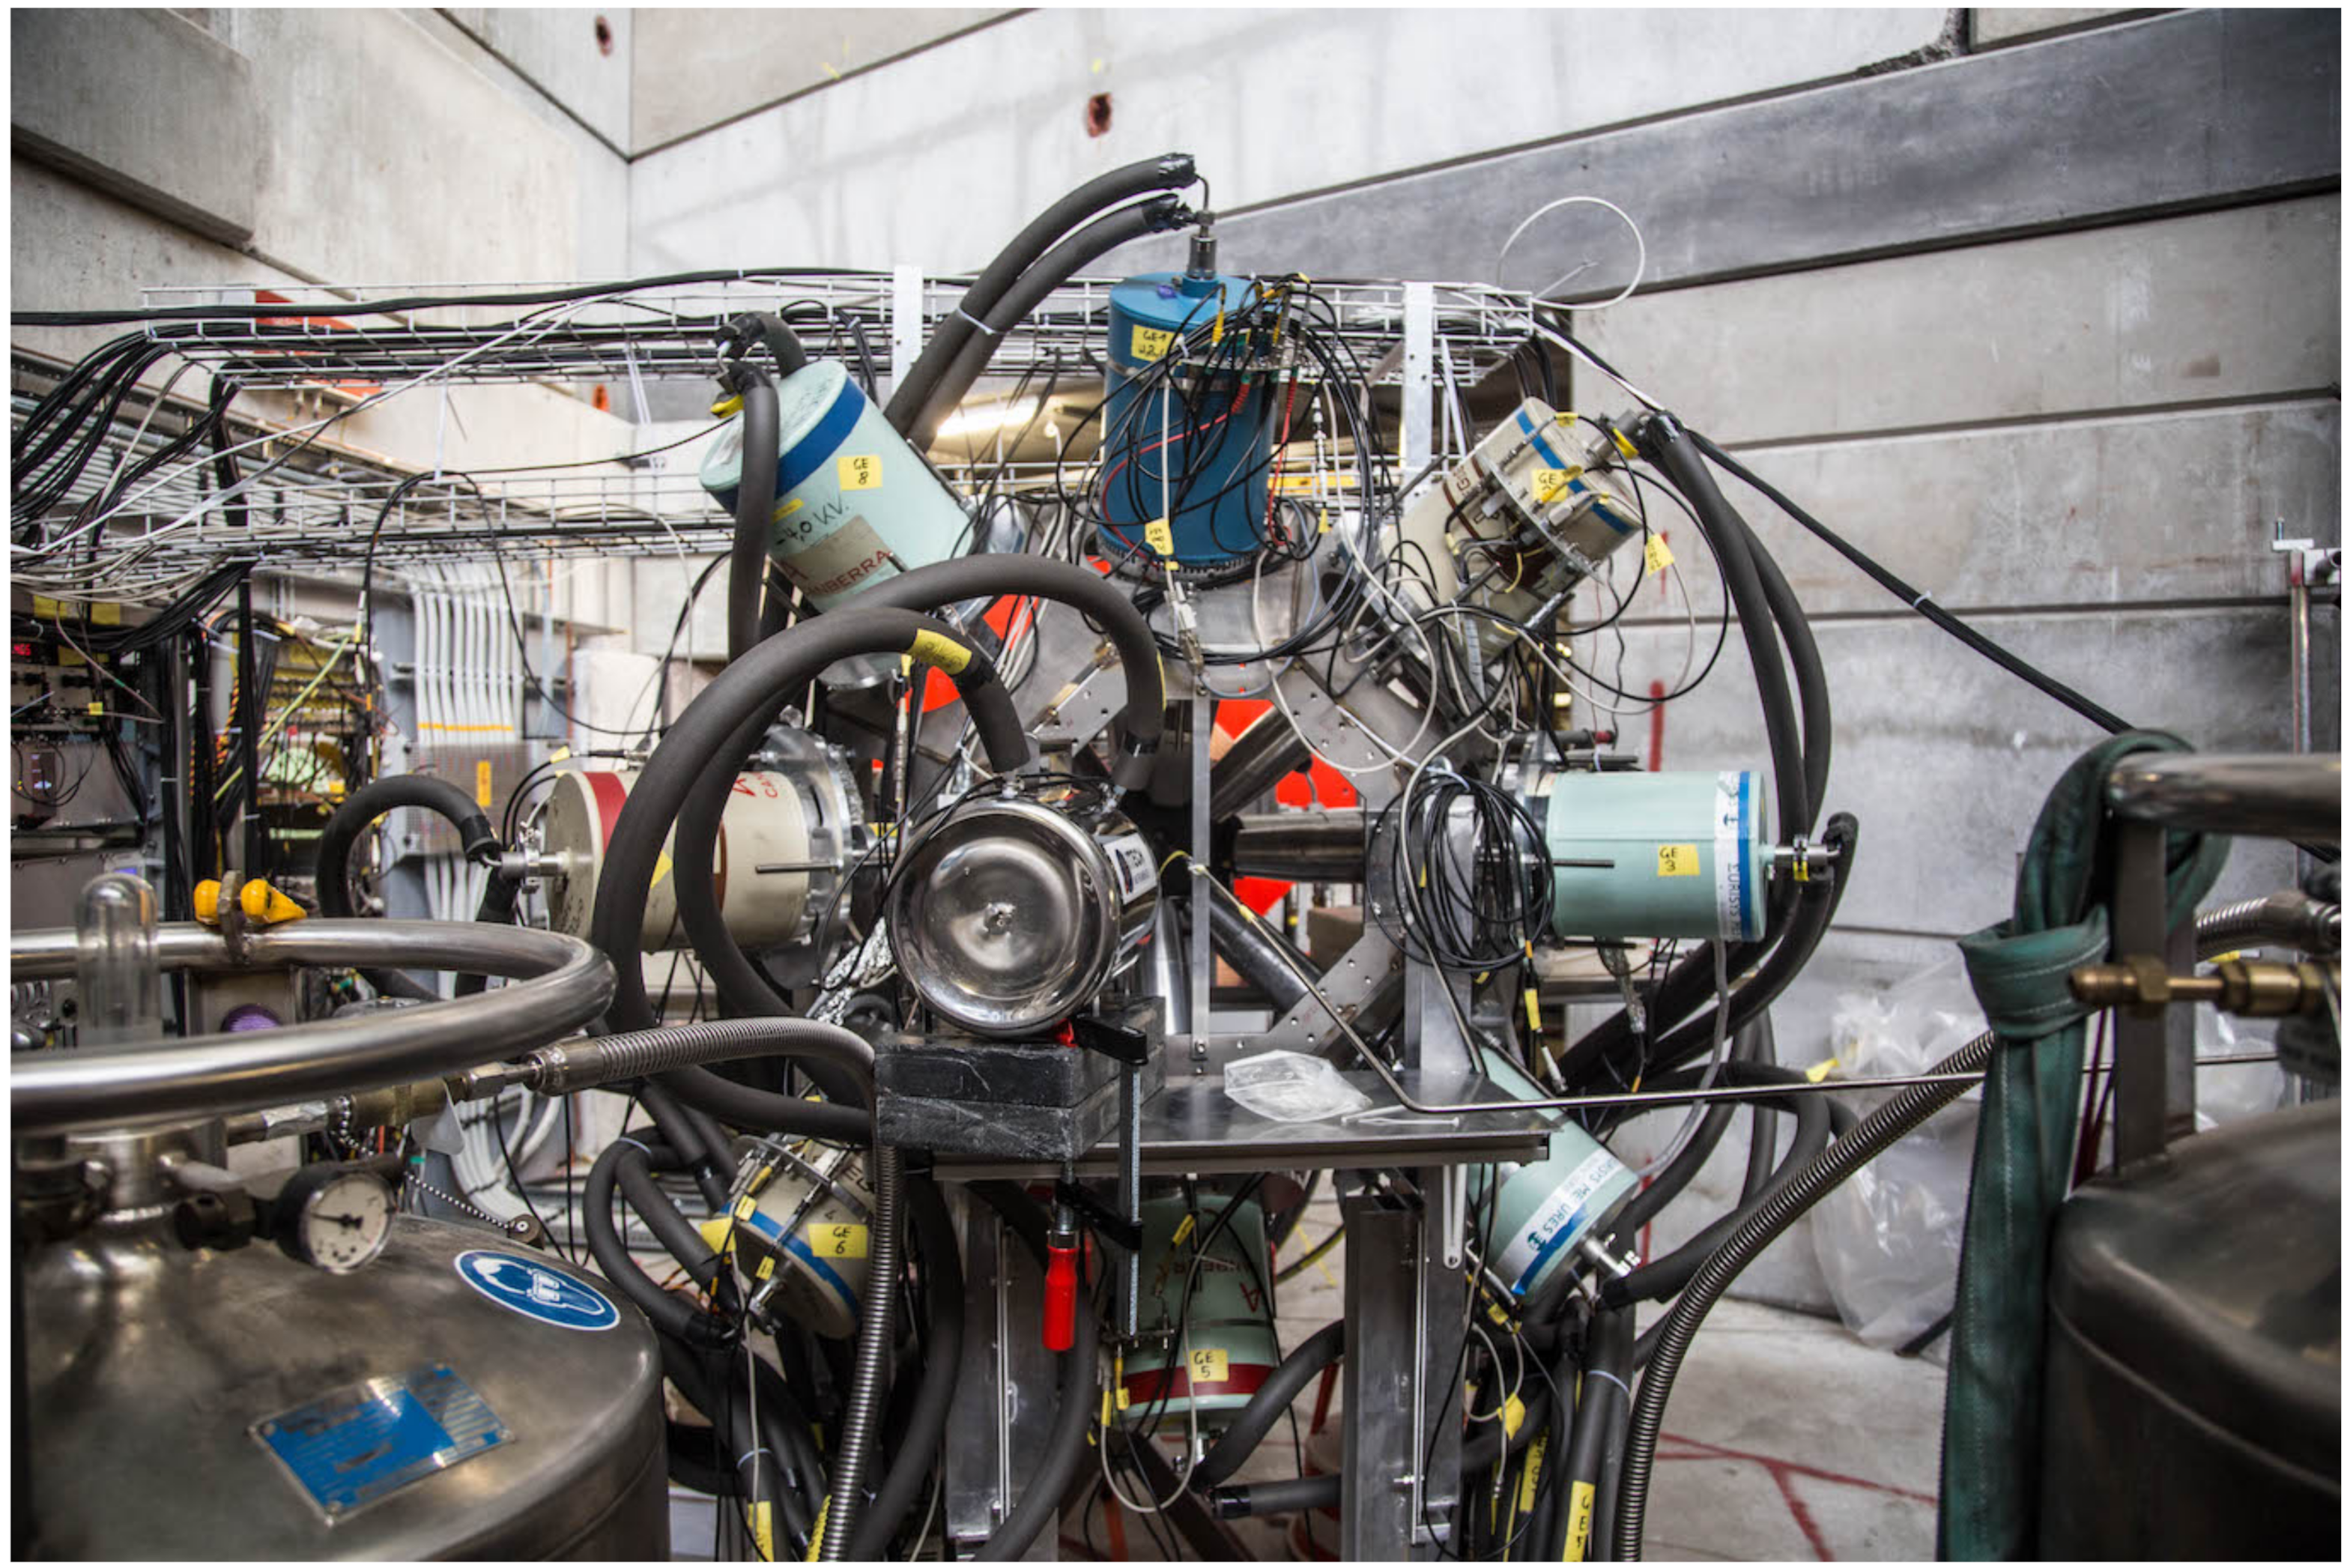
Figure 1. A photograph of the experimental setup showing the assembly of the detectors.
Applsci 12 02541 g001
Figure 2. The counts (N) of the muonic X-ray spectrum in the energy range 900 to 2150 keV, from all the twelve coaxial Ge detectors, for the six different muon momenta (p) (a) 28.6 MeV/c, (b) 35.0 MeV/c, (c) 37.5 MeV/c, (d) 40.0 MeV/c, (e) 42.5 MeV/c, and (f) 45.0 MeV/c. The data accumulation time for each momentum was ∼30 min. The μ -X rays of Fe, Ti and Cu are labelled in blue, green, and red colors, respectively. The energies of the μ -X rays were taken from [59,60]. The inset in panel (a) shows the zoomed portion of the spectrum (from 1240 to 1270 keV), to emphasize the fine structure of the muonic K α lines in Fe. A statistical error of the data points ( N ) is not shown for visibility of the smaller peaks.
Applsci 12 02541 g002
Figure 3. (top panel) Percentage of muons stopping in each layer of the sandwich sample obtained from simulations (shown by solid lines) and experiment (points) for the three different layers Fe (blue line and blue filled circles), Ti (green line green filled squares) and Cu (red line and red filled diamonds). The inset shows a sketch of the orientation of the sandwich sample with respect to the negative muon beam and the thickness of the individual layers. Two black dashed lines are drawn at the intersection of the simulated curves. (bottom panel) The residuals (experimental-simulated) in percentage for the different data points.
Applsci 12 02541 g003
Figure 4. The prompt counts (N) of the muonic X-ray spectrum ((i) −50 < t diff < 50 ns) and delayed counts (N) of the gamma-ray spectrum from the nuclear capture of muons ((ii) 100 < t diff < 200 ns) in the Fe layer of the three-layered sandwich sample at p = 28.6 MeV/c within the energy ranges of (a) 0 < E < 200 keV, (b) 200 < E < 500 keV, (c) 500 < E < 1000 keV, (d) 1000 < E < 2000 keV, and (e) 2000 < E < 3100 keV. The μ -X ray energies are written in red, while the gamma-ray energies are in blue. A statistical error of the data points ( N ) is not shown for visibility of the smaller peaks.
Applsci 12 02541 g004
Figure 5. Time evolution (in 100 ns wide windows) of the intensity of 1528.3 keV gamma-ray originating from the de-excitation after muon capture in the Fe nucleus, shown by red filled circles. The formula I ( t ) = I [ exp ( t / τ ) ] is fit to the data, represented by the black solid line (see also Equation (3)).
Applsci 12 02541 g005
Publisher’s Note: MDPI stays neutral with regard to jurisdictional claims in published maps and institutional affiliations.