Abstract
To alleviate the problem of performance degradation due to the varied sound durations of competing classes in sound event detection, we propose a method that utilizes multi-scale features for sound event detection. We employed a feature-pyramid component in a deep neural network architecture based on the Transformer encoder that is used to efficiently model the time correlation of sound signals because of its superiority over conventional recurrent neural networks, as demonstrated in recent studies. We used layers of convolutional neural networks to produce two-dimensional acoustic features that are input into the Transformer encoders. The outputs of the Transformer encoders at different levels of the network are combined to obtain the multi-scale features to feed the fully connected feed-forward neural network, which acts as the final classification layer. The proposed method is motivated by the idea that multi-scale features make the network more robust against the dynamic duration of the sound signals depending on their classes. We also applied the proposed method to a mean-teacher model, based on the Transformer encoder, to demonstrate its effectiveness on a large set of unlabeled data. We conducted experiments using the DCASE 2019 Task 4 dataset to evaluate the performance of the proposed method. The experimental results show that the proposed architecture outperforms the baseline network without multi-scale features.
1. Introduction
Sounds in daily life usually contain important information about the surrounding conditions. Many research efforts have been made to extract information automatically from sound signals in machine learning paradigms. With a growing interest in this area, the detection and classification of acoustic scenes and events (DCASE) challenges have been held from 2013 to 2020 with several competitive tasks. Sound event detection (SED), one of the main research topics in the competition, is defined as identifying sound signals as well as the onset and offset times of sound events [1]. The application of SED is varied and includes audio surveillance [2,3], urban sound analysis [4], information retrieval from multimedia content [5], healthcare monitoring [6], and bird call detection [7].
As deep neural networks (DNNs) have shown state-of-the-art performance in computer vision [8], speech recognition [9], and machine translation [10], current SED studies primarily focus on DNN-based approaches. It has been demonstrated that the feedforward neural networks (FNNs) outperformed the traditional Gaussian mixture model and support vector machines in SED [11,12,13]. Convolutional neural networks (CNNs) have exhibited superior performance to that of FNNs in various sound classification tasks, including SED [14,15,16]. By using two-dimensional filters, the parameters of which are shared along the time and frequency shift, CNNs can efficiently handle audio signal distortions in the time-frequency domain. However, CNNs are not suitable for modeling the time correlations of audio signals. Recurrent neural networks (RNNs), such as gated recurrent neural networks (GRUs) and long short-term memory, have been successfully used in speech recognition [9]. They can efficiently model the long-term time correlations in time series signals, and thus, they are expected to facilitate SED.
Among them, the convolutional recurrent neural network (CRNN), which combines convolutional neural networks (CNN) and recurrent neural networks (RNN), has exhibited a satisfactory classification performance in SED [11]. It is now considered as a representative DNN architecture for SED and has been widely used in many applications.
One of the most important problems in SED is how to model the short and long temporal correlations of sound signals. The large difference in sound durations between competing sound classes makes it crucial to efficiently model the time correlation in sound signals. The short correlation is considered in milliseconds and represents the short-term spectral variations of the sound signal in general. To model the spectral variations, the window size and hop size in the calculation of the spectrum are usually set to tens of milliseconds. Compared with short correlation, long temporal correlation is usually more than hundreds of milliseconds and depends on the nature of the sound signals [17].
Compared with short correlation, which can be modeled from the perspective of signal analysis, long correlation is rather difficult to model. RNNs such as long short-term memory (LSTM) and gated recurrent unit (GRU)-based neural networks have been widely used to model long correlation information in sequential data, but their performance remains unsatisfactory due to the limited length of correlation that they can model. To overcome this problem, multi-scale features have been used as input into RNNs in some studies on sound signal classification [18,19,20]. In [18], two bi-directional RNNs were employed to model fine-scale and coarse-scale features. The outputs of the RNNs were then concatenated to feed the following fully connected neural network to classify sound events. The multi-scale (fine and coarse) features were advantageous in modeling long correlations of the sound signal compared with conventional single-scale RNNS.
Feature-pyramid networks have been used for object detection problems in computer vision [21]. They have performed well in recognizing objects in images of varying scales by offsetting the scale variation using multi-level feature pyramids. Instead of explicitly extracting multi-scale features, they combine low-resolution layer feature maps with high-resolution feature maps of CNNs to produce multi-scale features for the object detection problem. Motivated by the success of the feature-pyramid network, a CRNN architecture with a feature-pyramid component was proposed to improve the performance of SED in [22].
In a recent study [23], the Transformer showed state-of-the-art performance in language modeling, and it was thought to outperform a conventional RNN in sequential data modeling. Owing to this successful result, the Transformer is now widely used in speech and audio processing [24,25,26]. The self-attention mechanism of the Transformer enables the learning of the long-range temporal dependencies of the data very efficiently, with less computational complexity and a larger number of computations that can be parallelized than the RNN. In [25], the Transformer was applied to SED and achieved better performance than the baseline CRNN in the DCASE challenge 2019 task 4, showing that the self-attention mechanism is also very promising for SED.
As mentioned in the above, various approaches in deep learning have addressed the problem of modeling time correlation in sequential data. In particular, the problem is crucial in SED because the varied sound duration of competing classes is one of the major issues that degrade the performance of SED. This has been addressed in SED from two different viewpoints. One is to use multi-scale features in the DNN by either directly extracting multiple features of different scales from the spectral analysis of the sound signal or combining the multi-level feature maps of the CNN layers in a feature-pyramid framework. Another approach is to use an efficient DNN architecture to better model the time correlation. Representatively, the Transformer is very promising for improving the performance of SED compared to the conventional RNN. Since there has been little research that combines the two approaches, herein, we developed a DNN architecture that can take advantage of multi-scale features in the Transformer to further improve the performance of SED.
Owing to their availability, unlabeled data are important for improving SED performance. A mean-teacher model has been developed and popularly used in recent studies [27,28] as an efficient method for exploiting unlabeled data to reduce overfitting in the semi-supervised learning of deep learning models. In [28], a mean-teacher model based on CRNN was proposed for SED to allow a large amount of unlabeled data for training. It showed the best performance in the DCASE challenge 2018. Since unlabeled data are available for training, herein, we developed a mean-teacher model based on the Transformer encoder to demonstrate the effectiveness of the multi-scale features.
Herein, we propose a method for applying multi-level features of the CNN in a DNN based on the Transformer encoder for SED. By using the Transformer model instead of the conventional CRNN, we expect that we can leverage the superior performance of the Transformer encoder over RNNs in modeling local and global context information. The multi-scale features will contribute to further improving the capability of the Transformer encoder in processing the time correlation information. To the best of our knowledge, this is the first time that multi-scale features have been used in the Transformer encoder-based DNN for SED.
The remainder of this paper is organized as follows: In Section 2, we introduce the Transformer encoder used in this study. In Section 3, the architecture of the proposed neural network is explained. In Section 4, we introduce the databases and present the experimental results. Finally, Section 5 concludes the paper.
2. Transformer Encoder
The architecture of the Transformer encoder is illustrated in Figure 1. It consists of a stack of encoder blocks, wherein each block has two sublayers: a multi-head attention layer and a position-wise feed-forward layer. A residual connection was constructed around each of the sublayers. In each sublayer, dropout and layer normalization were added for regularization.
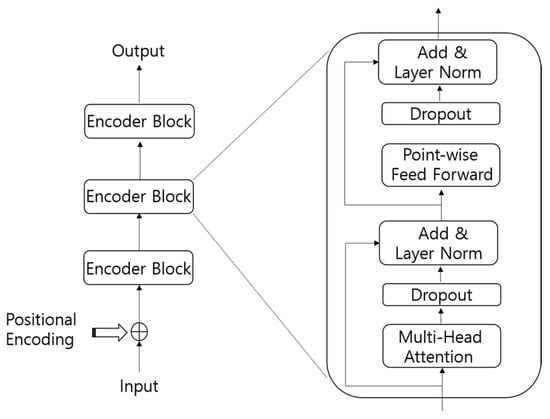
Figure 1.
Structure of the Transformer encoder.
2.1. Positional Encoding
Since the Transformer encoder does not contain recurrence, the order information in the input data sequence should be added to the model. For this purpose, some information corresponding to the position of the data, called positional encoding, is artificially generated and added to the input data. The positional encoding is given by:
where pos is the position in an input sequence, is the dimension of a sequence, and is the number of attention units.
2.2. Multi-Head Attention
The attention mechanism used in the Transformer encoder is referred to as “Scaled Dot-Product Attention” and is defined as follows:
where the attention output is computed as the weighted sum of the values, V. The weights assigned to the values are computed by the dot products of the queries, Q with the corresponding keys, K. dk is the dimension of the key. When Q = K = V, as is in the Transformer encoder used in this study, the attention is called “self-attention”.
Instead of the single attention output, as in (2), multi-head attention (MHA) that performs multiple attention is used in the Transformer encoder. MHA projects the queries, keys, and values with different linear transformations and then performs the attention function for each of them. The h different attention outputs are then concatenated and projected again to obtain the final output. The MHA is defined as follows:
where the learnable projections are ,,, and . In addition, we have .
2.3. Position-Wise Feed-Forward Networks
In addition to the MHA layer, a fully connected feed-forward network is applied to each position separately and identically. This is composed of two linear layers and is defined as follows:
where X(t) is the t-th frame of the input sequence X, and , .
3. Proposed Network Architecture
3.1. Proposed Transformer Network Model
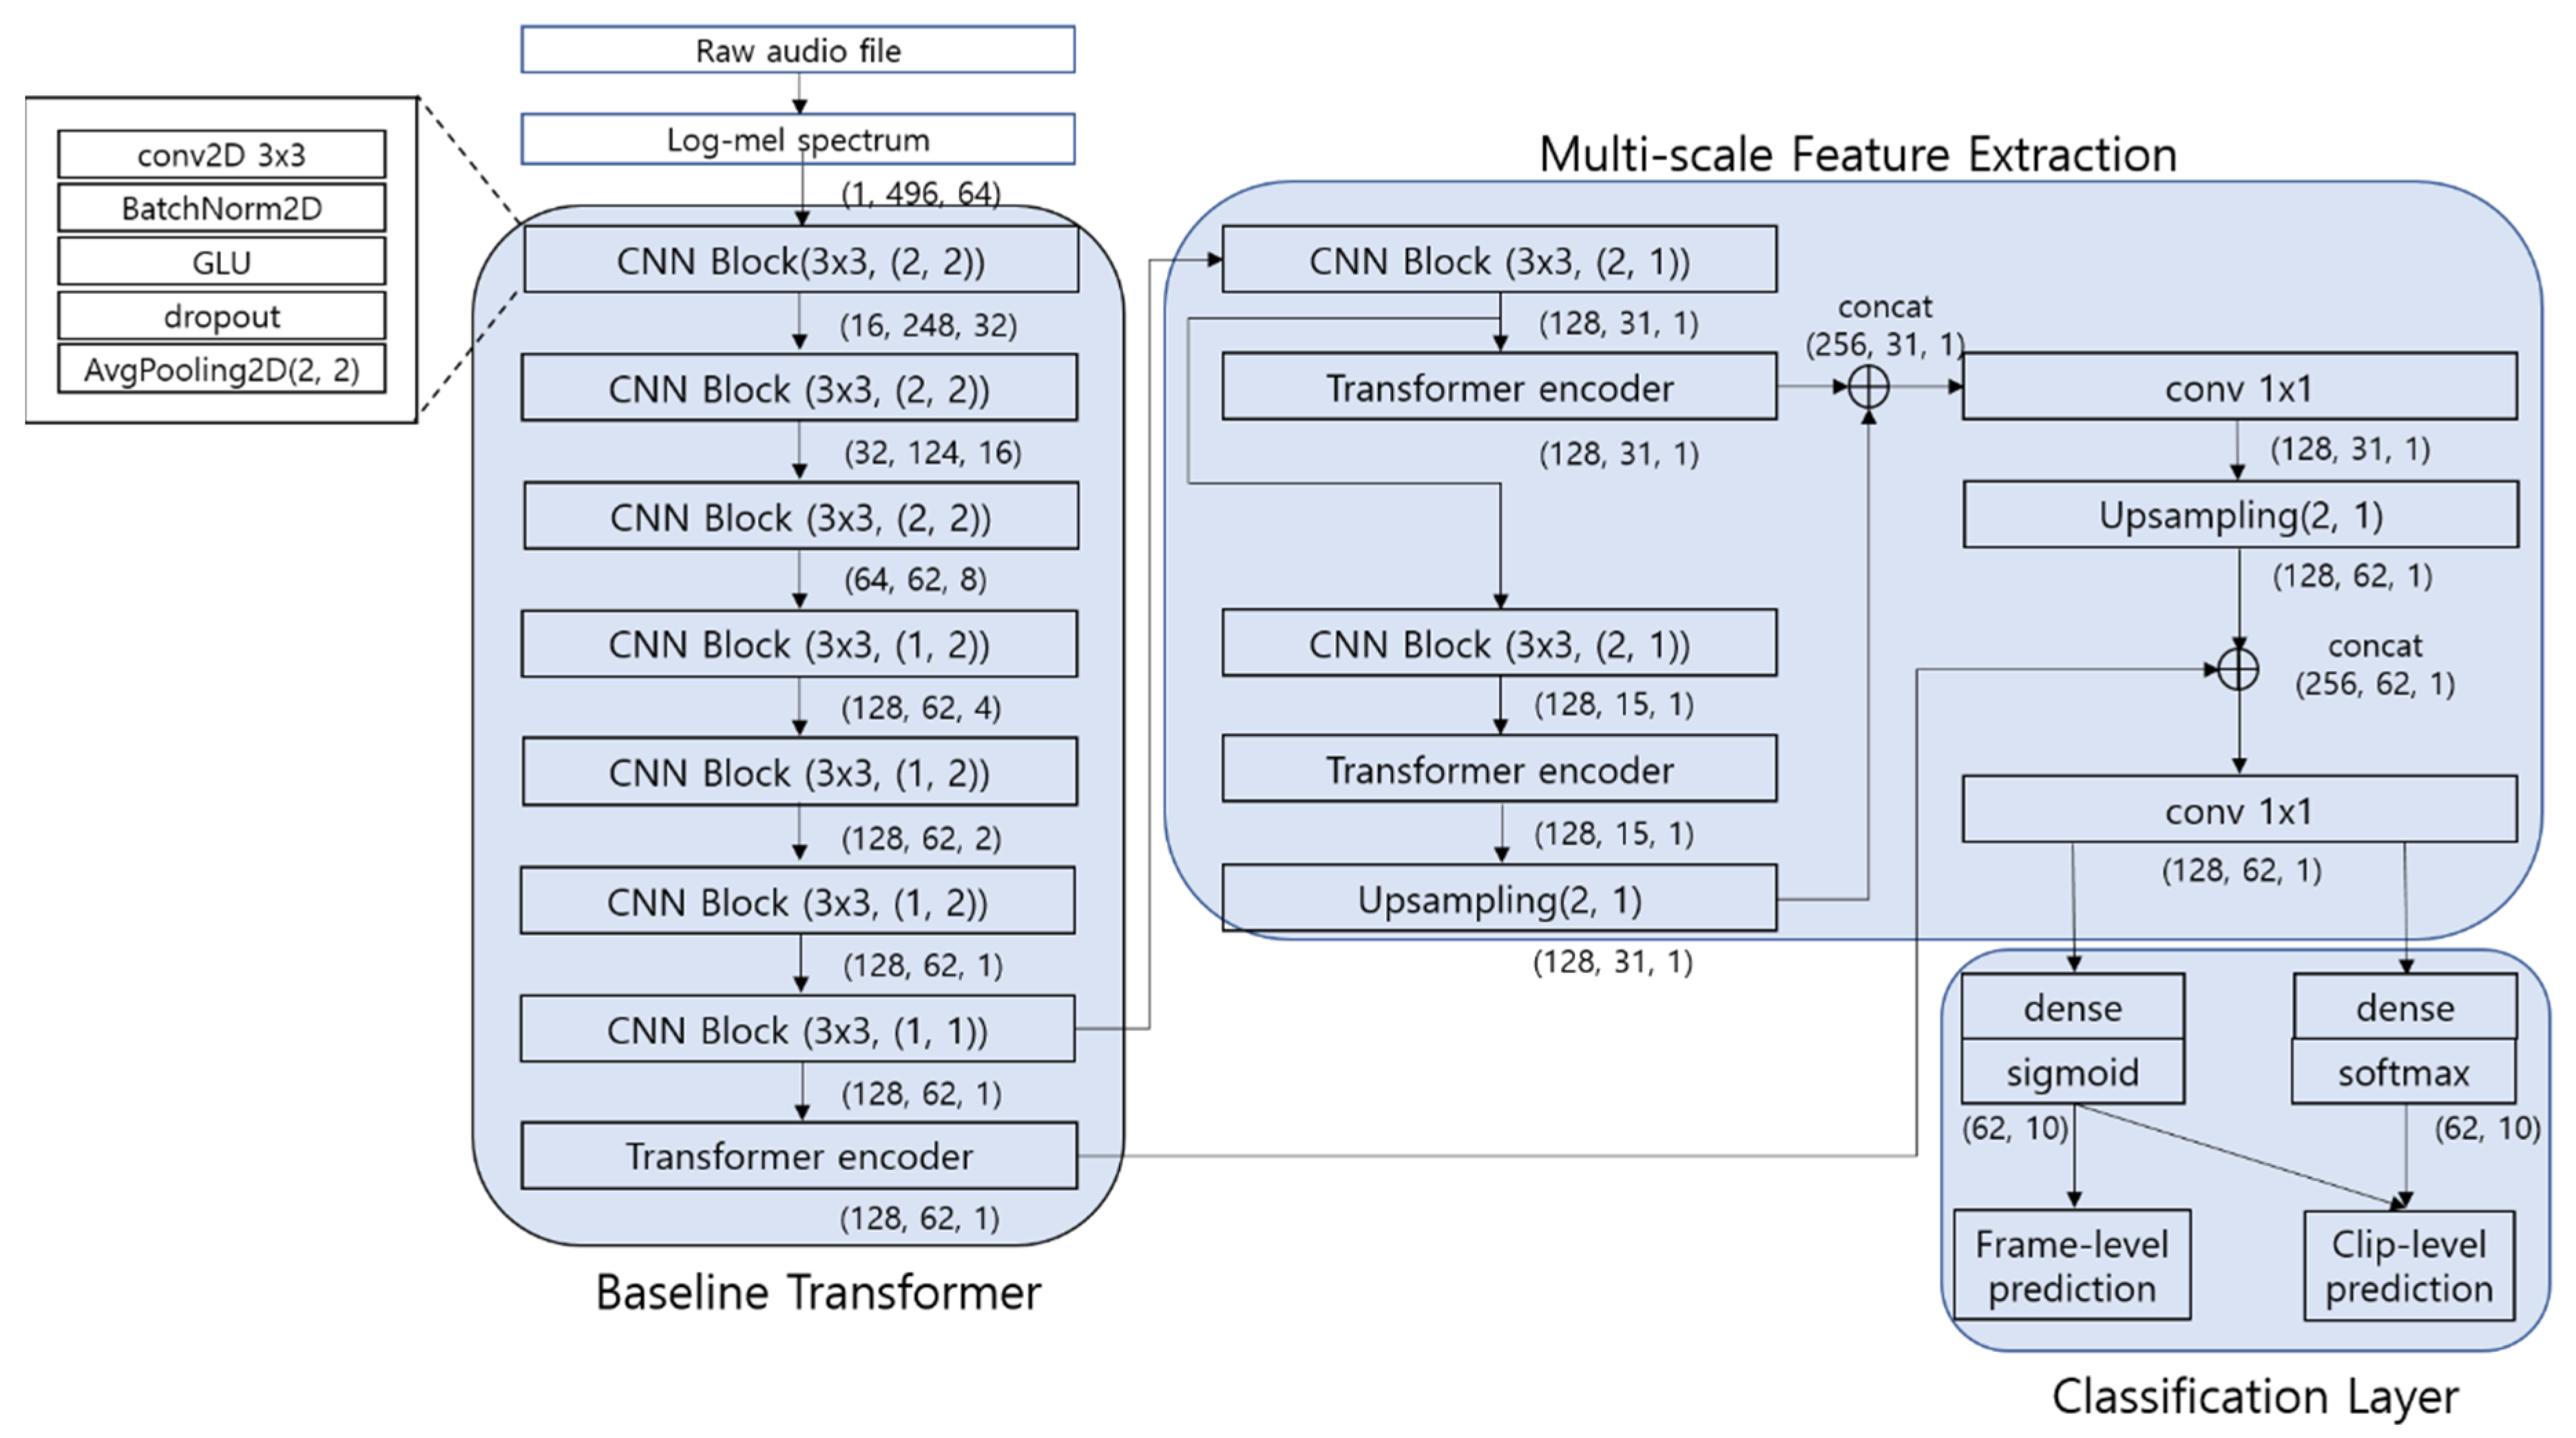
The architecture of the proposed Transformer model is shown in Figure 2. The architecture was motivated from the feature-pyramid network based on CRNN [22]. It consists of three parts: the baseline Transformer, a multi-scale feature extraction part, and a classification layer. The baseline Transformer consists of seven convolution blocks (ConvBlocks) and one Transformer encoder, which is depicted in Figure 1. The parameters of the CNN block and Transformer encoder in the baseline Transformer were mainly determined by referencing the work in [25]. The input features of the baseline Transformer are 64-dimensional log-Mel spectrograms extracted with a window size of 1024 sample points and a hop length of 323 points. The length of the input frames is 496 frames, corresponding to 10 s of each audio clip with a sampling rate of 16 kHz. The spectrogram is constructed as a two-dimensional (496 × 64) feature map.
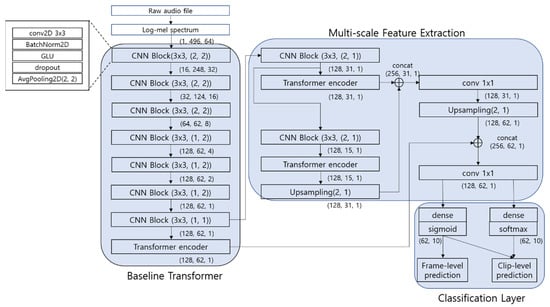
Figure 2.
Proposed Transformer Network Model.
In the ConvBlocks, a 3 × 3 convolutional filter was applied to the context window of the input feature map, and batch normalization is used to normalize the filter output to zero mean and unit variance. A gated linear unit (GLU) activation function was applied after batch normalization. Non-overlapping {2 × 2, 1 × 2, 1 × 2} average pooling was selectively applied in the frequency and time-domain to reduce the dimension of the input data to 128 × 62 × 1 (number of feature maps × number of time frames × number of frequency bands) in the last ConvBlock before the Transformer encoder. We reduced the dimension in the frequency domain to 1, but much of the time-domain information was preserved to use the time-correlation information of the sound signal in the Transformer encoder. Dropout is used before average pooling to reduce overfitting during training. The output of the last ConvBlock is used as input into the Transformer encoder, which has 128 attention units (dmodel = 128) and 16 heads (h = 16) in MHA. The internal position-wise feed-forward network of the Transformer encoder has 512 units (dff = 512).
The classification layer has 10 output units corresponding to the sound classes. These units have a sigmoid activation function, the output of which denotes the posterior probability of the classes for each frame of the sound signal. In addition to the sigmoid activation output used to predict frame-level labels in the classification layer, an attention layer with the softmax activation function is used to predict the clip-level label by the weighted average for the 10 s clip. The weighted average score Oc for class C was computed by multiplying the softmax activation function output and the sigmoid output as follows:
where T is the total number of time frames in the 10 s audio clip. The clip-level output Oc is used to calculate the loss function at the clip level when using the weakly labeled data for training in the proposed Transformer model.
In the multi-scale feature extraction part, two more Transformer encoders were employed, each coupled with a ConvBlock. The output of the last Transformer encoder is up-sampled and concatenated with that of the second last Transformer encoder. Then, a 1 × 1 convolution is applied to the concatenated feature map to smooth the data and reduce their dimensions. Once again, the resulting data are up-sampled and combined with the output of the Transformer encoder in the baseline Transformer, and a 1 × 1 convolution is applied to feed the multi-scale feature to the classification layer.
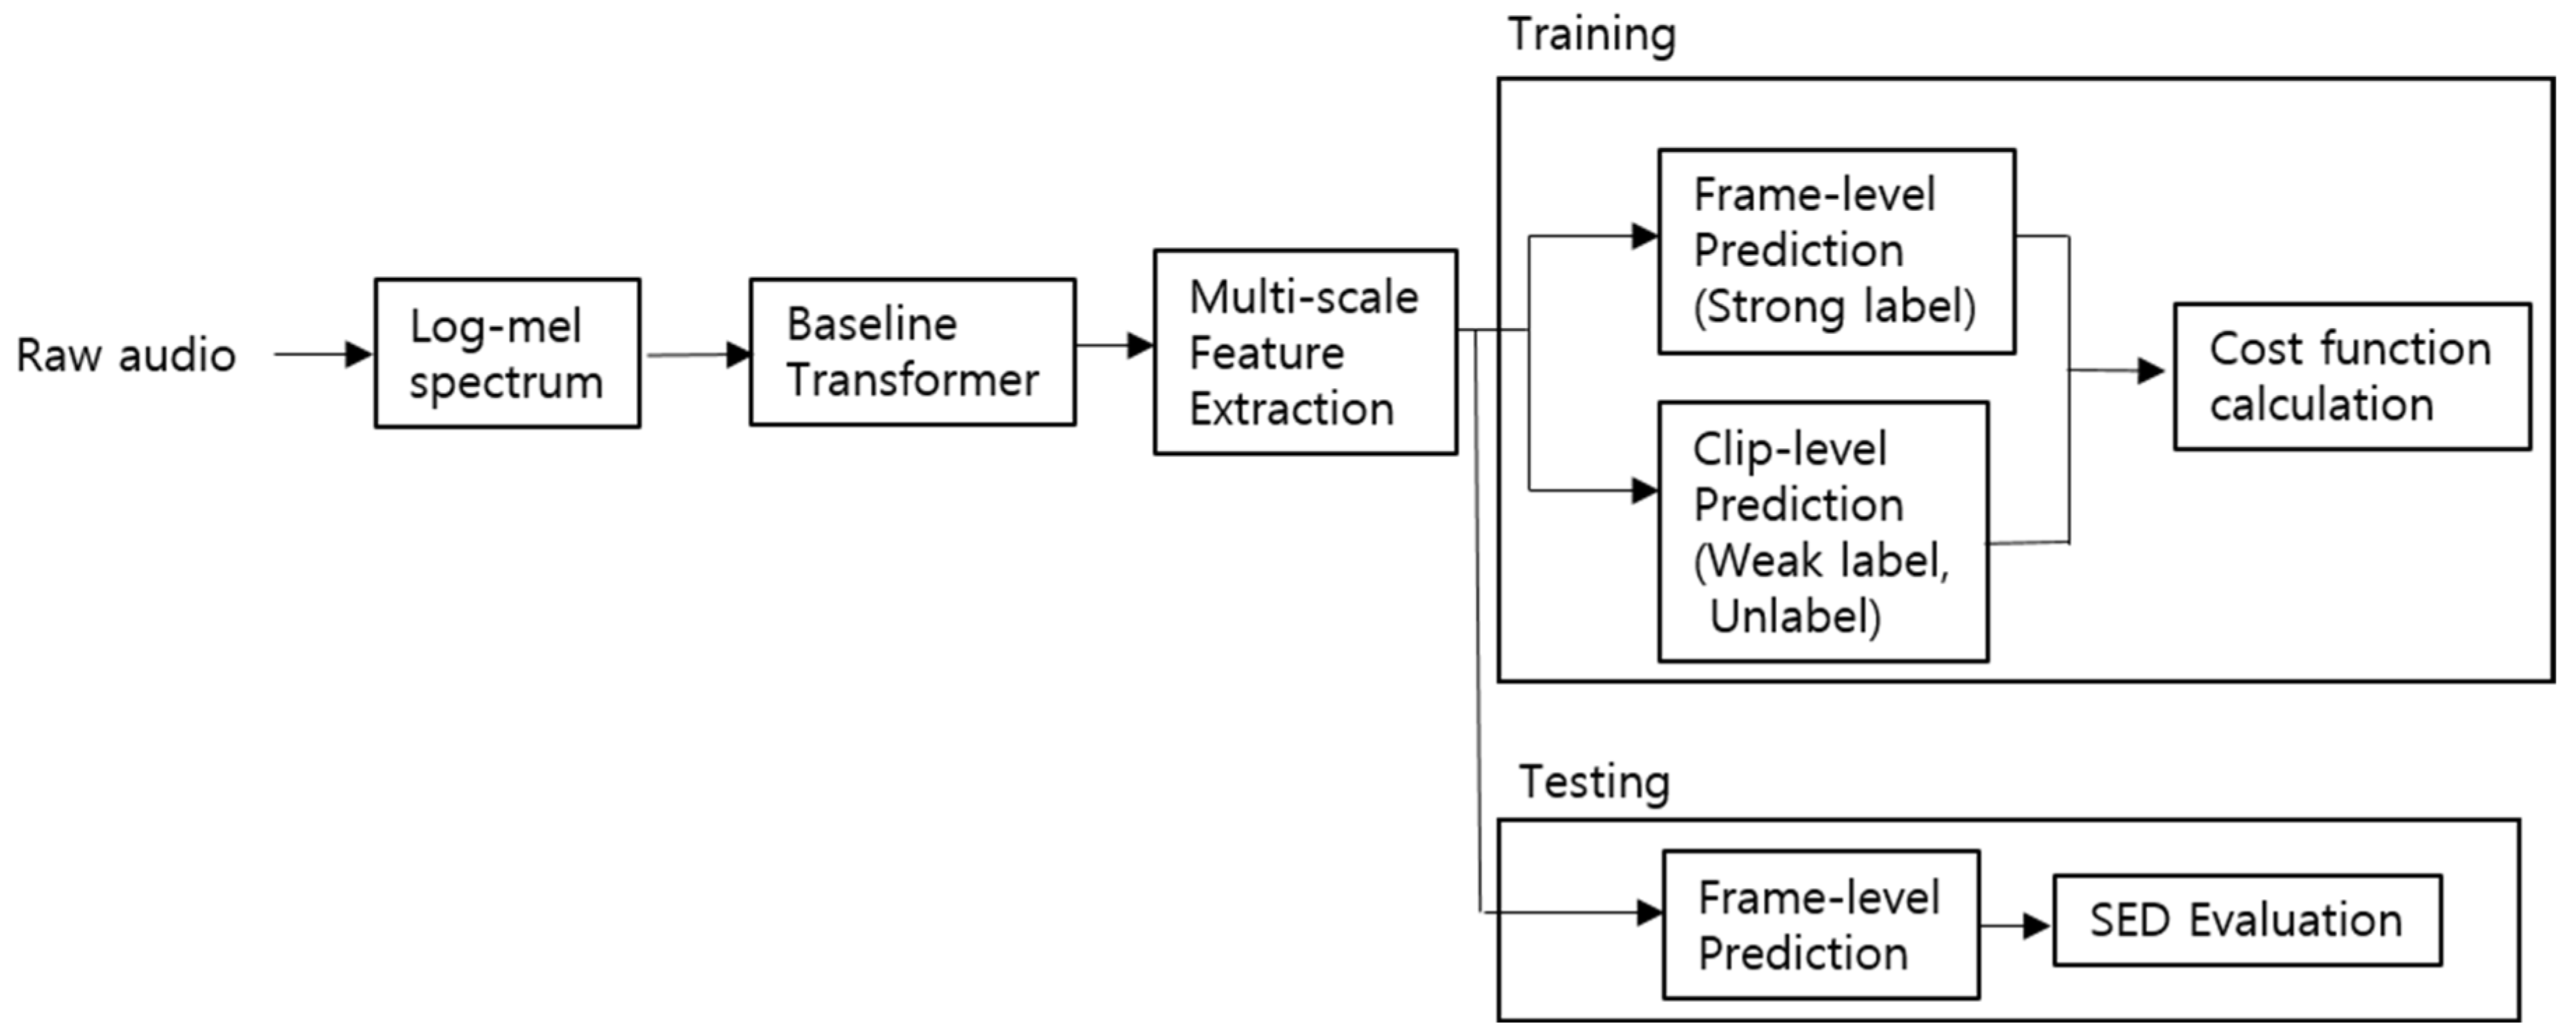
In Figure 3, we show the simplified procedure of the training and testing in our work using the proposed Transformer Network model.

Figure 3.
Procedure of the Training and Testing in the Proposed Transformer Network Model.
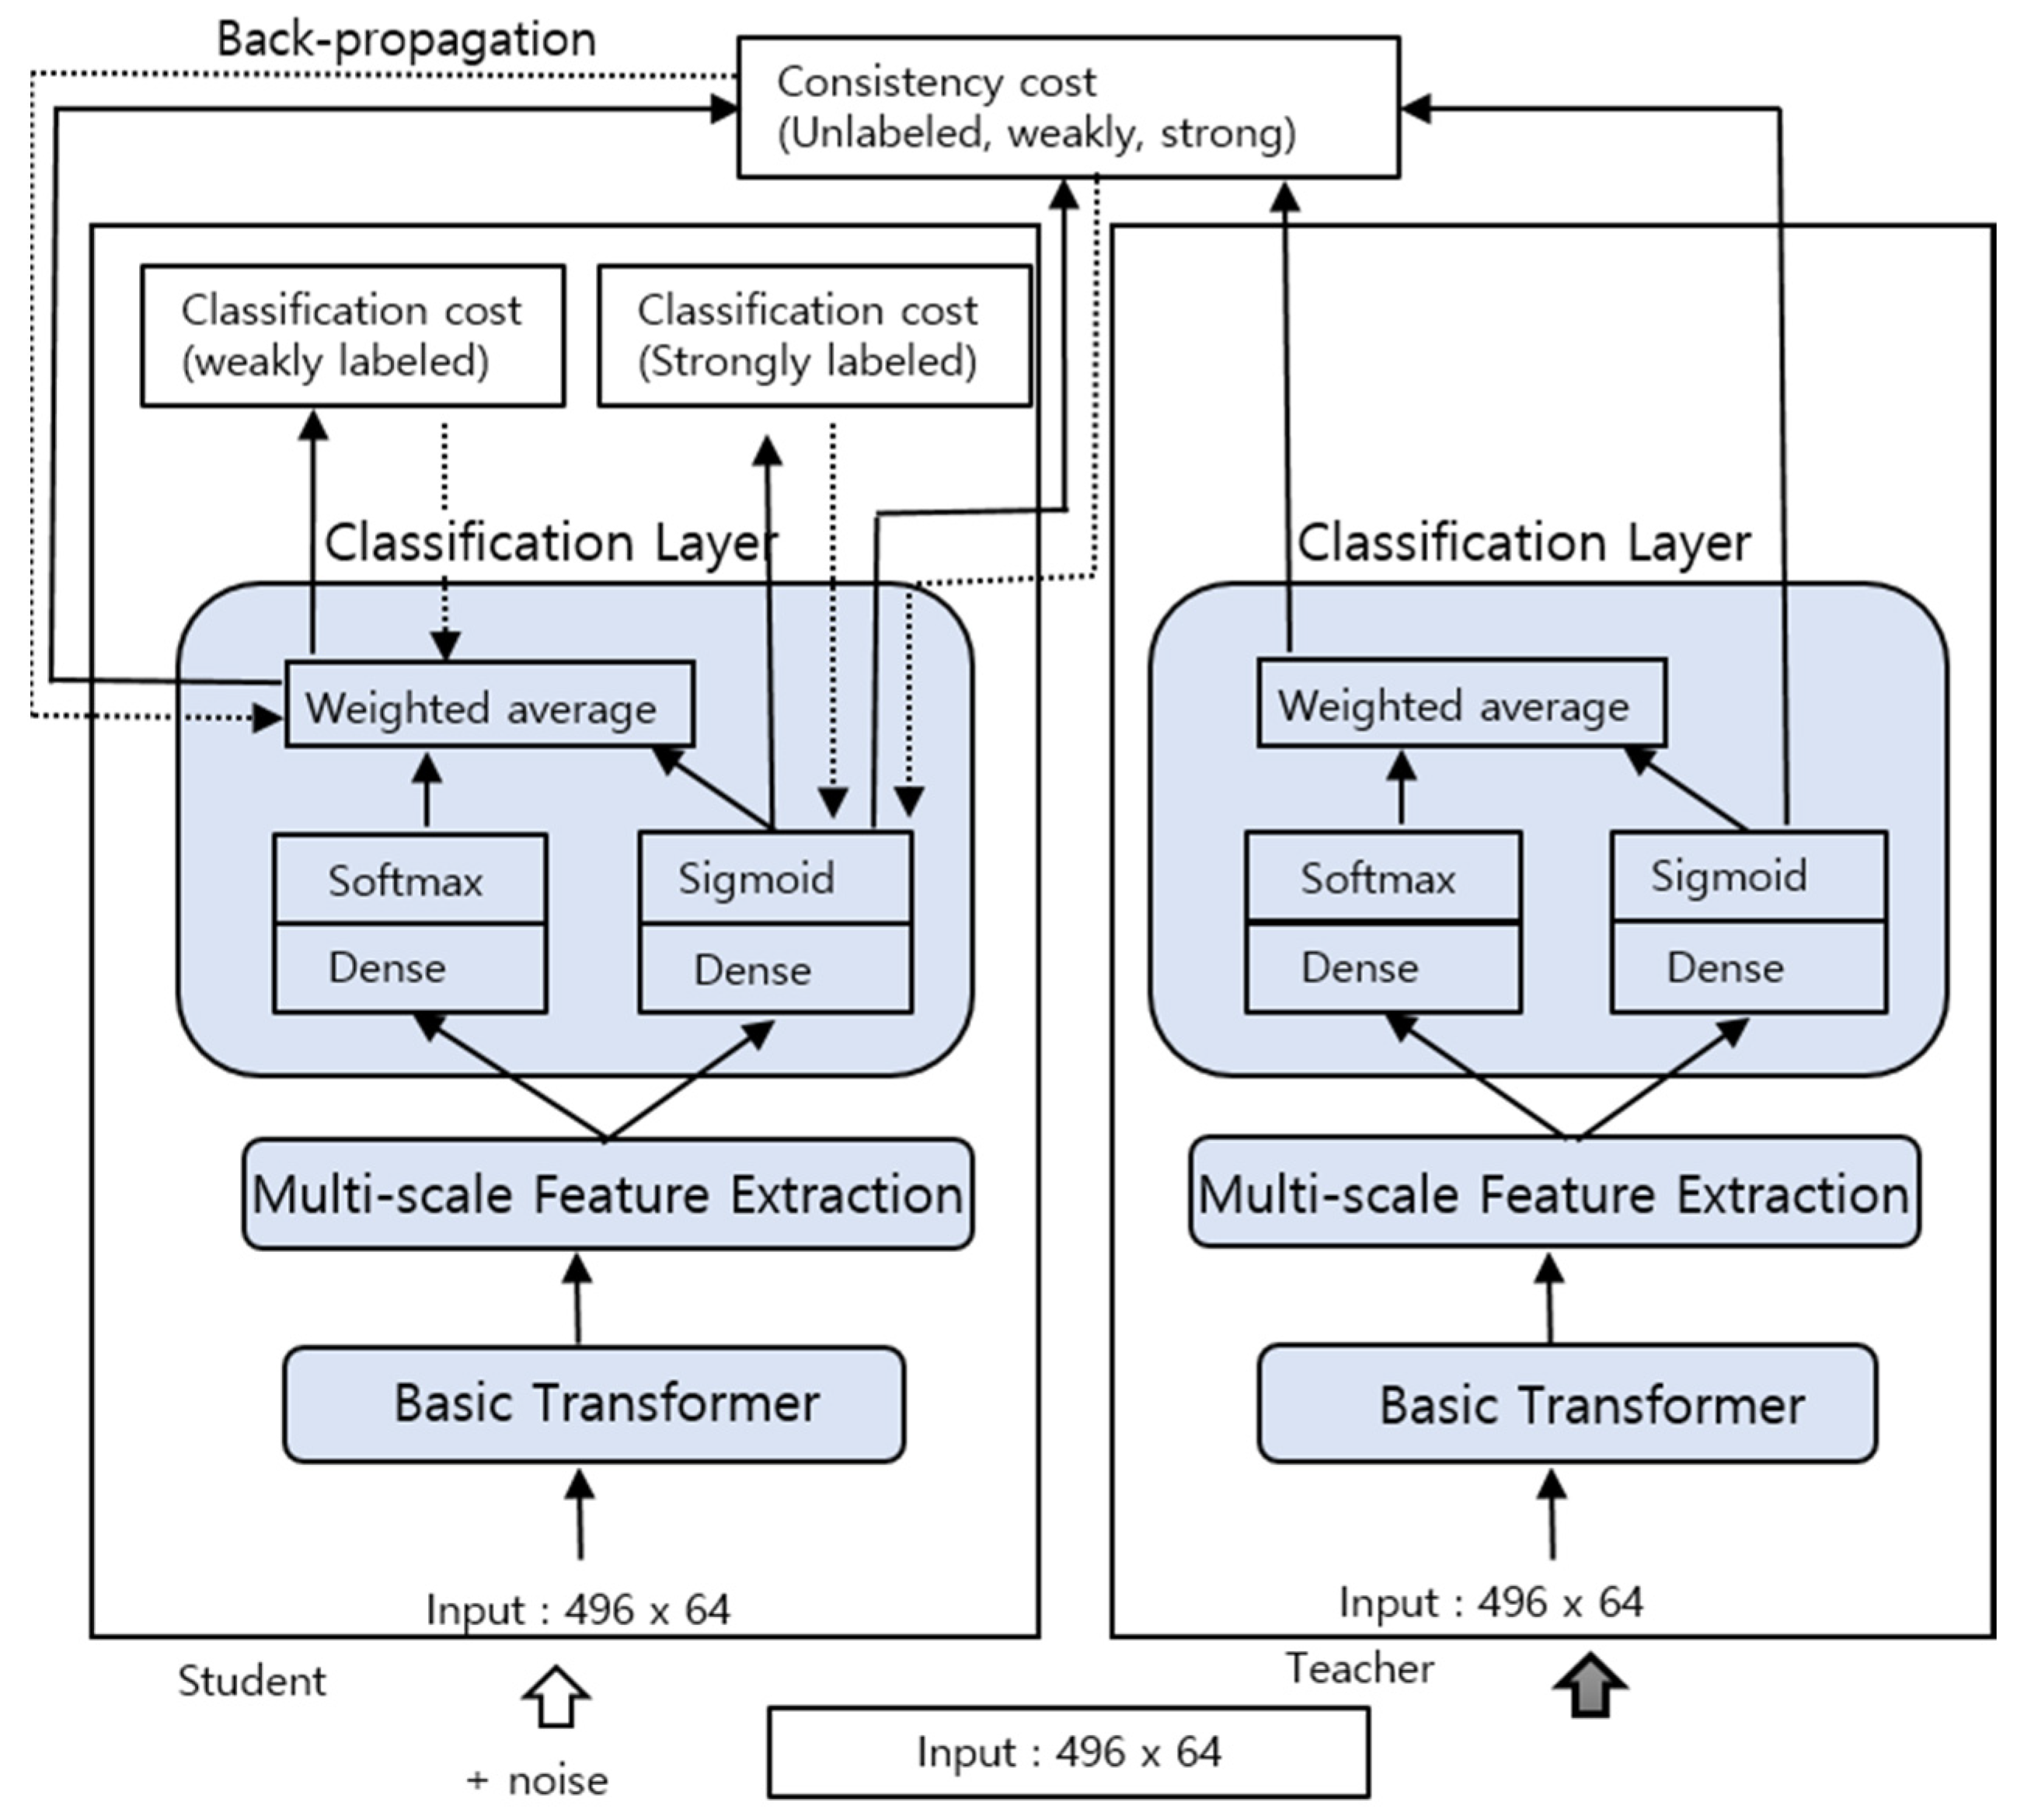
3.2. Mean-Teacher Model
The mean-teacher model employed in this study is similar to the one used in the baseline recognizer of the DCASE 2019 Challenge task 4 [1]. However, instead of using the CRNN, the proposed Transformer model was employed in the mean-teacher model. The architecture of the mean-teacher model is illustrated in Figure 4.
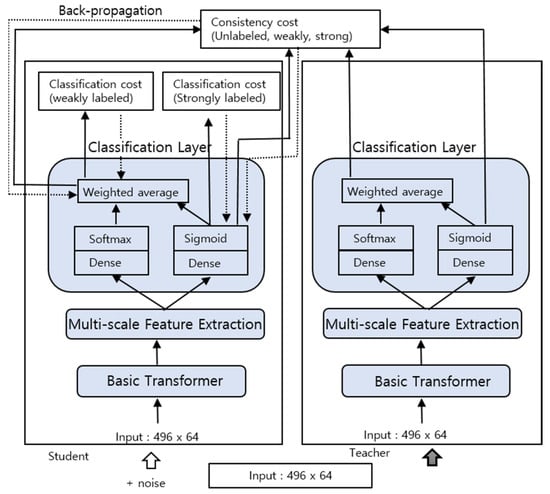
Figure 4.
Structure of the mean-teacher Transformer model.
It consists of two Transformer models, the student model on the left and the teacher model on the right. The student model was trained on strongly (synthetic) labeled, weakly labeled, and unlabeled data. The binary cross entropy (BCE) loss function is used as the classification cost, calculated at the frame-level for the strongly labeled data and at the clip-level for the weakly labeled data. The teacher model is not trained, and its weights are obtained as the moving average of the student model. The teacher model takes the same input as the student model during training, except that Gaussian noise is added to the input.
The clip-level and frame-level predictions of the teacher model are used to calculate the consistency loss (mean-squared error) by comparing it with the corresponding output of the student model. Unlabeled data, as well as strongly labeled and weakly labeled data, are used to calculate the consistency loss. The teacher model generally produces a more accurate output and is used for prediction during evaluation. There are two classification losses (weak and strong) and two consistency losses (weak and strong) that are combined to give the total loss. Since the classification cost needs to dominate at the start of the training, a ramp-up function is applied as the consistency weight w(t). The total loss L is expressed as follows:
where t denotes the current batch-iteration step, and W denotes the ramp-up length, which is set to 10,000 in this study.
4. Experimental Results
4.1. Experimental Condition
Herein, we used the DCASE 2019 Task 4 dataset [1]. The training set consists of 3 parts: 2045 synthesized audio clips with strong labels, 1578 real-recording audio clips with weak labels, and 14,412 real-recording audio clips without labels. The real-recording audio clips were taken from AudioSet [29] and were converted to a 1-channel, 16-bit, 16kHz sampling rate for consistency in the audio data format. Synthetic clips were generated using clean signals from the FSD dataset [30] and noises from the SINS dataset [31]. These training data are used to update the weights of the DNN during iterations. We also have validation data consisting of 1168 real recording clips. They are used in early stopping to avoid overfitting during the training. The length of each clip is 10 s, and there are 10 different sound classes, usually domestic or household. The details of the dataset are listed in Table 1. For the performance test of the proposed method, we presented the experimental results on the validation data as well as the evaluation data, which were from the official test dataset for the DCASE 2019 task 4 Challenge.

Table 1.
Dataset used in the experiment.
We used the Adam [32] optimizer with a learning rate of 0.001 and batch size of 128. The StepLR scheduler from PyTorch was employed to reduce the learning rate during the training iterations. The ratio of data volume in each batch is 1:1:2 for the weakly labeled, strongly labeled, and unlabeled data. The training was performed for 3100 and 30,000 mini-batch iteration steps for the basic Transformer model and the mean-teacher model, respectively. More details regarding the training conditions are presented in Table 2.
Table 2.
Network training configurations.
4.2. Evaluation Metrics
The proposed Transformer model computes the posterior probability for each class in every time frame and identifies a sound event when this probability exceeds 0.5. To improve reliability, median filtering is applied to the probabilities across the frames before the final decision.
The performance of the Transformer model is measured by the F-score and error rate (ER) using an event-based analysis [30], which compares the output of the model with the ground truth table when the output indicates that an event has occurred. The initial decision comprises three types: true positive (TP), false positive (FP), and false negative (FN). A TP indicates that the period of a detected sound event overlaps with that in the ground truth table. In the decision, a 200-ms onset collar and a 200-ms or 20% of the event length offset collar are allowed. An FP implies that there is no corresponding overlap period in the ground truth table, although the Transformer output indicates an event. An FN implies that there is an event period in the ground truth table, but the Transformer model does not produce the corresponding output.
The F-score (F) is computed based on the initial three decisions, and is the harmonic average of the precision (P) and recall (R). These are computed as follows:
The error rate is computed as:
where N is the total number of sound events active in the ground truth table. Sound events with correct temporal positions but incorrect class labels are counted as substitutions (S). Insertions (I) are sound events present in the system output but not in the reference, and deletions (D) are the sound events present in the reference but not in the output [33].
4.3. Experimental Results
To evaluate the proposed multi-scale Transformer model, we constructed two Transformer models: the basic Transformer model and the mean-teacher Transformer model, as shown in Figure 2 and Figure 3, respectively. The basic Transformer model in Figure 2 was trained with only weakly labeled and strongly labeled data. The mean-teacher model in Figure 3 was trained using the entire training data, including the unlabeled data.
First, we experimented with the basic Transformer model to investigate the effect of multi-scale features. In Table 3, we show the event-based SED results on the validation data with and without the multi-scale features (multi-scale Transformer vs. baseline Transformer). The results are shown with and without the application of post-processing. For post-processing, we applied median filtering to smooth the network output posterior that had been binarized with a constant threshold (0.5). The length of the median filter varied depending on the sound classes, which was found to improve the performance of the SED compared with a fixed-length filter [26]. To ensure the reliability of the test results, the F-scores and error rates (ERs) in the table were obtained by averaging the results after the experiments (training/testing) were performed 10 times in each condition. We varied the number of encoder blocks (NEB) in the Transformer model from 1 to 3 to investigate its effect on the performance.
Table 3.
Comparison of event-based SED results on validation data between baseline Transformer model and multi-scale Transformer model.
From the results in Table 3, we can see that the multi-scale Transformer generally outperforms the baseline Transformer irrespective of whether post-processing is applied, although the overall performance is much better when post-processing is applied. As the NEB varies, the performance of the baseline Transformer fluctuates significantly compared to the multi-scale Transformer, which shows stable F-scores across varying NEBs. This means that we can improve the robustness of the Transformer model using multi-scale features, which leads to performance improvement. The average F-score of the baseline Transformer over different NEBs without post-processing is 26.51% while the multi-scale Transformer achieves 27.79% leading to a 4.8% relative improvement in the F-score. Although the baseline Transformer attains a better F-score than the multi-scale Transformer when NEB = 2, the average F-score is worse because the performance is significantly degraded when NEB = 1 and 2. We observed similar results when using post-processing. We saw that the performance improvement is not sufficiently large in the ER.
Table 4 shows the event-based SED results on the evaluation data of the basic Transformer model with and without the multi-scale features (multi-scale Transformer vs. baseline Transformer). We observed similar trends as those in Table 3. The average F-score of the baseline Transformer without post-processing was 31.29%, while that of the multi-scale Transformer was 34.26%, leading to a 9.49% relative improvement, which was larger than that on the validation data. We saw that the effect of multi-scale features manifested more when post-processing was not applied. Compared with the results on the validation data in Table 3, we observed the manifested performance improvement in ER on the evaluation data in Table 4.
Table 4.
Comparison of event-based SED results on evaluation data between baseline Transformer model and multi-scale Transformer model.
We also applied multi-scale features to the mean-teacher Transformer model, as shown in Figure 3. In Table 5, we compare its performance with that of the baseline mean-teacher model, without multi-scale features, on the validation data. As expected, we see a performance improvement by using multi-scale features on the mean-teacher model. Compared with the basic Transformer model in Table 3, the improvement obtained by using multi-scale features was more significant in the mean-teacher Transformer model in Table 5. The average F-score without post-processing shows a 10.1% relative improvement in the multi-scale mean-teacher Transformer model, while we only saw a 4.8% improvement in Table 3. When post-processing was used, the relative improvement reduced to 6%. This is still better than that of the basic Transformer model in Table 3. We consistently obtained better results using the multi-scale features in the mean-teacher model when the NEB changes from one to three. These results confirm that the multi-scale features are more effective in the mean-teacher Transformer model than in the basic Transformer model. Since the mean-teacher-based neural network models are now preferred over basic models, the results seem to be more inspiring for the performance improvement in SED. Table 6 shows the test results of the mean-teacher Transformer model using multi-scale features on the evaluation data, and we observed an 11.6% relative improvement in the average F-score compared with the baseline Transformer model. As shown in Table 3 and Table 4, we observed better performance improvement on the evaluation data than the validation data. For the ER, we saw consistent improvements in validation data as well as evaluation data.
Table 5.
Comparison of event-based SED results on validation data between baseline mean-teacher model and the proposed mean-teacher model with multi-scale features.
Table 6.
Comparison of event-based SED results on evaluation data between baseline mean-teacher model and the proposed mean-teacher model with multi-scale features.
In Table 7, we compared the results of our work with those of the baseline system of DCASE 2019 based on CRNN [1] and those in [25] where they applied a Transformer model for SED. Since the two systems were developed using the dataset of DCASE 2019 as in our work, the comparison seems to be reasonable.
Table 7.
Comparison of event-based SED results in F-score on validation data of the proposed multi-scale Transformer models with the baseline system of DCASE 2019 [1] and the Transformer model in [25].
From Table 7, we can see that the proposed multi-scale Transformer shows better performance than the Transformer model in [25], as well as the baseline system of DCASE 2019, irrespective of using post processing (P.P) or not. Since the Transformer model used in our work has a similar network architecture as in [25], we can see that the performance improvement mainly comes from the use of the multi-scale features proposed in our work, although the results may be affected to some degree by the optimization methods used in each study.
5. Conclusions
In this study, we propose a method to incorporate multi-scale features in the Transformer model for SED by employing a feature-pyramid component in the DNN architecture. To confirm the effect of the multi-scale features on SED, we implemented two types of Transformer models: a basic Transformer and a mean-teacher Transformer model. The mean-teacher Transformer model can make use of unlabeled training data to further improve the performance of the basic Transformer model. Regarding the basic Transformer model, the use of multi-scale features led to a 9.5% relative improvement in the average F-score on the evaluation data. We found that the multi-scale features contributed to stabilizing the performance variation occurring in the baseline Transformer model as NEB varied from one to three. Regarding the mean-teacher Transformer model, we obtained an 11.6% relative improvement in the average F-score on the evaluation data by employing the multi-scale features, which is better than that observed in the basic Transformer model.
From the experiments, we found that the proposed multi-scale features contributed to improving the performance of the recent Transformer model for SED. The improvement manifested more in the mean-teacher-based model, which is now popularly used for SED owing to its advantage of using a large amount of unlabeled training data. Although the experiments were performed using only data from the DCASE 2019 challenge, the results appear to be sufficient enough to indicate the importance of multi-scale features in the Transformer model for SED.
For further studies, we will try some ablation experiments to determine the optimal hyper-parameters of the Transformer encoders in the multi-scale feature framework for better performance. In addition, the architecture of the multi-scale feature extraction part need be jointly optimized with the Transformer encoder.
Author Contributions
Conceptualization, Y.-J.C.; methodology, S.-J.K. and Y.-J.C.; software, S.-J.K.; validation, S.-J.K. and Y.-J.C.; formal analysis, Y.-J.C.; investigation, Y.-J.C.; data curation, S.-J.K.; writing—original draft preparation, Y.-J.C.; writing—review and editing, Y.-J.C.; visualization, S.-J.K.; supervision, Y.-J.C.; project administration, Y.-J.C.; funding acquisition, Y.-J.C. All authors have read and agreed to the published version of the manuscript.
Funding
This research was supported by the Bisa Research Grant of Keimyung University in 2021.
Data Availability Statement
Data underlying the results presented in this paper are not publicly available at this time but may be obtained from the authors upon reasonable request.
Conflicts of Interest
The authors declare no conflict of interest.
References
- Turpault, N.; Serizel, R.; Shah, A.; Salamon, J. Sound event detection in domestic environments with weakly labeled data and soundscape synthesis. In Proceedings of the Workshop on Detection and Classification of Acoustic Scenes and Events, New York, NY, USA, 25–26 October 2019; pp. 253–257. [Google Scholar]
- Nandwana, M.K.; Ziaei, A.; Hansen, J. Robust unsupervised detection of human screams in noisy acoustic environments. In Proceedings of the International Conference on Acoustics, Speech and Signal Processing, Brisbane, Australia, 19–24 April 2015; pp. 161–165. [Google Scholar]
- Crocco, M.; Cristani, M.; Trucco, A.; Murino, V.M. Audio surveillance: A systematic review. ACM Comput. Surv. 2016, 48, 1–46. [Google Scholar] [CrossRef]
- Salamon, J.; Bello, J.P. Feature learning with deep scattering for urban sound analysis. In Proceedings of the 2015 23rd European Signal Processing Conference (EUSIPCO), Nice, France, 31 August–4 September 2015; pp. 724–728. [Google Scholar]
- Ntalampiras, S.; Potamitis, I.; Fakotakise, N. On acoustic surveillance of hazardous situations. In Proceedings of the 2009 IEEE International Conference on Acoustics, Speech and Signal Processing, Taipei, Taiwan, 19–24 April 2009; pp. 165–168. [Google Scholar]
- Wang, Y.; Neves, L.; Metze, F. Audio-based multimedia event detection using deep recurrent neural networks. In Proceedings of the 2016 IEEE International Conference on Acoustics, Speech and Signal Processing (ICASSP), Shanghai, China, 20–25 March 2016; pp. 2742–2746. [Google Scholar]
- Dekkers, G.; Vuegen, L.; Waterschoot, T.; Vanrumste, B.; Karsmakers, P. DCASE 2018 Challenge—Task 5: Monitoring of domestic activities based on multi-channel acoustics. arXiv 2018, arXiv:1807.11246. [Google Scholar]
- Krizhevsky, A.; Sutskever, I.; Hinton, G.E. Imagenet classification with deep convolutional neural networks. Adv. Neural Inf. Process. Syst. 2012, 25, 1097–1105. [Google Scholar] [CrossRef]
- Graves, A.; Mohamed, A.; Hinton, G. Speech recognition with deep recurrent neural Networks. In Proceedings of the IEEE International Conference on Acoustics Speech and Signal Processing (ICASSP), Vancouver, BC, Canada, 26–31 May 2013; pp. 6645–6649. [Google Scholar]
- Cho, K.; Merrienboer, B.; Gulcehre, C.; Bahdanau, D.; Bougares, F.; Schwenk, H.; Bengio, Y. Learning phrase representations using RNN encoder-decoder for statistical machine translation. In Proceedings of the 2014 Conference on Empirical Methods in Natural Language Processing (EMNLP), Doha, Qatar, 25–29 October 2014; pp. 1724–1734. [Google Scholar]
- Cakir, E.; Parascandolo, G.; Heittola, T.; Huttunen, H.; Virtanen, T. Convolutional recurrent neural networks for polyphonic sound event detection. IEEE/ACM Trans. Audio Speech Lang. Process. 2017, 25, 1291–1303. [Google Scholar] [CrossRef] [Green Version]
- Cakir, E.; Heittola, T.; Huttunen, H.; Virtanen, T. Polyphonic sound event detection using multilabel deep neural networks. In Proceedings of the International Joint Conference on Neural Networks (IJCNN), Killarney, Ireland, 12–17 July 2015; pp. 1–7. [Google Scholar]
- McLoughlin, I.; Zhang, H.; Xie, Z.; Song, Y.; Xiao, W. Robust sound event classification using deep neural networks. IEEE/ACM Trans. Audio Speech Lang. Process. 2015, 23, 540–552. [Google Scholar] [CrossRef] [Green Version]
- Nordby, J.; Nemazi, F.; Rieber, D. Automatic detection of noise events at shooting range using machine Learning. In Proceedings of the 7th International Congress on Sound and Vibration (ICSV27), Prague, Czech Republic, 11–16 July 2021. [Google Scholar]
- Chen, Y.; Jin, H. Rare sound event detection using deep learning and data augmentation. In Proceedings of the International Conference on Spoken Language Processing (Interspeech), Graz, Austria, 15–19 September 2019; pp. 619–623. [Google Scholar]
- Dhakal, P.; Damacharla, P.; Javaid, A.; Devabhaktuni, V. Detection and identification of background sounds to improvise voice interface in critical environments. In Proceedings of the IEEE International Symposium on Signal Processing and Information Technology (ISSPIT), Louisville, KY, USA, 6–8 December 2018; pp. 78–83. [Google Scholar]
- Mesaros, A.; Heittola, T.; Virtanen, T. TUT database for acoustic scene classification and sound event detection. In Proceedings of the 24th European Signal Processing Conference (EUSIPCO), Budapest, Hungary, 29 August–2 September 2016; pp. 1128–1131. [Google Scholar]
- Lu, R.; Duan, Z.; Zhang, C. Multi-scale recurrent neural networks for sound event detection. In Proceedings of the IEEE International Conference on Acoustics Speech and Signal Processing (ICASSP), Calgary, AB, Canada, 15–20 May 2018; pp. 131–135. [Google Scholar]
- Lee, J.; Nam, J. Multi-level and multi-scale feature aggregation using pre-defined convolutional neural networks for music auto-tagging. IEEE Signal Process. Lett. 2017, 24, 1208–1212. [Google Scholar] [CrossRef] [Green Version]
- Li, X.; Xianyu, H.; Tian, J.; Chen, W.; Meng, F.; Xu, M.; Cai, L. A deep bidirectional long short-term memory based multi-scale approach for music dynamic emotion prediction. In Proceedings of the IEEE International Conference on Acoustics Speech and Signal Processing (ICASSP), Shanghai, China, 20–25 March 2016; pp. 544–548. [Google Scholar]
- Lin, T.-Y.; Dollar, P.; Girshick, R.; He, K.; Hariharan, B.; Belongie, S. Feature pyramid networks for object detection. In Proceedings of the IEEE Conference on Computer Vision and Pattern Recognition, Honolulu, HI, USA, 21–26 July 2017; pp. 2117–2125. [Google Scholar]
- Koh, C.-Y.; Chen, Y.-S.; Liu, Y.-W.; Bai, M.-R. Sound event detection by consistency training and pseudo-labeling with feature-pyramid convolutional recurrent neural networks. In Proceedings of the Workshop on Detection and Classification of Acoustic Scenes and Events DCASE 2020, Tokyo, Japan, 2–4 November 2020. [Google Scholar]
- Vaswani, A.; Shazeer, N.; Parmar, N.; Uszkoreit, J.; Jones, L.; Gomez, A.; Kaiser, L.; Polosukhin, I. Attention is all you need. In Proceedings of the 31st Conference on Neural Information Processing Systems, Long Beach, CA, USA, 4–9 December 2017; pp. 5998–6008. [Google Scholar]
- Gulati, A.; Qin, J.; Chiu, C.-C.; Parmar, N.; Zhang, Y.; Yu, J.; Han, W.; Wang, S.; Zhang, Z.; Wu, Y.; et al. Conformer: Convolution-augmented Transformer for speech recognition. In Proceedings of the International Conference on Spoken Language Processing (Interspeech 2020), Shanghai, China, 25–29 October 2020; pp. 5036–5040. [Google Scholar]
- Miyazaki, K.; Komatsu, T.; Hayashi, T.; Watanabe, S.; Toda, T.; Takeda, K. Weakly-supervised sound event detection with self-attention. In Proceedings of the IEEE International Conference on Acoustics Speech and Signal Processing (ICASSP), Barcelona, Spain, 4–8 May 2020; pp. 66–70. [Google Scholar]
- Miyazaki, K.; Komatsu, T.; Hayashi, T.; Watanabe, S.; Toda, T.; Takeda, K. Conformer-based sound event detection with semi-supervised learning and data augmentation. In Proceedings of the Workshop on Detection and Classification of Acoustic Scenes and Events DCASE 2020, Tokyo, Japan, 2–4 November 2020. [Google Scholar]
- Tarvainen, A.; Valpola, H. Mean teachers are better role models: Weight-averaged consistency targets improve semi-supervised deep learning results. Adv. Neural Inf. Process. Syst. 2017, 30, 1195–1204. [Google Scholar]
- JiaKai, L. Mean teacher convolution system for DCASE 2018 task 4. In Proceedings of the Workshop on Detection and Classification of Acoustic Scenes and Events DCASE 2018, Surrey, UK, 19–20 November 2018. [Google Scholar]
- Gemmeke, J.; Ellis, D.; Feedman, D.; Jasen, A.; Lawrence, W.; Moore, R.; Plakal, M.; Ritter, M. Audio set: An ontology and human-labeled dataset for audio events. In Proceedings of the 2017 IEEE International Conference on Acoustics, Speech and Signal Processing (ICASSP), New Orleans, LA, USA, 5–9 March 2017; pp. 776–780. [Google Scholar]
- Fonseca, E.; Pons, J.; Favory, X.; Font, F.; Bogdanov, D.; Ferraro, A.; Oramas, S.; Porter, A.; Serra, X. Freesound datasets: A platform for the creation of open audio datasets. In Proceedings of the 18th International Society for Music Information Retrieval Conference (ISMIR), Suzhou, China, 23–27 October 2017; pp. 486–493. [Google Scholar]
- Dekkers, G.; Lauwereins, S.; Thoen, B.; Adhana, M.; Brouckxon, H.; Bergh, B.; Waterschoot, T.; Vanrumste, B.; Verhelst, M.; Karsmakers, P. The SINS database for detection of daily activities in a home environment using an acoustic sensor network. In Proceedings of the Detection and Classification of Acoustic Scenes and Events 2017 Workshop (DCASE2017), München, Germany, 16–17 November 2017; pp. 32–36. [Google Scholar]
- Kingma, D.; Ba, J. Adam: A method for stochastic optimization. In Proceedings of the 3rd International Conference for Learning Representations, San Diego, CA, USA, 7–9 May 2015. [Google Scholar]
- Mesaros, A.; Heittola, T.; Virtanen, T. Metrics for polyphonic sound event detection. Appl. Sci. 2016, 6, 162. [Google Scholar] [CrossRef]
Publisher’s Note: MDPI stays neutral with regard to jurisdictional claims in published maps and institutional affiliations. |
© 2022 by the authors. Licensee MDPI, Basel, Switzerland. This article is an open access article distributed under the terms and conditions of the Creative Commons Attribution (CC BY) license (https://creativecommons.org/licenses/by/4.0/).