Article

Investigation of the Thiva 2020–2021 Earthquake Sequence Using Seismological Data and Space Techniques

by
George Kaviris
1,*,
Vasilis Kapetanidis
1,
Ioannis Spingos
1,
Nikolaos Sakellariou
1,
Andreas Karakonstantis
1,
Vasiliki Kouskouna
1,
Panagiotis Elias
2,
Andreas Karavias
3,
Vassilis Sakkas
1,
Theodoros Gatsios
1,3,
Ioannis Kassaras
1,
John D. Alexopoulos
1,
Panayotis Papadimitriou
1,
Nicholas Voulgaris
1 and
Issaak Parcharidis
3
1
Section of Geophysics-Geothermics, Department of Geology and Geoenvironment, National and Kapodistrian University of Athens, 15784 Athens, Greece
2
Institute of Astronomy, Astrophysics, Space Applications and Remote Sensing, National Observatory of Athens, 15236 Penteli, Greece
3
Department of Geography, Harokopio University of Athens, 17676 Kallithea, Greece
*
Author to whom correspondence should be addressed.
Appl. Sci. 2022, 12(5), 2630; https://doi.org/10.3390/app12052630
Submission received: 31 January 2022 / Revised: 26 February 2022 / Accepted: 28 February 2022 / Published: 3 March 2022
(This article belongs to the Special Issue Mapping, Monitoring and Assessing Disasters)

Abstract

:
We investigate an earthquake sequence involving an Mw = 4.6 mainshock on 2 December 2020, followed by a seismic swarm in July–October 2021 near Thiva, Central Greece, to identify the activated structures and understand its triggering mechanisms. For this purpose, we employ double-difference relocation to construct a high-resolution earthquake catalogue and examine in detail the distribution of hypocenters and the spatiotemporal evolution of the sequence. Furthermore, we apply instrumental and imaging geodesy to map the local deformation and identify long-term trends or anomalies that could have contributed to stress loading. The 2021 seismic swarm was hosted on a system of conjugate normal faults, including the eastward extension of the Yliki fault, with the main activated structures trending WNW–ESE and dipping south. No pre- or coseismic deformation could be associated with the 2021 swarm, while Coulomb stress transfer due to the Mw = 4.6 mainshock of December 2020 was found to be insufficient to trigger its nucleation. However, the evolution of the swarm is related to stress triggering by its major events and facilitated by pore-fluid pressure diffusion. The re-evaluated seismic history of the area reveals its potential to generate destructive Mw = 6.0 earthquakes; therefore, the continued monitoring of its microseismicity is considered important.

1. Introduction

Greece is located at the southeastern margin of Europe, a region with rich localized seismotectonic phenomena, a result of the convergence between the Eurasian and African tectonic plates. These processes are expressed through intense deformation and high seismicity along thrust, strike-slip, and normal faults [1,2]. Geodetic, geological, and seismological surveys have revealed that the N–S to NE–SW extensional tectonic regime of Central Greece in the Quaternary is a result of the back-arc extension between the Hellenic arc and the transtensional tectonic regime of the North Aegean [3,4,5].
Thiva (Central Greece) is located at the transition zone between two major WNW–ESE- and NW–SE-striking rifts: the Corinth Gulf in the south and the Euboekos Gulf in the east (Figure 1). The Gulf of Corinth is an area characterized by high seismicity [6,7] expressed through the frequent occurrence of seismic swarms [8,9,10,11,12].
The broad Thiva area is characterized by normal faulting (Figure 1). It is worth noting that recent strong and destructive earthquakes in Greece have occurred on normal faults, such as the Lesvos 2017 [5,17,18], Kos 2017 [5,19,20], Samos 2020 [21,22,23,24], Thessaly 2021 [25,26,27,28,29,30], and Arkalochori (Crete) 2021 [31,32] earthquakes. Fault segmentation is common near Thiva, with the presence of a multitude of smaller normal faults all around the area. One of these segments is the 6 km long Kallithea fault, striking between N 80° E and N 115° E, with a probable eastward extension [33]. North of Thiva, a denser fault network with smaller south-dipping ruptures dominates the area around Yliki Lake. Due to the small length of the mapped faults, the occurrence of an earthquake with a magnitude (M) of at least 6.0 seems unlikely [34,35].
On 2 December 2020, 10:54:56 UTC, an Mw = 4.6 earthquake occurred east of Thiva [36]. Moment tensor inversion yielded a normal focal mechanism with strike N106° E, dip 31°, and rake −81° [36]. The analysis of both geodetic and seismological data indicated an uncommonly shallow depth of approximately 2 km for the main event. The mainshock and its aftershock sequence, which lasted until 3 January 2021, were triggered by ruptures on or adjacent to the Kallithea fault [36]. A few kilometers to the west and 7 months later, a new earthquake sequence was initiated, characterized by high productivity, lasting for over 6 months. The whole activity led to the recording of over 2500 earthquakes.
In this study, we present a detailed analysis of the seismic crises in the Thiva area between late November 2020 and mid-October 2021 through high-resolution double-difference relocation. The spatiotemporal evolution of the various outbreaks composing the 2021 seismic swarm is presented, along with the activated structures at depth and their relation to surface traces of mapped faults. The triggering mechanisms of the 2021 Thiva seismic swarm are investigated, such as stress redistribution due to the 2 December 2020 mainshock or possible aseismic factors, including fluid-induced pore-pressure diffusion, through the migration of seismicity, as well as deformation transients. The deformation study resulted from the joint analysis of local GNSS data and satellite aperture radar interferometry (InSAR) products.

2. Past Earthquakes

The study area has had a mild-to-moderate seismic footprint since antiquity. There are ancient reports of various incidents in the broad area of Thiva that could be interpreted as geotectonic in nature [37]. Limited archaeological evidence suggests earthquake activity, which has had an impact on Thiva between 1350 and 1230 BCE without any substantial proof regarding the epicentral area [38]. Many centuries later, in 1321–1323 CE, the eyewitness Jordanus reports collapse and damage of many houses in Thiva [14,39]. In [40] it is noted that, in general, the areas of Boeotia, Locris, Fokis, and Fthiotis have suffered from catastrophic earthquakes, such as the 427 BCE Orchomenos earthquake sequence, which shook Boeotia, Euboea, and Athens and was perhaps a forerunner of the large Maliakos Gulf 426 BCE earthquake [39].
After another long period of seismic quiescence, significant activity was observed in the 19th century. On 13 December 1833, [41] reports a local earthquake was felt in Thiva. On 18 August and 29 September 1853, two destructive earthquakes struck Thiva, affecting the area between it and Yliki Lake, a few kilometers to the north. The first shock destroyed the northern outskirts and caused considerable damage to the rest of the urban environment, leading to 11 fatalities and 60 injuries. The second one caused the collapse of the already-damaged houses and ruined the rest, causing one casualty. At least 3 felt aftershocks occurred up to 1854 [14,39]. Thiva, with a population of 4000, was rebuilt by 1860, with wider spaces between houses. On 26 September 1872, a rather strong event occurred, preceded by a few foreshocks, causing nonstructural damage [39]. The earthquake of 23 May 1893 was also preceded by damaging foreshocks, ruining Thiva and nearby places [39]. The earthquake of 17 October 1914 occurred without a foreshock and caused heavy damage in Thiva and nearby villages. A strong aftershock, a few hours later, extended the damage area with a westward migration of seismicity [14,39,42,43]. This earthquake was recorded by the two seismographs of the National Observatory of Athens, of Mainka and Agamemnone type, followed by a series of aftershocks. All recorded events were located at a distance of 45 km from Athens, assuming their epicenters approximately at 6 km SE of Thiva, in agreement with the epicenter of the mainshock derived from the isoseismals drawn from a significant number of direct macroseismic observations [40,44]. The Annales de l’Observatoire National d’Athènes reported another damaging earthquake near Thiva on 23 September 1917, preceded by two foreshocks and followed by at least 37 recorded aftershocks lasting up to the end of the year. This information is passed on to the catalogues of Galanopoulos [45], Kárnik [46], and Shebalin et al. [47]. However, the event is not reported in the catalogue of Makropoulos et al. [6].
For the three events with I > 8, information on coseismic effects is also reported. More specifically, regarding the 18 August 1853 event, in the S. Euboekos gulf successive waves were observed and the sea flooded the coast without any damage. In Kopais Lake (artificially drained in 1880, approximately 25 km NW of Thiva) the banks were flooded. Rockfalls fell from a mountain near Thiva and from Mt. Ptoon (18 km to the north). Liquefaction near Atalanti was also reported. No ground cracks or surface ruptures were observed [39]. For the 23 May 1893 earthquake, ground cracks were reported near Thiva and Mulki, a settlement near Aliartos (Figure 1). Rockfalls and ground cracks, triggered by landslides, were reported from localities in the vicinity of Thiva. No information about ground deformations was reported [39]. For the 17 October 1914 earthquake, no ground cracks or any kind of ground ruptures was found [40].
For the pre-1900 events, macroseismic intensities were collected from [48], whereas for those in the 20th century, intensities were assigned using EMS98 (European macroseismic scale) [49] from the reports of the Annales de l’Observatoire National d’Athènes [40,44], as well as from Ambraseys’s unpublished material. The latter was donated to SL-NKUA and consists of notes, earthquake lists, slides, maps, and books. Having this information, we compiled the seismic history of Thiva, that is, a distribution of EMS98 intensities, I, over time, for events in the study area between 1893 and 1934 (Figure 2a). The apparent clustering of damaging (I ≥ 6) and felt earthquakes is associated with two periods (1914–1917 and 1923–1927) of the 20th century, the first related to the two most damaging shocks in this period (1914 and 1917). The activity in 1914–1917 is almost continuous, including fore- and aftershocks of the major events. However, at least five subclusters can be identified in the year 1915 (Figure 2b). This activity resembles the recent 2020–2021 activity in the vicinity of Thiva regarding its duration. It is noted, however, that the 1915 events represent the long aftershock activity of the 1914 event, a fact also mentioned in [40,44].
The significant number of available intensity data points allowed for the macroseismic estimation of earthquake parameters (MEEP) using the MEEP software [50], described in detail in [51]. The software calculates four types of epicenters (Centroid, MEEP, Bakun–Wentworth, and Pairwise). The first is based on the [52] “boxer” method, while the second is the MEEP procedure with iterations adopting the point of lowest RMS [50]. The other two procedures are the methods in [53,54], respectively. The uncertainties of the parameters are calculated via a bootstrap resampling routine of the intensity data points (IDP) data set [55], repeating the procedure 1000 times, from which a standard deviation is calculated. However, the final uncertainties concerning both the epicenter coordinates and the magnitude are obviously significantly larger compared with the respective ones obtained through analysis of recent instrumental data, depending on the number and distribution of the available IDPs. Table 1 and Figure 1 (green stars) present the results of MEEP software applied to the four most damaging earthquakes in the study area, with updated, in comparison with previous studies, parameters due to the increased number of IDPs (Table 1). It is observed that, within a period of 65 years, Thiva has experienced three events of equivalent moment magnitude, Mw, ranging from 6.0 to 6.2. Figure A1 presents the spatial distribution of macroseismic intensities assigned in this study and the calculated macroseismic epicenter of the 1914 earthquake derived from 62 IDPs. Our analysis yielded an epicenter between Thiva and Kallithea (site of the December 2020 activity). For the 1917 event, the epicenter is located in Thiva, where the sole maximum intensity is observed.

3. Seismological Data and Methods

Here, we study the seismicity in the area of Thiva between 25 November 2020 and 16 October 2021. During that time, P- and S-phase arrivals for over 2000 earthquakes were manually determined at the Seismological Laboratory of the National and Kapodistrian University of Athens (SL-NKUA). The catalogue data were enriched with additional events and manually picked arrival times from the database of the Geodynamics Institute of the National Observatory of Athens (GI-NOA). The compiled catalogue contains a total of ~2800 events for the study period. The sequence was recorded by the regional Hellenic Unified Seismic Network [56], complemented by the deployment of temporary local stations, which play a significant role in constraining the focal depths and increasing the detection threshold. Specifically, two stations (AMPE and THIV; Figure 3) were installed by SL-NKUA, and three stations (THVA, THI1, and THI2; Figure 1 and Figure 3) were installed by GI-NOA in the immediate area of Thiva.

3.1. Location and Relocation of Seismicity

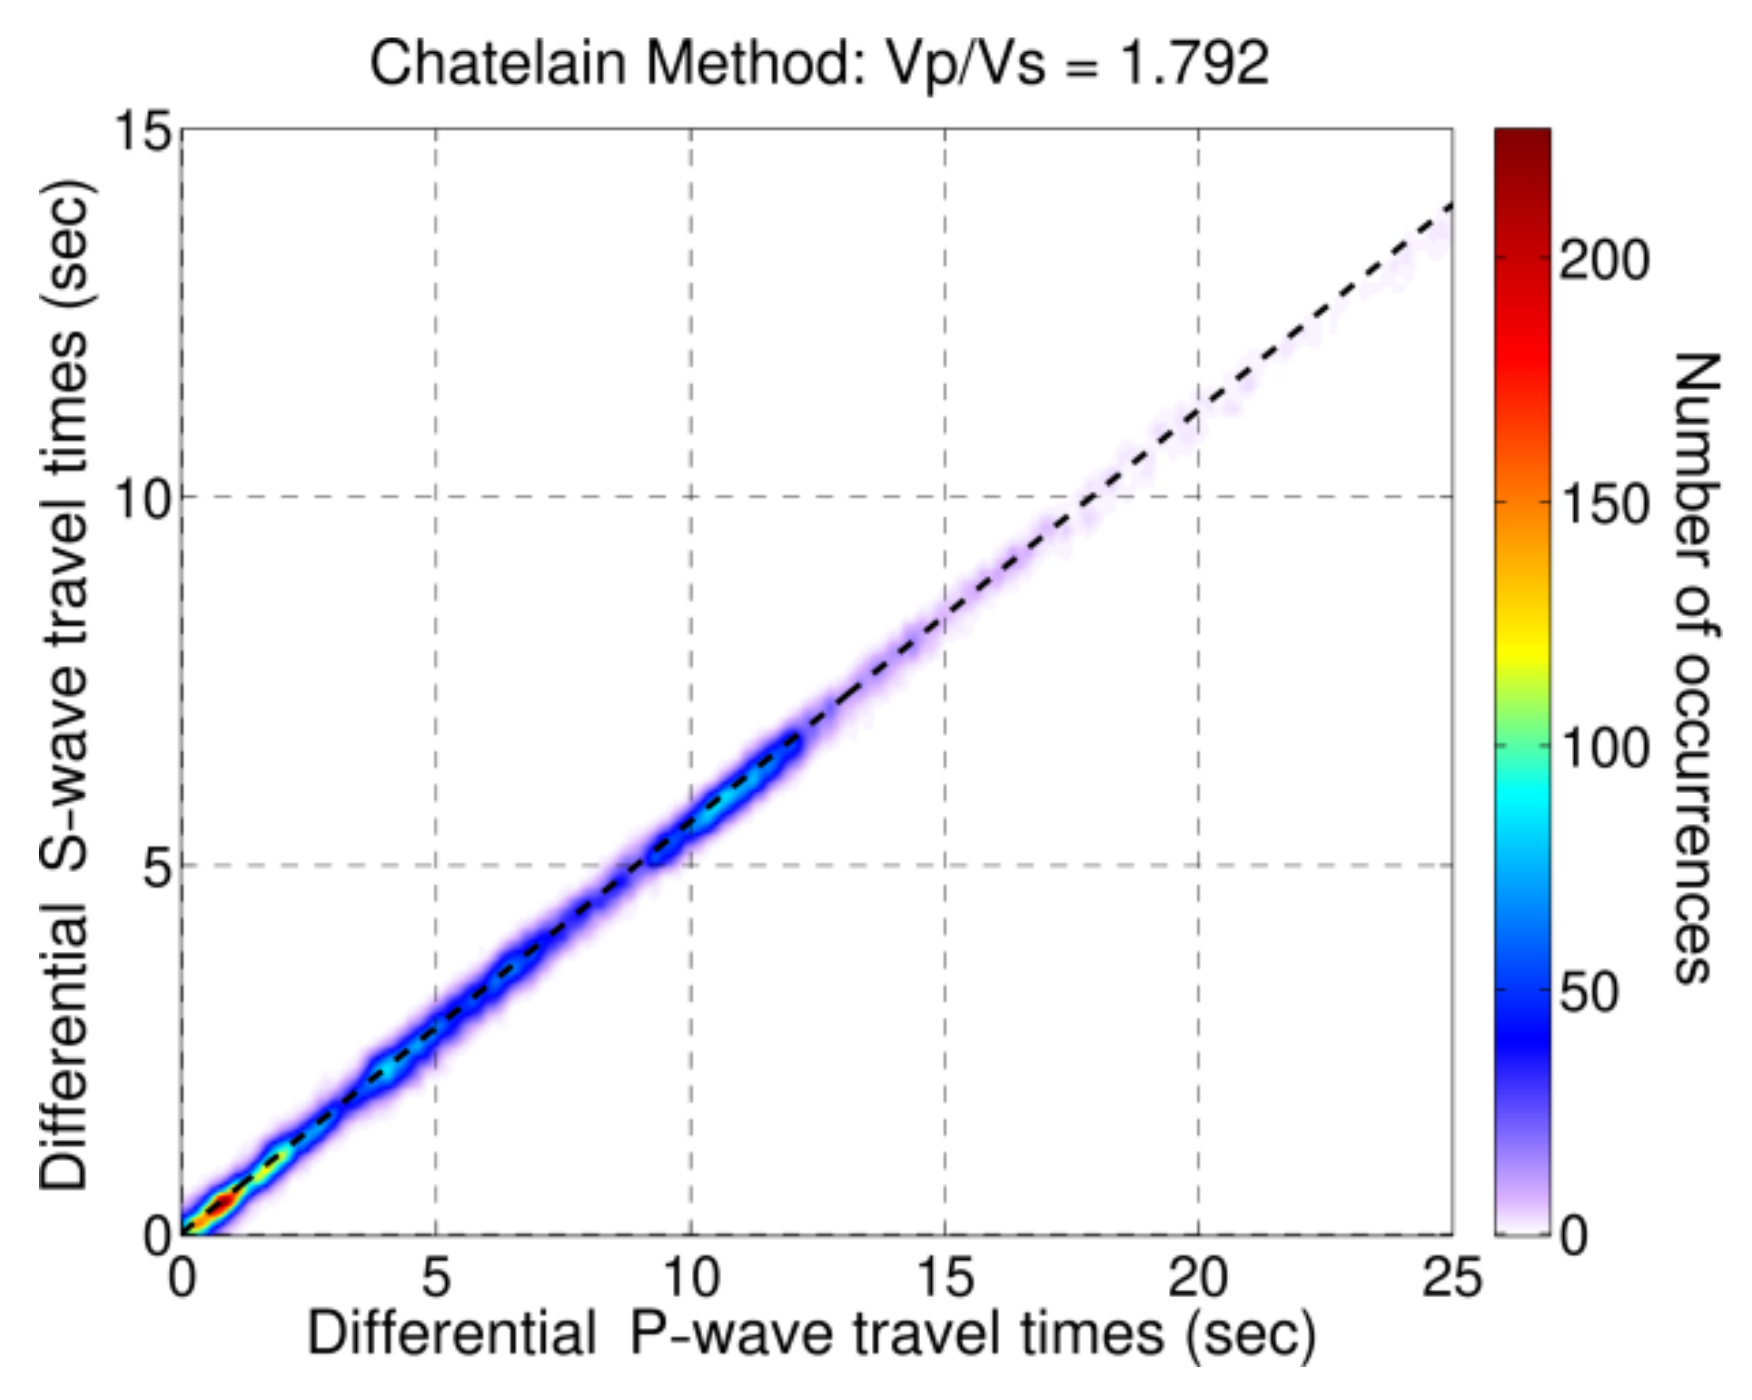
Initial locations for the earthquake sequence were acquired using the HypoInverse code [57], employing the P-wave velocity model of [58] for the neighboring Eastern Gulf of Corinth, as well as for Boeotia, obtained from recordings of the local CORNET network [59,60,61]. Other velocity models that were tried out (e.g., regional models for Central Euboea or Atalanti; [62]) provided similar results and comparable uncertainties; however, the [58] model was preferred for consistency with previous results for the 2020 Kallithea sequence, where the same model was used [36]. The importance of local velocity models for earthquake location has recently been demonstrated in the case of the 2019 Constance Lake (Central Europe) seismic sequence [63]. Regarding the present study, the Vp/Vs ratio was confirmed to be ~1.79 with the Chatelain [64] method (Figure A2), as in the original model of [58]. The initial locations are presented in Figure 3a. The average root mean square (RMS) travel-time residual for the dataset is 0.19 s, with average horizontal and vertical location uncertainties, as reported by HypoInverse, at 0.38 and 0.80 km, respectively (Figure A3). The average focal depth is 9.4 km, although much shallower hypocenters (a median focal depth of 4.2 km) are resolved for the eastern group, related to the 2020 Kallithea sequence, previously presented by [36]. The magnitude of completeness for the dataset is Mc = 1.6, determined by the entire magnitude range (EMR) method [65].
As this sequence involves a large number of events that occurred in a series of outbreaks clustered in space and time within a limited area, it is important to reduce the relative location uncertainties in order to better distinguish the activated structures. For this purpose, we employed the double-difference relocation code, HypoDD [66]. This algorithm minimizes the double difference between calculated and observed P- and S-wave travel times for pairs of neighboring events, resulting in the reduction of location uncertainties due to unmodeled velocity structure. Waveform cross-correlation data are also incorporated in the relocation scheme to enhance the hypocentral distribution of strongly correlated events by reducing relative location uncertainties due to arrival-time picking inconsistencies.
To facilitate the relocation procedure, the dataset was divided into subsets, each one with a smaller number of events. This was performed after examining the initial locations and separating the sequence into groups, roughly based on their spatiotemporal distribution. Several outbreaks were distinguished in time related to both temporal and spatial clustering of the occurring earthquakes. The Thiva earthquake sequence was divided into 9 temporal groups, each covering a different period and beginning with an abrupt increase in the seismicity rate.
The event waveforms were initially examined in terms of waveform similarity using reference stations located in the vicinity of the epicentral area and operational during the whole study period. For this purpose, waveforms of the station VILL (Figure 1) at a distance of ~16 km from Thiva were mainly employed, while additional data were also used from the temporary station THVA (Figure 3), deployed by GI-NOA at Thiva, 1 day after the 2 December 2020 Mw = 4.6 Kallithea event, and the station STFN at an epicentral distance of ~16 km from the 2020 Kallithea sequence (Figure 1). The full event waveforms (both P and S waves) were cropped and band-pass-filtered between 2 and 8 Hz for the stations VILL and STFN and in the range of 2–15 Hz for the station THVA. The waveforms of all combinations of event pairs were cross-correlated, and the RMS values of cross-correlation maxima from each component were registered in a correlation matrix. Nearest neighbor linkage was applied, and multiplets were formed with an optimal threshold value of Cth = 0.88, which maximized the difference between the size of the largest cluster and the sum of clustered events [67]. A total of 1948 events were classified in 163 multiplets. Next, for each of the temporal groups, the P- and S-wave windows of events belonging to the same multiplets were cross-correlated at each station with available arrival-time data, and their cross-correlation maxima with their respective time lags were registered as input for HypoDD.
The double-difference relocation procedure was performed separately for each one of the 9 temporal groups. The parameterization of the procedure for each group varies slightly due to the different numbers of events, travel-time data, and clustering properties. However, a similar scheme was employed for all cases, favoring stronger a priori weights for catalogue data during the first steps, followed by stronger weights for cross-correlation data during the last stage. A total of 2700 events were successfully relocated, representing 96.4% of the initial catalogue (Figure 3b).

3.2. Spatiotemporal Evolution of the Sequence

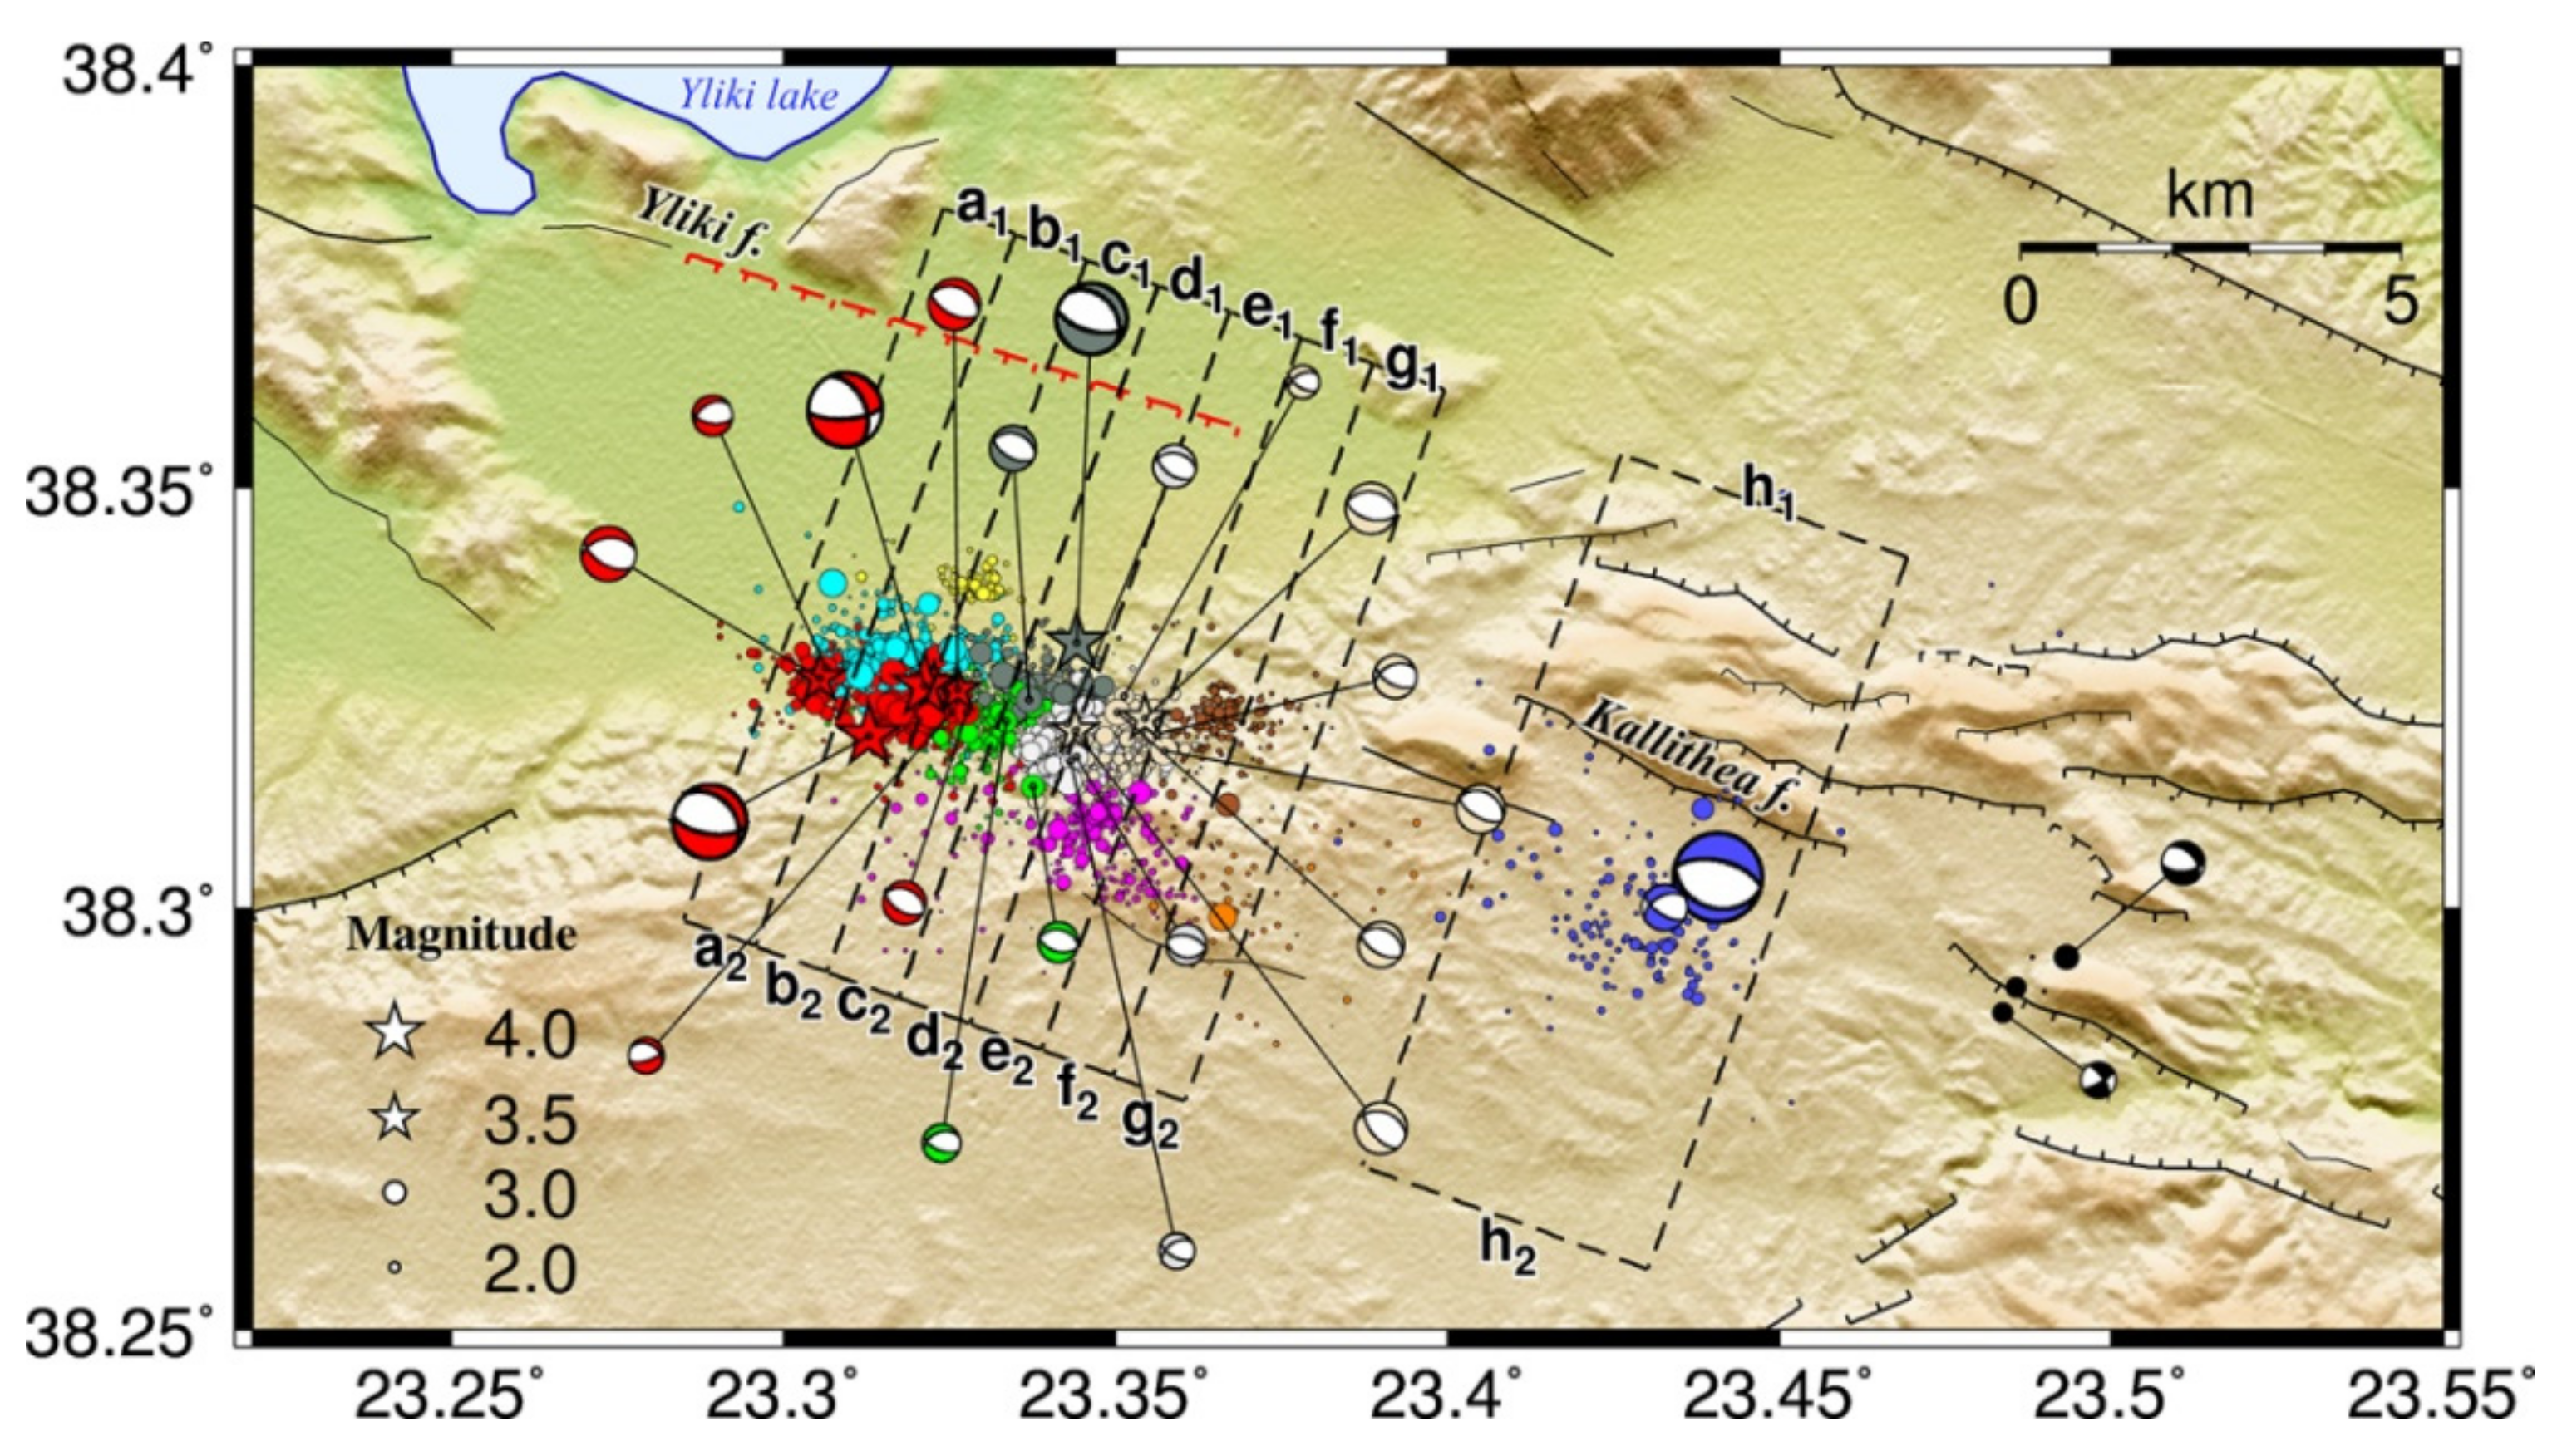
To examine the spatiotemporal distribution of the 2020–2021 Thiva sequence in detail, the dataset was divided into spatial groups, permitted by the achieved reduction of relative location uncertainties with the application of the double-difference relocation. Ward’s linkage was applied to the matrix of 3D hypocentral distances between all combinations of relocated event-pairs, and a large number of spatial clusters were formed. After visual examination, some smaller clusters were merged, and a final subdivision into 12 spatial groups was adopted (Figure 4). An exception to this procedure is group #1, which is related to the 2 December 2020 event, but is also covering all seismicity that occurred during the first period of the seismic crisis, that is, before 10 July 2021, which mainly took place at the eastern part of the study area. In the following, we examine the spatiotemporal evolution of the sequence with reference to the 12 spatial groups, distinguished by different colors and numerical labels (Figure 4).
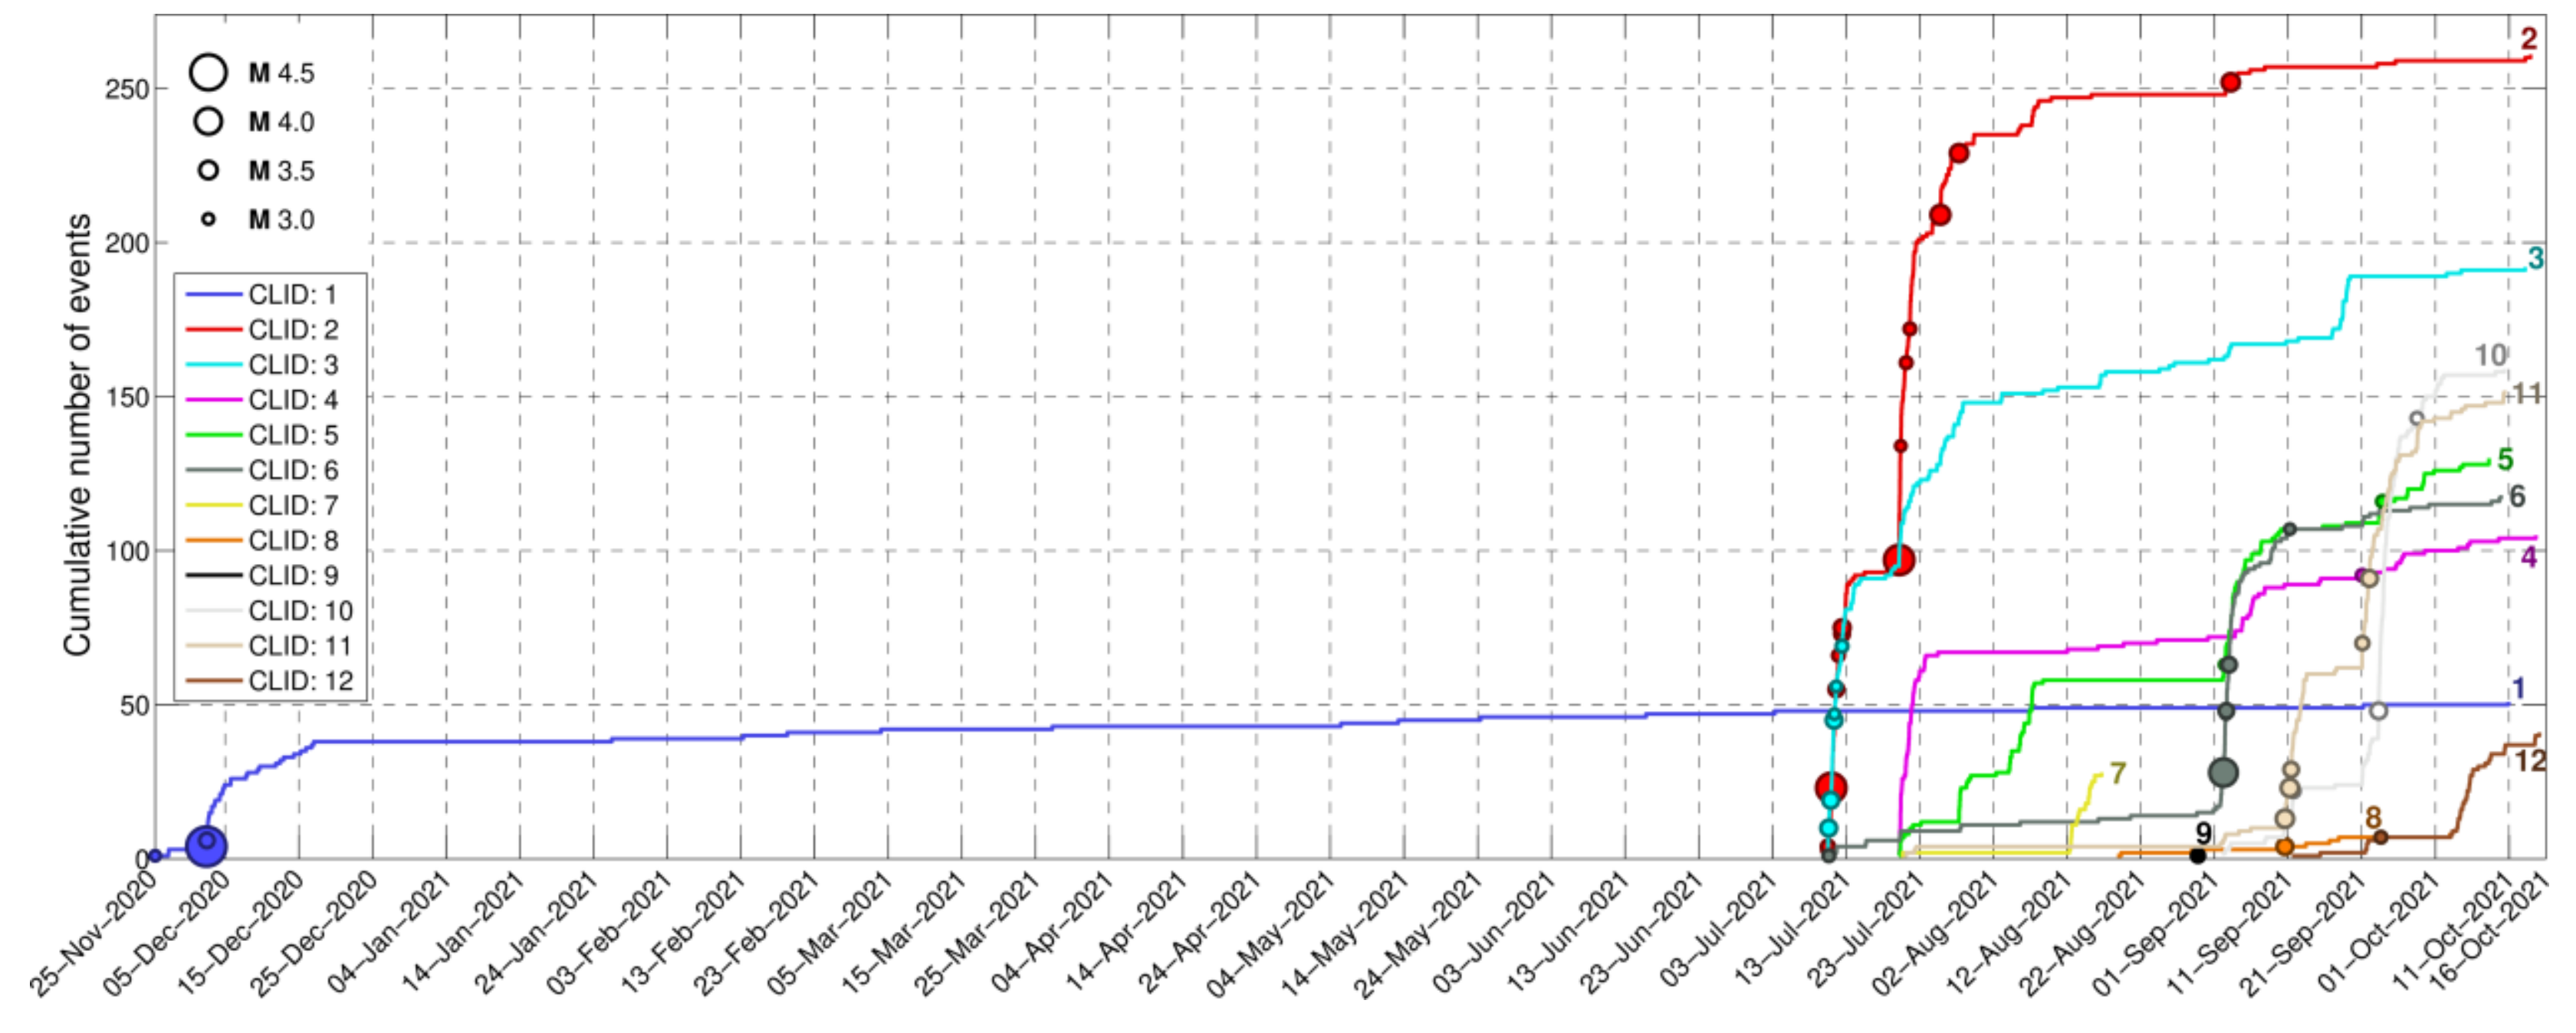
The sequence commenced in late November 2020, with a small cluster of earthquakes occurring near Kallithea (eastern group #1, blue), including an ML = 3.0 on 25 November. Then, on 2 December 2020, 10:54:56 UTC, an Mw = 4.6 earthquake struck near Kallithea. This earthquake apparently had a very shallow focus at a focal depth of 1.5 km after relocation in agreement with the results in [36]. The shallow focal depth of this event is evidenced by the fact that, despite its small magnitude, the deformation field was clearly identified by InSAR, exploiting Copernicus Sentinel-1 data in both ascending and descending orbital directions [36]. This sequence was short-lived, as it practically ceased after 17 December 2020, with a few earthquakes happening until January 2021, and was followed by a long period of quiescence (Figure A4 in Appendix B).
The seismic activity at the western part of the sequence started on 10 July 2021, with several events of 3.1 ≤ ML ≤ 3.4 (red group #2 and cyan group #3), which compose the western half of the 2021 swarm, also initiating seismic activity at group #6 (dark gray) at the midnorthern part with a rate of 0.3–0.2 events/day. A stronger event of Mw = 4.2 occurred on 11 July, 00:00:17 UTC, in the group #2 area, followed by another event of similar magnitude on 20 July in the same area. The latter earthquake increased the seismicity rate of groups #2 and #3, but also triggered seismicity towards other areas, mainly group #4 (purple) and, secondarily, group #5 (green), while a few events were located at groups #7 (yellow) and #11 (beige). Minor outbreaks, causing abrupt increase in the seismicity rate, occurred on 25 July (group #2, including an ML = 3.6 event, and group #3), 28 July (including an ML = 3.5 event at group #2), 4 August (group #5), 6 August (groups #2 and #5), and 12 August (group #7). A small isolated cluster of deeper events (~12 km; group #9) occurred on 29–30 August, ~4 km ESE of group #1, at the eastern end of the study area, initiated by an ML = 3.2 earthquake.
On 1 September 2021, an increase in the seismicity rate was observed in the group #6 area (dark gray), followed by an Mw = 4.1 event on 2 September in the same area. The latter also caused an increase in the seismicity rate, mainly at groups #2, #4, and #5 and less at groups #3 and #11, while events began occurring at group #10 (light gray). An abrupt increase in the seismicity rate of group #11 followed the occurrence of two ML = 3.5 events on 10 and 11 September in the same group, which also triggered events at group #10. A small cluster was triggered between 16 and 19 September at group #3, including four events with 2.5 ≤ ML ≤ 2.8. Another outbreak at group #11 occurred on 20 September, including an ML = 3.2 event on 21 September and an ML = 3.4 event on 22 September. A significant burst of seismicity at group #10 was triggered by an ML = 3.4 event on 23 September. Lastly, group #12 (brown) at the eastern end of the main part of the 2021 sequence increased seismic activity after 3 October without any major event. The strongest event since then was an ML = 2.8 earthquake on 10 October 2021 at group #11.
The spatiotemporal projection in Figure 5, along the WNW–ESE-oriented profile A–B in Figure 4a, roughly parallel to the main direction at which the epicenters are aligned, reveals the complex evolution of the 2021 Thiva earthquake sequence. The swarm was initiated on 10 July 2021 at the western end of the activated zone, spanning along groups #2 and #3, with a few events belonging to the neighboring group #6 at the eastern edge of the activated patches. On the outbreak of 20 July, the major Mw = 4.2 event occurred at group #2, but seismicity was also triggered eastwards to group #4, while seismic activity began at group #5, which presented some more bursts between 28 July and 8 August. The small isolated cluster #7, north of the main seismic cloud and slightly to the west of group #5, was activated between 12 and 15 August. A 2-week period of relative quiescence followed. Then in September, the outbreak at group #6 began with some foreshocks, followed by an Mw = 4.1 event on 2 September, mainly triggering aftershocks to the eastern half of the activated zone, including group #5 and a few events at group #2, at which the activity ceased later. Seismicity continued to spread eastwards, with few events at group #4. The next seismic burst occurred at groups #10 and #11 between 10 and 13 September. A last temporal cluster at group #3 took place between 16 and 19 September, followed by reactivation of groups #11 on 20 September and #10 on 23 September. Lastly, cluster #12 occurred at the easternmost end of the 2021 Thiva swarm.
Overall, the seismicity presents a general tendency for spatiotemporal migration towards ESE. This is not straightforward, as the early outbreaks are mainly confined at the western half, between groups #2 and #3, then spread suddenly to group #4 and later group #5. Since September 2021, however, seismicity mostly occurs at the eastern half of the activated zone. Foreshock seismicity near the origin of the Mw = 4.1 event of group #6 spreads towards WNW at a distance of ~1.5 km within 1 day, where it triggered an ML = 3.5 event at group #2. However, a slower seismicity triggering front can also be observed, spreading towards the east, including some events at group #4, then passing by the eastern edges of group #11 and later group #12, at a migration speed of ~70 m/day (Figure 5). Considering the possibility that this part of the seismicity is induced by the fluid-driven diffusion of pore pressure through the fracture network, a parabolic seismicity triggering front can be drawn according to the relation of [68]:
r t   =   4 π D t
where r(t) is the distance from the beginning of fluid injection at the origin and t the time elapsed since then, while D is the hydraulic diffusivity. This front would begin on ~1 September near the origin of the Mw = 4.1 event at group #6 and spread eastwards through mid-October, with a hydraulic diffusivity value between 0.20 and 0.25 m2/s (Figure 5). It can be observed that most of the eastward migrating seismicity is located behind the proposed parabolic triggering-front envelope, although some sparse events, mainly those of groups #4 and #8, are located on the outside, possibly triggered due to pore-fluid diffusion following paths of higher hydraulic diffusivity values.

3.3. Focal Mechanisms and Activated Structures at Depth

Focal mechanism data for the 4 larger events of the sequence (Mw > 4.0) are available from routine waveform modelling and moment tensor inversion analysis performed at SL-NKUA and GI-NOA. The fault-plane solution of the 2 December 2020 Mw = 4.6 Kallithea event is adopted from [36]. In addition, first-motion polarities (FMPs) were manually picked for 20 significant events of smaller magnitude (2.8 ≤ ML ≤ 3.6) from visual inspection of their recordings at local and regional stations of HUSN (Table A1 in Appendix B and Excel File S2 in the Supplementary Material). For each event, taking into account the relocated foci and the respective azimuth and angle of incidence corresponding to each station, a grid search was applied in the whole range of strike, dip, and rake (φ, δ, λ) values to find solutions compatible with the observed FMPs. In cases where no such solution was available, solutions with a lower percentage of compatibility with the FMPs were sought, considering the analyst’s quality estimate of each FMP, with a lower weight applied to measurements of emergent P arrivals or uncertain polarities. Each individual solution compatible with a minimum percentage of polarities was converted into a unitary double-couple moment tensor from the respective φ, δ, and λ parameters, and their sum provided an average focal mechanism for each event. Then, the RMS angular difference between average and individual solutions was measured in terms of their Kagan [69] angle, and solutions with an RMS < 25° were retained. The accepted focal mechanisms have at least 13 FMP measurements with over 90% compatibility.
The fault plane solutions of the major events, presented in Figure 6, indicate dominant normal faulting in an E–W to WNW–ESE direction, with few events presenting oblique-normal kinematics. The spatial distribution of the relocated hypocenters and the acquired focal mechanisms were examined in a series of cross sections, oriented N200° E (Figure 7). This direction is roughly perpendicular to the general trend of the mapped faults on the surface, which are in line with the focal mechanisms and with the main axis of the distribution of epicenters (i.e., N 110° E-oriented profile line A–B in Figure 4a). Starting from the westernmost cross section, a1–a2, groups #2 and #3 appear to correspond to the deeper and shallower parts, respectively, of a steep, south-dipping structure. This is represented by the red dashed line, which is the cross section of a least-squares plane determined from the joint distribution of groups #2, #3, #5, and #10 (see also the 3D model of Interactive Matlab Figure S1 in the Supplementary Material). The same pattern persists in section b1–b2, where, in addition, a few events of group #5 appear below group #2. The small isolated cluster #7 is also presented, with a dashed line showing the cross section of the least-squares north-dipping plane determined from this group and extrapolated a few km updip.
In the cross section c1–c2, the distribution of hypocenters becomes more complex, with the introduction of more spatial groups. The dark green dashed line, at a lower dip angle than the red one, represents a least-squares plane determined from the distribution of groups #5, #6, and #10. This plane seems to be consistent with the eastward extension of the Yliki fault when extrapolated downdip at an angle of 65°. Sparse seismicity belonging to group #4 can be observed in this slice. The cross section d1–d2 marks the beginning of the eastern half of the 2021 sequence, mainly activated after September. The dashed green line is consistent with the distribution of groups #6 and #10, as well as the remaining events of group #5, whereas groups #2 and #3 are not present in this slice. In the cross section e1–e2, a dense cluster of group #4, activated on 20 July 2021, can be observed, apparently belonging to a north-dipping structure (purple dashed line). The brown dashed line is the cross section of a least-squares plane determined from the distribution of groups #11 and #12, also north-dipping, but at a steeper dip angle. The latter structures can also be observed in the cross sections f1–f2 and g1–g2. The plane determined from groups #11 and #12 is oblique to the direction of the cross sections, increasing its distance from the plane of group #4 toward the east.
Finally, the cross section h1–h2 shows the distribution of group #1, which is related to the shallow 2 December 2020 Mw = 4.6 event associated with the south-dipping Kallithea fault. The relocated epicenters of the mainshock and most aftershocks (Figure 6) are clustered south of the Kallithea fault trace with the hypocentral distribution at depths shallower than 4 km being roughly subvertical but apparently favoring a south-dipping structure when considered together with the mainshock in agreement with [36]. The absence of a local seismological network in the area during the occurrence of the 2020 sequence limits our capacity to constrain the hypocentral depths for this group; however, the shallow depth of the rupture (or deformation source) is supported by the observed surface displacements given that almost two fringes are visible in Sentinel-1 coseismic interferograms [36].

4. Coulomb Stress Transfer Due to the 2 December 2020 Mainshock

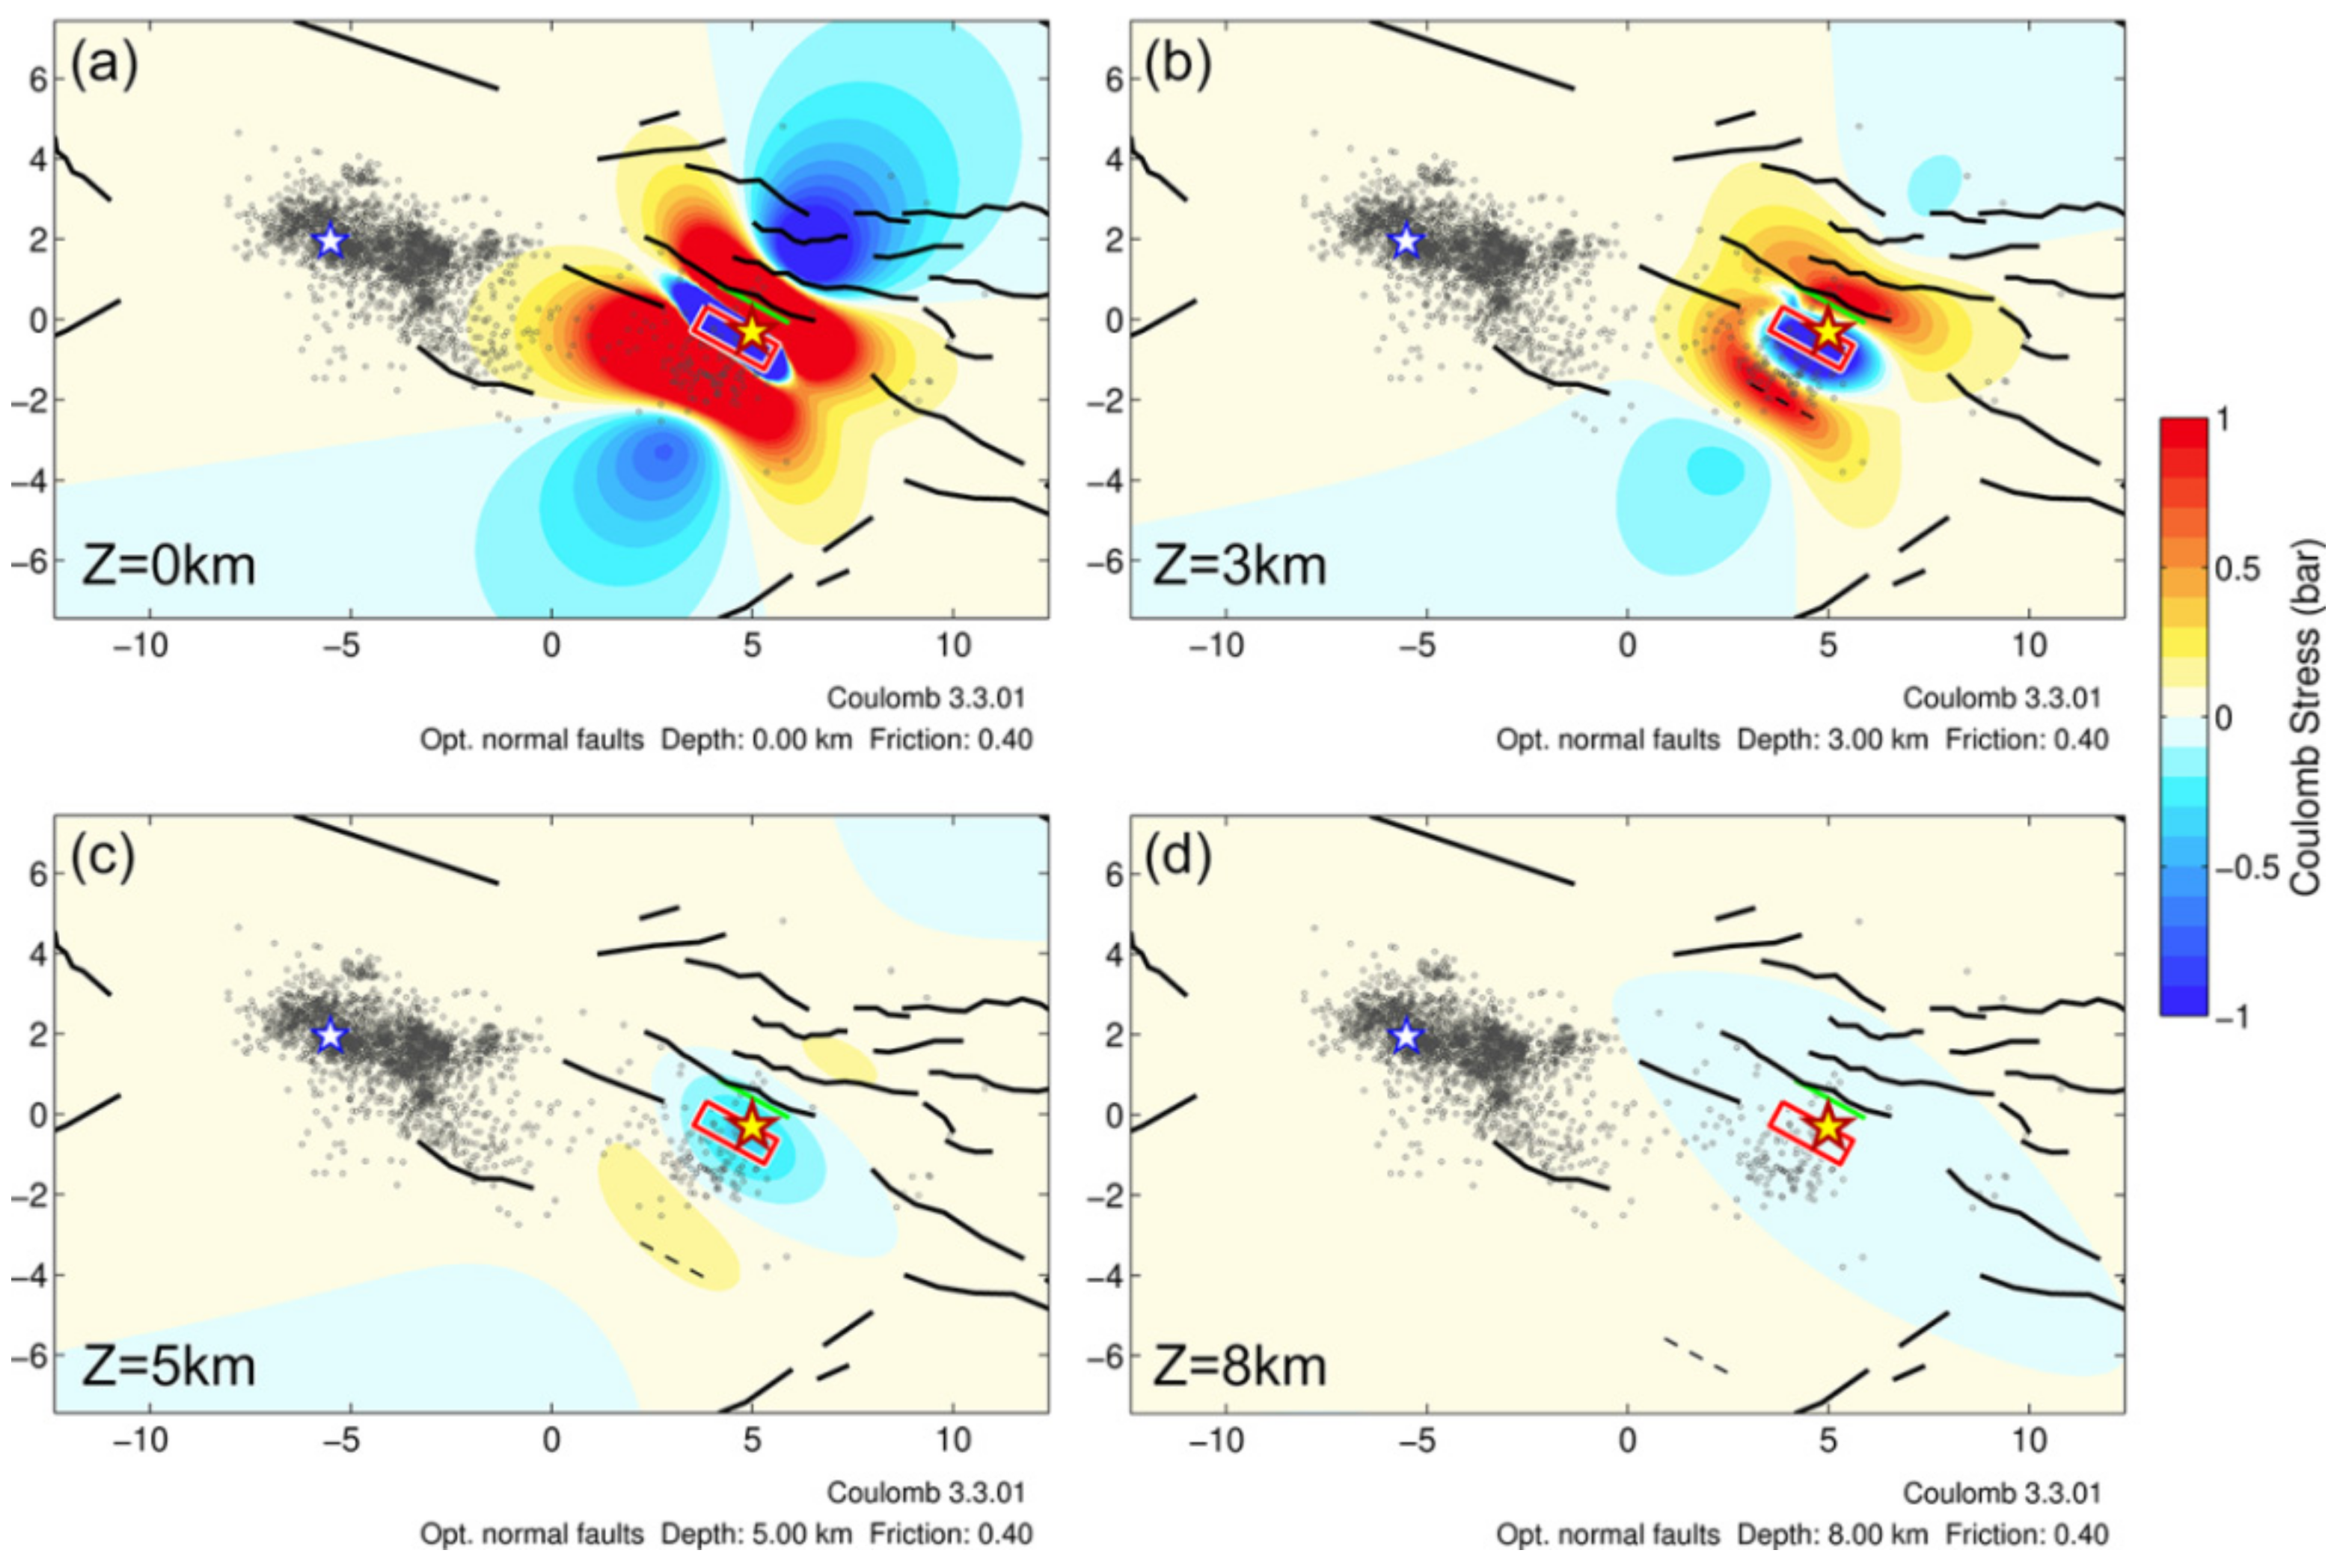
In the following, we calculate the effect of the 2 December 2020 Mw = 4.6 earthquake at Kallithea on the redistribution of stress in the study area to examine possible stress load to the zone that was activated after 10 July 2021 near Thiva. For this purpose, we adopt the geodesy-favored fault model in [36], determined through modeling of the observed surface deformation together with seismological data, which associated the earthquake with a shallow rupture of the Kallithea fault. Taking into account the abovementioned fault geometry and kinematics, with strike = 120°, dip = 48°, rake = −74°, and net slip of 240 mm, homogeneously distributed on the fault plane with a rupture top at 0.70 km and bottom at 1.44 km (fault length L = 2 km, width W = 1 km), we calculate the Coulomb stress transfer using the Coulomb 3.3 code [70] with an effective coefficient of friction μ′ = 0.4.
The Coulomb stress transfer model, determined for optimally oriented normal faults according to the regional stress field, which is dominantly extensional with a subhorizontal S3 axis oriented ~N186° E [71], is presented in Figure 8. The calculations indicate that a stress load greater than +0.1 bar is mainly confined at depths shallower than 6 km, whereas no significant stress transfer can be inferred at the seismogenic depths of the 2021 seismic swarm, which are between 7 and 12 km (Figure 7). Even at shallower depths, where the main rupture occurred, the +0.1 bar contour hardly reaches the eastern edge of the 2021 seismic sequence epicentral area. Furthermore, the nucleation of the 2021 sequence occurred at its western edge, that is, groups #2 and #3 (e.g., white star with blue outline in Figure 8), located at an even further distance from the Kallithea fault. This suggests that static stress transfer due to the 2 December 2020 mainshock could not have possibly triggered the 2021 seismic swarm.

5. Instrumental and Imaging Geodesy to Map Local Deformation

Over the past 30 years, Interferometric Synthetic Aperture Radar (InSAR) and in particular Multi-temporal InSAR (MT-InSAR), as well as Global Navigation Satellite System (GNSS) networks, have been established as methodologies capable of monitoring surface deformations in urban and rural environments with millimeter resolution [72,73,74,75,76,77]. However, a GNSS network provides information only about a few points, but is characterized as a dynamic real-time monitoring system of high precision in all three motional components. On the other hand, spaceborne SAR interferometry provides a large number of measured points over long time periods. Moreover, GNSS systems have a big economic cost. In addition, SAR interferometry has the capability to remotely monitor areas much wider than traditional surveying techniques without the necessity to install in situ ground instrumentation.
The pre- and coseismic deformation of the Thiva area was investigated based on MT-InSAR results using interferometric data from the Sentinel-1 A and B satellites of the Copernicus program. Copernicus Sentinel-1 A and B SAR scenes are freely available from the Sentinel Hub portal [78] and can provide improved SAR SLC (Single Look Complex) data, ensuring (a) continuous, all-weather, day and night imagery; (b) rapid revisit period in the same imaging mode (6 days); (c) constant and regular acquisition to build a large global archive; and (d) wide area coverage, thanks to the 250 km image swath width. Satellite geodetic data (GNSS) were used to calibrate and validate the interferometric results, while the location of the geodetic device acted as a reference point during the interferometric processing.

5.1. GNSS Geodetic Data to Map Local Deformation

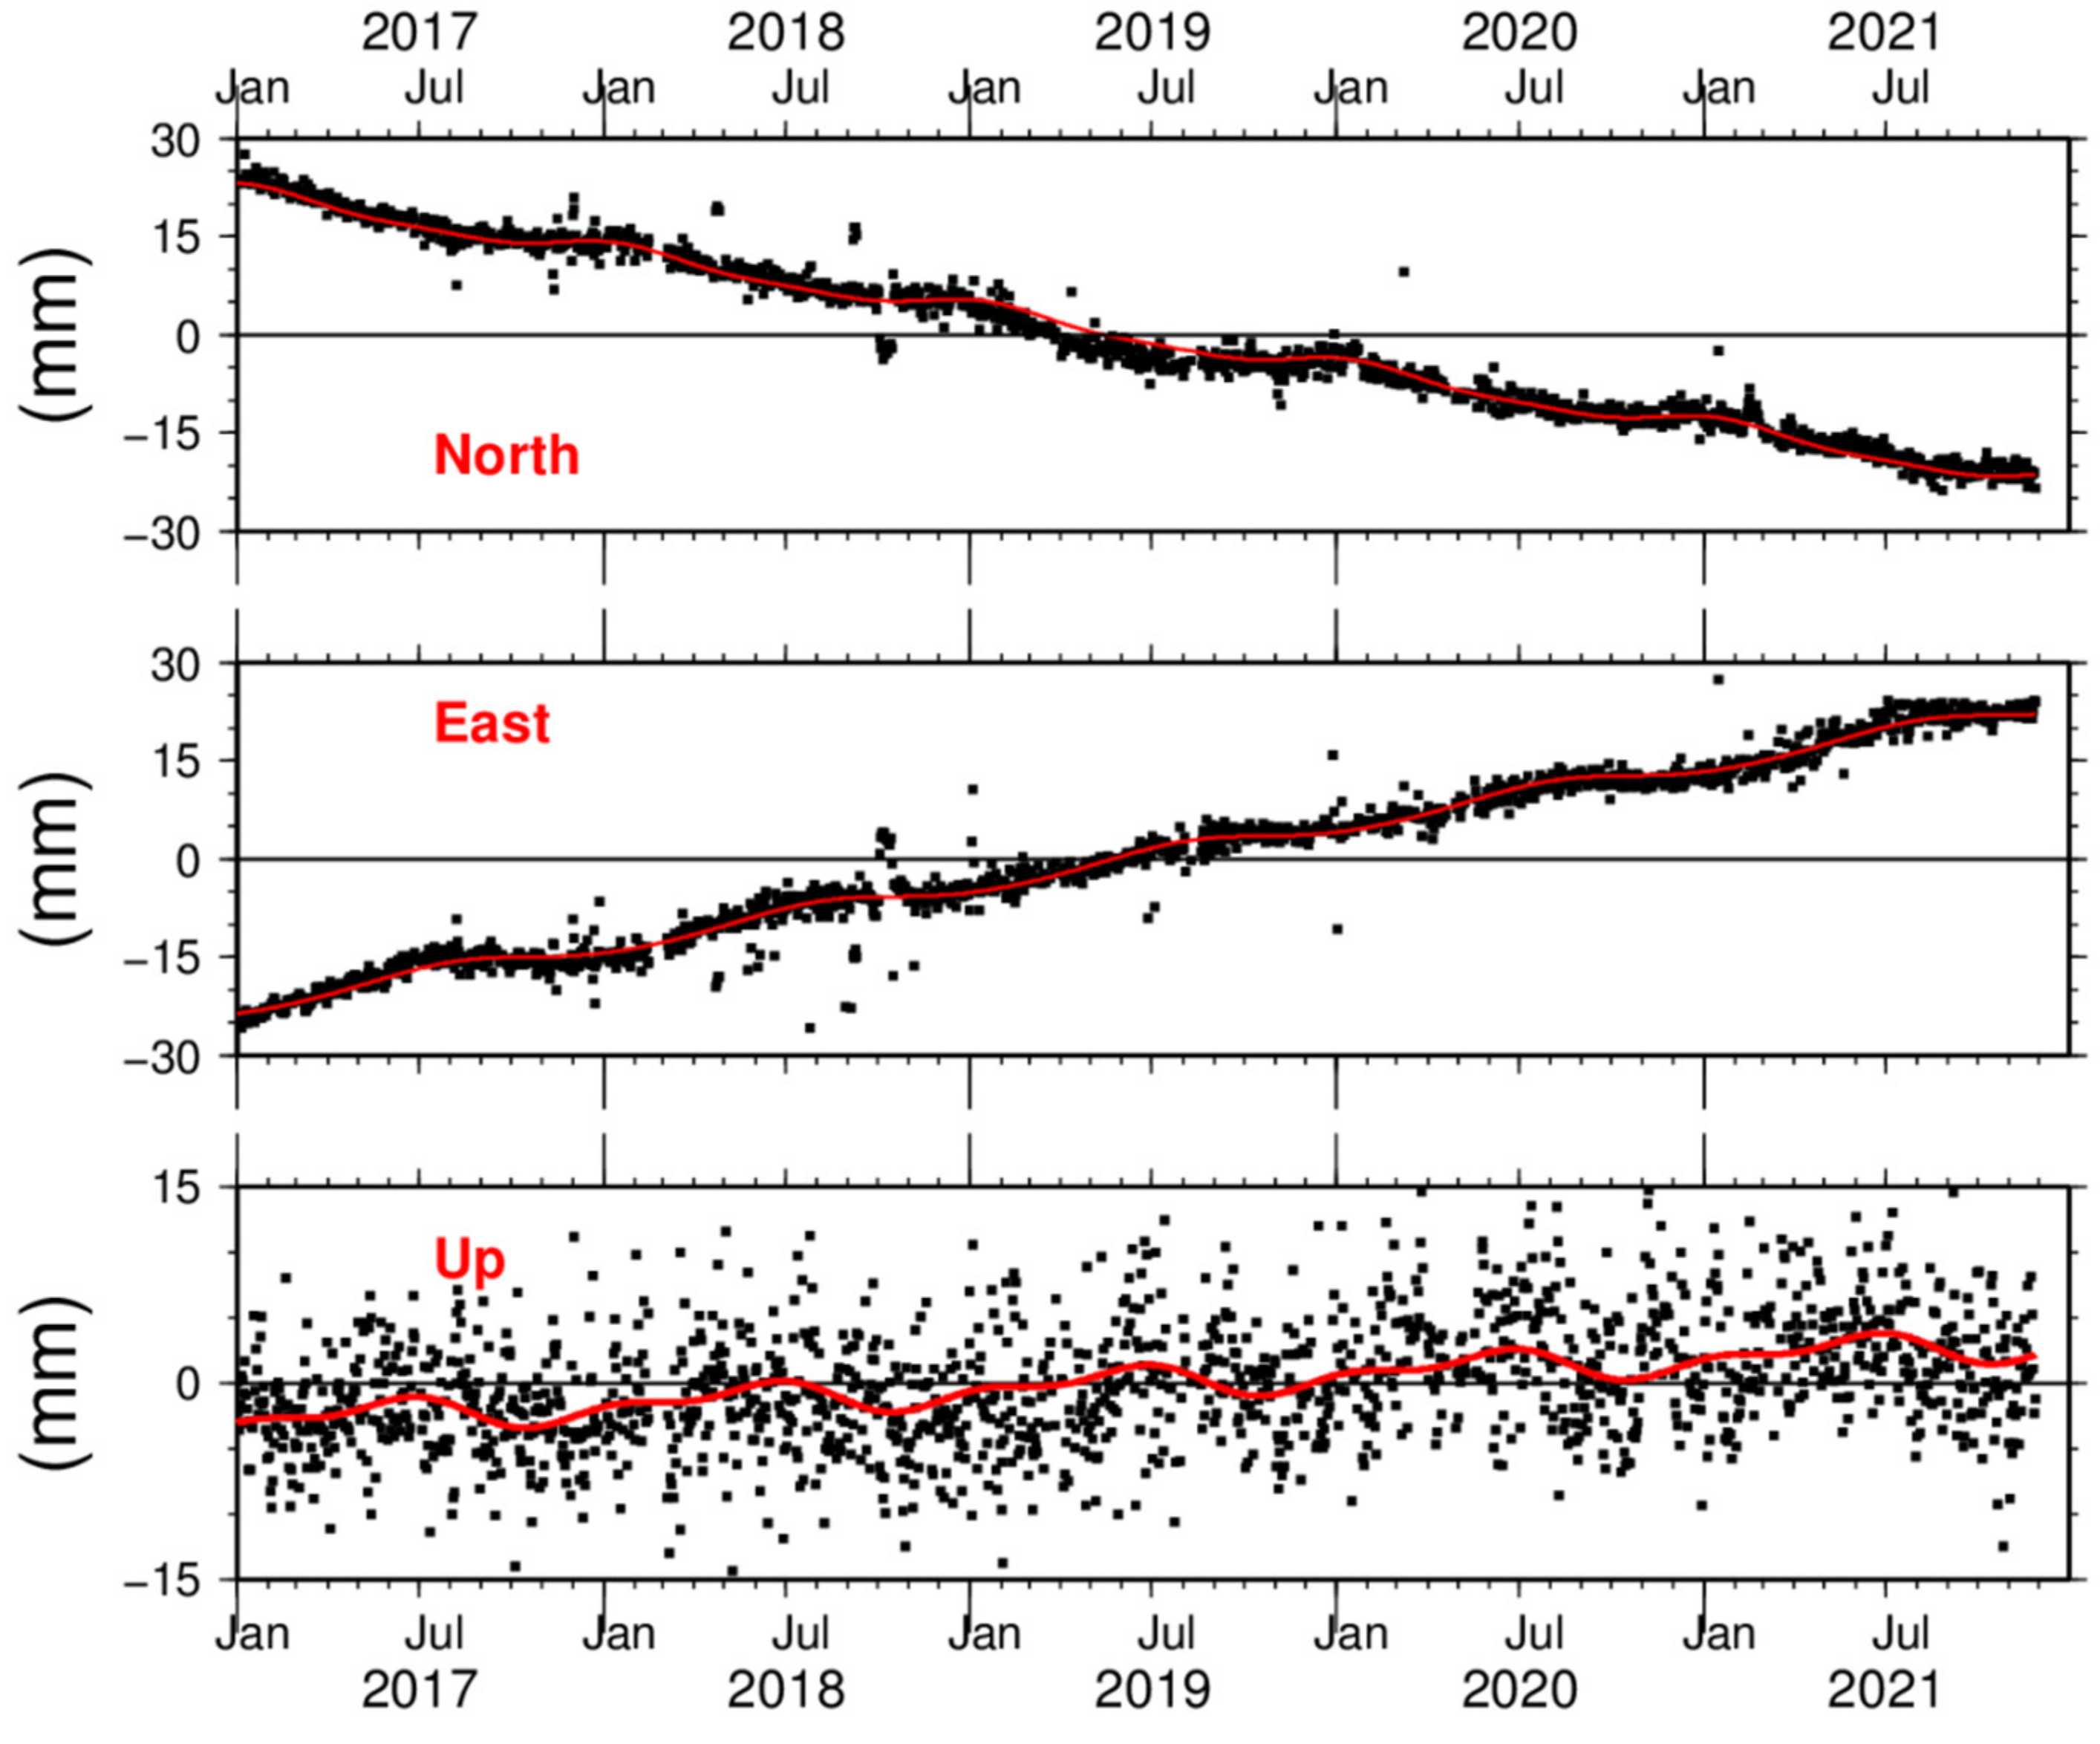
GNSS data from continuous stations (Figure 1, inverted yellow triangles) were processed for the period of January 2017 to November 2021. The available data cover the time prior to the outbreak of the seismicity, as well as the coseismic period. One of the analyzed stations, THIV (Figure 3), belonging to the HexagonSmartNet commercial network by Metrica S.A. [79], is located at Thiva and was operating continuously during the 2020–2021 earthquake sequence. Partial data from two more sites in Thiva were processed for the year 2018 and for the period 2019 to 2020 (belonging to the Uranus network by TreeComp [80]). The processing of the raw GNSS data was performed using the precise double-difference method with the Bernese v5.2 GNSS software [81]. The precise orbital solutions from the Center for Orbit Determination in Europe (CODE) were introduced in the estimation of the station’s coordinates. The time series of all three components of the daily coordinates of the station THIV on the global ITRF2014 reference frame area are presented in Appendix C (Figure A6). The velocity vector of the THIV station was estimated to be VNorth = −8.97 ± 0.04 mm/yr, VEast = 9.29 ± 0.04 mm/yr, and VUp = 1.16 ± 0.08 mm/yr. For the two other GNSS sites in Thiva, a similar velocity vector was estimated, although they refer to a slightly different time period. These velocity values are in accordance with previous estimations for the station THIV [5,82]. Based on the continuous daily solutions of the site THIV, it appears that the increased seismicity in the area in 2021 has not caused any observable static ground deformation or alteration of the velocity vector. The only noticeable change that was identified was a small alteration (changing point of the rate) on the vertical component since May 2019. More specifically, a slightly increased uplift motion was detected, from 0.09 ± 0.23 mm/yr prior to May 2019 to 1.18 ± 0.39 mm/yr, for the rest of the period. Moreover, a distinctive seasonal signal is emerged in the vertical component that could be associated with the seasonal fluctuations of the groundwater horizon. Calculation of the baseline changes between the THIV GNSS site and stations located in Chalkida (~30 km NE from Thiva) and Corinth (~54 km SW of Thiva), with both sites belonging to HexagonSmartNet, showed a linear increase during the whole time period of the distance between Thiva and Chalkida, as well as between Thiva and Corinth, equal to 0.8 ± 0.1 mm/yr and 4.0 ± 0.1 mm/yr, respectively. These results are compatible with the extensional regime of the broad area that has been previously described [5,82]. The time series of the Uranus stations was similar to the one presented here. These data were acquired at a high rate (1 Hz). A close examination during the occurrence time of the three earthquakes with Mw ≥ 4, with their epicenters located 2.8 km NE, 1.1 km NNE, and 0.6 km NW of the THIV GNSS station, respectively, yields that they caused no displacement waveform.
In an effort to define the source of the fluctuations in the vertical component, a joint interpretation of the local rainfall data and the geodetic data was performed. Rainfall data were recorded from a local meteorological station within Thiva. This station is operated by the METEO unit at the National Observatory of Athens and is part of the NOAAN network, consisting of 430 automatic surface weather stations in Greece, which monitors all basic meteorological variables, including rainfall, at 10 min intervals [83]. In Figure 9, the accumulated rainfall time series is shown upon the vertical THIV GNSS displacement time series, the latter being temporally shifted, after visual inspection, by 3 months towards the past, in order to minimize the difference between the rainfall variation and its impact to the ground observation. That is why the date of the alteration shown was previously mitigated from May 2019 to February 19 of the same year. In the diagram, a correlation of the peaks and valleys between the two time series within ±2 months is observed. Moreover, a similar correlation of the amplitudes of the two time series can be identified until October 2019. Then, there is no clear connection between the two datasets, except in October 2020. Towards the end of the examined period, we observe an intense decrease in the values of both curves. Thus, the vertical component of GNSS seems to be driven mainly by the water withdrawal to recovery equilibrium. From this, it can be inferred that the uplift observed after May 2019 can be attributed to the increase in the rainfall. The latter indicates that the observed vertical ground deformation is mainly controlled by the changes on the groundwater level horizon in the broad Thiva area and cannot directly be associated with the recorded seismic activity or be considered as a tectonic result.

5.2. Imaging Geodesy

For the InSAR analysis, 177 acquisitions of Copernicus European Sentinel-1 SAR SLC over Thiva were used, available on the Copernicus Open Access Hub [78]. For the processing, a 90 m/pixel digital elevation model (DEM) was used [84]. The Sentinel-1 products were acquired in interferometric wide (IW) swath mode consisting of three sub-swaths with a series of bursts covering a swath of 250 km. Specifically, 89 acquisitions on ascending (track 102) and 88 images on descending (track 09) were used, covering the period from January 2018 to September 2021.
The Multi-temporal InSAR data processing was carried out following the Small BAseline Subset (SBAS) MT-InSAR approach [85] due to the characteristics of the study area (mostly covered by rural areas) using the ENVI SARscape® software (L3Harris Geospatial, Boulder, CO, USA). The preprocessing phase includes the orbit correction of every image, the burst selection over the study area, and the image coregistration using a master image in order to generate interferometric pairs. On the main processing, wrapped interferograms were generated with a multilook range and azimuth (5 × 1), and 90 m/pixel DEM was used to subtract the topographic phase. The wrapped interferograms were unwrapped using the minimum cost flow (MCF) method [86] and converted into line-of-sight (LOS) displacement. The reference for both tracks was set up in the location of the GNSS station THIV. Considering that InSAR displacement in LOS only measures the path length difference between the earth surface and the satellite, displacement decomposition was carried out, exploiting the ascending and descending sensing trajectories to recover the vertical (up–down) and horizontal (east–west) deformation.
The vertical displacement map over the study area (Figure 10) shows mainly subsiding sites with a maximum cumulative displacement of about −40 mm. Nevertheless, there are areas where localized uplift took place with maximum values of 20–30 mm. On the time series plot (Figure 10, inset panel), 12 scatterers were selected to observe the vertical deformation pattern during the period of satellite acquisition (June 2018 to September 2021). As observed in the plot, the scatterers that were located inside Thiva (9, 11, and 12) are relatively stable, compatible to the GNSS result. The same pattern is followed by those that are located south of Thiva (2, 3, and 4), while scatterers 1 and 5 show a subsidence trend, especially after the 2 December 2020 mainshock, up to −10 and −19 mm, respectively. The highest uplift deformation is observed on scatterer 4, up to 15 mm, not associated to the earthquake (Mw > 4.0) occurrences. A different pattern is recorded in the vicinity of Kallithea (scatterers 6, 7, 8, and 10) characterized by subsidence trends. The deformation pattern in these scatterers is altered significantly after the occurrence of the Mw > 4.0 earthquakes during the processing period, as can be seen in Figure 10 (red lines). Scatterers 6, 7, and 8 show an increased rate of subsidence caused by the 2 December 2020 event, while scatterer 10 is characterized by a smaller subsidence rate.

6. Discussion

The 2020–2021 seismic sequence at Thiva, Central Greece, is a peculiar case of an Mw = 4.6 earthquake (on 2 December 2020) occurring at a relatively small distance (6–12 km) from a quite productive seismic swarm, which started ~7 months later. The 2 December 2020 event was interesting on its own, given that it was an unusually shallow earthquake, with its rupture expanding downdip, which produced observable deformation of about two fringes, on Sentinel-1 interferograms, on the surface, permitting its association with the Kallithea fault [36], despite its relatively small magnitude. It is worth noting that earthquakes with similar shallow depths have been reported worldwide, as the 2014 Mw = 5.1 La Habra earthquake in California at a depth of 2 km [87], a Mw = 4.9 earthquake in France at a depth of 1 km [88], and a Mw = 5.0 earthquake in Ecuador at a depth of 1.5 km [89]. At the time, there was no indication that this earthquake would be followed by an intense swarm near Thiva, as previous seismicity in the area was generally low and no increase in the seismicity rate could be observed until July 2021 (Figure A4). In the seismic catalogue in [6] for the periods of 1900 to 2009, only few events with Mw ≥ 4.0 are located in the broad area of Thiva; few sparse epicenters to the south are mainly related to aftershocks of the major earthquakes of 1981 in the eastern Gulf of Corinth owing to significant location uncertainties.
In this work, the parameters of four destructive events that have affected Thiva in the period of 1853–1917, all without any surface fault traces, were recalculated using macroseismic data (Table 1). These indicated seismic activation a few kilometers west of Thiva in 1853 and 1893, both of equivalent moment magnitude of Mw = 6.2, as well as an Mw = 4.5 event near Thiva in 1917. The epicenter of the Mw = 6.0 1914 event is located between Thiva and Kallithea, possibly within the area covered by the recent 2021 spatial groups in Figure 4. Coseismic effects, including ground effects, were reported for previous earthquakes with I > 8 in Thiva and its vicinities, in accordance with the estimated macroseismic parameters presented in Table 1. A series of small shocks, of intensity I < 5, originating from the study area throughout 1915 (Figure 2b) were also recorded, likely attributed to a seismic swarm or to aftershocks triggered by the 1914 mainshock. Such activity, characterized by small events of intensity I < 5, has similarities to the recent seismicity. Since the beginning of the enhanced monitoring by the HUSN in 2007, only sparse seismic activity has been detected near Thiva with magnitudes mainly ML < 3, with the largest event (Mw = 4.0) occurring near Yliki Lake on 25 June 2017 (see also the New Seismotectonic Atlas of Greece [13] for an overview of previous activity in the area).
The application of double-difference relocation in this study produced a high-resolution catalogue that permitted the distinction of several clusters within the seismicity cloud of the 2021 swarm (Figure 4). The spatiotemporal distribution of the sequence suggests that these spatial groups also exhibit strong temporal clustering, with a series of outbreaks related to the larger events of the sequence. The resolved focal mechanisms indicate mainly normal dip-slip and, to a lesser extent, oblique-normal faulting (Figure 6), compatible with the regional stress of the area [71]. Through detailed cross sections and a 3D model of the spatial distribution of hypocenters (Interactive Matlab Figure S1 in the Supplementary Material), it was possible to identify the likely geometries of the activated structures at depth. In contrast to the shallow 2 December 2020 mainshock, which is associated with the Kallithea fault by straightforward interpretation of the observed displacement pattern [36], the deformation due to the 2021 swarm did not reach the surface. This is explained by the larger focal depths of the major events of the swarm, combined with their low magnitudes. Furthermore, the epicentral area of the 2021 swarm is void of mapped faults (Figure 1). Specifically, the traces of known south-dipping faults in the east, including Kallithea fault, having a WNW–ESE trend, compatible with the focal mechanisms and general geometry of the structures involved in the 2021 seismicity, are terminated ~1–2 km before reaching the first epicenters of the swarm. The same is true for the mapped faults west of the swarm, which are less compatible in terms of their strike. To the south, a south-dipping fault is mapped near the edge of the southern cluster #4, which is associated with a north-dipping structure. To the north of the epicenters, there is a plain of agricultural land without mapped faults or any apparent anomaly in the topography. The only likely candidate fault that could be associated with some of the activated structures at depth is the south-dipping Yliki fault at the southern coast of Yliki Lake. Even so, the fault trace would have to be extended by a few km towards ESE (Figure 6) in order to match the updip extension of some of the activated structures at depth, particularly those related with the major (Mw > 4.0) events of the sequence. Other identified structures at depth seem to correspond to steeper faults that would outcrop south of Yliki fault. Two of the identified planes at the eastern part of the swarm suggest a north-dipping fault. The latter cannot be associated with any of the mapped faults on the surface.
The initiation of the 2021 seismic swarm took place near its western extreme, about 10 km WNW of the 2 December 2020 mainshock’s relocated epicenter. In the constructed Coulomb stress transfer model for this earthquake, it became apparent that, even with a fault model derived by geodetic data [36], which produced a slightly overestimated moment magnitude (Mw = 4.7), stress loading for optimally oriented normal faults under the concurrent regional stress regime drops below +0.1 bar, which is regarded as the lower threshold capable for stress-trigger earthquakes [90], near the eastern margins of the swarm (Figure 8). Given that the nucleation of the 2021 sequence took place at its western end, with an Mw = 4.2 event on 11 July 2021, the Coulomb stress transfer due to the 2 December 2020 mainshock is not considered sufficient to trigger the 2021 swarm. This is further justified by the shallow depth of the 2 December 2020 event, but the result, concerning stress transfer at the seismogenic depths of the 2021 swarm, would be the same even if the 2020 mainshock’s fault model was placed ~5 km deeper. Therefore, despite seeming counterintuitive, there appears to be no causative link between the 2 December 2020 mainshock and the occurrence of the 2021 swarm; that is, there is no evidence that the former accelerated the occurrence of the latter.
To further examine other possible triggering mechanisms, we employed instrumental and imaging geodesy to investigate pertinent local deformation transients that may have played a role in the stress loading of the area. As in reported cases in the literature, a slow slip event (e.g., [91]) or uplift/subsidence due to groundwater level changes (e.g., [92]) could have increased the applied stresses to the faults of the area, including Kallithea fault and the fault system that hosted the 2021 swarm. This would have the potential to induce seismicity at both places and indicate a common cause for their seismic excitation. However, no significant anomalies in the displacement components of the GNSS station THIV, located at Thiva, could be detected (Figure A6), with the station presenting the anticipated regional horizontal motion and a steady long-term uplift at a slightly increased rate of 1.18 ± 0.39 mm/yr since May 2019. It is noted that the variability of vertical displacement at THIV was found to partially correlate with the detrended variability of accumulated rainfall at a local meteorological station with a lag of ~3 months (Figure 9). This likely indicates a delayed response of the vertical ground displacement due to the groundwater equilibrium, but the uplift trend prevails. Similar cases of uplift incidences due to recharging of the aquifer after near-record rainfall were documented by [93] using both GNSS and InSAR, supported by well level signals. The seismic swarm was initiated at the time of a highly decreased rate of the detrended accumulated rainfall that started declining 1 year before. This observation alone cannot support the groundwater level changes as a triggering cause of the seismic activity.
By employing InSAR data and through the application of the SBAS method, downlift or uplift, cumulated through the period between 2018 and September 2021, with reference to the GNSS station THIV, were detected at several localities in the study area. The examination of the temporal variation of vertical displacement at selected scatterers (Figure 10) showed subsidence associated with the Mw = 4.6 2 December 2020 earthquake in the vicinity of Kallithea fault. On the other hand, no significant anomalies in the vertical displacement were recognized at scatterers near or south of Thiva, that is, the epicentral area of the 2021 swarm. Although coseismic displacements on the surface were not expected to be detected for the major events of the 2021 swarm, due to the small magnitudes and larger focal depths compared with the 2 December 2020 mainshock, the lack of preseismic deformation indicates no detectable changes that could be associated with slow slip or groundwater level changes, affecting the local stress.
Although the initiation of the 2021 swarm could not be explained by Coulomb stress transfer due to the 2 December 2020 mainshock, its evolution can be partly attributed to stress triggering. The major earthquakes of the swarm in July 2021 occurred at its western end, and the swarm progressed eastward in a cascade of outbreaks related to major events. Following a small interval of low seismic activity in the second half of August 2021, a second stage of the swarm was initiated by an Mw = 4.1 event on 2 September. However, part of the continuing eastward migration of seismicity could possibly be attributed to pore-pressure diffusion, as seismicity is roughly bounded by a parabolic envelope of hydraulic diffusivity D = 0.25 m2/s (Figure 5). On a larger temporal scale, seismicity tends to spread eastward at a rate of ~70 m/day since August 2021. During the continued monitoring of earthquake activity in the study area at SL-NKUA, after 16 October 2021, that is, the end of the period studied in this work, the seismic swarm gradually diminished. Fewer than 300 events of ML ≤ 2.6 occurred until the end of January 2022 east of Thiva, where seismic activity was already observed in the first half of October 2021.
Both the abovementioned hydraulic diffusivity and the migration rate are comparable with the respective values previously measured in fluid-associated earthquake triggering at the Western Corinth Gulf (e.g., [9,10,12,94,95]). Seismic swarms are commonly observed in areas related to volcanic activity, involving magmatic or hydrothermal fluids (e.g., the 2008–2009 swarm at Yellowstone Lake [96] or the 2008 swarm at Vogtland/NW Bohemia [97]), or induced by water injection in geothermal fields (e.g., the 1993 swarm in Soultz-sous-Foret, France [98]). In tectonic environments, where seismic swarms are less frequent, the fluids that drive seismicity can be of meteoric origin, as has been suggested for cases such as the 2003–2004 swarm in the Western Corinth Gulf [99] or the 2011 swarm in Oichalia, Southern Greece [100], as well as for the 2002 swarm in Hochstaufen Mountain, SE Germany [101], and the 2003–2004 swarm in the Ubaye-Argentera area in the southwestern French–Italian Alps [102]. Another possible source could be the subducting oceanic slab through dehydration, with fluids migrating upwards (e.g., [103]). The intrusion of fluids through fissures or the fracture network can induce seismicity either by localizing stress or by increasing pore pressure, reducing the effective normal stress, and facilitating aseismic creep. During the evolution of fluid-driven swarms, small asperities embedded within the faults are breaking, as creeping of the surrounding surface proceeds, generating multiplets, caused by repeated slip on the same fault patch. Larger asperities may generate the major events of a swarm, transferring static stress to neighboring fault patches where aftershocks are triggered, causing the seismicity rate to increase abruptly, then to gradually decay following Omori’s law. Therefore, swarms evolve as a consequence of both fluid intrusion and stress transfer, as has been suggested for the case of the seismic swarm of 2000 in Vogtland/NW Bohemia [104], and even involve episodes of aseismic slip, as in the October 2015 seismic swarm in Malamata, in the Western Corinth Gulf [12]. Spatial leaps in the triggering of earthquake clusters (e.g., group #4 of the 2021 Thiva swarm) or delayed major events (e.g., the 2 September 2021 event in group #6) could also be explained by subcritical crack growth due to stress corrosion attributed to chemical action at the crack tips (e.g., the earthquake swarm at Hida Mountains, Central Japan [105]). Another possible mechanism for gradual fault weakening is the erosion of the fault walls by fluids, which has been suggested for the 2008 swarm in Vogtland/NW Bohemia [106]. The short time period of relative seismic quiescence between 15 and 31 August in the Thiva area suggests that stress-transfer-related triggering effectively ceased in the western part of the swarm, but stress-induced corrosion, fluid erosion, or another aseismic factor, such as creeping or intrusion of subsurface fluids, were undermining the faults of the eastern half. The signature pattern of fluid-driven pore-pressure diffusion is the observed parabolic envelope in the spatiotemporal projection of Figure 5, indicating an expanding triggering front, starting from an injection point that roughly coincides with the location of the 2 September 2021 event. It is likely that the latter earthquake created a new pathway for the propagation of pressurized fluids, which caused seismicity to migrate further eastwards.
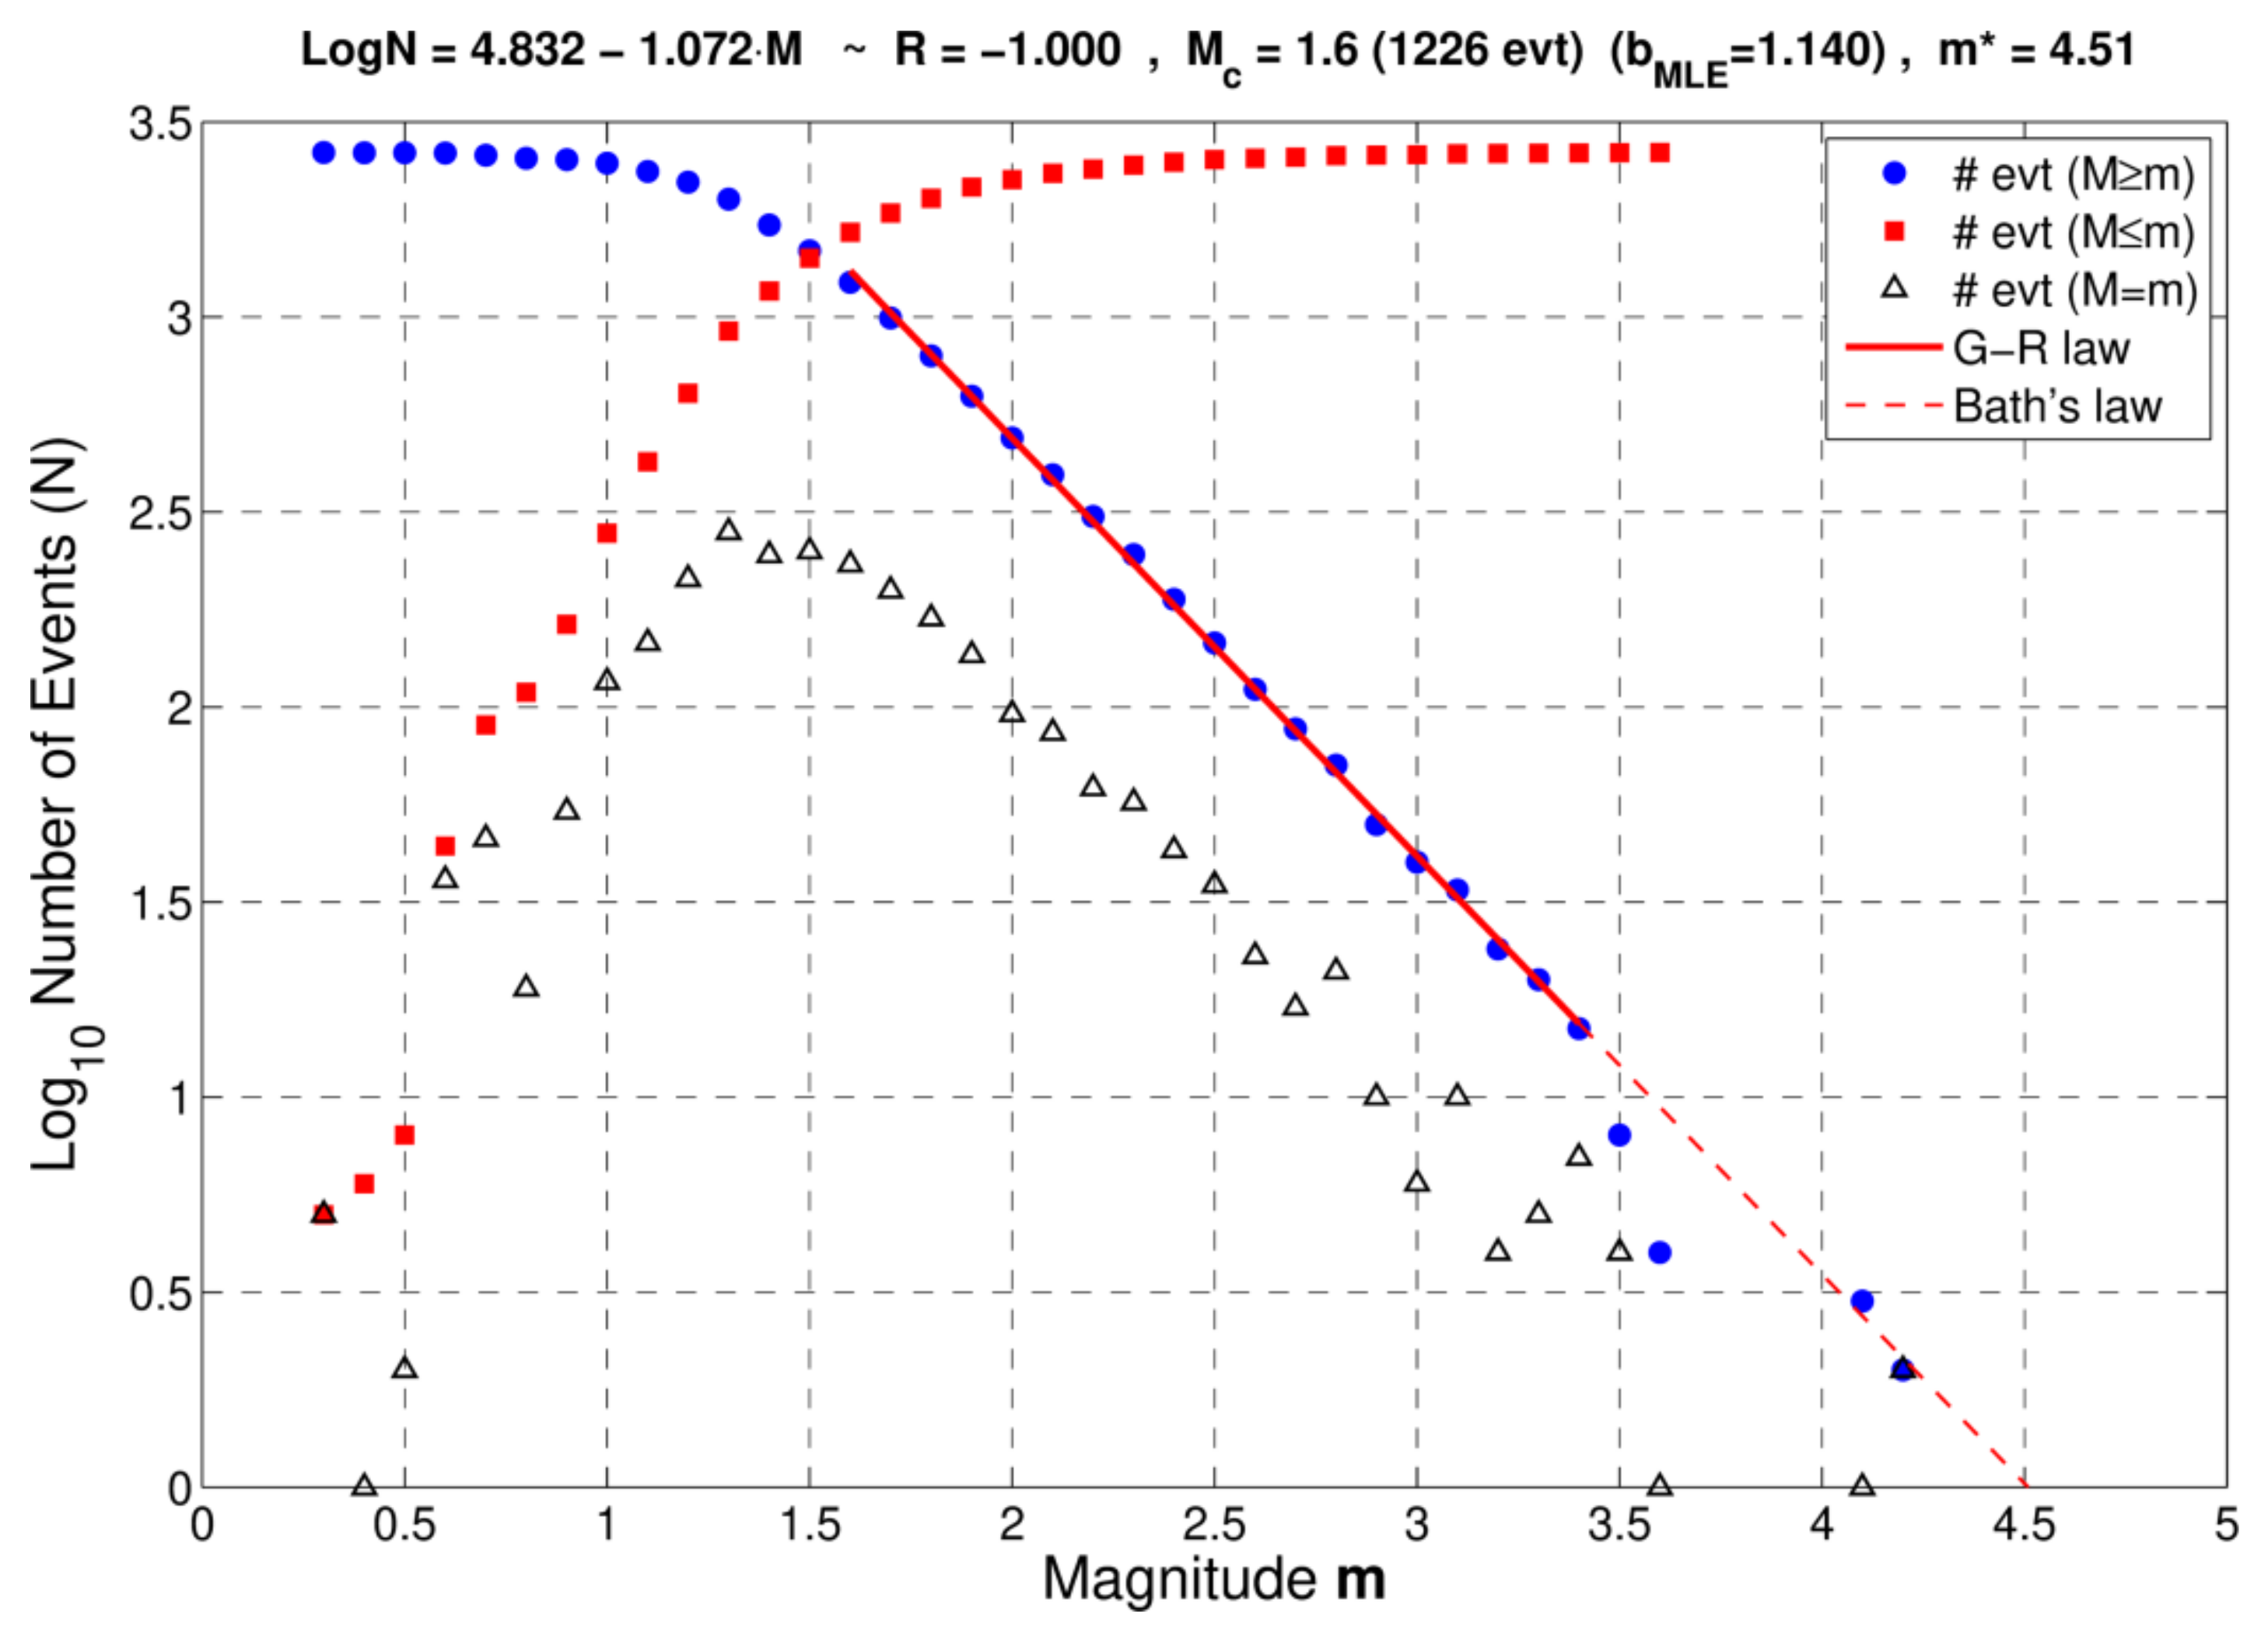
As evidenced by historical data, Thiva has experienced destructive Mw ≥ 6.0 earthquakes in the past. Even though there are no significant recent events in either Kallithea or Thiva, macroseismic data suggest a past activation of the area in between. This points out that the 2020–2021 earthquake sequence does not reflect the full seismic potential of the study area. The local densification of the seismological network has permitted the detailed mapping of the activated structures at depth and the enhancement of the detection threshold. The fault segmentation, leading to a cascade of small outbreaks, and the b-value of the Gutenberg–Richter law of the 2021 seismic swarm, which is near or slightly above unity (b ≈ 1.07 by the least-squares method, or b ≈ 1.14 by the maximum likelihood method for a magnitude of completeness of Mc = 1.6; Figure A5), indicates that this particular seismogenic volume is unlikely to produce a large event at this time. However, other neighboring fault zones could possibly be triggered due to the cumulative stress transfer caused by the major events of the sequence. This could have potential implications to the seismic hazard of the area, as several seismogenic sources have been recognized in the vicinity of Thiva (e.g., [107]).
It is also worth noting that the evolution of a seismic swarm is not always similar to the one of the present study. Recently, on 27 September 2021, while the Thiva swarm was still active, a destructive earthquake (Mw = 6.0) occurred in Arkalochori in central Crete [31,32]. In Arkalochori, the seismic activity was initiated about 4 months before the mainshock, in early June 2021, as an earthquake swarm. However, the evolution of the Arkalochori sequence was dramatically different, culminating in the Mw = 6.0 mainshock that caused one fatality and hundreds of damaged buildings. In that instance, the seismic swarm was characterized, retrospectively, as a foreshock sequence. It is, therefore, important to continue monitoring the microseismic activity of the area of Thiva, in case seismicity migrates to neighboring structures.

7. Conclusions

We performed a detailed seismotectonic analysis of the 2020–2021 earthquake sequence in Central Greece involving a mainshock–aftershock sequence in December 2020 at Kallithea fault and a seismic swarm in July–October 2021 near Thiva. Through high-resolution double-difference relocation of the earthquake catalogue, we identified a system of conjugate WNW–ESE-trending normal faults below Thiva with several fault segments being triggered at different times, producing a complex seismic swarm that evolved in a series of bursts. Seismicity mainly migrated from west to east, with triggering mainly attributed to stress redistribution due to the larger events of the sequence.
The swarm could be divided in two stages, the first concerning its western half, initiated by an Mw = 4.2 event on 11 July 2021, and the second triggered by an Mw = 4.1 event on 2 September 2021, activating its eastern half. In the former stage, the seismic activity can be partly related to the, inferred, eastward extension of the south-dipping Yliki fault at the southern margin of Yliki Lake, north of Thiva. However, activity at more steeply dipping structures could also be identified. The second stage, likely related to the eastern termination of Yliki fault, also generated seismic activity on some conjugate north-dipping structures with some indications of triggering by overpressurized fluids, with seismicity migrating eastwards following a pore-pressure diffusion front.
We applied a multidisciplinary approach to investigate possible triggering mechanisms of the swarm. Coulomb stress transfer due to the Mw = 4.6 2 December 2020 earthquake was considered insufficient to trigger the July–October 2021 swarm near Thiva, as stress loading much lower than +0.1 bar was measured at the nucleation site. Furthermore, surface deformation measurements through GNSS and InSAR did not show any significant anomalies, which could be related to phenomena such as subsidence due to groundwater withdrawal or slow slip, which could have triggered the 2021 seismic swarm. Despite the apparent association of the December 2020 event with the July–October 2021 swarm, due to their proximity in both space and time, no causal relation could be derived between the two sequences. Subsurface fluids under pressure seem to have played a significant role in the evolution of the 2021 seismic swarm, either causing local stress concentrations or facilitating slip by lowering the effective normal stresses or weakening the faults’ walls through erosion. The rich seismic activity in the conjugate normal fault system below Thiva likely released the accumulated stress in this particular area. However, considering the previous historic records of major M > 6 events in the vicinity, the occurrence of a significant earthquake at the unruptured downdip extension of Kallithea fault or in the seismic gap between Kallithea and Yliki faults cannot be excluded.

Supplementary Materials

The following are available online at https://www.mdpi.com/article/10.3390/app12052630/s1, Excel File S1: Relocated catalogue of the 2020–2021 earthquake sequence in Thiva; Excel File S2: Focal mechanisms determined by first-motion polarities (FMPs); Interactive Matlab Figure S1: 3D model of the 2020–2021 earthquake sequence at Thiva.

Author Contributions

Conceptualization, G.K., P.E., V.S. and I.P.; methodology, G.K., V.K. (Vasilis Kapetanidis), I.S., V.K. (Vasiliki Kouskouna), P.E. and V.S.; software, V.K. (Vasilis Kapetanidis), N.S., P.E., A.K. (Andreas Karakonstantis), A.K. (Andreas Karavias), V.S. and T.G.; validation, G.K., I.S., V.K. (Vasiliki Kouskouna), P.E., I.K., J.D.A., P.P., N.V. and I.P.; investigation, V.K. (Vasilis Kapetanidis), I.S., N.S., A.K. (Andreas Karakonstantis), A.K. (Andreas Karavias) and T.G.; resources, G.K., V.K. (Vasiliki Kouskouna), P.E., V.S., I.K., J.D.A., P.P., N.V. and I.P.; data curation, G.K., V.K. (Vasilis Kapetanidis), I.S., N.S., V.K. (Vasiliki Kouskouna), P.E. and V.S.; writing—original draft preparation, G.K., V.K. (Vasilis Kapetanidis), I.S., N.S., A.K. (Andreas Karakonstantis), V.K. (Vasiliki Kouskouna), P.E., V.S. and I.P.; writing—review and editing, G.K., V.K. (Vasilis Kapetanidis), I.S., N.S., V.K. (Vasiliki Kouskouna), P.E. and V.S.; visualization, V.K. (Vasilis Kapetanidis), P.E., A.K. (Andreas Karavias) and V.S.; supervision, G.K.; project administration, P.P. and N.V.; funding acquisition, G.K. All authors have read and agreed to the published version of the manuscript.

Funding

This research received no external funding.

Institutional Review Board Statement

Not applicable.

Informed Consent Statement

Not applicable.

Data Availability Statement

The initial earthquake catalogues and arrival-time data are available at the database of SL-NKUA (http://www.geophysics.geol.uoa.gr/stations/gmapv3_db/index.php?lang=en; accessed on 31 January 2022) and GI-NOA (http://bbnet.gein.noa.gr/HL/databases/database; accessed on 31 January 2022). The relocated catalogue of this study is available in the Supplementary Material (Excel File S1). Seismological waveform data from permanent and temporary stations of the HUSN are available at the European Integrated Data Archive (EIDA) node hosted at GI-NOA (http://eida.gein.noa.gr/; accessed on 31 January 2022) [56]. Data of the meteorological station at Thiva are operated by the METEO unit at the National Observatory of Athens (https://penteli.meteo.gr/stations/thiva/; accessed on 28 January 2022). The Sentinel-1 SAR SLC images are available on the Copernicus Open Access Hub (https://scihub.copernicus.eu/dhus/#/home; accessed on 28 January 2022) [78]. The digital elevation model was extracted by the NASA’s Shuttle Radar Topography Mission (SRTM) 3 arc-second (90 m/pixel) database (https://srtm.csi.cgiar.org/10; accessed on 10 October 2021) [84]. The GNSS data used in this study are provided by the private sector and are not available.

Acknowledgments

The authors would like to thank the three anonymous reviewers and the academic editor for the constructive and detailed comments that contributed to the improvement of the manuscript. We would like to thank the scientists and personnel who participated in the installation or maintenance of the permanent and temporary stations belonging to the HUSN. Sentinel-1 satellite imagery was acquired through the European Space Agency and Copernicus. We are grateful to Metrica S.A. and TreeComp for kindly sharing their GNSS data and M. Chanioti (sales manager of Inforest Research O.C.) for SARSCAPE s/w availability. We would also like to thank Charalambos Georgiou for the valuable discussions. Most maps and cross sections were drawn with the Generic Mapping Tools (GMT) software [108]. The Coulomb stress transfer model for the 2 December 2020 mainshock was constructed using the Coulomb 3.3 software [70].

Conflicts of Interest

The authors declare no conflict of interest.

Appendix A. Additional Macroseismic Data
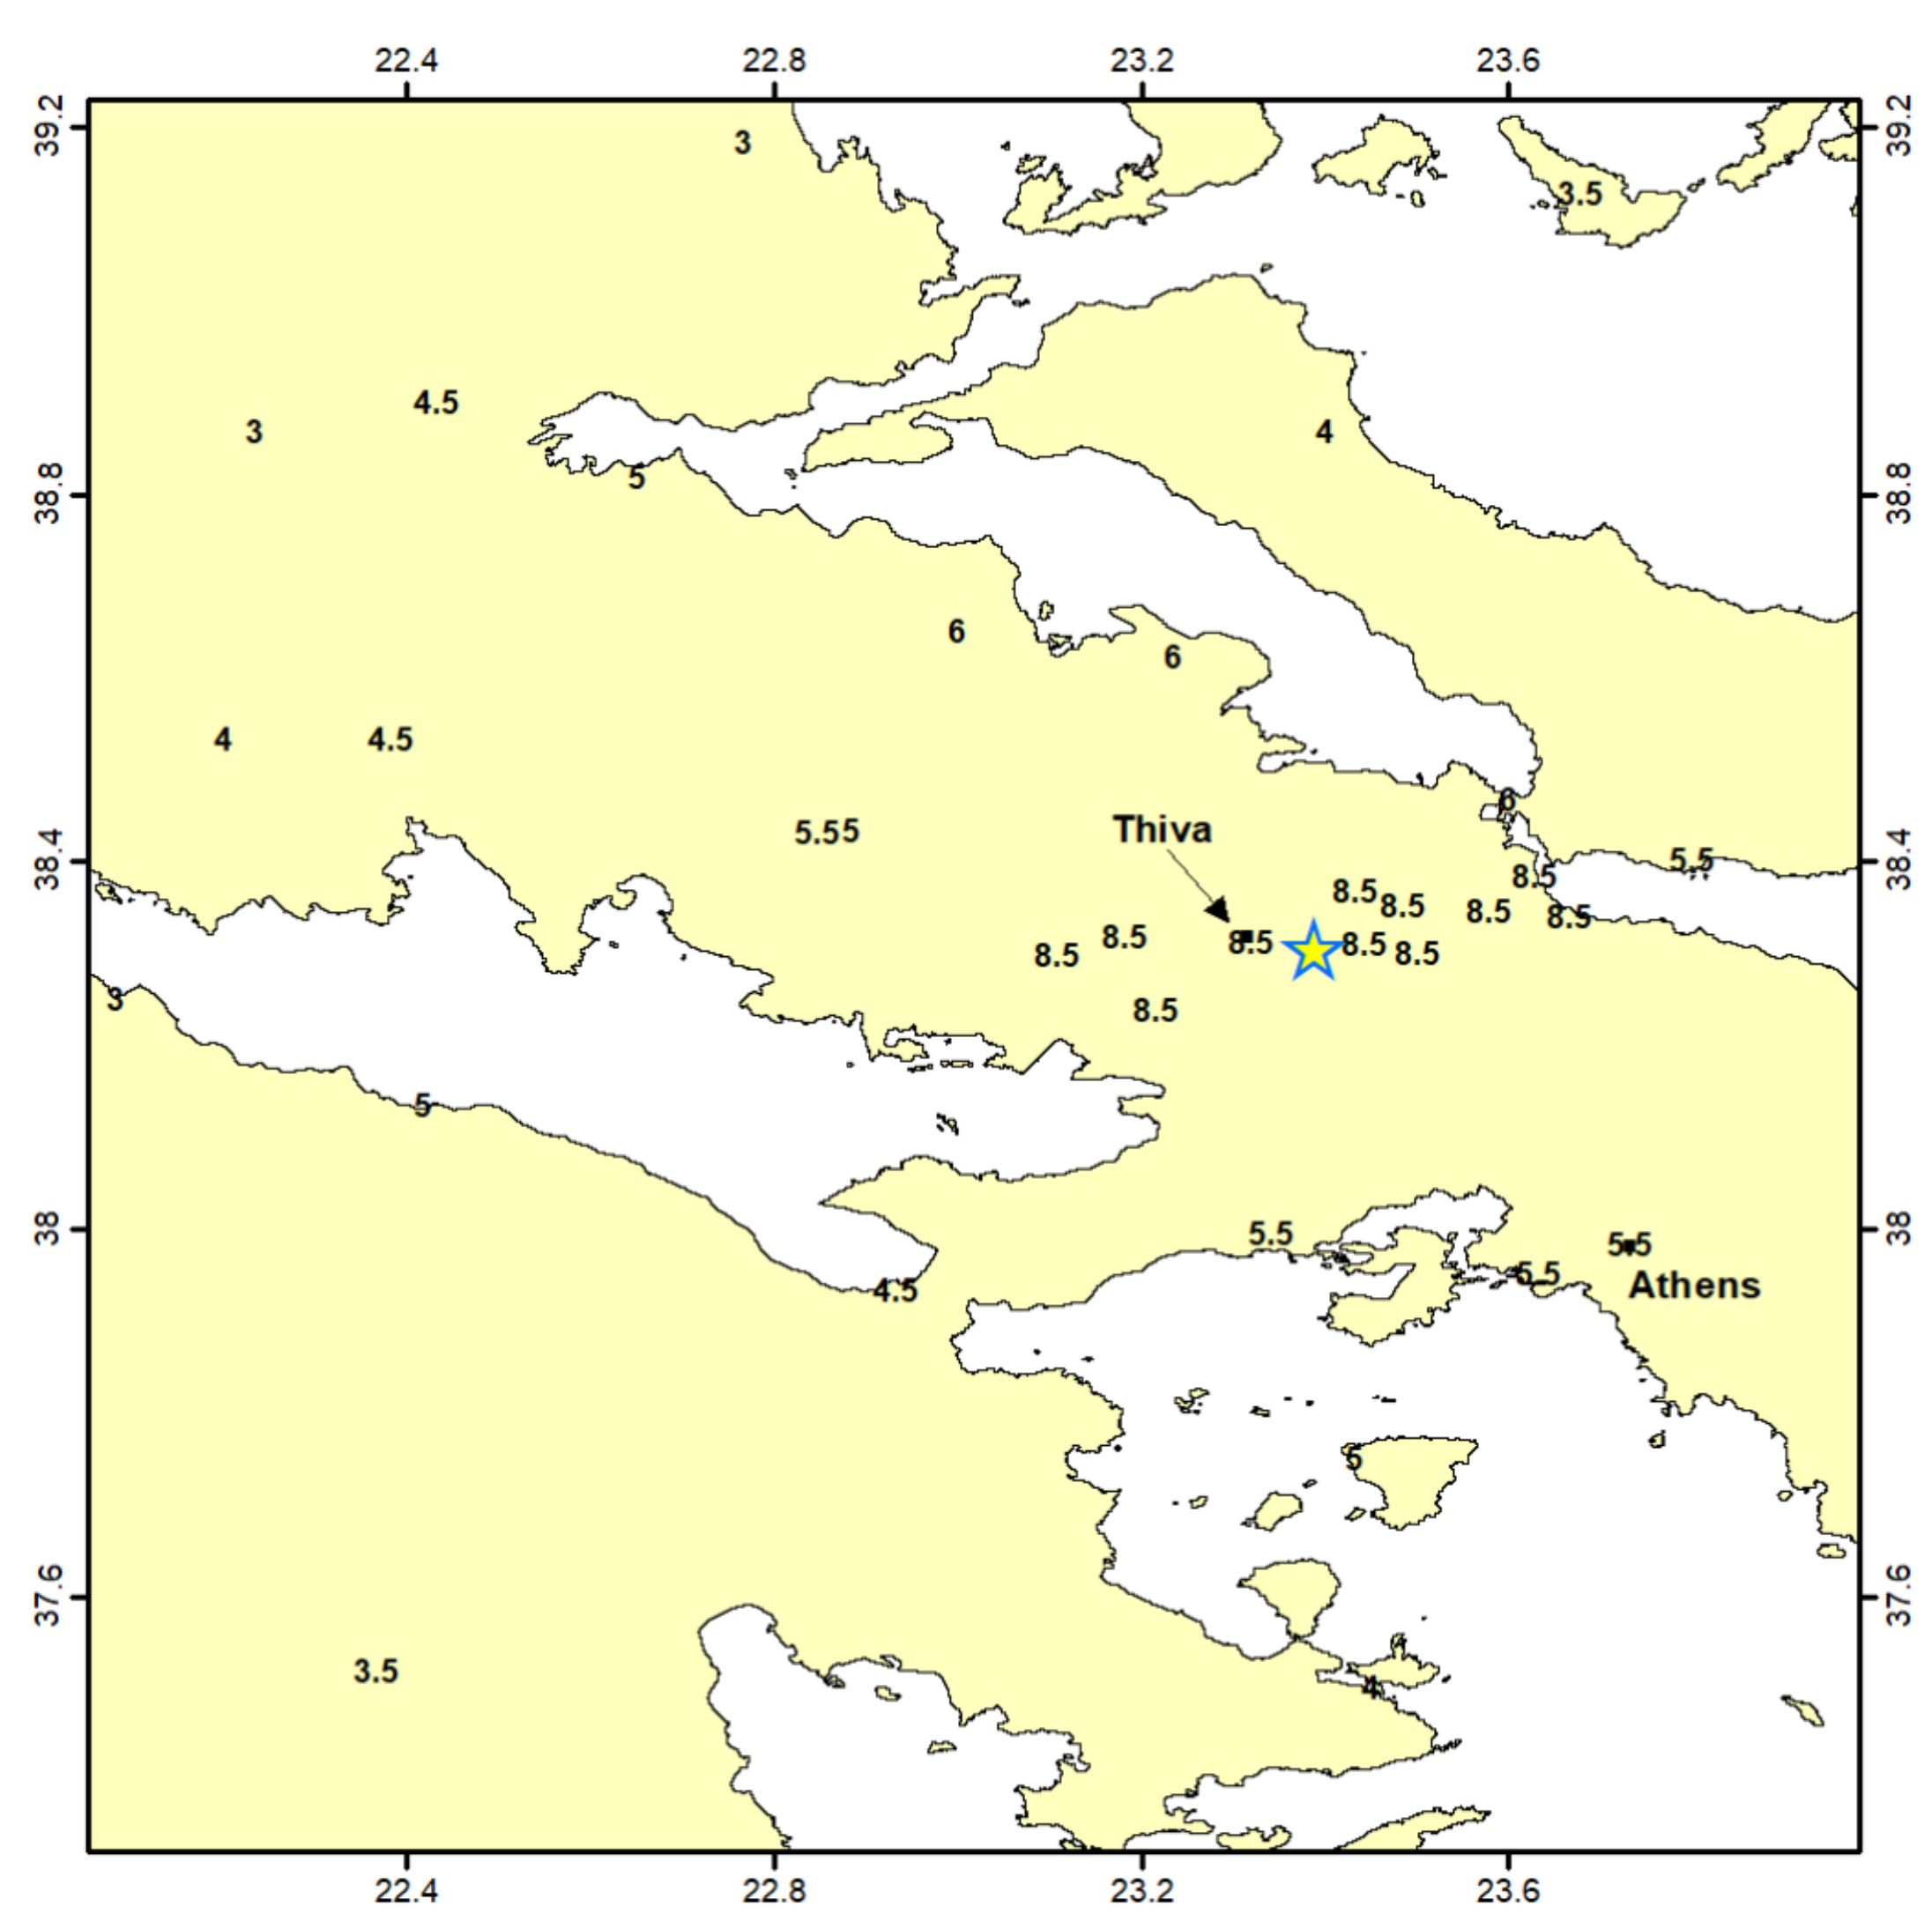
Macroseismic intensity data points (IDPs) were re-evaluated to determine the macroseismic epicenter using the MEEP software [50].
Figure A1. EMS98 intensity data points (IDPs) of the 17 October 1914 earthquake and the calculated macroseismic epicenter (star).
Applsci 12 02630 g0a1

Appendix B. Seismological Methods

Statistics and additional information concerning the seismological data.
Figure A2. Chatelain [64] diagram for the determination of the average ratio Vp/Vs = 1.79 using P and S travel-time data from the 2020–2021 Thiva earthquake sequence.
Applsci 12 02630 g0a2
Figure A3. Histograms of location statistics and uncertainties for the 2020–2021 Thiva earthquake sequence: (a) root mean square (RMS) travel-time residuals, (b) horizontal (ERX, ERY) and vertical (ERZ) formal uncertainties reported by the location algorithm HypoInverse, (c) focal depths from the relocated catalogue with the HypoDD code, (d) azimuthal gap, (e) epicentral distance to the closest station, and (f) number of P- (blue) and S-wave (red) arrival times.
Applsci 12 02630 g0a3
Figure A4. Cumulative number of events with MMc = 1.6 per spatial group, represented by different colors and numbers, for the period between 25 November 2020 and 16 October 2021. The occurrence of events with M ≥ 3.0 is marked with circles with size proportional to magnitude. A close-up of the period between July and 16 October 2021 is presented in Figure 4b.
Applsci 12 02630 g0a4
Figure A5. Gutenberg–Richter law of the 2021 earthquake swarm (groups #2–#12, excluding group #9; Figure 4) with blue dots showing the log10 number N of events with magnitude M > m, whereas red dots show the reverse relation. Open triangles show the number of events with magnitude M in the range m − 0.05 ≤ Mm + 0.05. The straight red line shows the linear fit corresponding to a b-value of 1.072. The magnitude of completeness is Mc = 1.6. The b-value determined from the maximum likelihood method is bMLE = 1.14. The red dashed line is the extension of the linear fit to log10N = 0, with m* = 4.51 the largest expected magnitude according to the modified Bath’s law [109].
Applsci 12 02630 g0a5
Table A1. Focal mechanisms of major events determined by first-motion polarities (FMPs). CLID is the spatial group number. For more details, see Excel File S2 in the Supplementary Material.
Origin TimeLatitude
(°N)
Longitude
(°E)
Depth
(km)
MLStrike1
(°)
Dip1
(°)
Rake1
(°)
CLID
2 December 2020 12:37:37.738.300123.43273.43.3240.246.6−142.61
10 July 2021 12:54:17.738.323323.32769.83.2293.937.1−94.62
20 July 2021 07:36:20.438.323323.325410.02.9298.131.5−50.12
21 July 2021 03:54:53.938.328623.30649.93.1238.338.3−122.62
25 July 2021 19:12:44.138.327323.305510.93.6261.841.2−120.72
29 August 2021 18:15:23.038.294223.493211.83.2317.144.3−48.99
30 August 2021 06:08:12.138.287623.483613.02.9325.767−13.19
2 September 2021 09:03:54.238.322223.333510.93.0248.739.7−125.55
2 September 2021 14:46:15.838.324823.33709.53.3286.934.7−99.76
3 September 2021 05:13:51.638.326023.32638.23.5290.832.9−95.52
10 September 2021 13:51:33.038.321123.34399.63.5287.136.6−117.511
11 September 2021 05:28:16.038.322623.35459.73.5279.335.6−95.411
11 September 2021 09:42:38.838.323323.350310.73.3293.832.5−95.211
11 September 2021 17:45:48.838.322023.342710.63.2278.738.6−110.810
21 September 2021 01:50:54.838.320723.356411.13.2248.542.4−130.511
22 September 2021 01:03:07.738.318723.35749.33.4295.328.9−9311
23 September 2021 19:28:56.238.314523.337611.33.1279.638.6−94.25
28 September 2021 11:41:55.038.318023.344210.33.198.436.6−93.810
29 September 2021 00:20:39.038.317623.343311.32.9238.148−138.210
10 October 2021 05:37:41.138.325223.351310.62.8242.548.7−137.111

Appendix C. Geodetic Methods

Daily data from the continuous GNSS station THIV located in Thiva were processed over a period of 5 years, 2017 to 2021. Time series were produced, and the velocity vector was calculated.
Figure A6. Time series of the three components for the THIV GNSS site. The fit (red line) produced by the software in [110].
Applsci 12 02630 g0a6

References

  1. Papazachos, B.C. Seismicity of the Aegean and surrounding area. Tectonophysics 1990, 178, 287–308. [Google Scholar] [CrossRef]
  2. Armijo, R.; Lyon-Caen, H.; Papanastassiou, D. East-west extension and Holocene normal-fault scarps in the Hellenic arc. Geology 1992, 20, 491–494. [Google Scholar] [CrossRef]
  3. McKenzie, D. Some remarks on the development of sedimentary basins. Earth Planet. Sci. Lett. 1978, 40, 25–32. [Google Scholar] [CrossRef]
  4. Ganas, A.; Parsons, T. Three-dimensional model of hellenic arc deformation and origin of the cretan uplift. J. Geophys. Res. Solid Earth 2009, 114, B06404. [Google Scholar] [CrossRef] [Green Version]
  5. Briole, P.; Ganas, A.; Elias, P.; Dimitrov, D. The GPS velocity field of the Aegean. New observations, contribution of the earthquakes, crustal blocks model. Geophys. J. Int. 2021, 226, 468–492. [Google Scholar] [CrossRef]
  6. Makropoulos, K.; Kaviris, G.; Kouskouna, V. An updated and extended earthquake catalogue for Greece and adjacent areas since 1900. Nat. Hazards Earth Syst. Sci. 2012, 12, 1425–1430. [Google Scholar] [CrossRef] [Green Version]
  7. Kaviris, G.; Elias, P.; Kapetanidis, V.; Serpetsidaki, A.; Karakonstantis, A.; Plicka, V.; De Barros, L.; Sokos, E.; Kassaras, I.; Sakkas, V.; et al. The Western Gulf of Corinth (Greece) 2020–2021 Seismic Crisis and Cascading Events: First Results from the Corinth Rift Laboratory Network. Seism. Rec. 2021, 1, 85–95. [Google Scholar] [CrossRef]
  8. Pacchiani, F.; Lyon-Caen, H. Geometry and spatio-temporal evolution of the 2001 Agios Ioanis earthquake swarm (Corinth Rift, Greece). Geophys. J. Int. 2010, 180, 59–72. [Google Scholar] [CrossRef]
  9. Kapetanidis, V.; Deschamps, A.; Papadimitriou, P.; Matrullo, E.; Karakonstantis, A.; Bozionelos, G.; Kaviris, G.; Serpetsidaki, A.; Lyon-Caen, H.; Voulgaris, N.; et al. The 2013 earthquake swarm in Helike, Greece: Seismic activity at the root of old normal faults. Geophys. J. Int. 2015, 202, 2044–2073. [Google Scholar] [CrossRef] [Green Version]
  10. Kapetanidis, V.; Michas, G.; Kaviris, G.; Vallianatos, F. Spatiotemporal Properties of Seismicity and Variations of Shear-Wave Splitting Parameters in the Western Gulf of Corinth (Greece). Appl. Sci. 2021, 11, 6573. [Google Scholar] [CrossRef]
  11. Kaviris, G.; Spingos, I.; Kapetanidis, V.; Papadimitriou, P.; Voulgaris, N.; Makropoulos, K. Upper crust seismic anisotropy study and temporal variations of shear-wave splitting parameters in the western Gulf of Corinth (Greece) during 2013. Phys. Earth Planet. Inter. 2017, 269, 148–164. [Google Scholar] [CrossRef]
  12. De Barros, L.; Cappa, F.; Deschamps, A.; Dublanchet, P. Imbricated Aseismic Slip and Fluid Diffusion Drive a Seismic Swarm in the Corinth Gulf, Greece. Geophys. Res. Lett. 2020, 47, e2020GL087142. [Google Scholar] [CrossRef]
  13. Kassaras, I.; Kapetanidis, V.; Ganas, A.; Tzanis, A.; Kosma, C.; Karakonstantis, A.; Valkaniotis, S.; Chailas, S.; Kouskouna, V.; Papadimitriou, P. The New Seismotectonic Atlas of Greece (v1.0) and Its Implementation. Geosciences 2020, 10, 447. [Google Scholar] [CrossRef]
  14. Stucchi, M.; Rovida, A.; Gomez Capera, A.A.; Alexandre, P.; Camelbeeck, T.; Demircioglu, M.B.; Gasperini, P.; Kouskouna, V.; Musson, R.M.W.; Radulian, M.; et al. The SHARE European Earthquake Catalogue (SHEEC) 1000–1899. J. Seismol. 2013, 17, 523–544. [Google Scholar] [CrossRef] [Green Version]
  15. Ganas, A.; Oikonomou, I.A.; Tsimi, C. NOAfaults: A digital database for active faults in Greece. Bull. Geol. Soc. Greece 2017, 47, 518. [Google Scholar] [CrossRef] [Green Version]
  16. Ganas, A. NOAFAULTS KMZ layer Version 3.0 (2020 update) (V3.0) [Data set]. Zenodo 2020. [Google Scholar] [CrossRef]
  17. Kiratzi, A. The 12 June 2017 Mw 6.3 Lesvos Island (Aegean Sea) earthquake: Slip model and directivity estimated with finite-fault inversion. Tectonophysics 2018, 724–725, 1–10. [Google Scholar] [CrossRef]
  18. Papadimitriou, P.; Kassaras, I.; Kaviris, G.; Tselentis, G.-A.; Voulgaris, N.; Lekkas, E.; Chouliaras, G.; Evangelidis, C.; Pavlou, K.; Kapetanidis, V.; et al. The 12th June 2017 Mw = 6.3 Lesvos earthquake from detailed seismological observations. J. Geodyn. 2018, 115, 23–42. [Google Scholar] [CrossRef]
  19. Ganas, A.; Elias, P.; Kapetanidis, V.; Valkaniotis, S.; Briole, P.; Kassaras, I.; Argyrakis, P.; Barberopoulou, A.; Moshou, A. The July 20, 2017 M6.6 Kos Earthquake: Seismic and Geodetic Evidence for an Active North-Dipping Normal Fault at the Western End of the Gulf of Gökova (SE Aegean Sea). Pure Appl. Geophys. 2019, 176, 4177–4211. [Google Scholar] [CrossRef]
  20. Triantafyllou, I.; Papadopoulos, G.A.; Lekkas, E. Impact on built and natural environment of the strong earthquakes of 23 April 1933, and 20 July 2017, in the southeast Aegean Sea, eastern Mediterranean. Nat. Hazards 2020, 100, 671–695. [Google Scholar] [CrossRef]
  21. Papadimitriou, P.; Kapetanidis, V.; Karakonstantis, A.; Spingos, I.; Kassaras, I.; Sakkas, V.; Kouskouna, V.; Karatzetzou, A.; Pavlou, K.; Kaviris, G.; et al. First Results on the Mw = 6.9 Samos Earthquake of 30 October 2020. Bull. Geol. Soc. Greece 2020, 56, 251–279. [Google Scholar] [CrossRef]
  22. Karakostas, V.; Tan, O.; Kostoglou, A.; Papadimitriou, E.; Bonatis, P. Seismotectonic implications of the 2020 Samos, Greece, M w 7.0 mainshock based on high-resolution aftershock relocation and source slip model. Acta Geophys. 2021, 69, 979–996. [Google Scholar] [CrossRef]
  23. Kaviris, G.; Spingos, I.; Kapetanidis, V.; Papadimitriou, P.; Voulgaris, N. On the origin of upper crustal shear-wave anisotropy at Samos Island, Greece. Acta Geophys. 2021, 69, 1051–1064. [Google Scholar] [CrossRef]
  24. Ganas, A.; Elias, P.; Briole, P.; Valkaniotis, S.; Escartin, J.; Tsironi, V.; Karasante, I.; Kosma, C. Co-seismic and post-seismic deformation, field observations and fault model of the 30 October 2020 Mw = 7.0 Samos earthquake, Aegean Sea. Acta Geophys. 2021, 69, 999–1024. [Google Scholar] [CrossRef]
  25. Ganas, A.; Valkaniotis, S.; Briole, P.; Serpetsidaki, A.; Kapetanidis, V.; Karasante, I.; Kassaras, I.; Papathanassiou, G.; Karamitros, I.; Tsironi, V.; et al. Domino-style earthquakes along blind normal faults in Northern Thessaly (Greece): Kinematic evidence from field observations, seismology, SAR interferometry and GNSS. Bull. Geol. Soc. Greece 2021, 58, 37. [Google Scholar] [CrossRef]
  26. Karakostas, V.; Papazachos, C.; Papadimitriou, E.; Foumelis, M.; Kiratzi, A.; Pikridas, C.; Kostoglou, A.; Kkallas, C.; Chatzis, N.; Bitharis, S.; et al. The March 2021 Tyrnavos, central Greece, doublet (Μw6.3 and Mw6.0): Aftershock relocation, faulting details, coseismic slip and deformation. Bull. Geol. Soc. Greece 2021, 58, 131. [Google Scholar] [CrossRef]
  27. Lekkas, E.; Agorastos, K.; Mavroulis, S.; Kranis, C.; Skourtsos, E.; Carydis, P.; Gogou, M.; Katsetsiadou, K.-N.; Papadopoulos, G.; Triantafyllou, I.; et al. The Early March 2021 THESSALY Earthquake Sequence. 2021, pp. 1–195. Available online: https://edcm.edu.gr/images/docs/newsletters/Newsletter_22_2021-Thessaly-EQs.pdf (accessed on 28 January 2022).
  28. Papadopoulos, G.A.; Agalos, A.; Karavias, A.; Triantafyllou, I.; Parcharidis, I.; Lekkas, E. Seismic and Geodetic Imaging (DInSAR) Investigation of the March 2021 Strong Earthquake Sequence in Thessaly, Central Greece. Geosciences 2021, 11, 311. [Google Scholar] [CrossRef]
  29. Vallianatos, F.; Michas, G.; Hloupis, G. Seismicity Patterns Prior to the Thessaly (Mw6.3) Strong Earthquake on 3 March 2021 in Terms of Multiresolution Wavelets and Natural Time Analysis. Geosciences 2021, 11, 379. [Google Scholar] [CrossRef]
  30. Kassaras, I.; Kapetanidis, V.; Ganas, A.; Karakonstantis, A.; Papadimitriou, P.; Kaviris, G.; Kouskouna, V.; Voulgaris, N. Seismotectonic analysis of the 2021 Damasi-Tyrnavos (Thessaly, Central Greece) earthquake sequence and implications on the stress field rotations. J. Geodyn. 2022, 150, 101898. [Google Scholar] [CrossRef]
  31. Vallianatos, F.; Michas, G.; Hloupis, G.; Chatzopoulos, G. The Evolution of Preseismic Patterns Related to the Central Crete (Mw6.0) Strong Earthquake on 27 September 2021 Revealed by Multiresolution Wavelets and Natural Time Analysis. Geosciences 2022, 12, 33. [Google Scholar] [CrossRef]
  32. Vassilakis, E.; Kaviris, G.; Kapetanidis, V.; Papageorgiou, E.; Foumelis, M.; Konsolaki, A.; Petrakis, S.; Evangelidis, C.; Alexopoulos, J.; Karastathis, V.; et al. The 27 September 2021, earthquake in central Crete (Greece). Detailed analysis of the earthquake sequence and indications for contemporary arc-parallel extension at the Hellenic arc. Appl. Sci. 2022. submitted. [Google Scholar]
  33. Sboras, S.; Ganas, A.; Pavlides, S. Morphotectonic Analysis of the Neotectonic and Active Faults of Beotia (Central Greece), Using, G.I.S. Techniques. Bull. Geol. Soc. Greece 2017, 43, 1607–1618. [Google Scholar] [CrossRef] [Green Version]
  34. Goldsworthy, M.; Jackson, J.; Haines, J. The continuity of active fault systems in Greece. Geophys. J. Int. 2002, 148, 596–618. [Google Scholar] [CrossRef] [Green Version]
  35. Tsodoulos, I.M.; Koukouvelas, I.K.; Pavlides, S. Tectonic geomorphology of the easternmost extension of the Gulf of Corinth (Beotia, Central Greece). Tectonophysics 2008, 453, 211–232. [Google Scholar] [CrossRef]
  36. Elias, P.; Spingos, I.; Kaviris, G.; Karavias, A.; Gatsios, T.; Sakkas, V.; Parcharidis, I. Combined Geodetic and Seismological Study of the December 2020 Mw = 4.6 Thiva (Central Greece) Shallow Earthquake. Appl. Sci. 2021, 11, 5947. [Google Scholar] [CrossRef]
  37. Stewart, I.S.; Piccardi, L. Seismic faults and sacred sanctuaries in Aegean antiquity. Proc. Geol. Assoc. 2017, 128, 711–721. [Google Scholar] [CrossRef]
  38. Nur, A.; Cline, E.H. Poseidon’s Horses: Plate Tectonics and Earthquake Storms in the Late Bronze Age Aegean and Eastern Mediterranean. J. Archaeol. Sci. 2000, 27, 43–63. [Google Scholar] [CrossRef]
  39. Ambraseys, N. Earthquakes in the Mediterranean and Middle East; Cambridge University Press: New York, NY, USA, 2009. [Google Scholar]
  40. Eginitis, D. Le tremblement de terre de Thèbes du 17 Octobre 1914. Ann. L’observatoire Natl. D’athènes 1916, 7, 23–26. [Google Scholar]
  41. Schmidt, J.F. Studien über Erdbeben; Alwin Georgi: Leipzig, Germany, 1879; 360p. [Google Scholar]
  42. Ambraseys, N.N.; Jackson, J.A. Seismicity and associated strain of central Greece between 1890 and 1988. Geophys. J. Int. 1990, 101, 663–708. [Google Scholar] [CrossRef] [Green Version]
  43. Papazachos, B.C.; Papazachou, C. The Earthquakes of Greece; Ziti Publications: Thessaloniki, Greek, 2003. [Google Scholar]
  44. Goulandris, E. Sur le tremblement de terre de Thèbes du 17 Octobre 1914. Ann. L’observatoire Natl. D’athènes 1916, 7, 47–50. [Google Scholar]
  45. Galanopoulos, A.G. A catalogue of Shocks with I0 ≥ VI or M ≥ 5 for the Years 1801–1958; Seismological Laboratory, Athens University: Athens, Greece, 1960; p. 119. [Google Scholar]
  46. Kárnik, V. Seismicity of the European Area, Part 1; Reidel, D., Ed.; Springer Science & Business Media: Berlin, Germany, 1969. [Google Scholar]
  47. Shebalin, N.V.; Kárnik, V.; Hadzievski, D. Catalogue of earthquakes of the Balkan region. In Part I, UNDP-UNESCO Survey of the Seismicity of the Balkan Region; UNESCO: Skopje, North Macedonia, 1974. [Google Scholar]
  48. Kouskouna, V. Updating the macroseismic intensity database of 19th century damaging earthquakes in Greece: A case study in Samos Island. Acta Geophys. 2021, 69, 1101–1111. [Google Scholar] [CrossRef]
  49. Grunthal, G. European MakroseismicScale 1998, EMS-98; European Seismological Commission: Luxembourg, 1998. [Google Scholar]
  50. Musson, R.M.W.; Jimenéz, M.J. Macroseismic Estimation of Earthquake Parameters. NA4 Deliverable D3, NERIES Project. 2008. Available online: http://emidius.mi.ingv.it/neries_NA4/docs/NA4_D3.pdf (accessed on 28 January 2022).
  51. Kouskouna, V.; Kaperdas, V.; Sakellariou, N. Comparing calibration coefficients constrained from early to recent macroseismic and instrumental earthquake data in Greece and applied to eighteenth century earthquakes. J. Seismol. 2020, 24, 293–317. [Google Scholar] [CrossRef]
  52. Gasperini, P.; Bernardini, F.; Valensise, G.; Boschi, E. Defining seismogenic sources from historical earthquake reports. Bull. Seismol. Soc. Am. 1999, 89, 94–110. [Google Scholar]
  53. Bakun, W.H.; Wentworth, C.M. Estimating earthquake location and magnitude from seismic intensity data. Bull. Seismol. Soc. Am. 1997, 87, 1502–1521. [Google Scholar]
  54. Shumila, V.I. Algorithms of macroseismic intensity field interpretation with application to Vrancea region. In Proceedings of the 24th ESC General Assembly, Athina, Greece, 19–24 September 1994; p. 133. [Google Scholar]
  55. Bakun, W.H.; Scotti, O. Regional intensity attenuation models for France and the estimation of magnitude and location of historical earthquakes. Geophys. J. Int. 2006, 164, 596–610. [Google Scholar] [CrossRef] [Green Version]
  56. Evangelidis, C.P.; Triantafyllis, N.; Samios, M.; Boukouras, K.; Kontakos, K.; Ktenidou, O.-J.; Fountoulakis, I.; Kalogeras, I.; Melis, N.S.; Galanis, O.; et al. Seismic Waveform Data from Greece and Cyprus: Integration, Archival, and Open Access. Seismol. Res. Lett. 2021, 92, 1672–1684. [Google Scholar] [CrossRef]
  57. Klein, F.W. User’s Guide to HYPOINVERSE-2000: A Fortran Program to Solve for Earthquake Locations and Magnitudes, Open-File Rep. 2002-171; U.S. Geological Survey: Reston, VA, USA, 2002. [Google Scholar] [CrossRef] [Green Version]
  58. Kaviris, G.; Papadimitriou, P.; Makropoulos, K. Magnitude Scales in Central Greece. Bull. Geol. Soc. Greece 2007, 40, 1114–1124. [Google Scholar] [CrossRef] [Green Version]
  59. Papadimitriou, P.; Kaviris, G.; Makropoulos, K. Evidence of shear-wave splitting in the eastern Corinthian Gulf (Greece). Phys. Earth Planet. Inter. 1999, 114, 3–13. [Google Scholar] [CrossRef]
  60. Papadimitriou, P.; Kaviris, G.; Karakonstantis, A.; Makropoulos, K. The Cornet seismological network: 10 years of operation, recorded seismicity and significant applications. Ann. Geol Des Pays Hell. 2010, 45, 193–208. [Google Scholar]
  61. Kaviris, G. Study of Seismic Source Properties of the Eastern Gulf of Corinth. Ph.D. Thesis, Geophysics-Geothermics Department, Faculty of Geology, University of Athens, Athens, Greece, 2003. (In Greek). [Google Scholar]
  62. Karakonstantis, A. 3-D Simulation of Crust and Upper Mantle Structure in the Broader Hellenic Area through Seismic Tomography. Ph.D. Thesis, Department of Geophysics-Geothermics, Faculty of Geology, University of Athens, Athens, Greece, 2017. (In Greek). [Google Scholar]
  63. D’Ajello Caracciolo, F.; Console, R. Earthquake location in tectonic structures of the Alpine Chain: The case of the Constance Lake (Central Europe) seismic sequence. Acta Geophys. 2021, 69, 1163–1175. [Google Scholar] [CrossRef]
  64. Chatelain, J.L. Etude fine de la Sismicité en Zone de Collision Continentale au Moyen d’un Réseau de Stations Portables: La région Hindu-Kush Pamir, Thèse de 3eme Cycle; Université de Grenoble: Saint-Martin-d’Hères, France, 1978; p. 219. [Google Scholar]
  65. Woessner, J.; Wiemer, S. Assessing the quality of earthquake catalogues: Estimating the magnitude of completeness and its uncertainty. Bull. Seismol. Soc. Am. 2005, 95, 684–698. [Google Scholar] [CrossRef]
  66. Waldhauser, F. hypoDD—A Program to Compute Double-Difference Hypocenter Locations. U.S. Geological Survey Open-File Report 01-113. 2001. Available online: https://pubs.usgs.gov/of/2001/0113/ (accessed on 28 January 2022). [CrossRef]
  67. Kapetanidis, V. Spatiotemporal Patterns of Microseismicity for the Identification of Active Fault Structures Using Seismic Waveform Cross-Correlation and Double-Difference Relocation. Ph.D. Thesis, Department of Geophysics-Geothermics, Faculty of Geology and Geoenvironment, University of Athens, Athens, Greece, 2017. [Google Scholar]
  68. Shapiro, S.A.; Huenges, E.; Borm, G. Estimating the crust permeability from fluid-injection-induced seismic emission at the KTB site. Geophys. J. Int. 1997, 131, F15–F18. [Google Scholar] [CrossRef]
  69. Kagan, Y.Y. 3-D rotation of double-couple earthquake sources. Geophys. J. Int. 1991, 106, 709–716. [Google Scholar] [CrossRef]
  70. Toda, S.; Stein, R.S.; Sevilgen, V.; Lin, J. Coulomb 3.3 Graphic-Rich Deformation and Stress-Change Software for Earthquake, Tectonic, and Volcano Research and Teaching-User Guide. U.S. Geological Survey Open-File Report 2011–1060. 2011. Available online: http://pubs.usgs.gov/of/2011/1060/ (accessed on 28 January 2022). [CrossRef]
  71. Kapetanidis, V.; Kassaras, I. Contemporary crustal stress of the Greek region deduced from earthquake focal mechanisms. J. Geodyn. 2019, 123, 55–82. [Google Scholar] [CrossRef]
  72. Briole, P.; Elias, P.; Parcharidis, I.; Bignami, C.; Benekos, G.; Samsonov, G.; Kyriakopoulos, C.; Stramondo, S.; Chamot-Rooke, N.; Drakatou, M.L.; et al. The seismic sequence of January-February 2014 at Cephalonia Island (Greece): Constraints from SAR interferometry and GPS. Geophys. J. Int. 2015, 203, 1528–1540. [Google Scholar] [CrossRef] [Green Version]
  73. Ganas, A.; Elias, P.; Bozionelos, G.; Papathanassiou, G.; Avallone, A.; Papastergios, A.; Valkaniotis, S.; Parcharidis, I.; Briole, P. Coseismic deformation, field observations and seismic fault of the 17 November 2015 M = 6.5, Lefkada Island, Greece earthquake. Tectonophysics 2016, 687, 210–222. [Google Scholar] [CrossRef]
  74. Elias, P.; Briole, P. Ground Deformations in the Corinth Rift, Greece, Investigated Through the Means of SAR Multitemporal Interferometry. Geochemistry, Geophys. Geosystems 2018, 19, 4836–4857. [Google Scholar] [CrossRef] [Green Version]
  75. Gatsios, T.; Cigna, F.; Tapete, D.; Sakkas, V.; Pavlou, K.; Parcharidis, I. Copernicus sentinel-1 MT-InSAR, GNSS and seismic monitoring of deformation patterns and trends at the methana volcano, Greece. Appl. Sci. 2020, 10, 6445. [Google Scholar] [CrossRef]
  76. Chousianitis, K.; Papanikolaou, X.; Drakatos, G.; Tselentis, G.-A. NOANET: A Continuously Operating GNSS Network for Solid-Earth Sciences in Greece. Seismol. Res. Lett. 2021, 92, 2050–2064. [Google Scholar] [CrossRef]
  77. Sakkas, V. Ground Deformation Modelling of the 2020 Mw6.9 Samos Earthquake (Greece) Based on InSAR and GNSS Data. Remote Sens. 2021, 13, 1665. [Google Scholar] [CrossRef]
  78. Copernicus Open Access Hub. Available online: https://scihub.copernicus.eu/dhus/#/home (accessed on 28 January 2022).
  79. METRICA. Available online: https://metrica.gr/ (accessed on 28 January 2022).
  80. URANUS Powered by TREE COMPANY. Available online: https://uranus.gr/ (accessed on 28 January 2022).
  81. Dach, R.; Lutz, S.; Walser, P.; Fridez, P. Bernese GNSS Software Version 5.2; User manual; Astronomical Institute, University of Bern, Bern Open Publishing: Bern, Switzerland, 2015. [Google Scholar]
  82. Chousianitis, K.; Ganas, A.; Evangelidis, C.P. Strain and rotation rate patterns of mainland Greece from continuous GPS data and comparison between seismic and geodetic moment release. J. Geophys. Res. Solid Earth 2015, 120, 3909–3931. [Google Scholar] [CrossRef]
  83. Lagouvardos, K.; Kotroni, V.; Bezes, A.; Koletsis, I.; Kopania, T.; Lykoudis, S.; Mazarakis, N.; Papagiannaki, K.; Vougioukas, S. The automatic weather stations NOANN network of the National Observatory of Athens: Operation and database. Geosci. Data J. 2017, 4, 4–16. [Google Scholar] [CrossRef]
  84. SRTM Data. Available online: https://srtm.csi.cgiar.org/10 (accessed on 28 January 2022).
  85. Berardino, P.; Fornaro, G.; Lanari, R.; Sansosti, E. A new algorithm for surface deformation monitoring based on small baseline differential SAR interferograms. IEEE Trans. Geosci. Remote Sens. 2002, 40, 2375–2383. [Google Scholar] [CrossRef] [Green Version]
  86. Costantini, M. A novel phase unwrapping method based on network programming. IEEE Trans. Geosci. Remote Sens. 1998, 36, 813–821. [Google Scholar] [CrossRef]
  87. Fielding, E.J.; Simons, M.; Owen, S.; Lundgren, P.; Hua, H.; Agram, P.; Liu, Z.; Moore, A.; Milillo, P.; Polet, J.; et al. Rapid Imaging of Earthquake Ruptures with Combined Geodetic and Seismic Analysis. Procedia Technol. 2014, 16, 876–885. [Google Scholar] [CrossRef]
  88. Causse, M.; Cornou, C.; Maufroy, E.; Grasso, J.-R.; Baillet, L.; El Haber, E. Exceptional ground motion during the shallow Mw 4.9 2019 Le Teil earthquake, France. Commun. Earth Environ. 2021, 2, 14. [Google Scholar] [CrossRef]
  89. Champenois, J.; Baize, S.; Vallee, M.; Jomard, H.; Alvarado, A.; Espin, P.; Ekström, G.; Audin, L. Evidences of Surface Rupture Associated With a Low-Magnitude (M w 5.0) Shallow Earthquake in the Ecuadorian Andes. J. Geophys. Res. Solid Earth 2017, 122, 8446–8458. [Google Scholar] [CrossRef]
  90. Stein, R.S. The role of stress transfer in earthquake occurrence. Nature 1999, 402, 605–609. [Google Scholar] [CrossRef]
  91. Cheloni, D.; D’Agostino, N.; Selvaggi, G.; Avallone, A.; Fornaro, G.; Giuliani, R.; Reale, D.; Sansosti, E.; Tizzani, P. Aseismic transient during the 2010-2014 seismic swarm: Evidence for longer recurrence of M ≥ 6.5 earthquakes in the Pollino gap (Southern Italy)? Sci. Rep. 2017, 7, 576. [Google Scholar] [CrossRef] [Green Version]
  92. Tiwari, D.K.; Jha, B.; Kundu, B.; Gahalaut, V.K.; Vissa, N.K. Groundwater extraction-induced seismicity around Delhi region, India. Sci. Rep. 2021, 11, 10097. [Google Scholar] [CrossRef]
  93. King, N.E.; Argus, D.; Langbein, J.; Agnew, D.C.; Bawden, G.; Dollar, R.S.; Liu, Z.; Galloway, D.; Reichard, E.; Yong, A.; et al. Space geodetic observation of expansion of the San Gabriel Valley, California, aquifer system, during heavy rainfall in winter 2004–2005. J. Geophys. Res. Solid Earth 2007, 112, B03409. [Google Scholar] [CrossRef]
  94. Duverger, C.; Lambotte, S.; Bernard, P.; Lyon-Caen, H.; Deschamps, A.; Nercessian, A. Dynamics of microseismicity and its relationship with the active structures in the western Corinth Rift (Greece). Geophys. J. Int. 2018, 215, 196–221. [Google Scholar] [CrossRef]
  95. Mesimeri, M.; Karakostas, V. Repeating earthquakes in western Corinth Gulf (Greece): Implications for aseismic slip near locked faults. Geophys. J. Int. 2018, 215, 659–676. [Google Scholar] [CrossRef]
  96. Massin, F.; Farrell, J.; Smith, R.B. Repeating earthquakes in the Yellowstone volcanic field: Implications for rupture dynamics, ground deformation, and migration in earthquake swarms. J. Volcanol. Geotherm. Res. 2013, 257, 159–173. [Google Scholar] [CrossRef]
  97. Fischer, T.; Horálek, J.; Hrubcová, P.; Vavryčuk, V.; Bräuer, K.; Kämpf, H. Intra-continental earthquake swarms in West-Bohemia and Vogtland: A review. Tectonophysics 2014, 611, 1–27. [Google Scholar] [CrossRef]
  98. Bourouis, S.; Bernard, P. Evidence for coupled seismic and aseismic fault slip during water injection in the geothermal site of Soultz (France), and implications for seismogenic transients. Geophys. J. Int. 2007, 169, 723–732. [Google Scholar] [CrossRef] [Green Version]
  99. Bourouis, S.; Cornet, F.H. Microseismic activity and fluid fault interactions: Some results from the Corinth Rift Laboratory (CRL), Greece. Geophys. J. Int. 2009, 178, 561–580. [Google Scholar] [CrossRef] [Green Version]
  100. Kassaras, I.; Kapetanidis, V.; Karakonstantis, A.; Kouskouna, V.; Ganas, A.; Chouliaras, G.; Drakatos, G.; Moshou, A.; Mitropoulou, V.; Argyrakis, P.; et al. Constraints on the dynamics and spatio-temporal evolution of the 2011 Oichalia seismic swarm (SW Peloponnesus, Greece). Tectonophysics 2014, 614, 100–127. [Google Scholar] [CrossRef]
  101. Kraft, T.; Wassermann, J.; Schmedes, E.; Igel, H. Meteorological triggering of earthquake swarms at Mt. Hochstaufen, SE-Germany. Tectonophysics 2006, 424, 245–258. [Google Scholar] [CrossRef]
  102. Leclère, H.; Fabbri, O.; Daniel, G.; Cappa, F. Reactivation of a strike-slip fault by fluid overpressuring in the southwestern French-Italian Alps. Geophys. J. Int. 2012, 189, 29–37. [Google Scholar] [CrossRef] [Green Version]
  103. Halpaap, F.; Rondenay, S.; Perrin, A.; Goes, S.; Ottemöller, L.; Austrheim, H.; Shaw, R.; Eeken, T. Earthquakes track subduction fluids from slab source to mantle wedge sink. Sci. Adv. 2019, 5, eaav7369. [Google Scholar] [CrossRef] [PubMed] [Green Version]
  104. Hainzl, S. Seismicity patterns of earthquake swarms due to fluid intrusion and stress triggering. Geophys. J. Int. 2004, 159, 1090–1096. [Google Scholar] [CrossRef]
  105. Aoyama, H.; Takeo, M.; Ide, S. Evolution mechanisms of an earthquake swarm under the Hida Mountains, central Japan, in 1998. J. Geophys. Res. 2002, 107, 2174. [Google Scholar] [CrossRef]
  106. Vavryčuk, V.; Hrubcová, P. Seismological evidence of fault weakening due to erosion by fluids from observations of intraplate earthquake swarms. J. Geophys. Res. Solid Earth 2017, 122, 3701–3718. [Google Scholar] [CrossRef]
  107. Caputo, R.; Chatzipetros, A.; Pavlides, S.; Sboras, S. The greek database of seismogenic sources (GreDaSS): State-of-the-art for northern greece. Ann. Geophys. 2012, 55, 859–894. [Google Scholar] [CrossRef]
  108. Wessel, P.; Smith, W.H.F. New, improved version of generic mapping tools released. Eos. Trans. Am. Geophys. Union 1998, 79, 579. [Google Scholar] [CrossRef]
  109. Shcherbakov, R.; Turcotte, D.L. A modified form of Båth’s law. Bull. Seismol. Soc. Am. 2004, 94, 1968–1975. [Google Scholar] [CrossRef]
  110. Wu, D.; Yan, H.; Shen, Y. TSAnalyzer, a GNSS Time Series Analysis Software. GPS Solut. 2017, 21, 1389–1394. [Google Scholar] [CrossRef]
Figure 1. Seismotectonic map of part of Central Greece showcasing Thiva (Boeotia) and the Corinth and Euboekos gulfs. The study area is marked by the blue rectangle. Focal mechanisms of significant earthquakes obtained from the catalogue of the Seismological Laboratory of the National and Kapodistrian University of Athens (SL-NKUA) and the compilation in [13] are shown, along with the locations of seismological stations of the Hellenic Unified Seismic Network (HUSN; red triangles) and GNSS stations (inverse yellow triangles). Green stars indicate epicenters whose parameters were estimated through macroseismic data in the present study. Yellow stars are epicenters of events adopted by the SHEEC catalogue [14]. Faults, after [15,16], are also shown (black lines). Inset: Greece and its main geotectonic features. The area of the larger map is marked by a red rectangle. NAT: North Aegean Trough; NAF: North Anatolian Fault.
Applsci 12 02630 g001
Figure 2. Seismic histories of the area (a) between 1893–1934 and (b) 1915 in terms of EMS98 (macroseismic scale). The red rectangle in panel (a) marks the window presented in panel (b).
Applsci 12 02630 g002
Figure 3. Seismicity in the area of Thiva between 25 November 2020 and 16 October 2021. (a) Initial locations with HypoInverse and (b) after double-difference relocation with HypoDD. Fault lines are from [35] and the NOAfaults database [15,16]. Local seismological and GNSS stations are marked with red triangles and a yellow inverted triangle, respectively.
Applsci 12 02630 g003
Figure 4. (a) Map of relocated epicenters with different colors and numbers representing the 12 spatial groups to which the sequence was divided. Events with M ≥ 3.5 are depicted as stars. The profile line A–B is used for the spatiotemporal projection of Figure 5. (b) Cumulative number of events with MMc = 1.6 per spatial group represented by different colors and numbers (at the right end of each curve) for the period between July and 16 October 2021. The occurrence of events with M ≥ 3.0 is marked with circles with size proportional to magnitude. Major events related to outbreaks at certain groups are labeled with their date and largest event magnitude. Group #1 is presented in an alternate version of this plot in Figure A4, covering the entire study period, starting 25 November 2020.
Applsci 12 02630 g004
Figure 5. Spatiotemporal projection of relocated epicenters along the N 110° E-oriented profile A–B in Figure 4a for the period between 9 July and 16 October 2021, with colors and numbers corresponding to different spatial groups. Events with M ≥ 3.5 are depicted as stars. The red lines indicate possible fluid-driven seismicity triggering fronts with a hydraulic diffusivity of 0.20 m2/s (dashed line) or 0.25 m2/s (solid line). The dashed blue line is drawn for reference, representing a seismicity migration speed of 70 m/day towards ESE.
Applsci 12 02630 g005
Figure 6. Map of relocated epicenters of the 2020–2021 Thiva earthquake sequence and focal mechanisms of the major events. The labeled (a1–a2 to h1–h2) dashed rectangles indicate the boundaries and orientation (N 200° E) of the respective cross sections of Figure 7. The red dashed line is the proposed eastward extension of the Yliki fault.
Applsci 12 02630 g006
Figure 7. Vertical cross sections drawn in a N 200° E direction along the profiles in Figure 6. Dashed lines at depth are inferred planes from the distribution of relocated hypocenters, whereas dashed lines at the top indicate the planes of known faults on the surface, that is, the eastward extension of Yliki fault (red dashed line in Figure 6) and Kallithea fault. See also Interactive Matlab Figure S1 in the Supplementary Material for a 3D model of the earthquake sequence and the activated structures.
Applsci 12 02630 g007
Figure 8. Coulomb stress transfer due to the 2 December 2020 mainshock at Kallithea (yellow star with red outline), following the fault model in [36], marked with a red rectangle, for normal faults optimally oriented to the regional stress field, at different depths Z: (a) Z = 0 km, (b) Z = 3 km, (c) Z = 5 km, and (d) Z = 8 km. Gray circles represent the relocated epicenters of the 2020–2021 Thiva seismic sequence, with the white star with blue outline marking the location of the 11 July 2021 Mw = 4.2 event. The dashed line shows the trace of the fault plane (extended downdip) at the depth of the respective horizontal slice. Black lines are fault traces after [35], the NOAfaults database [15,16], and the eastward extension of Yliki fault (Figure 6, dashed red line).
Applsci 12 02630 g008
Figure 9. Two-month moving average time series of the vertical component of the THIV GNSS station (black) temporally shifted by 3 months towards the past and detrended accumulated rainfall time series (orange) after removal of its linear regression. The origin times of the Mw > 4.0 earthquakes are depicted with dashed red lines.
Applsci 12 02630 g009
Figure 10. (Map) Vertical cumulative displacement inferred by the SBAS method. The relocated epicenter of the 2 December 2020 earthquake is presented with a white star, while black stars depict the relocated epicenters of major events (M ≥ 3.5) of the 2021 seismic swarm. Faults (dashed black lines) after NOAFAULTS [15,16] as Sr: Soros; Ka: Kallithea; K8: Kallithea 8. (Lower-right inset panel) Diagram of the cumulated vertical SBAS time series for 12 points distributed over the study area (red dots with numbers on the map). Red vertical lines mark the origin time of the major events (Mw > 4) of the 2020–2021 sequence, also marked on the map as follows: a: 2 December 2020; b, including b1: 11 July 2021 and b2: 20 July 2021; and c: 2 September 2021. The reference point for both the displacement and the inset time series is the GNSS Station THIV (black triangle).
Applsci 12 02630 g010
Table 1. Estimated macroseismic parameters in comparison with previous studies for the four damaging earthquakes in Thiva (Figure 1, green stars). I0: epicentral intensity; φ: latitude of estimated epicenter; λ: longitude of estimated epicenter; Uepi: epicentral uncertainty; Mw: equivalent moment magnitude (macroseismic); D: focal depth; IDPs: number of intensity data points.
SourceDate
(yyyy/mm/dd)
I0φ (°N)λ (°E)Uepi (km)MwD (km)IDPs
This study1853/08/18938.34723.2618.56.2 ± 0.1-41
[14]9–1038.31923.317206.7 ± 0.3-8
This study1893/05/23938.30623.2755.76.2 ± 0.3513
[14]838.31023.25056.2 ± 0.3--
This study1914/10/178–938.30623.3886.76.0 ± 0.18 ± 162
[6]-38.2023.50-5.98-
This study1917/09/237–838.31923.3170.04.523
[47]738.20023.500334.541
Publisher’s Note: MDPI stays neutral with regard to jurisdictional claims in published maps and institutional affiliations.