Article

Study on Shear Performance of Short Bolt Interface in ECC–Steel Bridge Deck Composite Structure

School of Civil Engineering, Changsha University of Science & Technology, Changsha 410114, China
*
Author to whom correspondence should be addressed.
Appl. Sci. 2022, 12(5), 2685; https://doi.org/10.3390/app12052685
Submission received: 21 January 2022 / Revised: 28 February 2022 / Accepted: 2 March 2022 / Published: 4 March 2022
(This article belongs to the Topic Fiber-Reinforced Cementitious Composites)

Abstract

:
Aiming at the problem that orthotropic steel bridge deck and bridge deck pavement are prone to fatigue damage, Engineered Cementitious Composites (ECC) bridge deck pavement is used to replace concrete or asphalt in flexible bridge deck pavement. In order to deeply explore the shear resistance of the short stud interface in the ECC–steel composite structure and provide theoretical support for the practical application of the project, 16 static push-out tests were completed. The effects of stud diameter, height and arrangement spacing on the shear capacity of the medium and short ECC studs were studied. The failure modes, load–slip curves, load–strain curves and interface gap width curves of the components were analyzed. The test results showed that the shear force of the medium and short ECC bolts mainly produces two failure modes, bolt shearing and bolt root weld shearing, while the ECC plate has a local crushing area at the interface bolt root position, and no large cracks occur in other areas. The shear capacity of short bolts is significantly affected by the diameter of the bolts, but is less affected by the height and spacing of the bolts, and increases with the diameter of the short bolts. The length of the stud has an important influence on the stress on the surface of the ECC board. The longer the stud, the greater the tensile stress on the ECC surface. The shorter the peg, the more prone to eccentric compression the ECC plate is, and the longer the peg, the more prone to axial compression it is.

1. Introduction

The orthotropic steel bridge deck has become one of the forms used in large- and medium-span steel bridges around the world due to its advantages of being lightweight, its large spanning capacity and its comfortable driving performance [1,2,3]. The orthotropic steel bridge deck pavement is very different from general pavement. The wheel load stress on the steel bridge deck pavement’s structure is more concentrated; moreover, it is different from the fixed mode of the pavement superstructure under compression and the lower structure under tension. Due to the influence of transverse ribs, longitudinal ribs, etc., under the action of vehicle loads, load effects such as negative bending moment, interface shear stress and interface slip will appear at the corresponding position of the upper part of the bridge deck pavement structure [4,5,6]. Therefore, the ability of a cement-based bridge deck to resist bending deformation or bending tensile stress is extremely important. Engineered Cementitious Composites (ECC) are a new type of polyvinyl alcohol, fiber-reinforced, cementitious composite with high ductility, high toughness and good crack control performance [7,8,9,10]. It was originally proposed by Professor Victor. C. Li of the University of Michigan in 1992 [11]. About 50% of the cement can be replaced by mining wastes such as coal gangue powder and silica fume, which strengthens the key mechanical performance indicators of concrete materials and is conducive to energy saving and ecological environment protection [11,12]. In addition, ECC materials have good ductility and self-healing ability. Under an external load, the structure is always in the elastic stage within the stress bearing-range of ECC and can gradually recover to its original state after the external load is removed, while the ECC concrete layer directly bears the vehicle load and plays the role of dispersing it and preventing seepage. It is therefore beneficial to solve the problems of the steel bridge panel pavement structure cracking and the corrosion of steel bridge panel [13,14]. The steel–concrete composite structure makes full use of the tensile properties of steel and the compressive properties of concrete, has excellent mechanical properties and has been widely used in bridge construction [15,16,17]. Because of its super ductility and good deformation performance, ECC is applied to steel bridge decks to form a steel–ECC composite structure. Under the condition of equal absolute stress values, the fatigue life of ECC far exceeds that of ordinary concrete, which can effectively improve the fatigue resistance of orthotropic steel bridge decks [18,19,20,21]. Studs are used as shear connectors to connect the steel bridge deck and ECC bridge deck pavement as a whole to ensure that the steel and concrete work together, and it is necessary to study it.
Engineering examples show that the application of ECC to the pavement of steel bridge decks will achieve a fatigue life of ordinary concrete with a thinner thickness [22]. In order to match the thinner pavement, short studs are needed as shear members to participate in the interface shear resistance. In the 1950s, Viest and Thurlimann systematically studied the shear performance of stud connectors by using push-out experiments and proposed an empirical formula for the critical bearing capacity of studs [23,24]. The length-to-diameter ratio is above four. In 2004, the Mihara Ohashi Bridge in Hokkaido, Japan, successfully applied 40 mm-thick ECC to replace half of the pavement layer [25]. Since the ECC layer is thin and has superior performance, studs with a length-to-diameter ratio of less than four are used as shear elements. The team of Shao Xudong studied the shear performance of short studs in ultra-high-performance concrete (UHPC) and proposed a practical empirical formula, as well as a formula for calculating the shear capacity of the medium and short stud load–slip full curves of UHPC [26]. However, this study was only for UHPC materials and has not made a certain interpretation of the influence of various parameter variables of the peg. With the continuous development and application of ECC materials, it is necessary to further study the shear resistance of medium and short ECC studs.
This work mainly studies the shear performance of studs in the steel–ECC composite structure. Through 16 push-out test members, the influence of three variables of stud diameter, length, and arrangement spacing on the bearing capacity of the members is studied. Through the load-relative slip curve, the influence of the stress and deformation characteristics of the stud on the bearing capacity and deformation of the composite structure is studied. At the same time, the ductility of ECC is further analyzed by the failure mode and load-crack width curve of the steel–ECC composite structure. In the test, strain gauges were also attached to the ECC surface, the steel bar surface, the steel plate surface, and the tension part of the stud to study the local deformation characteristics of the steel–ECC composite structure under load and the mechanical properties of each material combination.

2. Materials and Methods

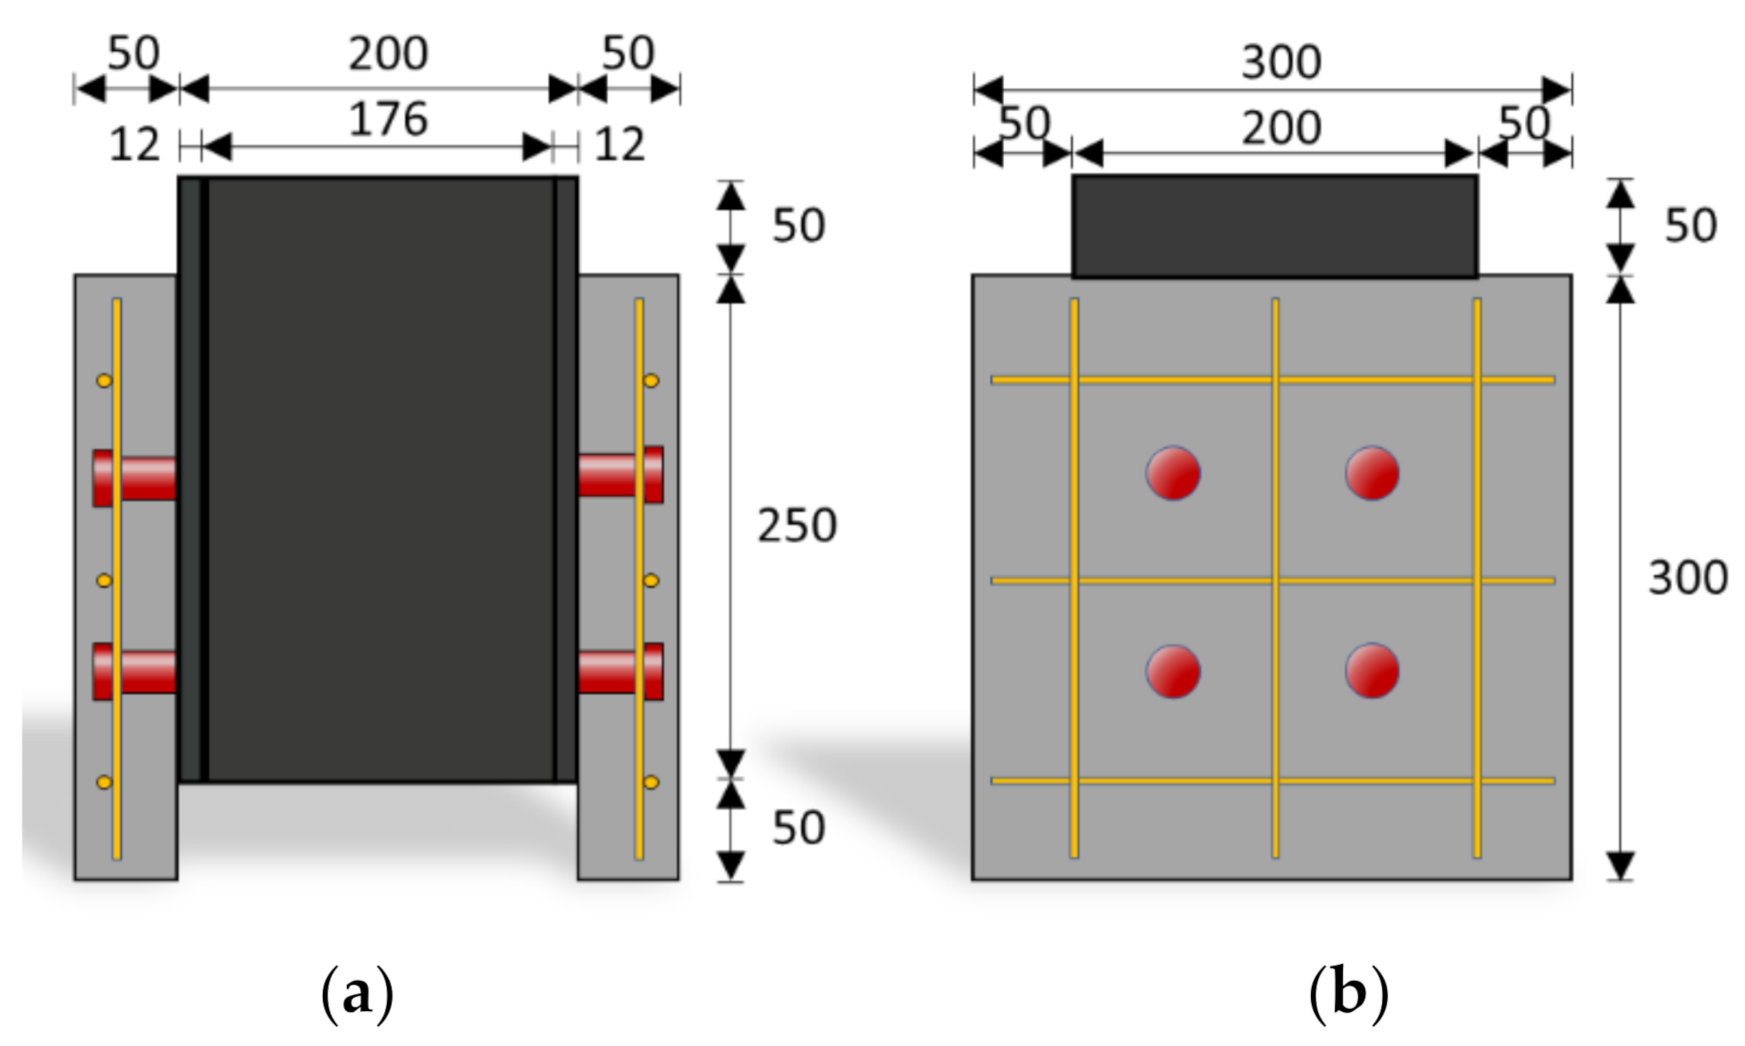
2.1. Specimen Design

In this work, three variables of stud height, stud diameter and stud spacing were tested, and a total of 16 specimens were produced by orthogonal test design, with the specimen dimensions shown in Figure 1. H-beam with material Q345 and model HW200 × 200 was used as the main steel structure; 8 pegs of material were Q235 welded on both sides of the H-beam; the heights were 28 mm and 35 mm, and the diameters were 13 mm, 16 mm, 19 mm and 22 mm; and the peg was cut to shorten; HRB400 steel bars with a diameter of d = 10 mm were used for vertical and horizontal reinforcement of the concrete deck; the ECC layer thickness was 50 mm. The construction size and grouping of the specimens are shown in Table 1.

2.2. Material Properties
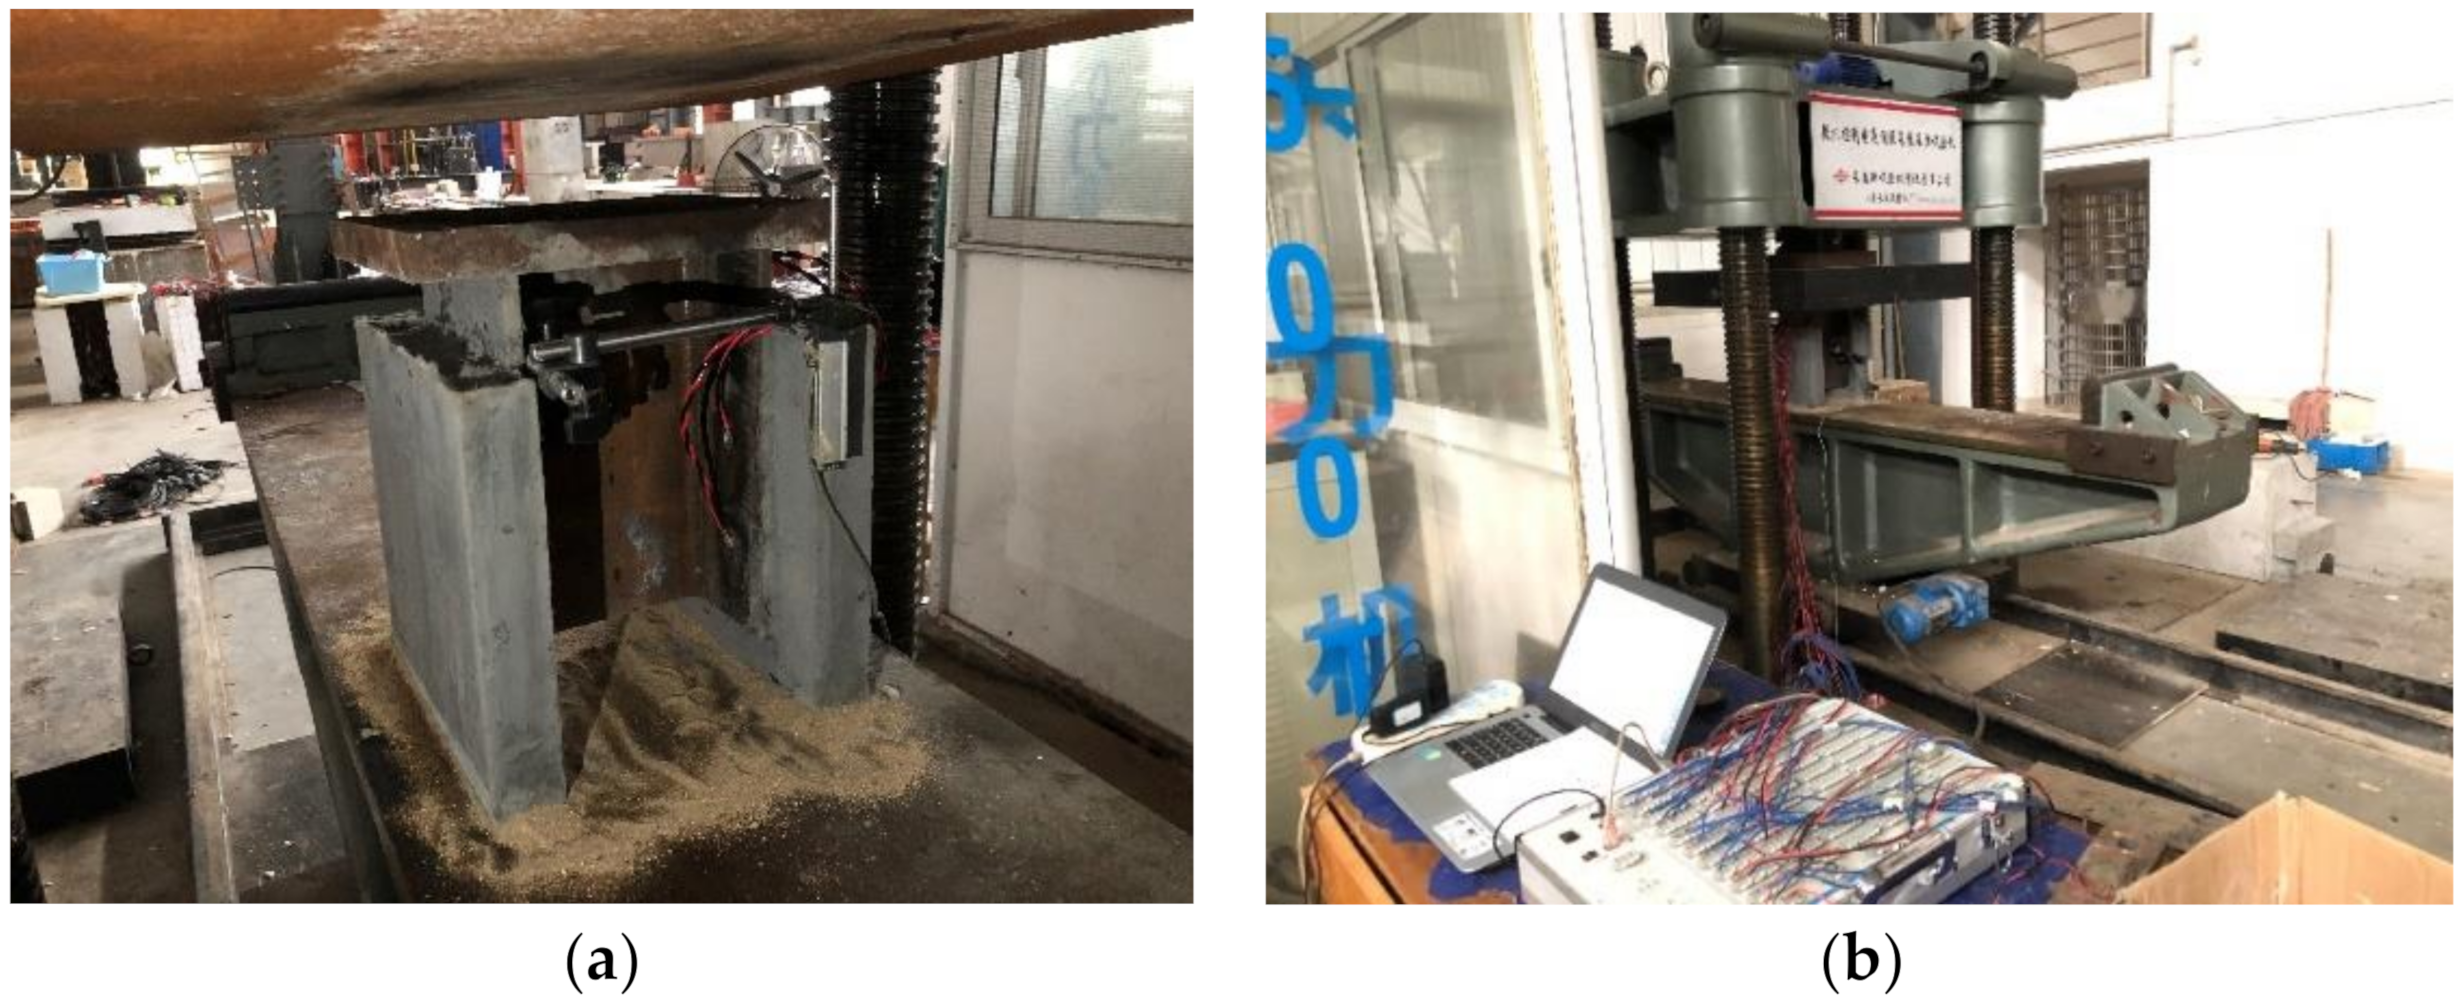
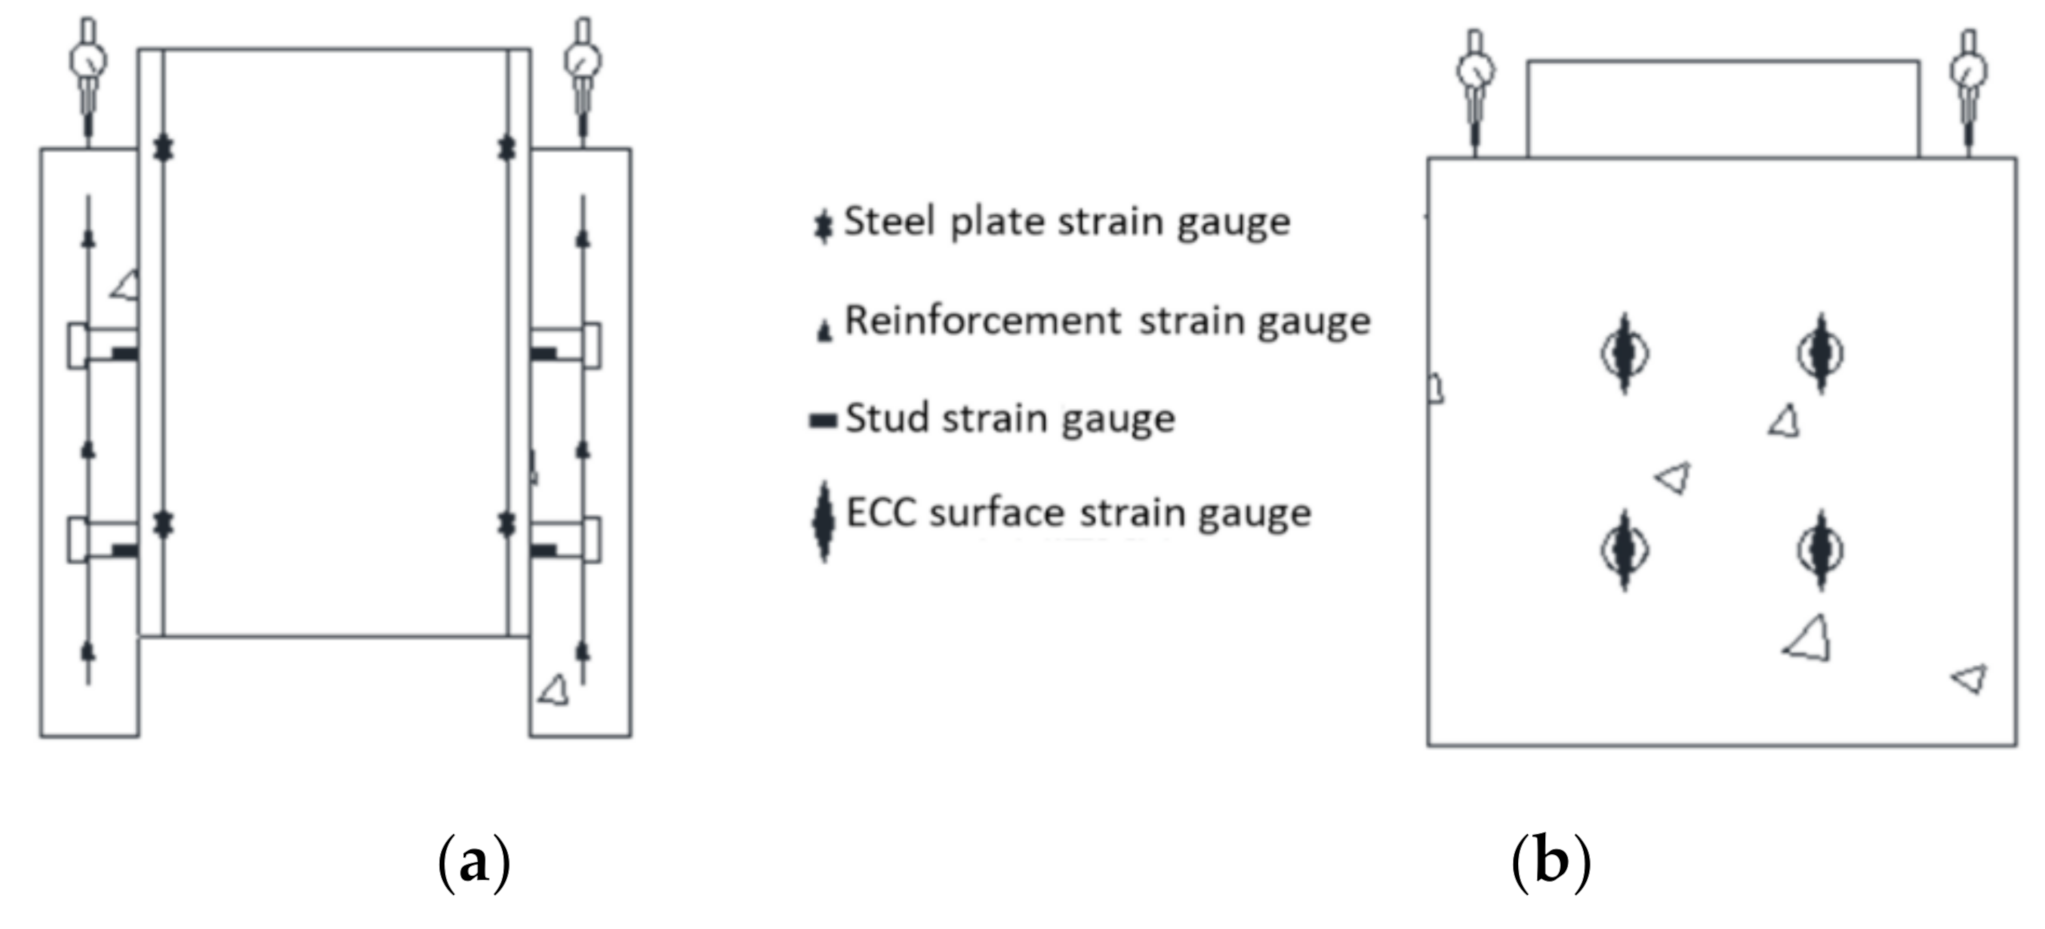
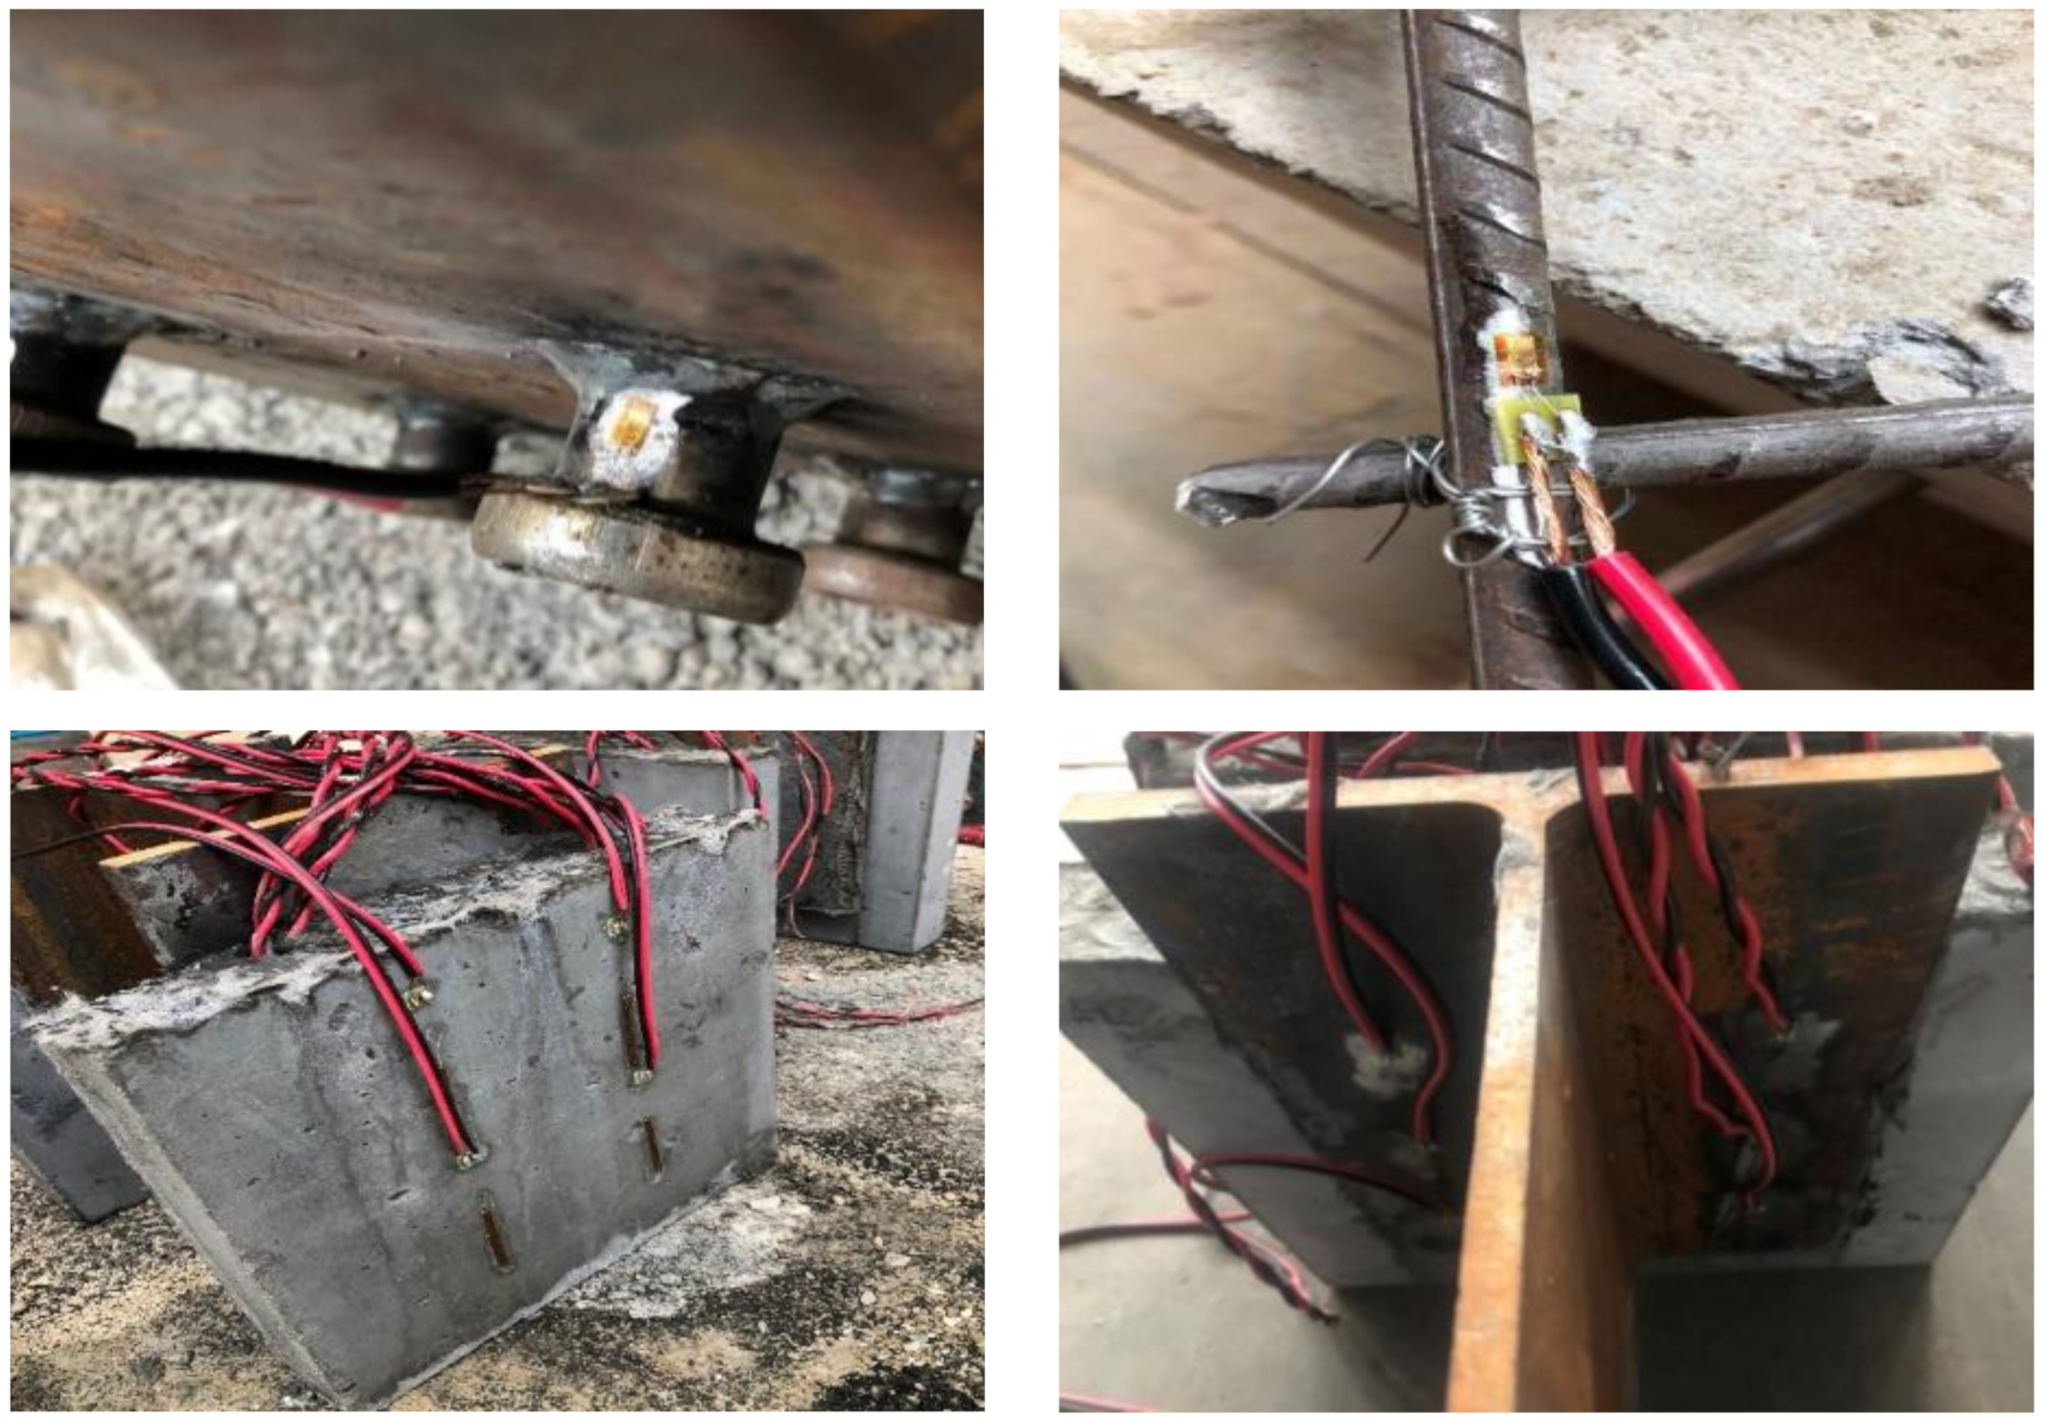
ECC concrete was prepared and poured on-site, and its main materials included cement, quartz sand, silica fume, coal gangue powder, PVA fiber and polycarboxylate water reducer. The volume content of the fiber was 2.5%. The basic properties of ECC concrete materials are shown in Table 2. The material properties of the PVA fiber are shown in Table 3, and the basic properties of the steel used in the test pieces are shown in Table 4. The material properties of ECC concrete were tested by 300T universal mechanical testing machine, and the compressive strength and bending strength of concrete were tested by displacement loading, in which the displacement loading rate was 1 mm/min for testing the compressive strength and 0.5 mm/min for testing the bending strength. Concrete tensile strength was obtained by uniaxial tensile test with a displacement loading rate of 0.3 mm/min.

2.3. Test Loading

The test uses a 500T “microcomputer-controlled electro-hydraulic servo long-column press” for loading, and the experimental device is shown in Figure 2. First, the specimen was placed on the press bench, and a small amount of fine sand was pad down at the bottom of the specimen to ensure the smooth loading of the specimen and reduce the friction between the lower surface of the concrete and the bearing surface. Then, the steel pads were placed in turn, and the pressure sensor and spherical hinge support were placed above the specimen. Before the test was formally loaded, 40% of the expected shear bearing capacity was used as the preload for preloading. In the initial stage of the test, the displacement loading at the rate of 0.5 mm/min was adopted, and the displacement loading at the rate of 0.2 mm/min was used when the load–displacement curve was observed to be linear. During the loading process, the surface cracks of the specimen were observed and recorded.
As in Figure 3, to measure the load–slip curve of the push-out specimen, displacement gauges were arranged on the left and right sides of the specimen to record the relative slip of the steel–ECC interface of the specimen under load. Meanwhile, three rows of strain gauges were arranged on the inner side of the H-beam to measure the interfacial stress distribution of steel members; three steel bar strain gauges were arranged on each longitudinal steel bar to measure the stress distribution of the longitudinal bars; and one concrete strain gauge was arranged on the concrete surface at the corresponding position of the stud. A 10,000 μm strain gauge was attached to the root of each peg, fixed with epoxy resin and protected with electrical tape. The arrangement of the strain gauge is shown in Figure 4.

3. Results and Discussions

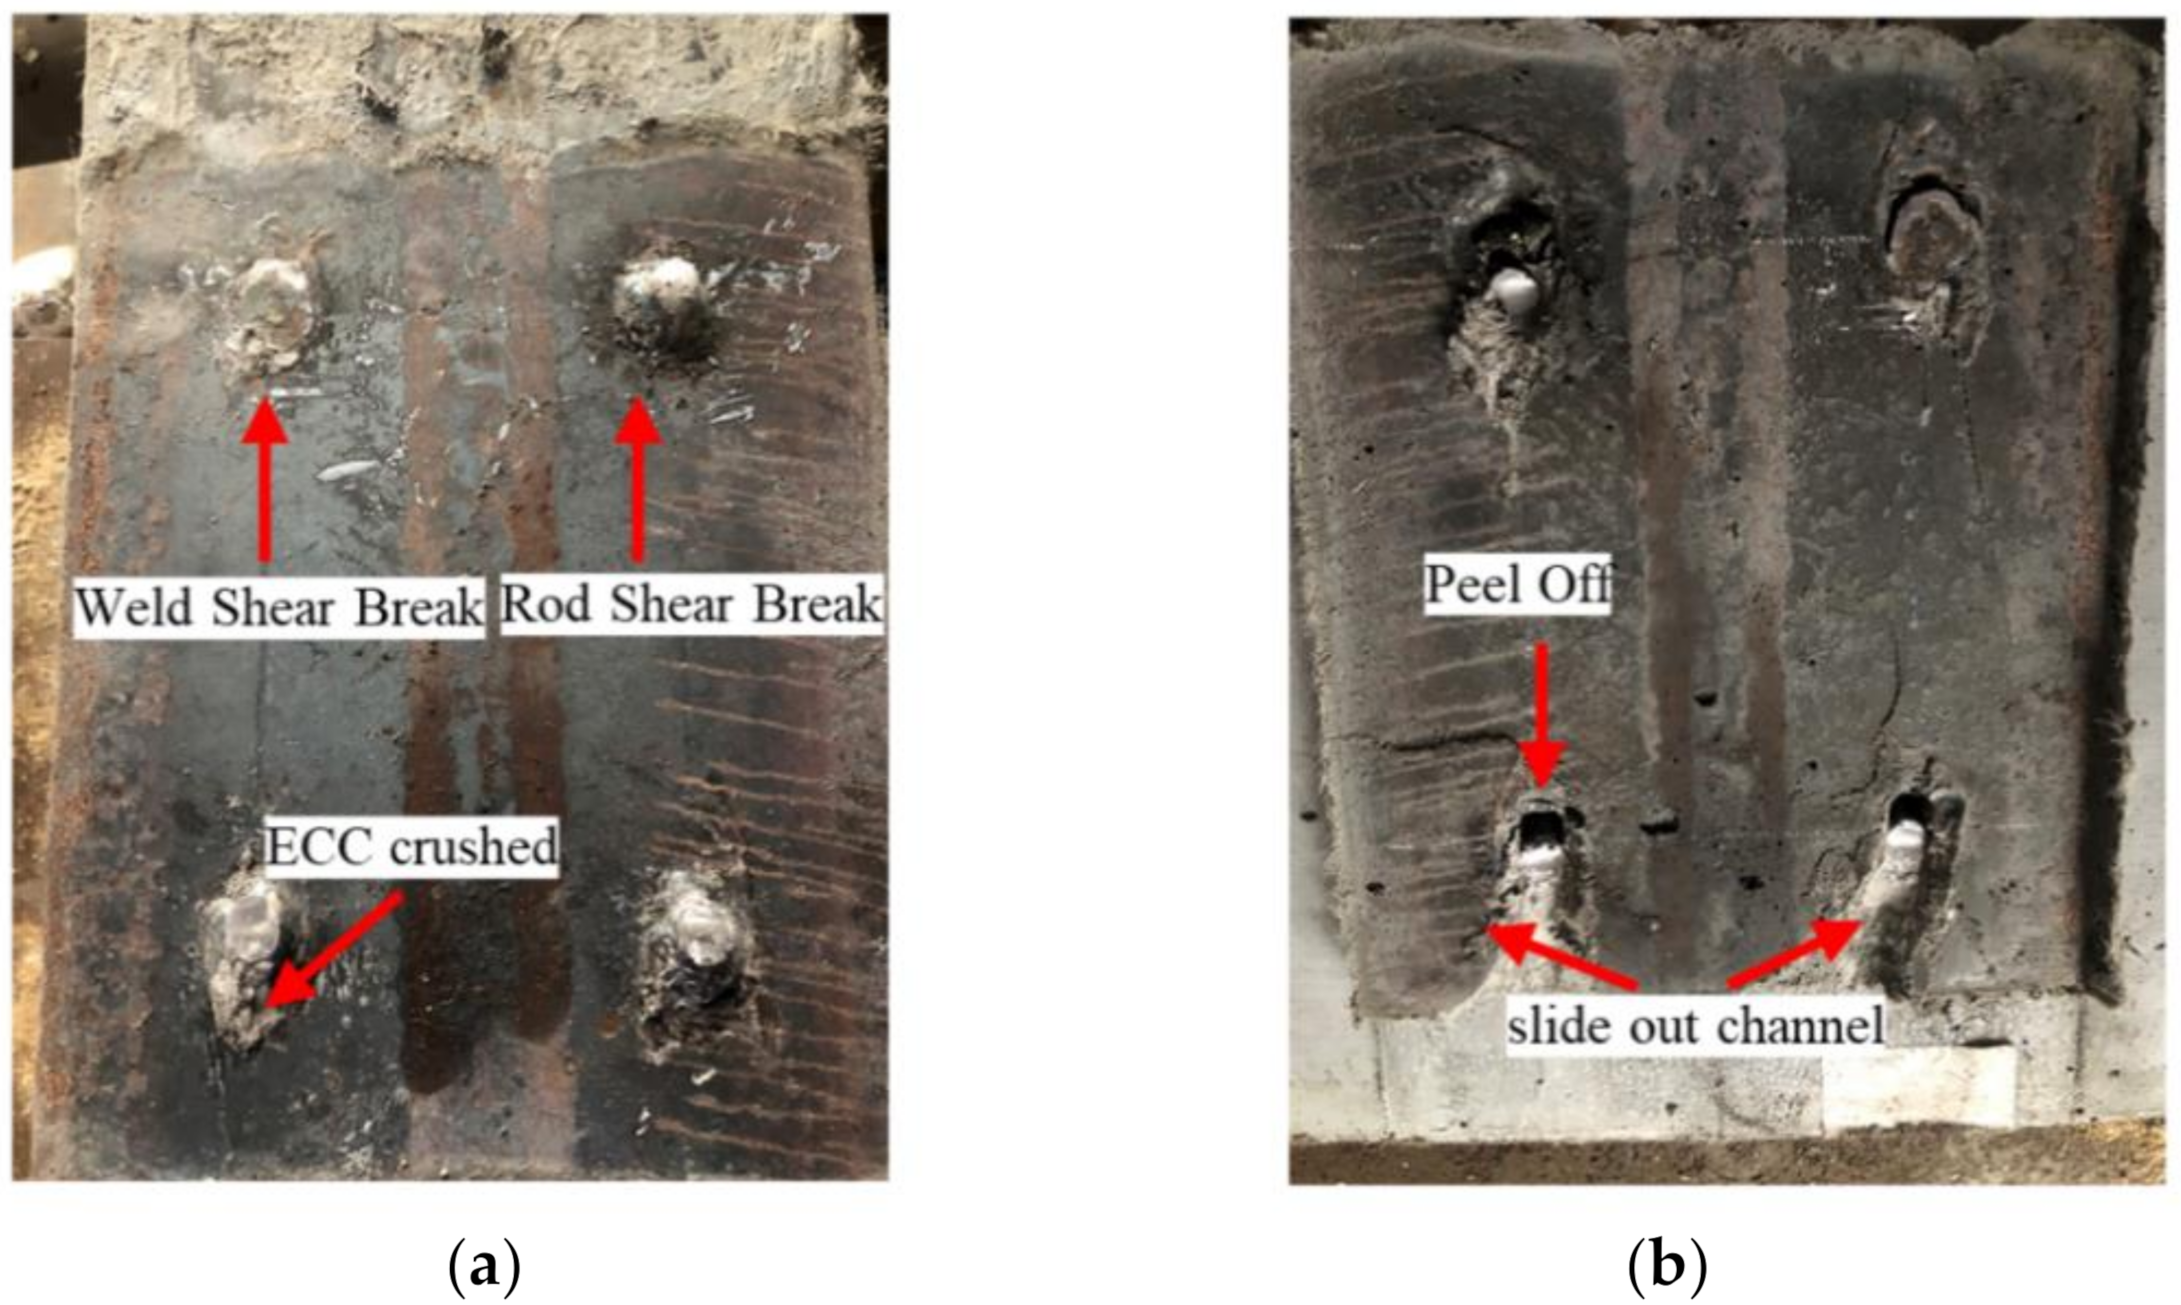
3.1. Test Procedure and Phenomenon

Under the loading of the test device, the top section of the H-beam is stressed, and the load is transmitted to the studs welded on both sides of it. Then, the studs transfer their own force to the EEC concrete. At the initial stage of loading, the specimen did not change significantly. As the load increased, the ECC plate and the H-beam began to slip relative to each other, the strain on the tensile side of the stud continued to increase, and cracks began to appear on the concrete surface at the stud. When the load reaches 80% of the ultimate load, concrete cracks develop laterally at the stud location and simultaneously begin to propagate up and down. When the load reaches the ultimate load, a crisp sound is heard inside the specimen, indicating that the stud has been sheared. Then, the load decreases, and its relative slip velocity becomes faster. Subsequently, the ECC plate was crushed at the point where the inside of the test piece and the stud weld; the ECC plate was broken by the sheared stud, and the entire interface was peeled off by continuing to apply pressure. Finally, the ECC plate and the steel plate were completely separated.
The interface shape after the stud is sheared is shown in Figure 5, which can be divided into two failure modes: (1) the fracture surface is located at the upper end of the weld toe of the peg and the peg yields, thus the peg bar is sheared off; (2) the fracture surface is located at the root of the peg, and due to the insufficient strength of the weld, the weld is sheared off, leaving a concave surface on the steel plate when fractured. Figure 5b shows that the pins are subjected to shear stresses between the concrete slab and the steel plate and undergo bending deformation, thus crushing the concrete in the compressed area and forming a peel with the ECC slab. Due to the high ductility of ECC, there is an ECC-crushed area of about 20 mm at the root of the stud at the interface of the ECC board, and no large cracks occur in the remaining areas. The final failure form is basically stud shearing, indicating that ECC material can disperse the load transfer of studs through its high ductility, thereby improving the cooperative working performance of steel–concrete structures.

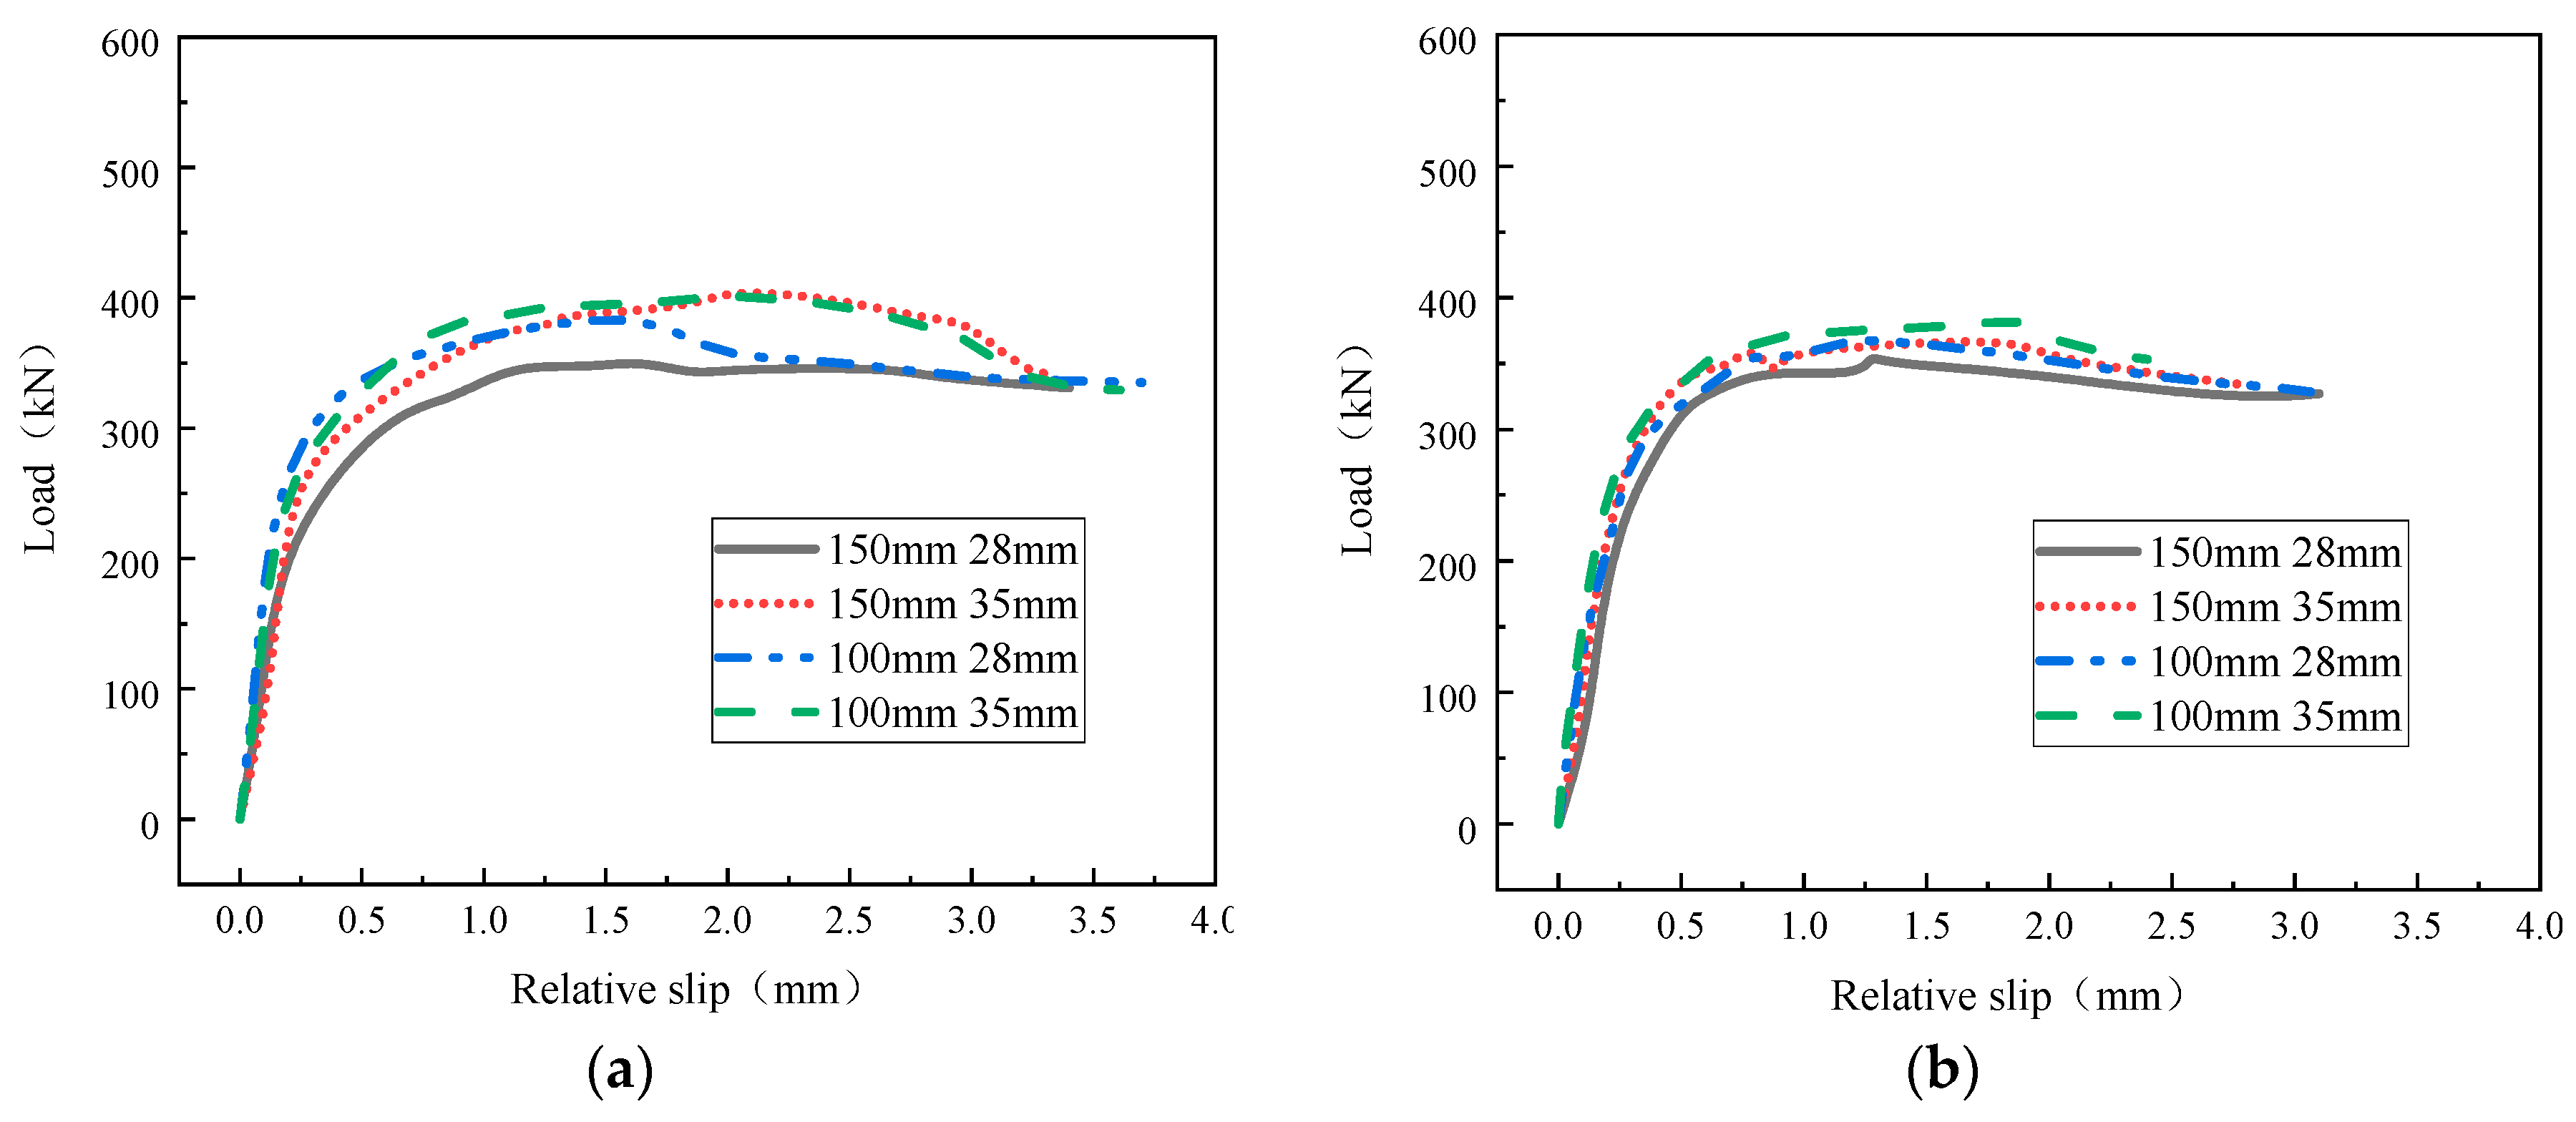
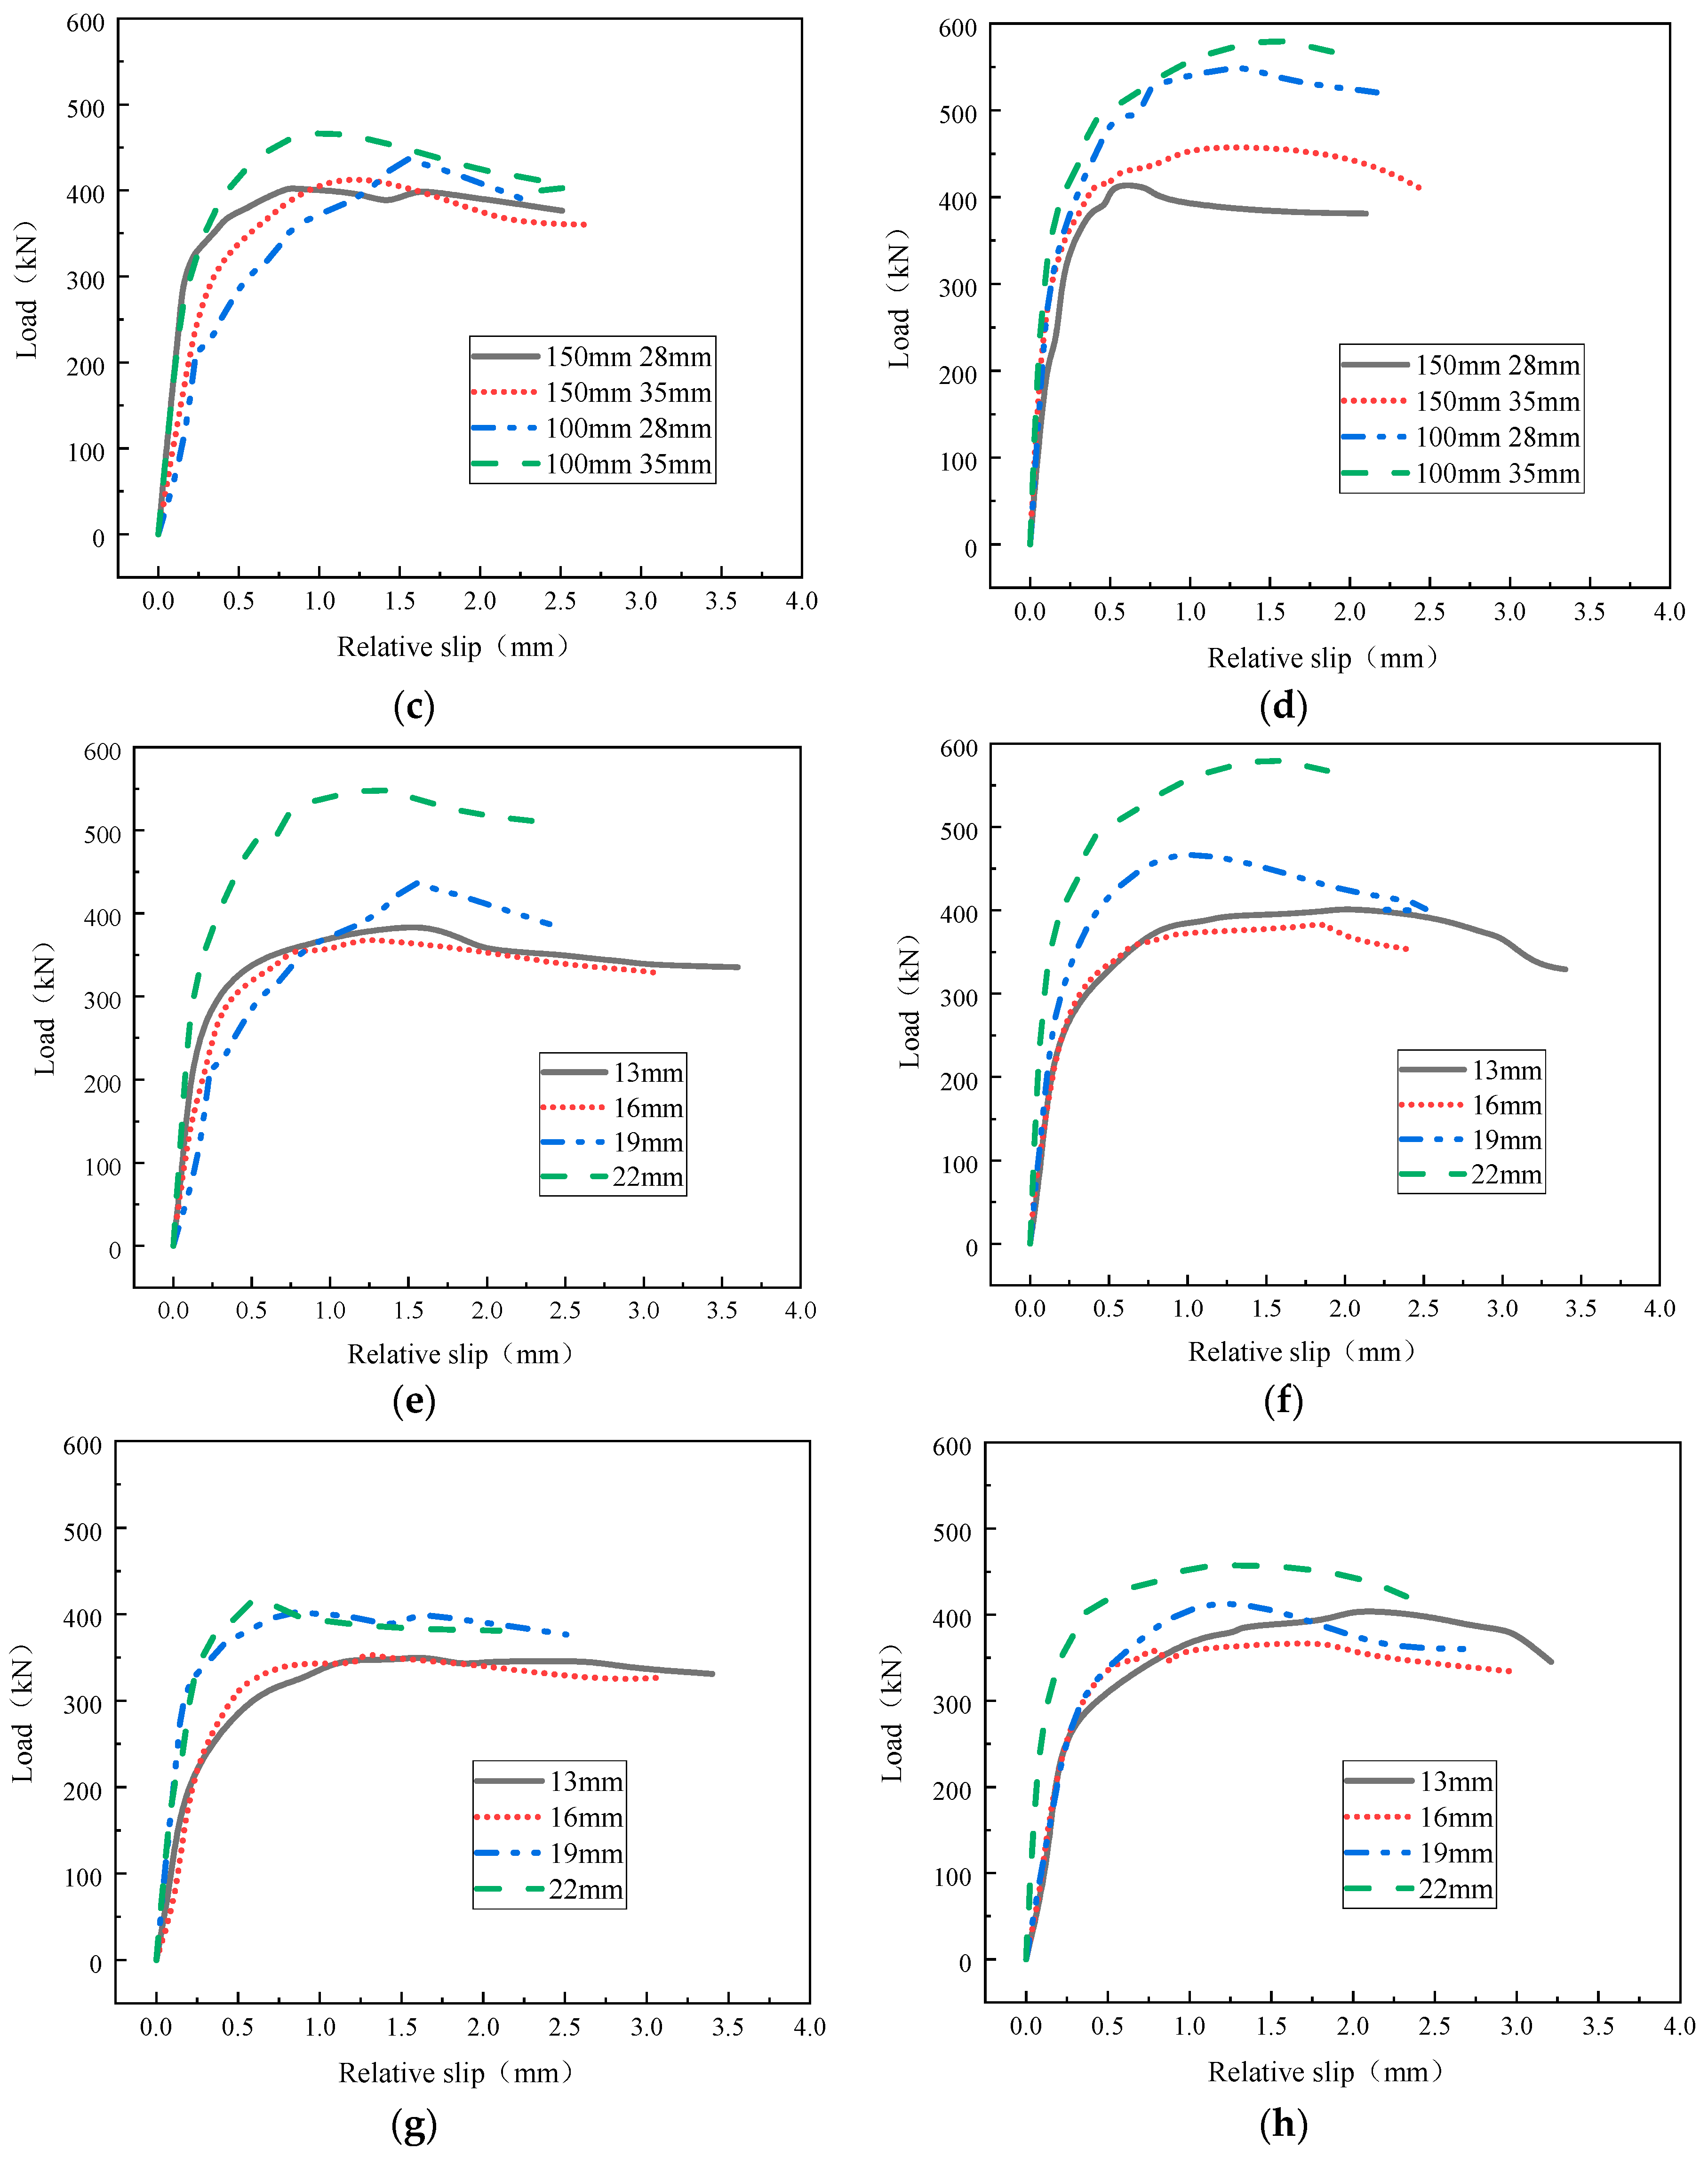
3.2. Load–Slip Relationship

Table 5 shows the main results of the test, and for the convenience of comparative study, the load–slip curves of each specimen are classified and arranged as shown in Figure 6. The interaction between the peg and the ECC layer is not a linear process, and the curve can be roughly divided into an elastic stage, an elastoplastic stage and a plastic stage. In the elastic stage, both the stud and the ECC layer are in a linear elastic state, and it is believed that the shear stiffness of the stud remains unchanged at this time; in the elastoplastic stage, the stiffness of the stud is significantly greater than that of the ECC structural layer. The ECC under the root of the stud is compressed and enters the plastic stage, so the dominant load–displacement curve presents a nonlinear change. It grows again until the stud shears and the member fails.
Figure 6a–d show that when the diameter and spacing of the pegs are constant, the bearing capacity of the member is basically proportional to the height of the pegs; when the pegs have smaller diameters (13 mm and 16 mm in diameter), the shear-bearing capacity of the specimens with different stud heights is not much different, which shows that when the length and diameter of the short stud are relatively large, it has little effect on the shear-bearing capacity of the ECC–steel plate composite member. However, when the stud diameters are 19 mm and 22 mm, and the stud spacing is constant, the shear-bearing capacity of the specimen increases obviously with the increase in the stud height. Since the longitudinal number of studs is too small to exert the influence of stud spacing, this test cannot demonstrate the effect of stud spacing on the bearing capacity. Figure 6e–h show that the ultimate bearing capacity of components with different stud diameters increases significantly as the stud diameter increases. The specimen with a stud diameter of 22 mm is stronger than the specimen with a stud diameter of 13 mm. The bearing capacity of the studs is increased by about 49% on average, and the larger the diameter of the stud, the smaller the relative slip value under the same horizontal load. When the diameter and length of the stud are constant, it can be seen from the comparison of the specimens with different diameters that the individual load–slip curves are lower than the expected level due to the fracture of the short stud weld, which shows the importance of the stud welding quality to its bearing capacity.

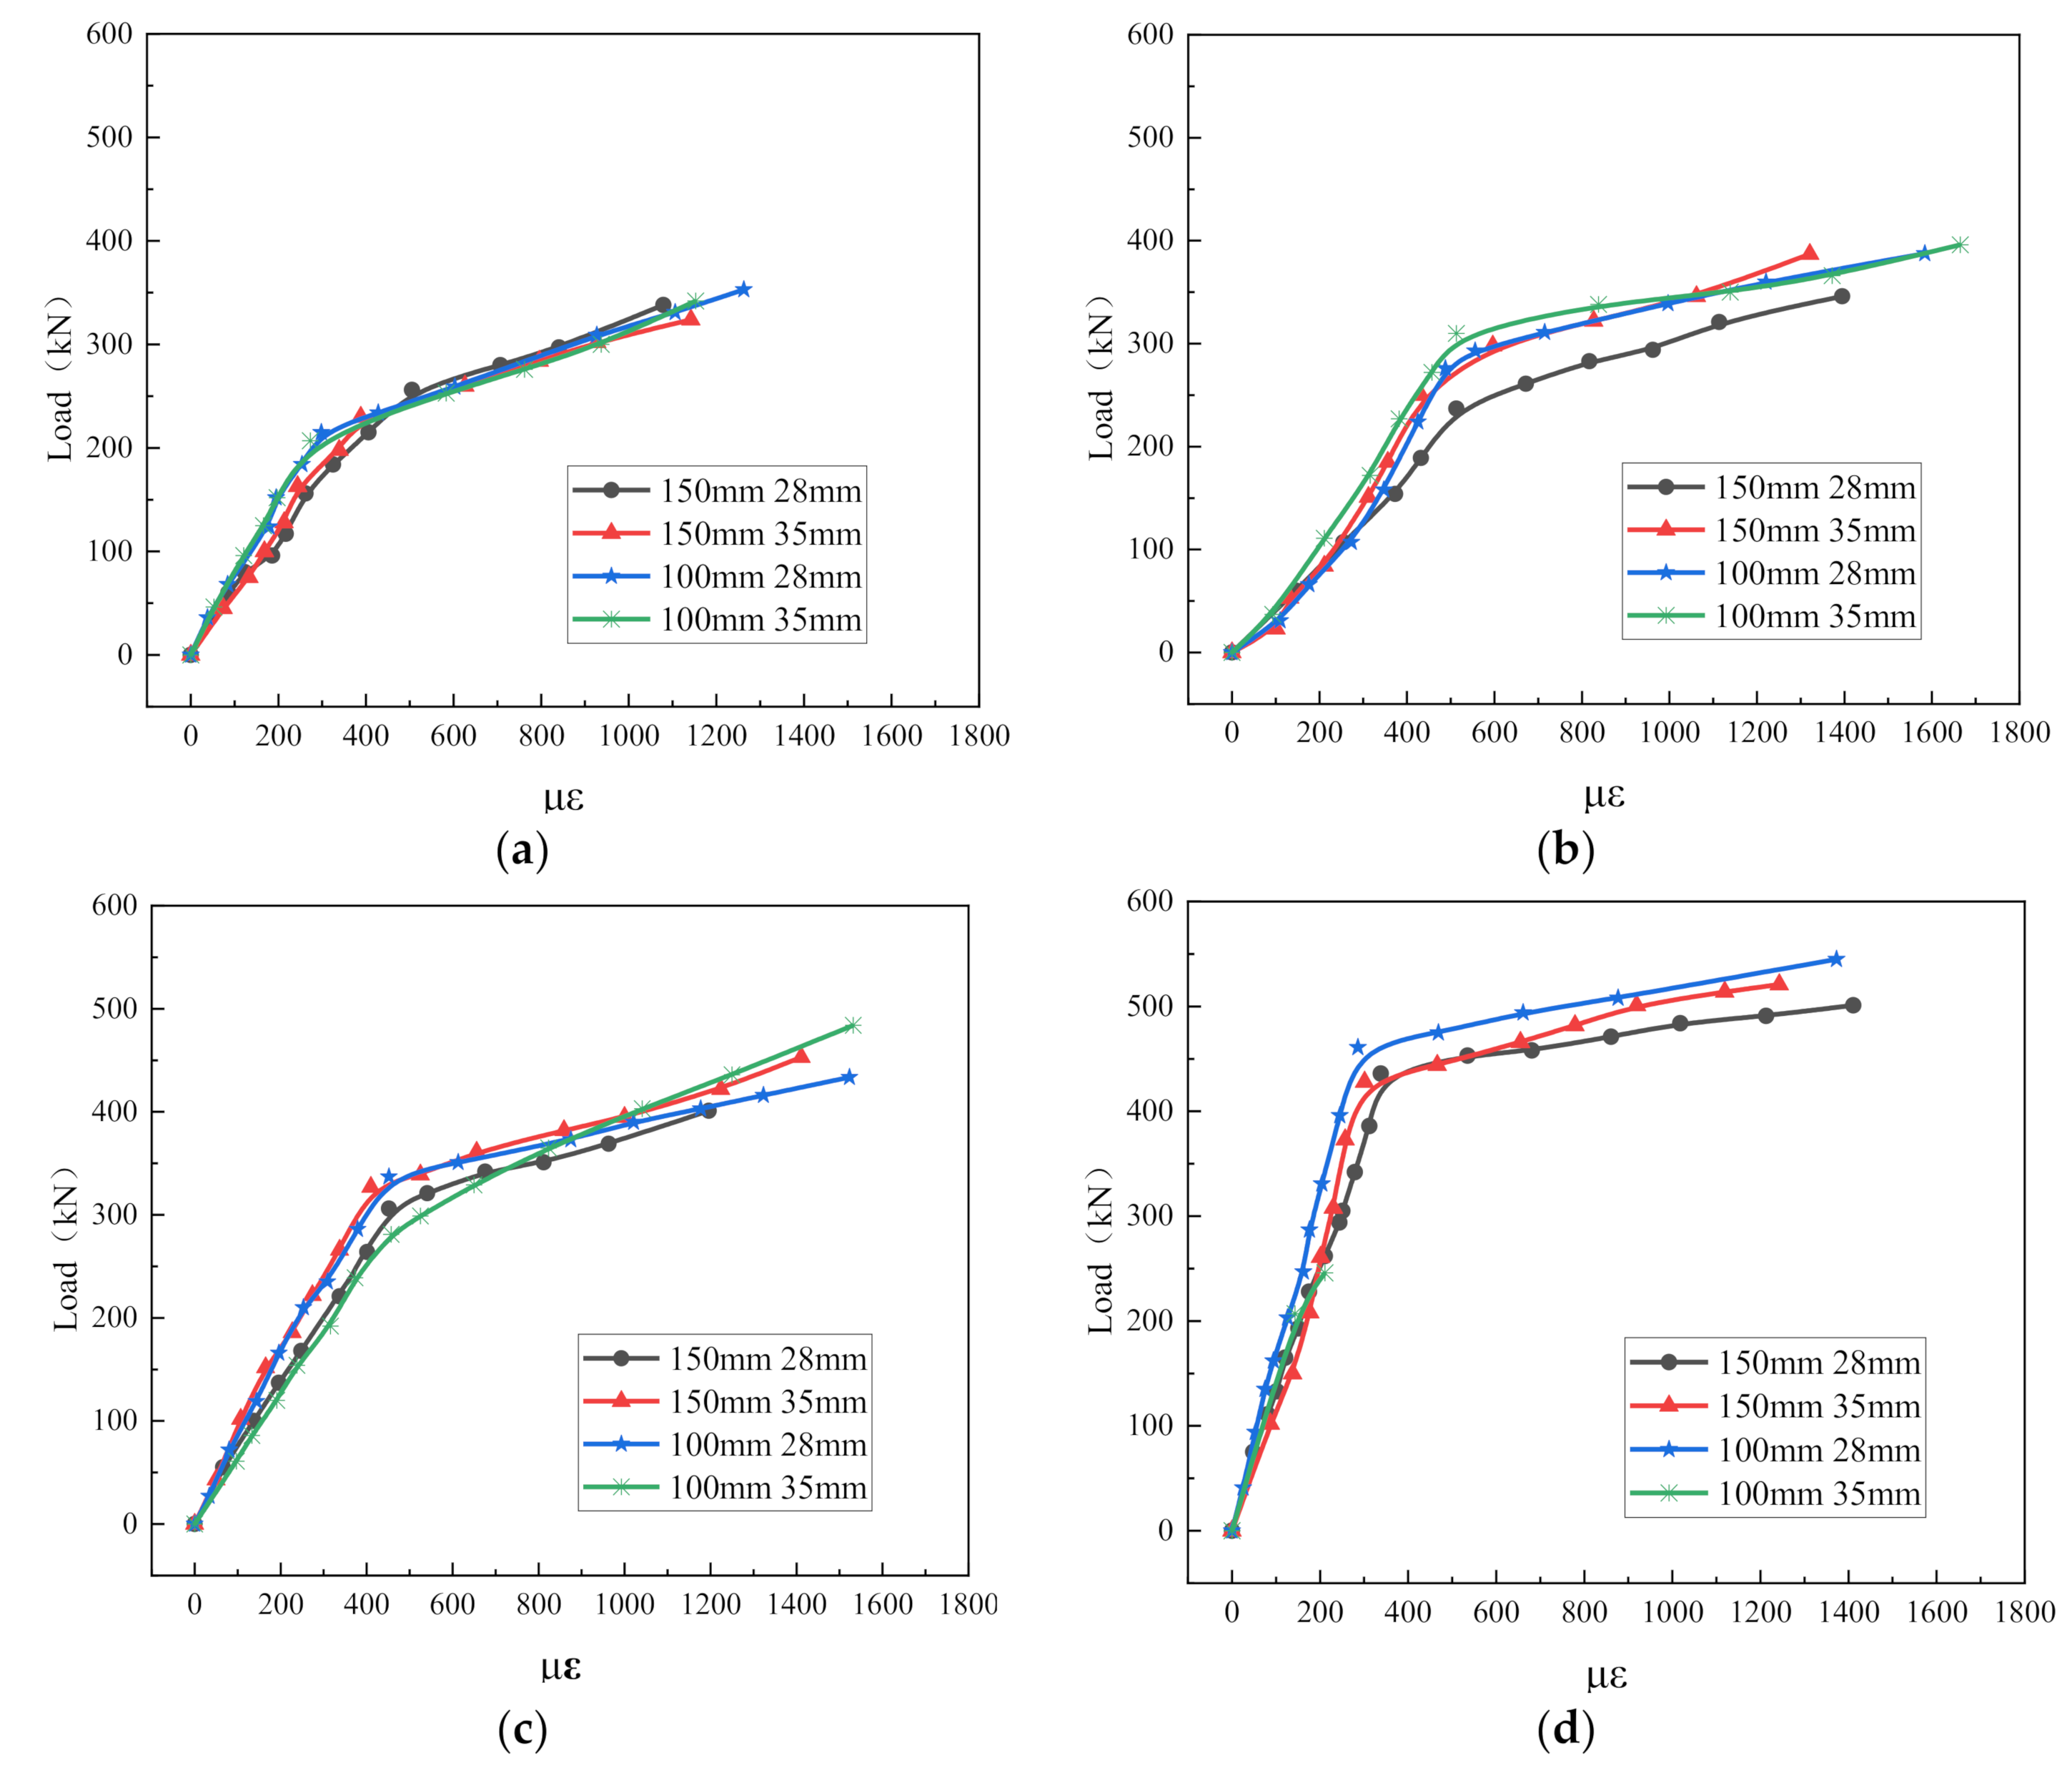
3.3. Load–Strain Relationship

3.3.1. Stud Load–Strain Relationship

The stress of the stud in the specimen is similar to that of the cantilever beam, so this paper mainly analyzes the load–strain relationship on the tensile side. As shown in Figure 7, when the load is loaded near the peak, the stud shows a yield trend and the strain increases exponentially. Observe the load–strain curve of the stud, which is mainly divided into two stages: elastic and plastic. Since the strain gauge is attached to the surface of the stud, the plastic working stage of the stud must begin to yield from the surface, which leads to an early start of the plastic stage of the load–strain curve and the lack of a transition section. It can be seen from Figure 7a–d that under the same diameter, the strain on the tension side of the stud is not greatly affected by the spacing and the length of the stud, which corroborates with the changes of the two parameters of the load-relative slip curve above. In addition, as shown in Figure 7e–h, when only the diameter of the stud is used as a variable, the load–strain curve of the stud changes significantly. The larger the diameter, the greater the ultimate bearing capacity of the stud, and plasticity appears later. Figure 7f shows that the strain was not collected after the test load capacity was loaded to 246 kN for the peg specimen with 22 mm diameter, 100 mm spacing and 35 mm length, which may be due to the strain gauge being crushed during the loading process.

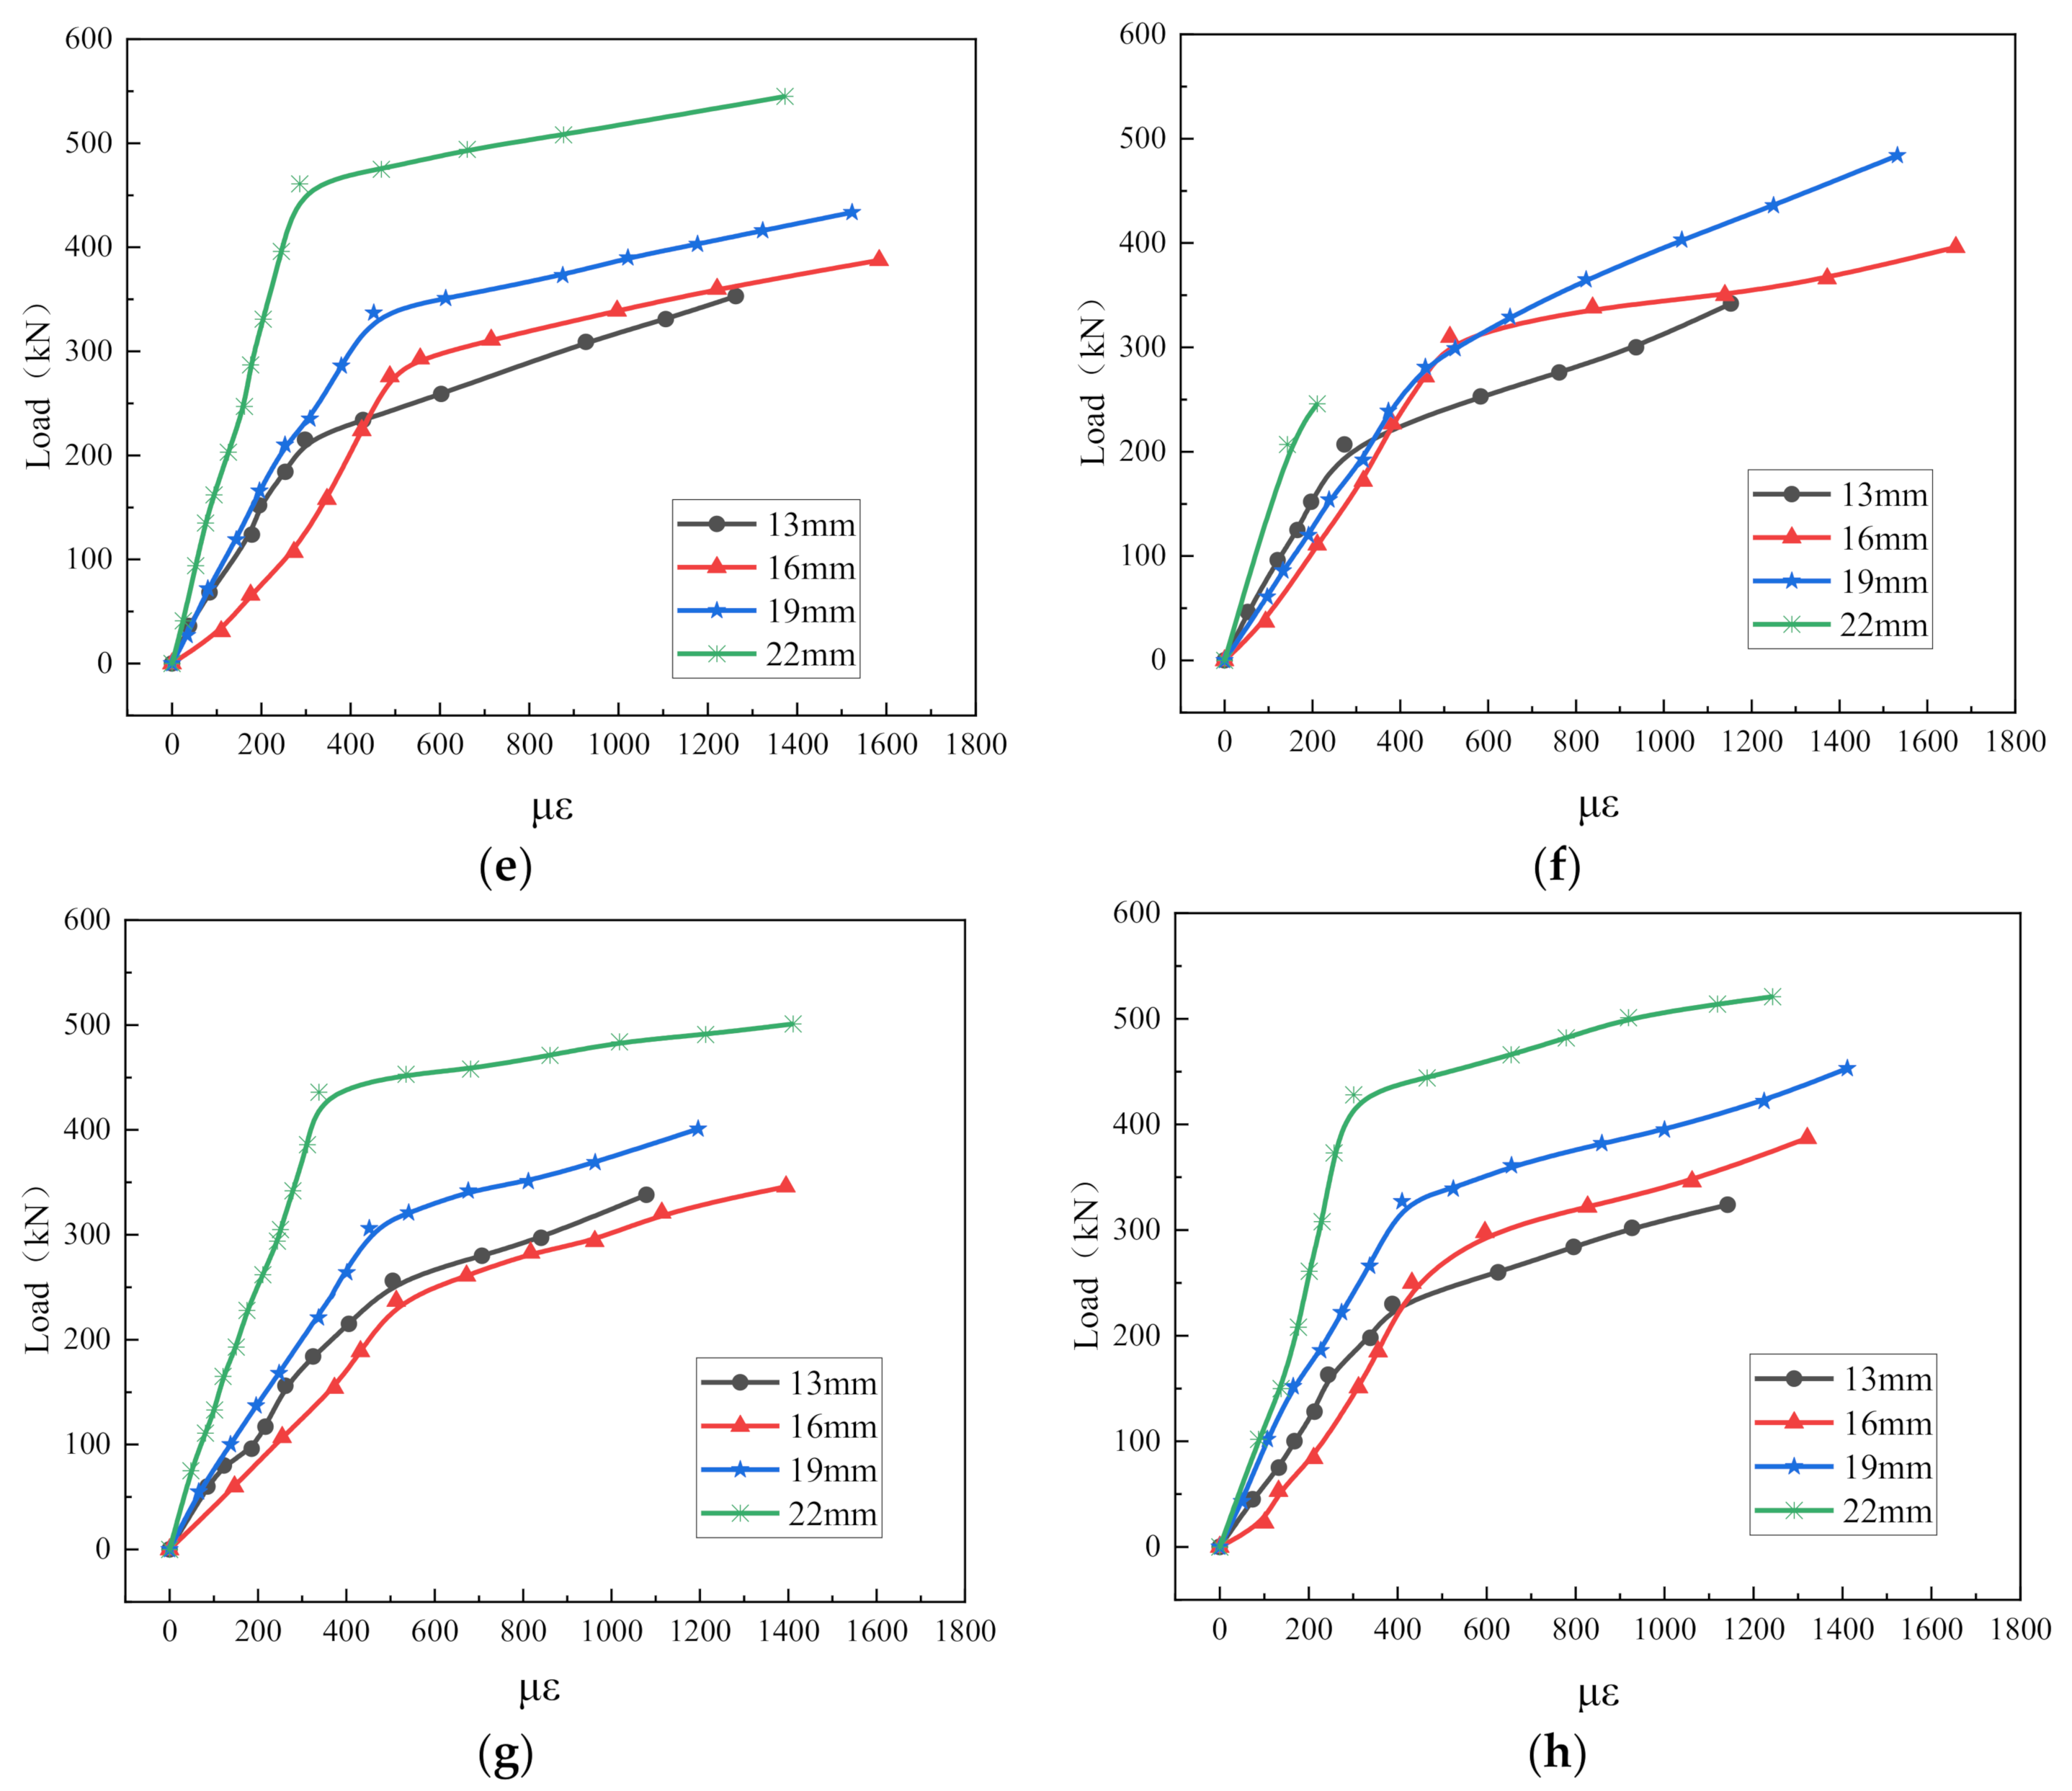
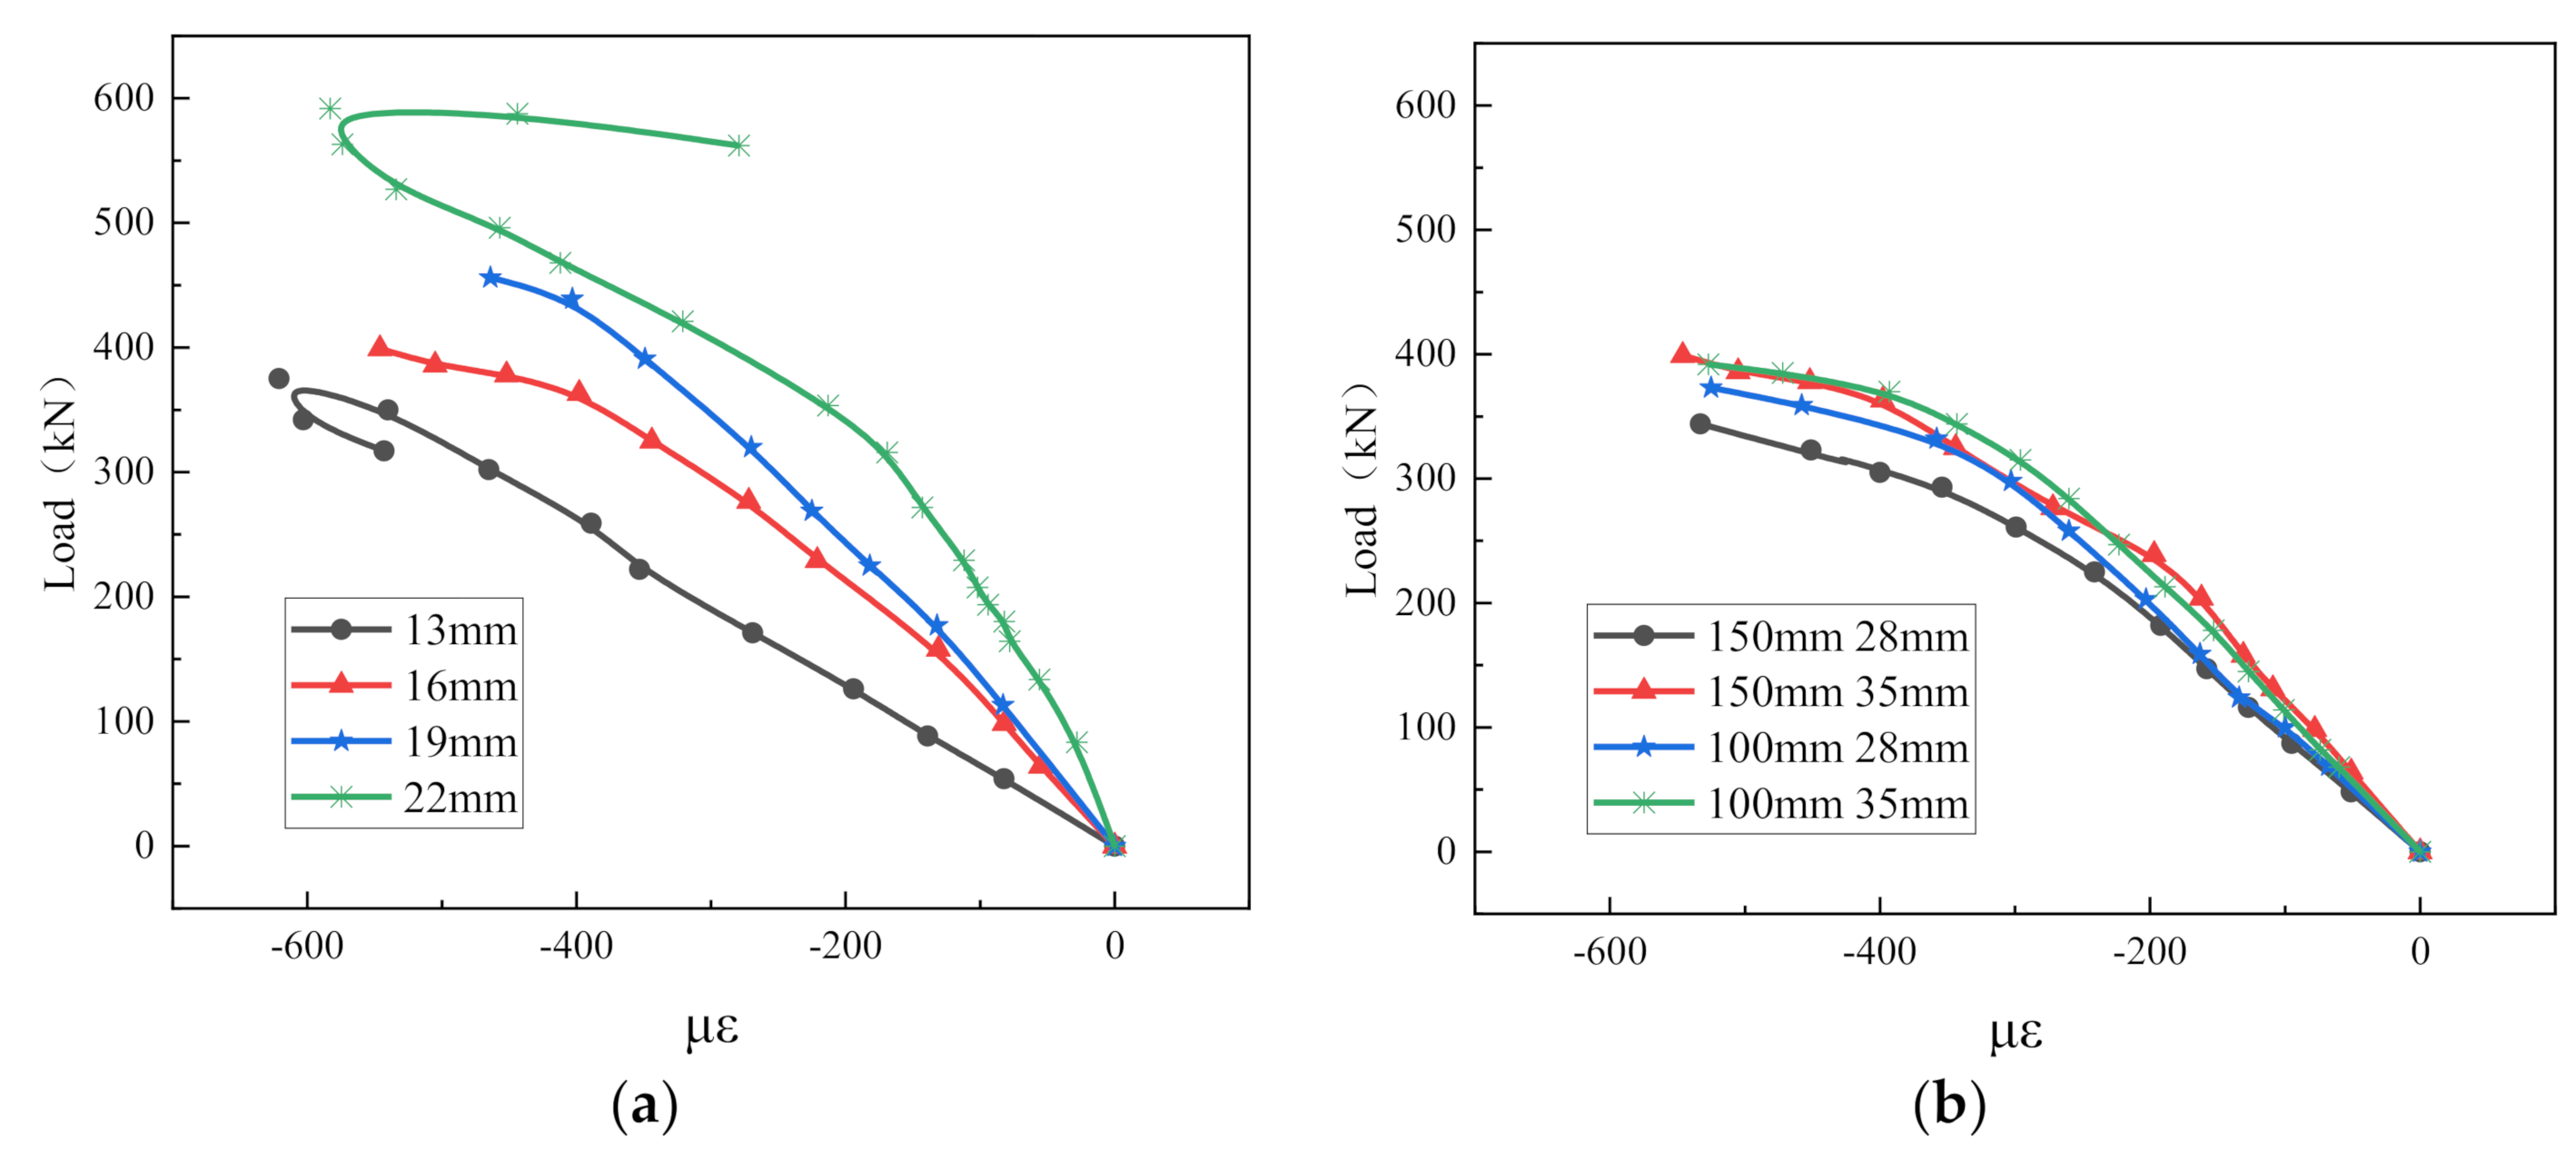
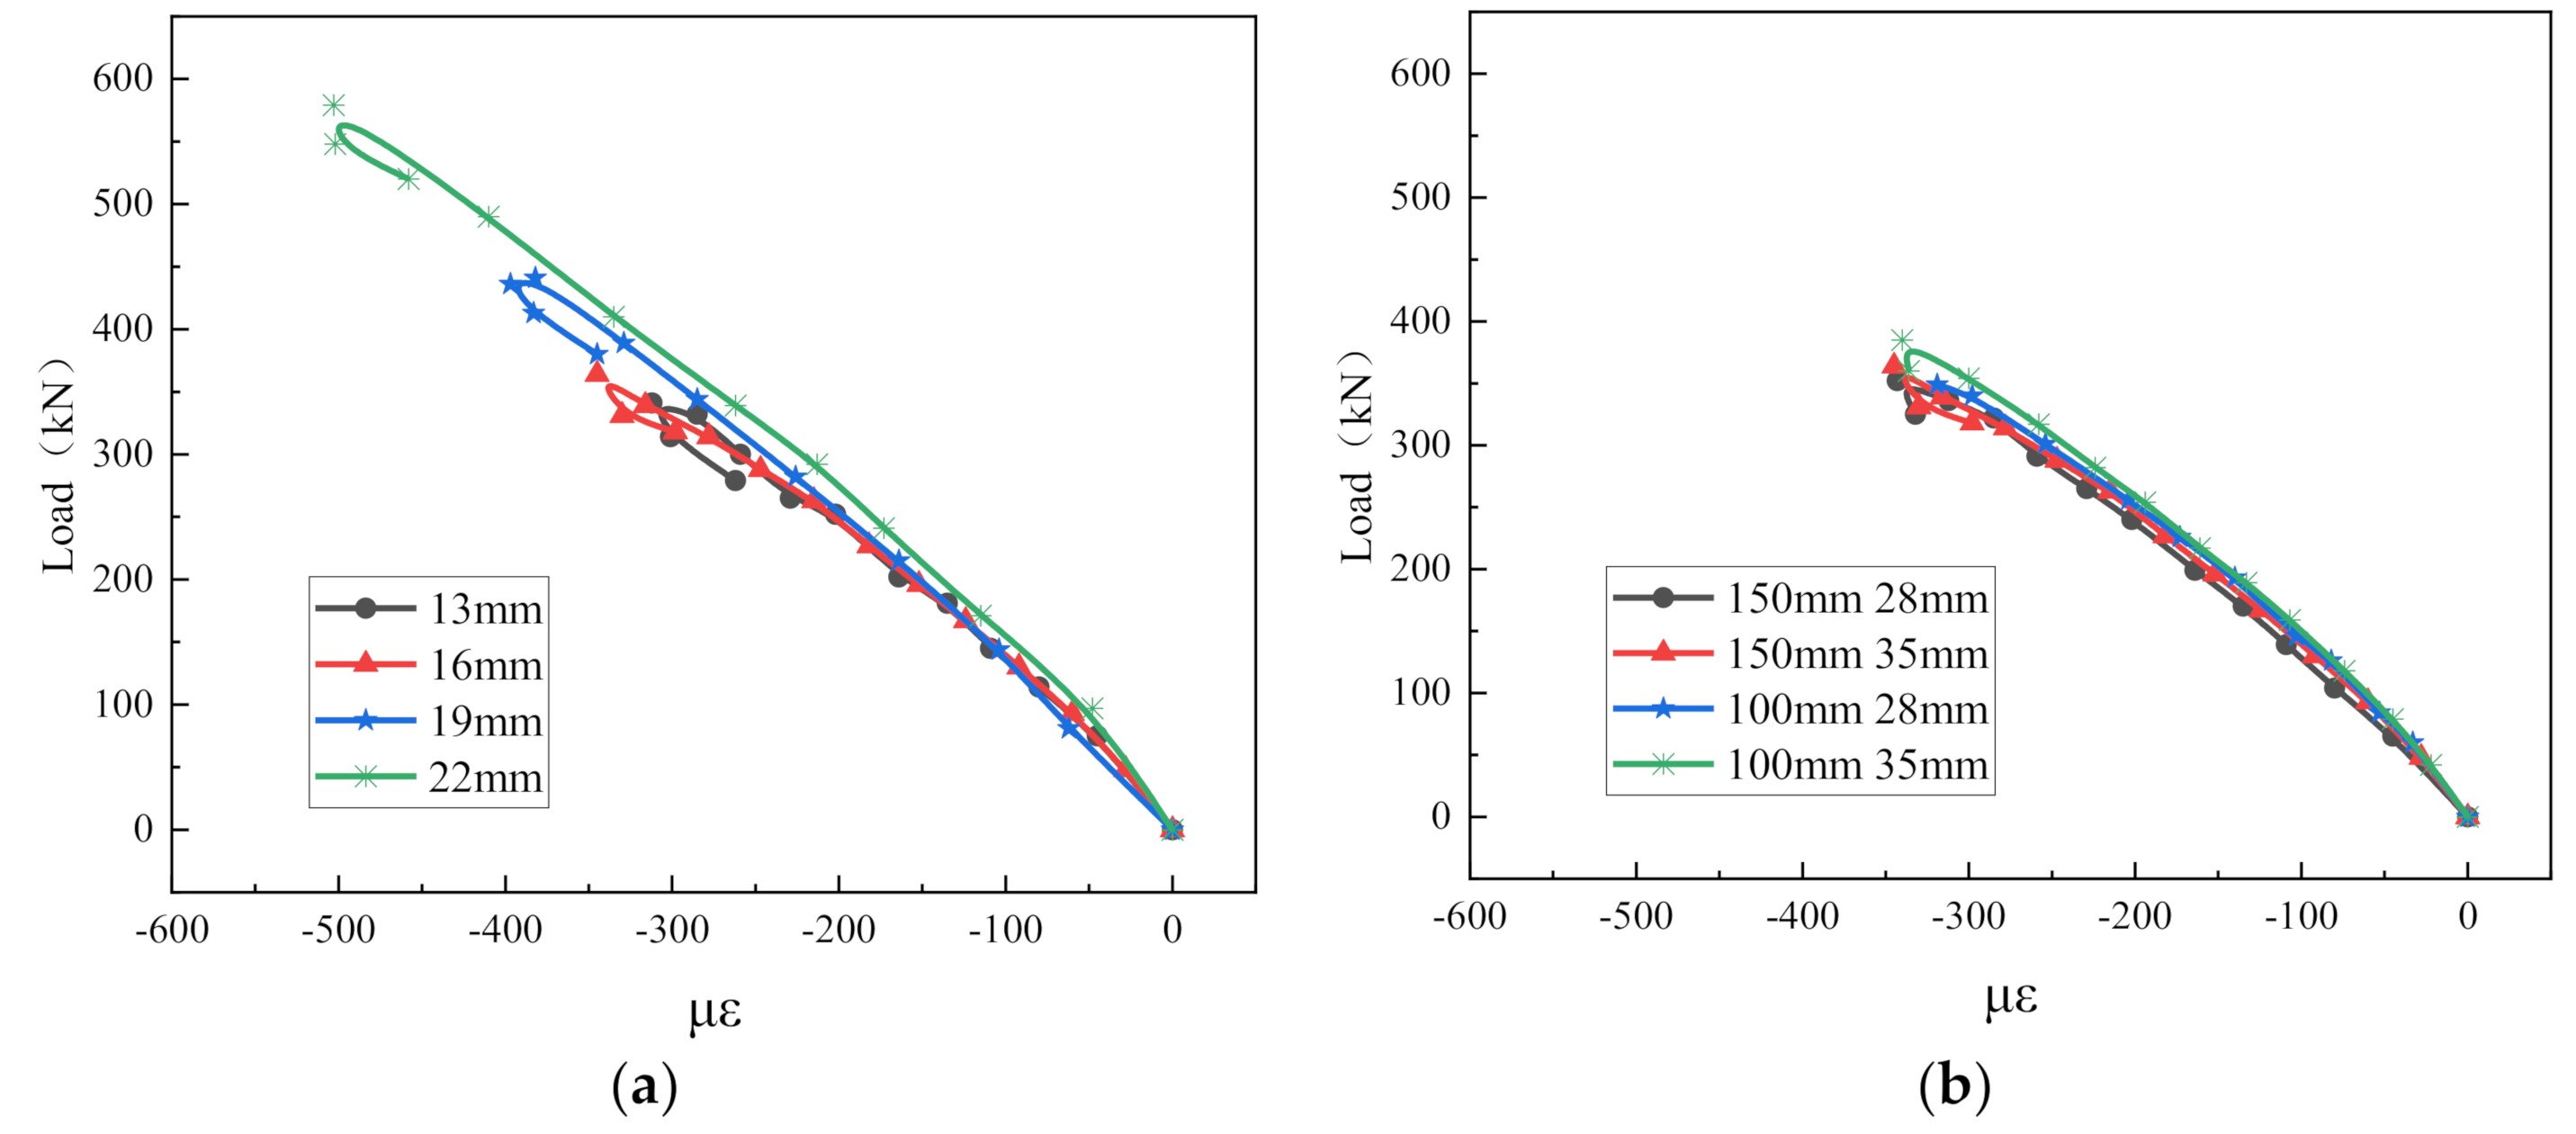
3.3.2. Surface Load–Strain Analysis of ECC Panels

Since the ECC surface load-strain data patterns are similar for bolts of different diameters, a representative bolt diameter is selected to plot the load–strain curves for the four measured points on the ECC surface, that is, the specimen with variable bolt length and 16 mm diameter, as shown in Figure 8. Among them, points 1 and 2 are the upper measuring points; points 3 and 4 are the lower measuring points. The strain development law of the two selected components is basically similar; that is, the upper surface of the ECC is basically in tension, the lower surface is basically in compression and the upper strain value is larger than the lower strain value. It can be clearly observed in the figure that there is an obvious inflection in the curve near the ultimate bearing capacity, which indicates that after the stud reaches the yield, the load continues to increase, and the tensile strain on the ECC surface increases rapidly.
Figure 8 shows the comparison of the ECC surface load–strain curves when the studs with different heights are loaded as variables, from which we can see the effect of stud length on the ECC’s surface strain. It is clear that the 35 mm length pegs cause more tensile stress to the ECC surface than the 28 mm length pegs. Considering the influence of the length of the peg on the bias of the ECC board, the 28 mm peg is more prone to eccentric compression, so the resulting tensile strain is smaller, while the 35 mm peg is more prone to axial compression, resulting in larger tensile stress.

3.3.3. Reinforcement Load–Strain Analysis

The load–strain curve of the steel bar is shown in Figure 9, and the load–strain curve can be divided into three stages. The first stage is the linear elastic stage from loading to the ECC crushed by cracks, and the strain of the steel bar increases slowly; the second stage is when the ECC is crushed until the steel bar yields, and the steel bar strain increases rapidly with the increase in load; and the third stage is when the steel bar enters into yield until the stud is sheared. In this stage, the growth rate of the strain with the load is much greater than that of the elastic stage, and the load–strain curve of the steel bar is still close to a straight line.
Figure 9a shows that when the spacing and length of the bolts are certain, the rate of increase in the reinforcement strain slows down with the increase in the bolt diameter. The internal reinforcement of the 13 mm diameter stud member reaches the ultimate load when it is still in the elastic deformation stage, and the loss of the load-carrying capacity of the member leads to the unloading of the reinforcement. The curve is in accordance with Hooke’s law. The load–strain curves of the 16 mm and 19 mm diameter stud members are in accordance with the normal variation, and the strain of the reinforcement continues to grow after the member reaches the ultimate load-carrying capacity due to the high-ductility characteristics of the ECC’s material properties; the 22 mm diameter stud member showed a sudden decrease in strain after the load reached the ultimate load, indicating that the strain of the reinforcing steel had a large return after the peg near the reinforcing steel was cut, although the load capacity of the member was not completely lost. Figure 9b shows that when the bolt diameter is certain, the load–strain curves of the specimens with different bolt spacing and lengths are the same, in the early stage of loading, the strain of the reinforcement grows slowly, and when the test force reaches 80% of the ultimate load, the strain of the reinforcement increases sharply until the bearing capacity of the specimen is lost.

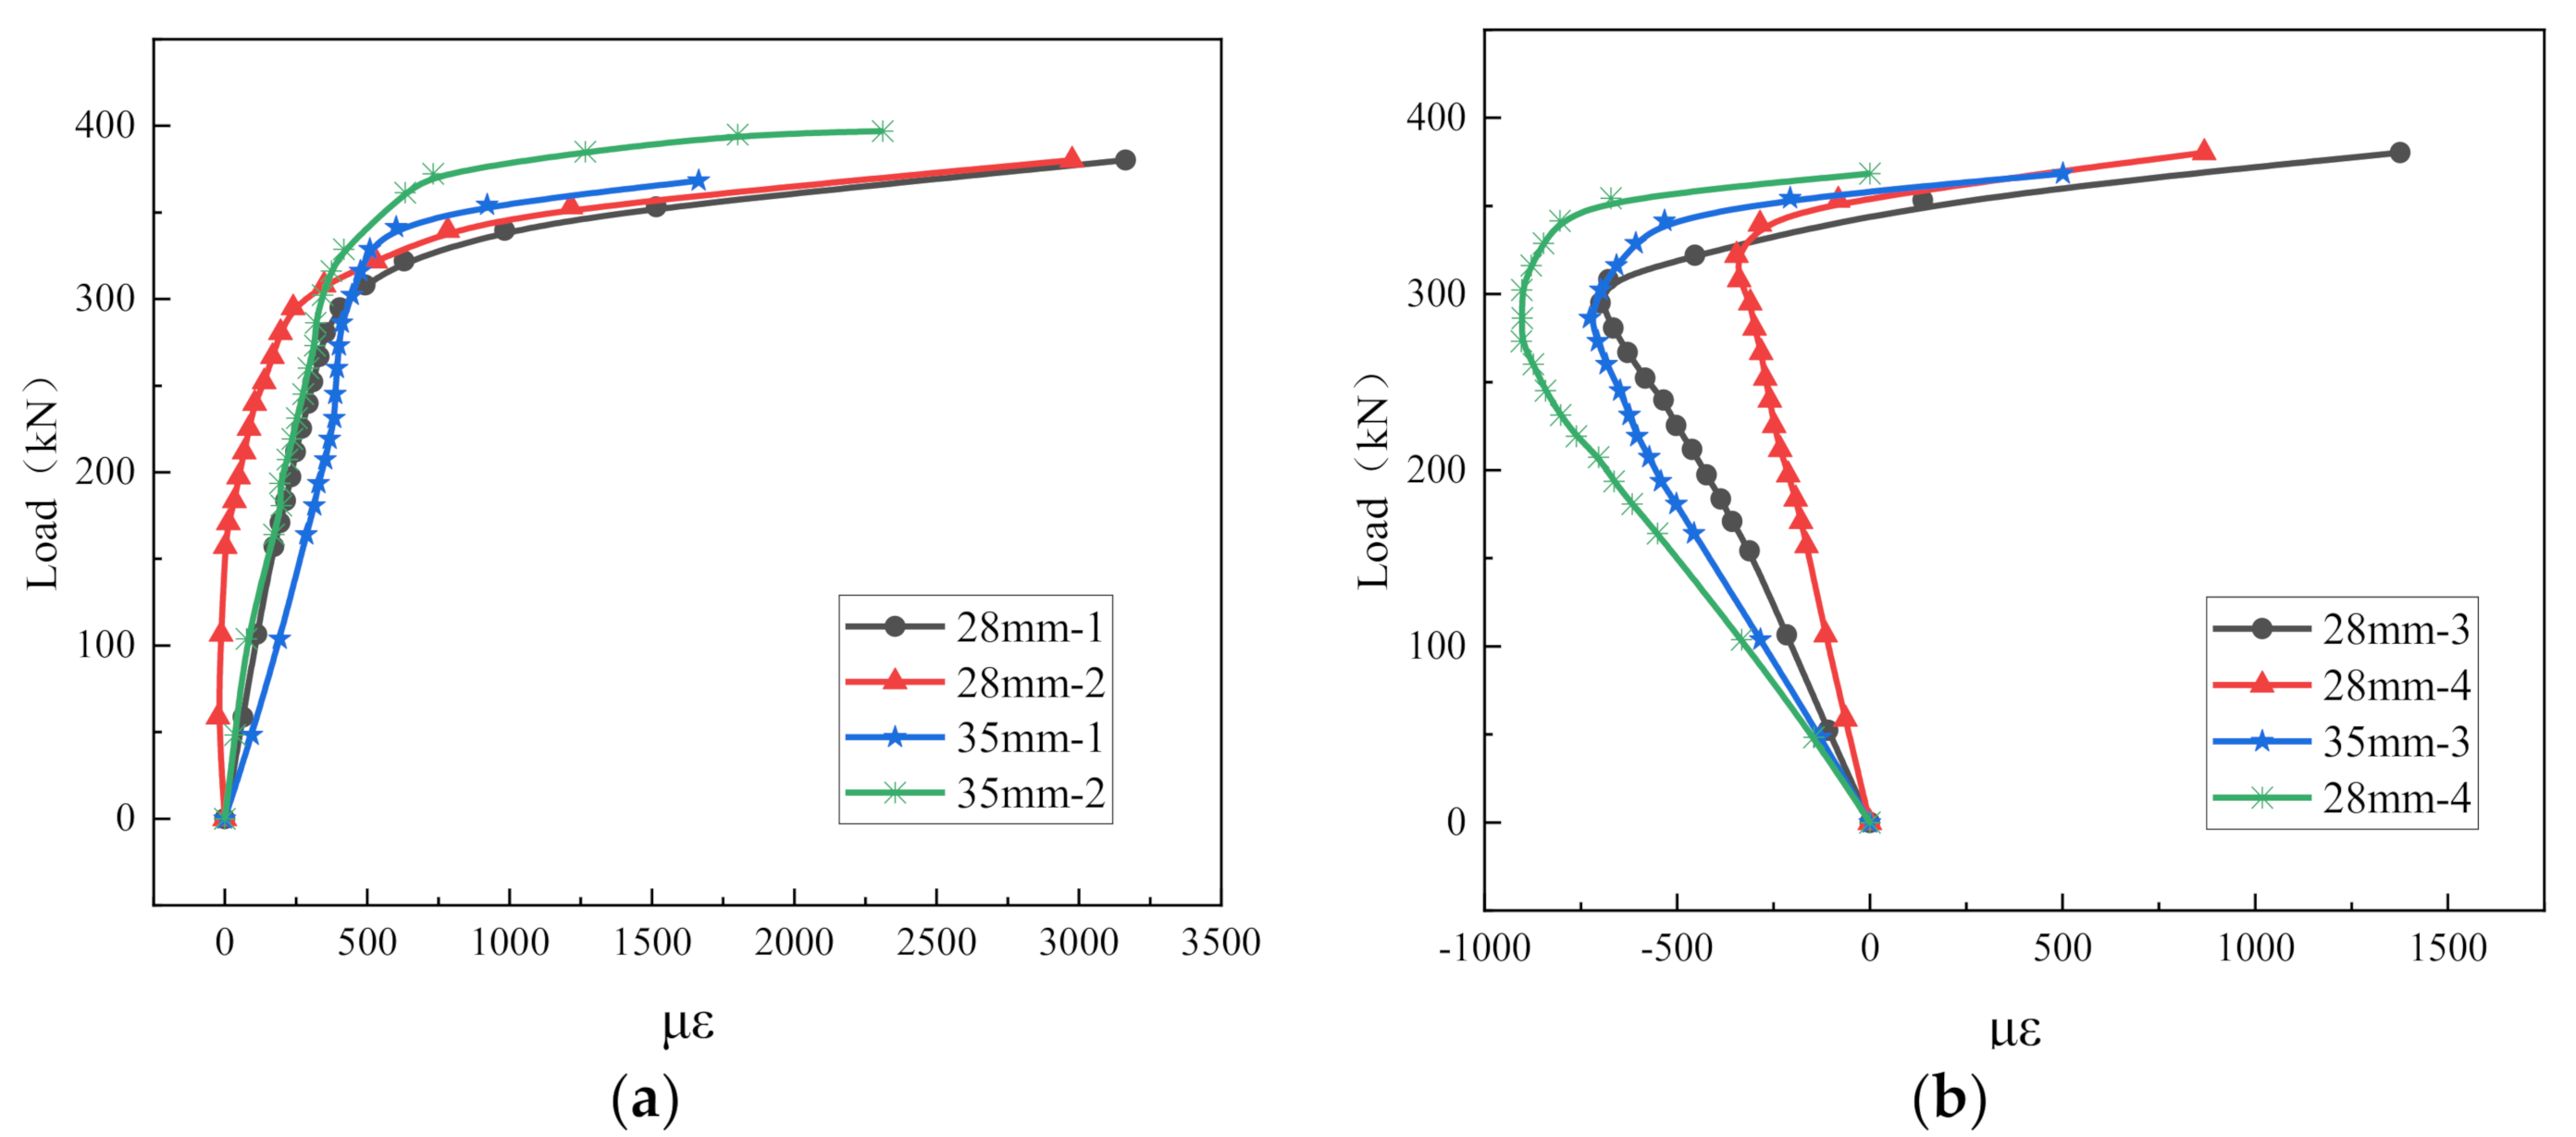
3.3.4. Steel Plate Load–Strain Analysis

In Figure 10, the load–strain curve of the steel plate shows that the steel plate is basically in the linear elastic stage without obvious turning during the whole loading process. From the load-strain curve in the figure, the steel plate is in the first layer of load transfer, and there is no complicated stress state. In the bridge structure of the concrete–steel composite deck, the steel plate is mainly designed to bear the frontal bending moment, and the force exerted by the test loading device occurs on the cross-section of the steel plate, which is far from the tendency of the steel plate to yield.

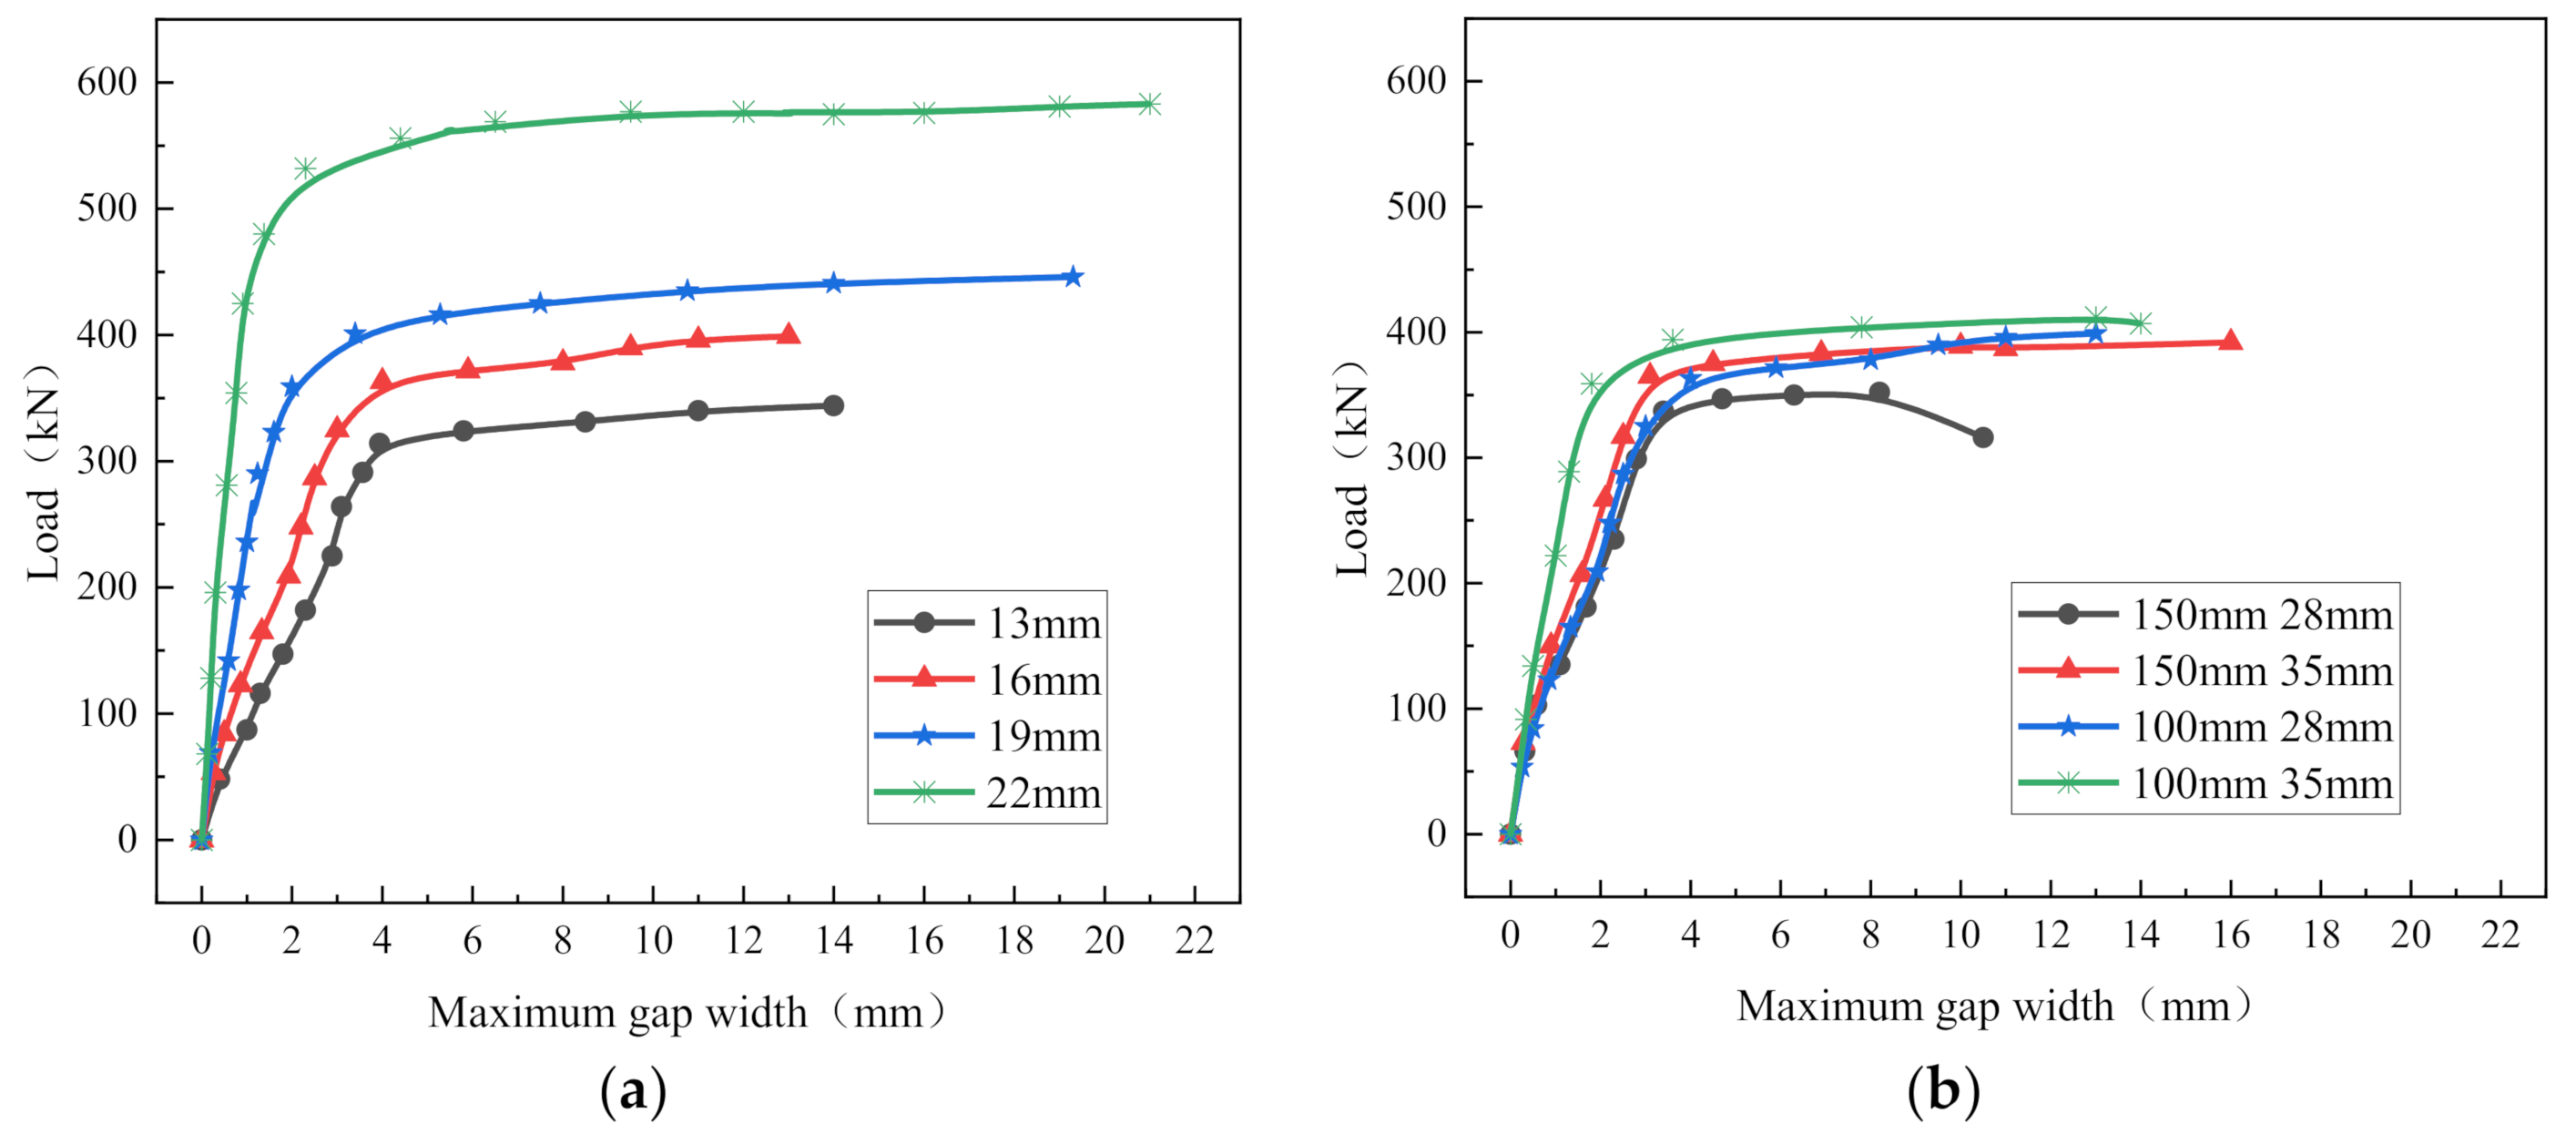
3.4. Interfacial Gap Expansion Law

During the experiment, the loading device transmits the load on the H-beam to the ECC plate through the peg, and the center point of the resultant force transmitted by the ECC plate from the peg depends on the height of the peg, which is often not in the center of the ECC plate, so the eccentric moment caused the ECC plate to separate from the H-shaped steel plate. The load-gap curve of Figure 11 is obtained by observing and measuring the width of the separation at the interface between the steel plate and the ECC plate during loading. As can be seen from Figure 11, the gap width of the ECC–plate interface increases with the increase in the load, and the gap width increases rapidly when loaded to the ultimate force, while the load gradually tends to be stable at this time. When the gap width is less than 4 mm, the gap increases slowly with the increase in the load, and all parts of the member are in the elastic stage; when the gap width is more than 5 mm, the load basically remains unchanged, but the gap width still increases, and some parts of the member have started to become damaged, which also fully reflects the high-ductility characteristics of ECC.

4. Conclusions

In this work, 16 push-out specimens were designed and fabricated, and the parameters of failure mode, load-relative slip, stud strain, ECC surface strain, steel bar strain, steel plate strain and interface gap were tested and observed. The conclusions of this work are as follows:
(1)
The load–slip curves of ECC-bolt composite specimens have common characteristics, and the curves can be roughly divided into the elastic stage, elastoplastic stage and plastic stage. The short stud is used as a force-transmitting connector in the ECC plate, and the shear force between the steel plate and the ECC mainly produces two failure modes, namely, the shearing of the bolt and the shearing of the weld at the root of the stud. The ECC plate has a local crushing area at the root of the interface stud, and no large cracks are generated in the rest area, which reflects the characteristics of high ductility.
(2)
The shear bearing capacity of short studs in ECC was significantly affected by the stud diameter, while it was less affected by the stud height and spacing. The larger the diameter of the stud, the greater the shear capacity, but the relative slip of the peak value decreases with the increase in the diameter, that is, the ductility of the component decreases relatively. For peg members of the same diameter, the ultimate bearing capacity is slightly larger if the spacing between the pegs is slightly smaller.
(3)
The stud load–strain curve exhibits a two-segment linear relationship, and there is no transition segment. Therein, increasing the height of the pegs increases the bearing capacity and increases the ductility of the pegs.
(4)
The height of the stud has an important influence on the force on the surface of the ECC board. The longer the peg, the greater the tensile stress on the ECC surface; the shorter the peg, the more inclined the ECC plate is to be compressed eccentrically; and the longer the peg, the more inclined to be compressed axially.
(5)
For this work, the best load capacity of the specimen with 22 mm diameter, 100 mm spacing and 35 mm height of the bolts was found. The parameters studied in this paper are relatively few, and more parameters (such as ECC layer thickness, reinforcement arrangement and weld form) should be considered for the subsequent study on the effect of the shear performance of the pins.

Author Contributions

Conceptualization, C.L. and Z.C.; methodology, Z.C.; validation, Z.Z., S.W. and Y.L. (Yigang Lv); formal analysis, Z.Z.; investigation, Y.L. (Yigang Lv); re-sources, Z.C. and Z.Z.; data curation, Z.Z. and S.W.; writing—original draft preparation, Z.Z. and Y.L. (Yan Liu); writing—review and editing, Z.C. and Y.L. (Yan Liu); visualization, Y.L. (Yigang Lv); supervision, C.L.; project administration, Z.Z.; funding acquisition, Z.C. All authors have read and agreed to the published version of the manuscript.

Funding

This research was funded by the National Natural Science Foundation of China through Grant No. 51708047, 51778069 and 51978081; the Natural Science Foundation of Hunan Province through Grant No. 2019JJ50670; and the Excellent youth project of Hunan Provincial Department of Education through Grant No. 19B013.

Institutional Review Board Statement

Not applicable.

Informed Consent Statement

Not applicable.

Data Availability Statement

The data used to support this study are available from the corresponding author upon request.

Acknowledgments

We would like to thank the reviewers for their valuable suggestions.

Conflicts of Interest

The authors declare that they have no conflict of interest.

References

  1. Jiang, F.; Ji, B.; Fu, Z.; Yao, Y. Effect of Weld Profiles on Fatigue Performance of Deck to U-Rib Weld in Orthotropic Steel Deck. Iran. J. Sci. Technol. Trans. Civ. Eng. 2021. prepublish. [Google Scholar] [CrossRef]
  2. Wang, Y.; Shao, X.; Shen, X.; Cao, J. Static and fatigue tests of steel strip-UHPC composite bridge deck structures. Chin. J. Highw. 2021, 34, 261–272. [Google Scholar]
  3. Liu, Y.; Wang, Z.; Lu, N.; Wang, H. Analysis of Through-Type Fatigue Crack Growth Characteristics of Orthotropic Steel Bridge Deck. Highw. Eng. 2021, 23, 1–10. [Google Scholar]
  4. Jiang, F.; Ding, Y.; Song, Y.; Geng, F.; Wang, Z. Digital Twin-driven framework for fatigue life prediction of steel bridges using a probabilistic multiscale model: Application to segmental orthotropic steel deck specimen. Eng. Struct. 2021, 241, 112461. [Google Scholar] [CrossRef]
  5. Huang, R.; Zhang, H.; Cui, L. Research status of fatigue test of steel bridge deck system full-scale structures. Low Temp. Build. Technol. 2021, 43, 91–95. [Google Scholar]
  6. Guo, Z.; Xu, H.; He, X. Analytical Analysis Method of Wheel Load Lateral Effect of Orthotropic Steel Bridge Deck. Chin. J. Comput. Mech. 2021, 76, 1–9. [Google Scholar]
  7. Emara, M.; Mohamed, H.A.; Rizk, M.S.; Hu, J.W. Behavior of ECC columns confined using steel wire mesh under axial loading. J. Build. Eng. 2021, 43, 102809. [Google Scholar] [CrossRef]
  8. Yuan, W.-Y.; Han, Q.; Bai, Y.-L.; Du, X.-L.; Yan, Z.-W. Compressive behavior and modelling of engineered cementitious composite (ECC) confined with LRS FRP and conventional FRP. Compos. Struct. 2021, 272, 114200. [Google Scholar] [CrossRef]
  9. Zheng, A.; Liu, Z.; Li, F.; Li, S. Experimental investigation of corrosion-damaged RC beams strengthened in flexure with FRP grid-reinforced ECC matrix composites. Eng. Struct. 2021, 244, 112779. [Google Scholar] [CrossRef]
  10. Yang, X.; Xu, L.; Pan, J. Mechanical behavior of full-scale composite steel plate shear wall restrained by ECC panels. J. Build. Eng. 2021, 44, 102864. [Google Scholar] [CrossRef]
  11. Li, V.C. Performance driven design of fiber reinforced cementitious composites. In Proceedings of the International Symposium on Fibre Reinforced Cement and Concrete, Sheffield, England, 20–23 July 1992; Volume 12. [Google Scholar]
  12. Liu, Y.; Zhong, Y.; Zhao, Z.; Li, B.; Deng, B. Research on the Preparation Theory and Technology of High Strength and Tough ECC Materials. Met. World 2018, 1, 20–22. [Google Scholar]
  13. Guo, L.; Chen, Z.; Chen, B.; Yang, Y. Adaptive Design Theory and Reliability Verification of Eco-Type High-ductility Cementitious Composites I: Adaptive Design Theory. Mater. Rev. 2019, 33, 744–749. [Google Scholar]
  14. Mustafa, S.; Gurkan, Y.; Tahir, K.E. Self-healing capability of cementitious composites incorporating different supplementary cementitious materials. Cem. Concr. Compos. 2013, 35, 89–101. [Google Scholar]
  15. Sahmaran, M.; Li, M.; Li, V.C. Transport Properties of Engineered Cementitious Composites under Chloride Exposure. ACI Mater. J. 2007, 104, 604–611. [Google Scholar]
  16. Fan, J.; Liu, R.; Zhang, J.; Yang, S.; Ai, Z. Experimental Study on Negative Moment Performance of Laminated Slab Composite Beams Using Hybrid Fiber ECC. Chin. J. Civ. Eng. 2021, 54, 57–67. [Google Scholar]
  17. Zhang, S.; Li, F.; Shao, X. Theory and design method of interface shear resistance of steel-UHPC composite bridge deck. Highw. Eng. 2021, 46, 157–163. [Google Scholar]
  18. Zhang, W.; Wang, Y.; Rong, R.; Bi, Y.; Song, J. Experimental study on flexural performance of steel-ECC composite bridge deck structure based on steel mesh connection. Highw. Traffic Technol. 2020, 36, 80–85. [Google Scholar]
  19. Al-Tayeb, M.M. Effect of Olive Biomass Ash (OBA) as Cement Replacement in Performance of Polyvinyl Alcohol Engineered Cementitious Composite (ECC-PVA). J. Environ. Earth Sci. 2020, 10, 63–71. [Google Scholar]
  20. Fang, Y.; Mengcheng, C.; Jinlong, P. Experimental study on seismic behaviours of hybrid FRP–steel-reinforced ECC–concrete composite columns. Compos. Part B 2019, 176, 107272. [Google Scholar]
  21. Zheng, X.; Zhang, J. Bending performance of high-strength ECC-steel composite beams considering shrinkage. In Proceedings of the 13th Symposium on High Performance Concrete, Tangshan, China, 26 July 2019. [Google Scholar]
  22. Guan, Y.; Wu, J.; Sun, R.; Zhang, H.; Hu, Y.; Wang, F. Transverse Flexural Behaviour of Steel-Engineering Cementitious Composites (ECC) Composite Deck under Negative and Positive Bending Forces. KSCE J. Civ. Eng. 2021, 25, 2962–2973. [Google Scholar] [CrossRef]
  23. Li, V.C. Research progress and application of high ductility fiber-reinforced cementitious composites. J. Silic. 2007, 4, 531–536. [Google Scholar]
  24. Bruno, T. Fatigue and Static Strength of Stud Shear Connectors. J. Proc. 1959, 55, 1287–1302. [Google Scholar]
  25. Im, V. Investigation of stud shear connector for composite concrete and steel T-beams. J. Am. Concr. Inst. 1956, 52, 875–892. [Google Scholar]
  26. Shao, X.; Li, M.; Cao, J.; He, G.; Chen, Y.; Zhao, X. Experimental and theoretical analysis on shear performance of UHPC medium and short studs. Chin. J. Highw. 2021, 34, 191–204. [Google Scholar]
Figure 1. Dimensions and structure of the specimen (unit: mm): (a) Elevation; (b) Side view.
Applsci 12 02685 g001
Figure 2. Static loading device: (a) Push-out specimen; (b) Specimen loading.
Applsci 12 02685 g002
Figure 3. Schematic diagram of displacement gauge and strain gauge location: (a) Elevation view; (b) Side view.
Applsci 12 02685 g003
Figure 4. Physical map of the position of the strain gauge.
Applsci 12 02685 g004
Figure 5. The damage of the specimen: (a) Steel plate surface; (b) ECC surface.
Applsci 12 02685 g005
Figure 6. Load-relative slip curve of specimen: (a) 13 mm diameter peg; (b) 16 mm diameter peg; (c) 19 mm diameter peg; (d) 22 mm diameter peg; (e) 100 mm spacing, 28 mm length studs; (f) 100 mm spacing, 35 mm length studs; (g) 150 mm spacing, 28 mm length studs; (h) 150 mm spacing, 35 mm length studs.
Applsci 12 02685 g006aApplsci 12 02685 g006b
Figure 7. Stud load–strain curve: (a) 13 mm diameter peg; (b) 16 mm diameter peg; (c) 19 mm diameter pegs; (d) 22 mm diameter peg; (e) 100 mm spacing, 28 mm length studs; (f) 100 mm spacing, 35 mm length studs; (g) 150 mm spacing, 28 mm length studs; (h) 150 mm spacing, 35 mm length studs.
Applsci 12 02685 g007aApplsci 12 02685 g007b
Figure 8. ECC surface load–strain curve of 16 mm stud and 100 mm spacing specimen: (a) Upper measuring points (1, 2 measuring points); (b) Lower measuring points (3, 4 measuring points).
Applsci 12 02685 g008
Figure 9. Reinforcing bar load–strain curve: (a) 150 mm spacing, 35 mm length stud specimen; (b) 16 mm stud.
Applsci 12 02685 g009
Figure 10. Load–strain curve of steel plate: (a) 150 mm stud spacing, 35 mm length; (b) 16 mm stud.
Applsci 12 02685 g010
Figure 11. Steel–ECC top interface load–gap width curve: (a) 100 mm pitch, 35 mm length studs; (b) 16 mm studs.
Applsci 12 02685 g011
Table 1. The grouping of the test specimens.
SymbolQuantityDiameter
ds/mm
High
hs/mm
Spacing
L/mm
STUD111328100
STUD211328150
STUD311335100
STUD411335150
STUD511628100
STUD611628150
STUD711635100
STUD811635150
STUD911928100
STUD1011928150
STUD1111935100
STUD1211935150
STUD1312228100
STUD1412228150
STUD1512235100
STUD1612235150
Table 2. Basic properties of ECC concrete.
Compressive Strength/MPaFlexural Strength/MPaTensile Strength/MPaElastic Modulus/GPaPoisson’s Ratio
5023.4534.50.2
Table 3. Characteristic parameters of fibers in ECC.
Fiber TypeLength/mmDiameter/μmElastic Modulus/GPaTensile Strength/MPaVolume Content
Polyvinyl alcohol fiber12143615502.5%
Table 4. Mechanical properties of steel materials.
Type of SteelElastic Modulus/GPaYield Strength/MPaTensile Strength/MPaRemark
Q345H
section steel
206372520Test value
HRB40
steel bar
192465576Test value
13 mm pegs206300370Manufacturers provide
16 mm pegs206300370Manufacturers provide
19 mm pegs206300370Manufacturers provide
22 mm pegs206300370Manufacturers provide
Table 5. Main results of the test.
SymbolFmax/kNPu/kNδmax/mmDestruction Form
STUD1335.241.93.7Pins sheared, unilateral damage
STUD2331.443.93.4Pins sheared, bilateral damage
STUD3329.041.13.61Pins sheared, unilateral damage
STUD4342.042.73.32Pins sheared, unilateral damage
STUD5327.340.93.1Pins sheared, unilateral damage
STUD6327.040.83.1Pins sheared, bilateral damage
STUD7353.144.12.4Pins sheared, unilateral damage
STUD8333.641.72.8Pins sheared, bilateral damage
STUD9386.948.32.4Weld sheared, unilateral damage
STUD10376.547.02.51Pins sheared, unilateral damage
STUD11401.450.12.2Weld sheared, bilateral damage
STUD12360.545.02.7Pins sheared, unilateral damage
STUD13520.365.02.22Weld sheared, unilateral damage
STUD14381.147.62.1Pins sheared, unilateral damage
STUD15562.070.02.0Weld sheared, unilateral damage
STUD16411.051.32.43Pins sheared, unilateral damage
Note: Fmax is the maximum load of the test loading; Pu is the shear bearing capacity of a single short peg; δmax is the maximum slip measured by the test loading.
Publisher’s Note: MDPI stays neutral with regard to jurisdictional claims in published maps and institutional affiliations.

