Abstract
Glass-fiber-reinforced polymer (GFRP) decks have been widely used in the rehabilitation and construction of bridges as a replacement for conventional deck materials, such as steel, concrete, and wood. In this study, an analysis method for checking the local safety of joints in adhesively connected GFRP decks under bidirectional bending due to traffic wheel loads is newly presented. This method can be applied for designing and evaluating the joints of other FRP decks. The orthotropic material properties of the deck were approximately assumed according to the test results and previous research. Three-dimensional solid elements were used to simulate the local behavior of the adhesive and deck substrates at the joints. Global deflections of the deck and local deformations of the adhesive were evaluated for serviceability. The local stresses in the adhesive and deck substrate are evaluated at the joint to check for local failure modes of the joint under serviceability and ultimate limit states. The analysis results indicate that local failures of the adhesive and deck substrate at the joint occurred. Recommendations for avoiding these local failures and performing more precise analysis are suggested.
1. Introduction
Fiber-reinforced-polymer (FRP) composites are among the most promising alternatives to steel and concrete due to their light weight, high durability, and high strength. Glass-fiber-reinforced polymer (GFRP) decks are of interest because of their economy and applicability to bridges. They have significant advantages over concrete and steel owing to their durability and corrosion resistance. Thus, they have longer service life and lower maintenance costs. Moreover, GFRP decks have significantly lower dead loads than conventional concrete decks owing to their light weight. Therefore, slimmer bridge pier designs can be produced, and existing bridge walkways can be economically expanded, even without retrofitting the substructures. Furthermore, construction is significantly shortened due to the easy installation of FRP decks [1,2,3,4].
When designing a GFRP bridge deck, structural safety and serviceability under bidirectional bending due to design wheel loads should be considered. Generally, GFRP decks have higher strength than normal decks made of steel or reinforced concrete. Therefore, safety requirements are easily satisfied within an adequate factor of safety. However, their low stiffness means that deflection limits under service loads govern the design.
Particularly, the local behavior of adhesive joints in GFRP decks should be investigated because they are the primary cause of pavement cracks and durability problems. Individual pultruded GFRP deck units are connected through adhesive bonding to form a deck system [5]. The improper design of adhesive joints results in excessive deformation at the joints, causing local tensile cracking in the adhesive and reflective cracking in asphalt pavements under service loads [6,7]. Weak axis bending of the deck system significantly affects the behavior of adhesive joints. To the authors’ knowledge, only a few studies on the weak-axis bending of deck systems have been reported, and these did not consider the behavior of the adhesive joints [8,9,10]. Our previous study described the failure modes in the adhesive joints of pultruded GFRP decks under weak-axis bending, including failures of adhesive and deck substrates [11]. Finite element (FE) analyses and tests were conducted on adhesively connected GFRP decks with hollow trapezoidal sections called “Delta Deck TG200” (TG200 hereafter) as beam specimens.
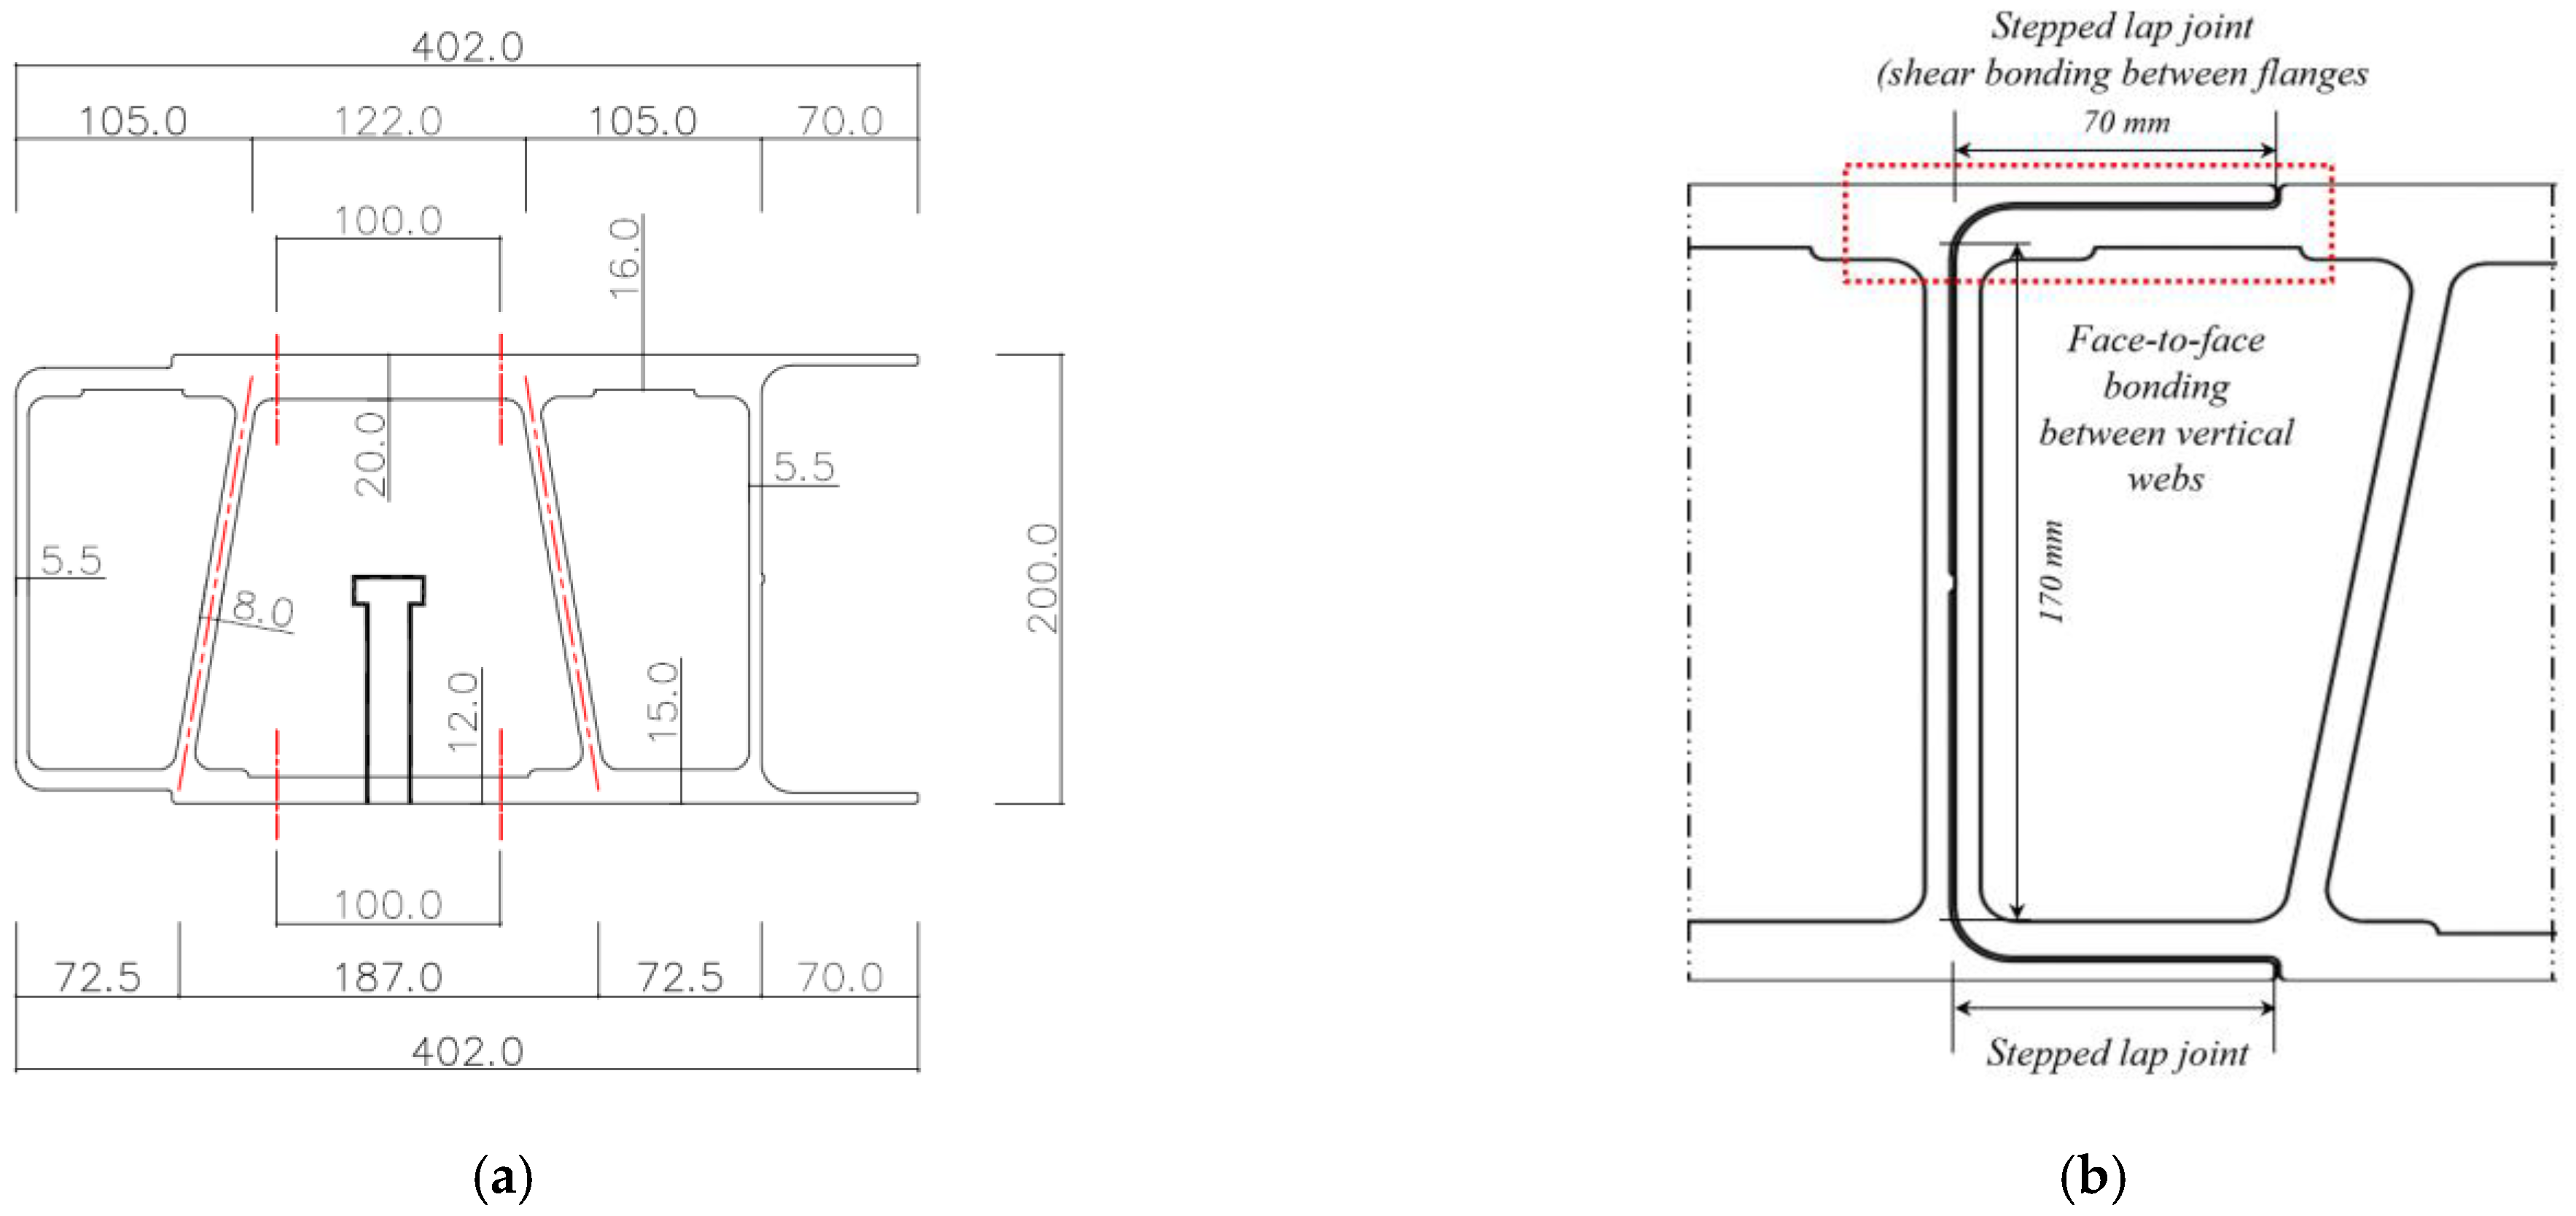
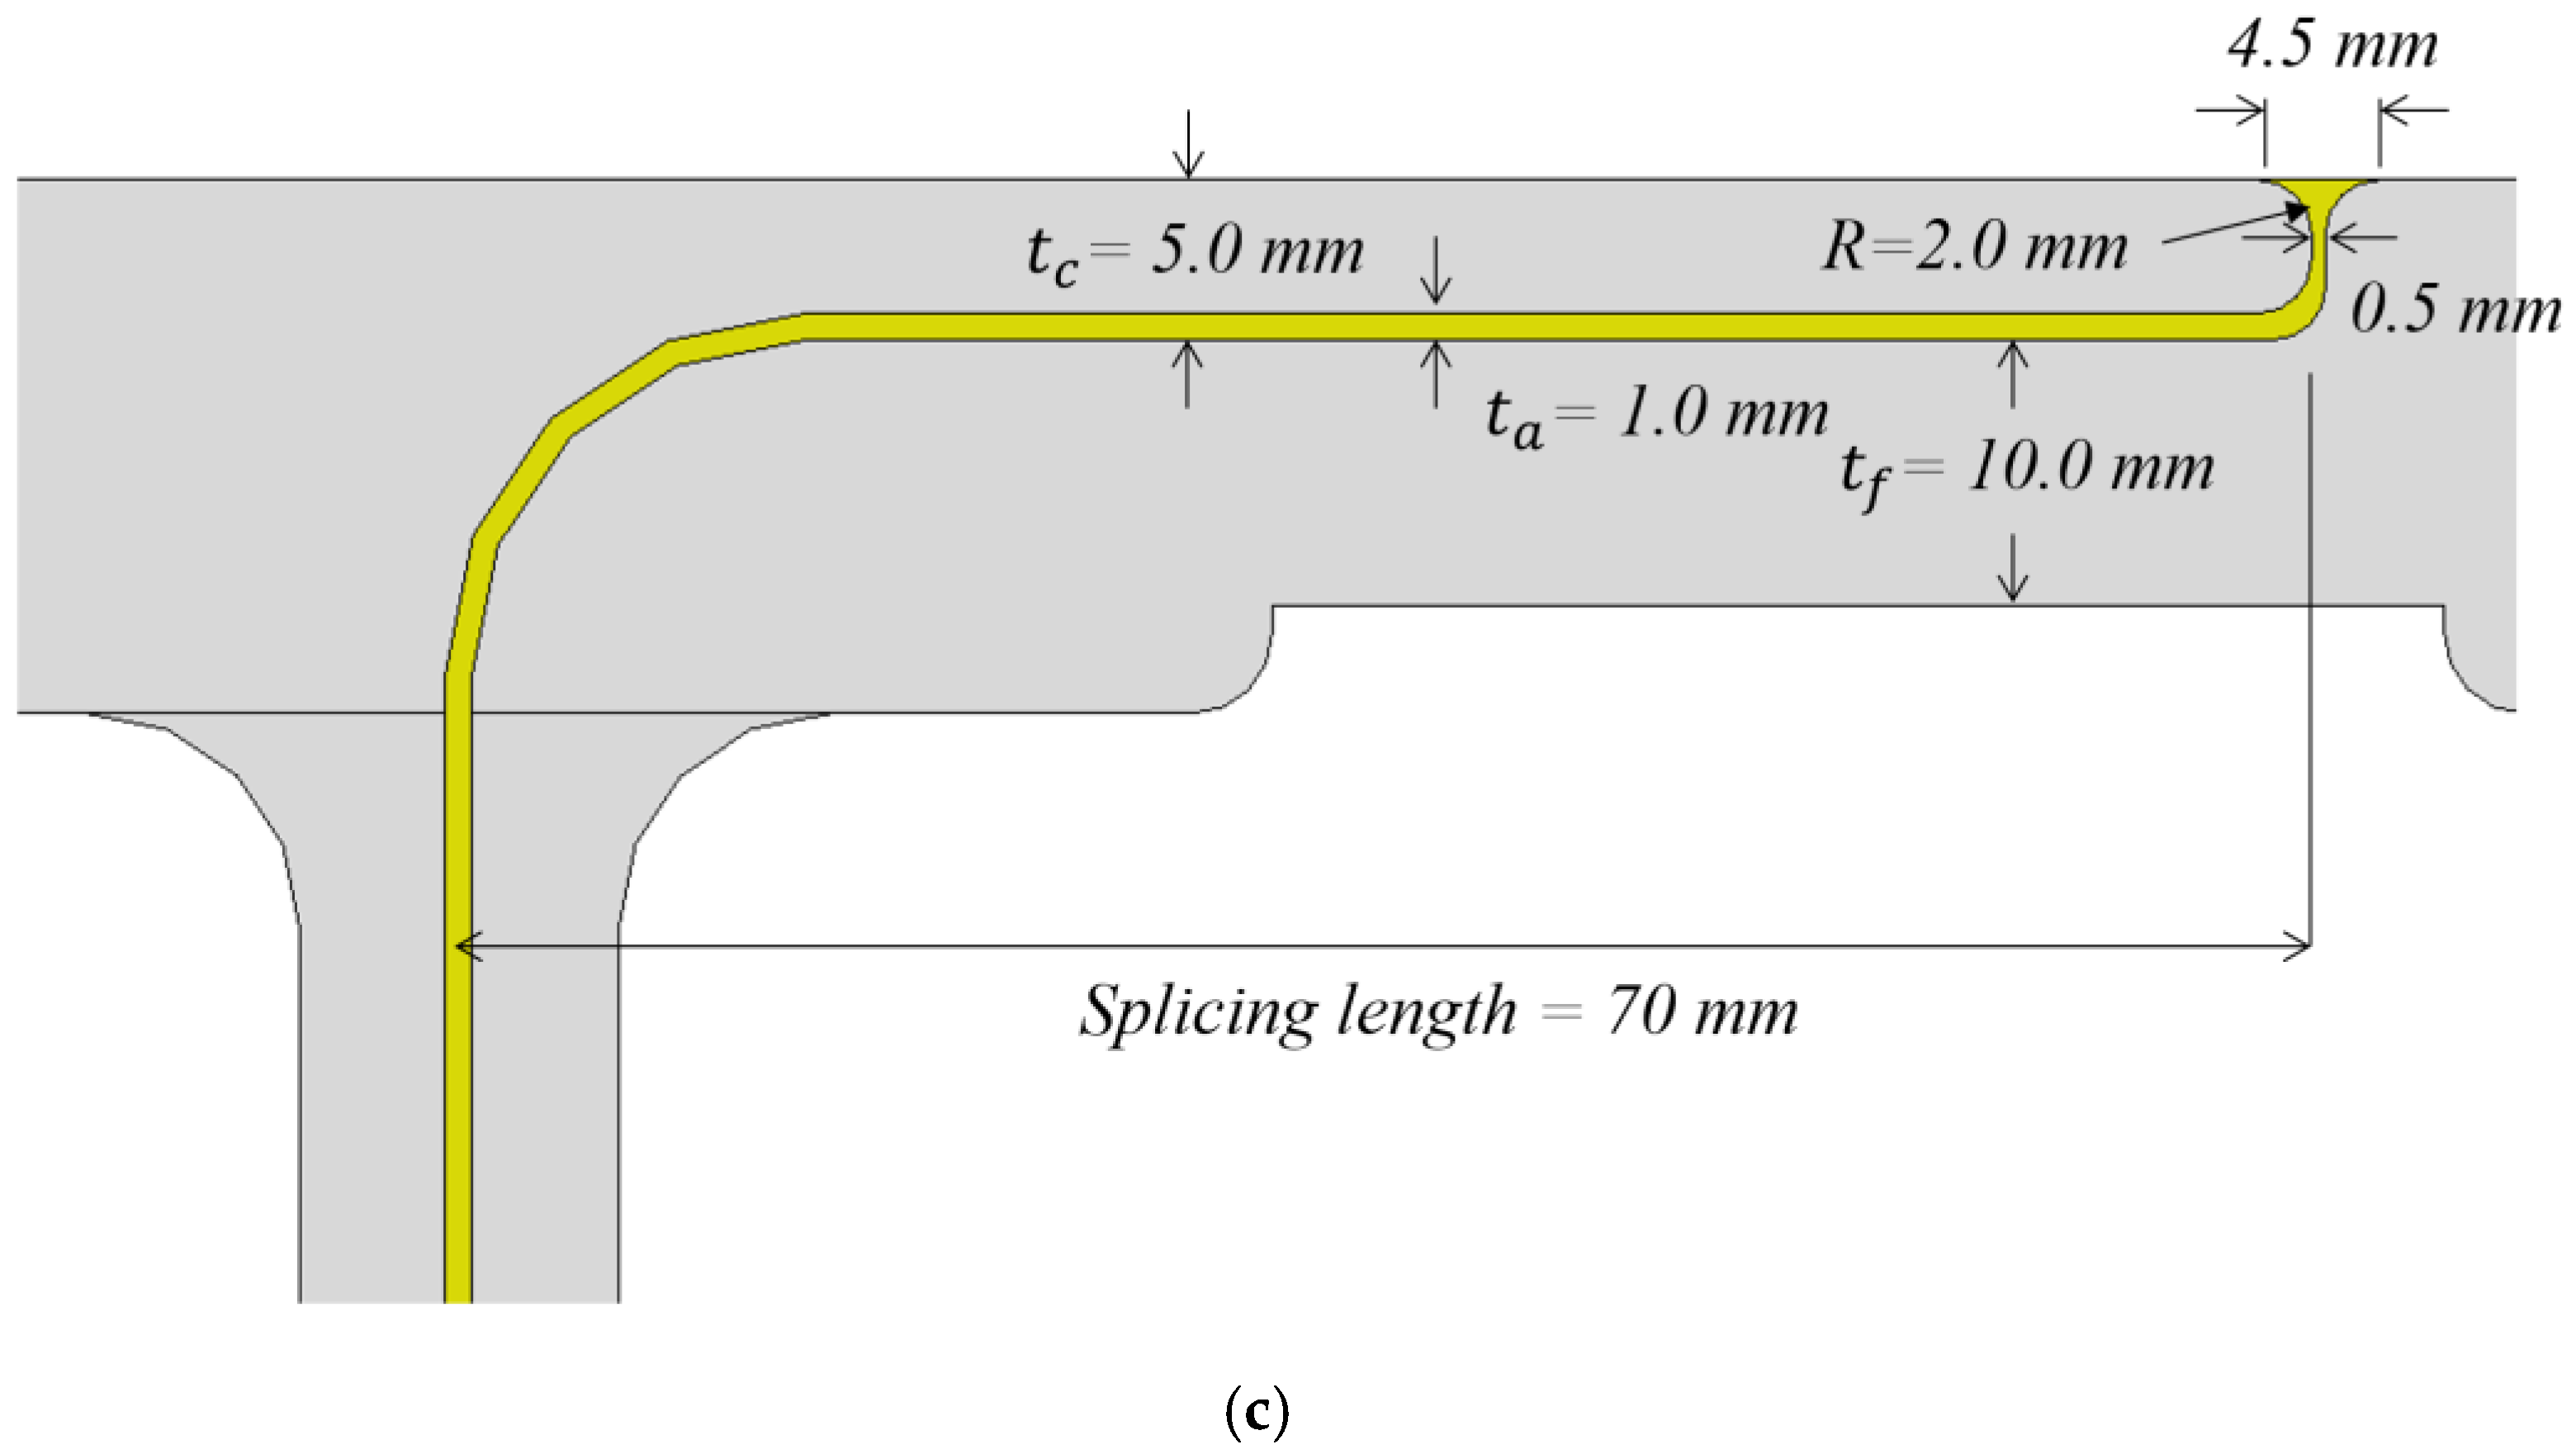
In this study, an FE analysis of an adhesively connected GFRP bridge deck under bidirectional bending due to traffic wheel loads was performed. Three-dimensional solid elements, which simulated the actual shape and material properties of the deck tubes and adhesive layers, were utilized in the FE analyses. To investigate the behavior of the adhesive joints in the deck system, the FE model of a deck system should represent the connection details, such as the joint geometries and material properties, of adhesive and deck substrates. Figure 1 shows the configurations of the section and adhesive layer in TG200. The connections between the TG200 deck tubes had a tongue-and-groove (TG) shape with stepped lap joints. This study describes the requirements for limit state design; introduces a solid-element FE model and the assumed material properties of the deck substrate and adhesive; verifies the serviceability in terms of global deflection of the deck and local deformation of the adhesive joints; and verifies the safety of the adhesive and deck substrate at the joints against the four different failure modes introduced by Park et al. [11]: (1) tensile failure of adhesive at joint edge of bonded flanges (TAF), (2) tensile failure of adhesive between vertical webs (TAW), (3) shear failure of adhesive between flanges (SAF), and (4) failure of deck substrate at discontinuous dimension in section (FSD).
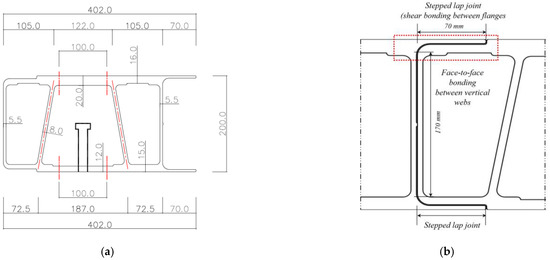
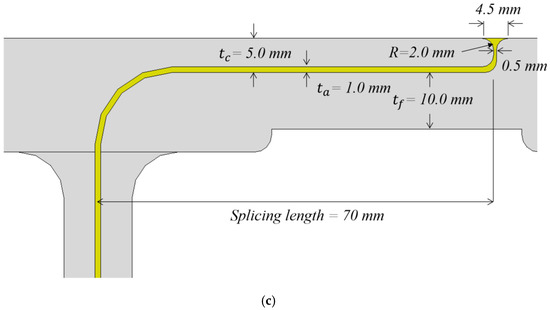
Figure 1.
Configuration of section and adhesive layer in TG200 bridge deck. (a) Section dimensions; (b) stepped lap joint; (c) dimensions of adhesive layer.
2. Limit State Design for a Pultruded GFRP Bridge Deck
To investigate the overall deformations and joint behaviors of a pultruded GFRP bridge deck under design traffic loads, the design criteria for specific limit states should be considered [12]. For bridge systems, these can be categorized as serviceability limit state (SLS), fatigue and fracture limit state, ultimate limit state (ULS), and extreme-event limit state [13]. For the design and analysis of a GFRP bridge deck, SLS and ULS are utilized in determining the load combinations. The former is subjected to unfactored live loads, whereas the latter is subjected to factored live and dead loads. The total factored force effect is calculated as follows:
where , , and denote the load modifier, force effects from loads, and load factors, respectively. The design wheel loads in SLS and ULS are described in Section 2.1 and Section 2.2, respectively, and the partial safety factors applied to the mechanical properties of the deck substrates and adhesive are presented in Section 2.3. After comparing AASHTO LRFD Bridge Design Specifications [13] and the Korean Highway Bridge Design Code for Limit State Design (LSD) [14], the conservative case of the design vehicular live loads is selected.
2.1. Serviceability Limit State (SLS)
In SLS, the combinations of unfactored loads acting under normal operating conditions and wind loads (25 m/s) are utilized. In this load combination, the self-weight of GFRP deck and asphalt pavement is not considered; only the impact factor due to the dynamic effect is considered. Table 1 compares the prescribed design wheel loads and tire contact area in the design standards [13,14].

Table 1.
Design wheel loads in the design standards [13,14].
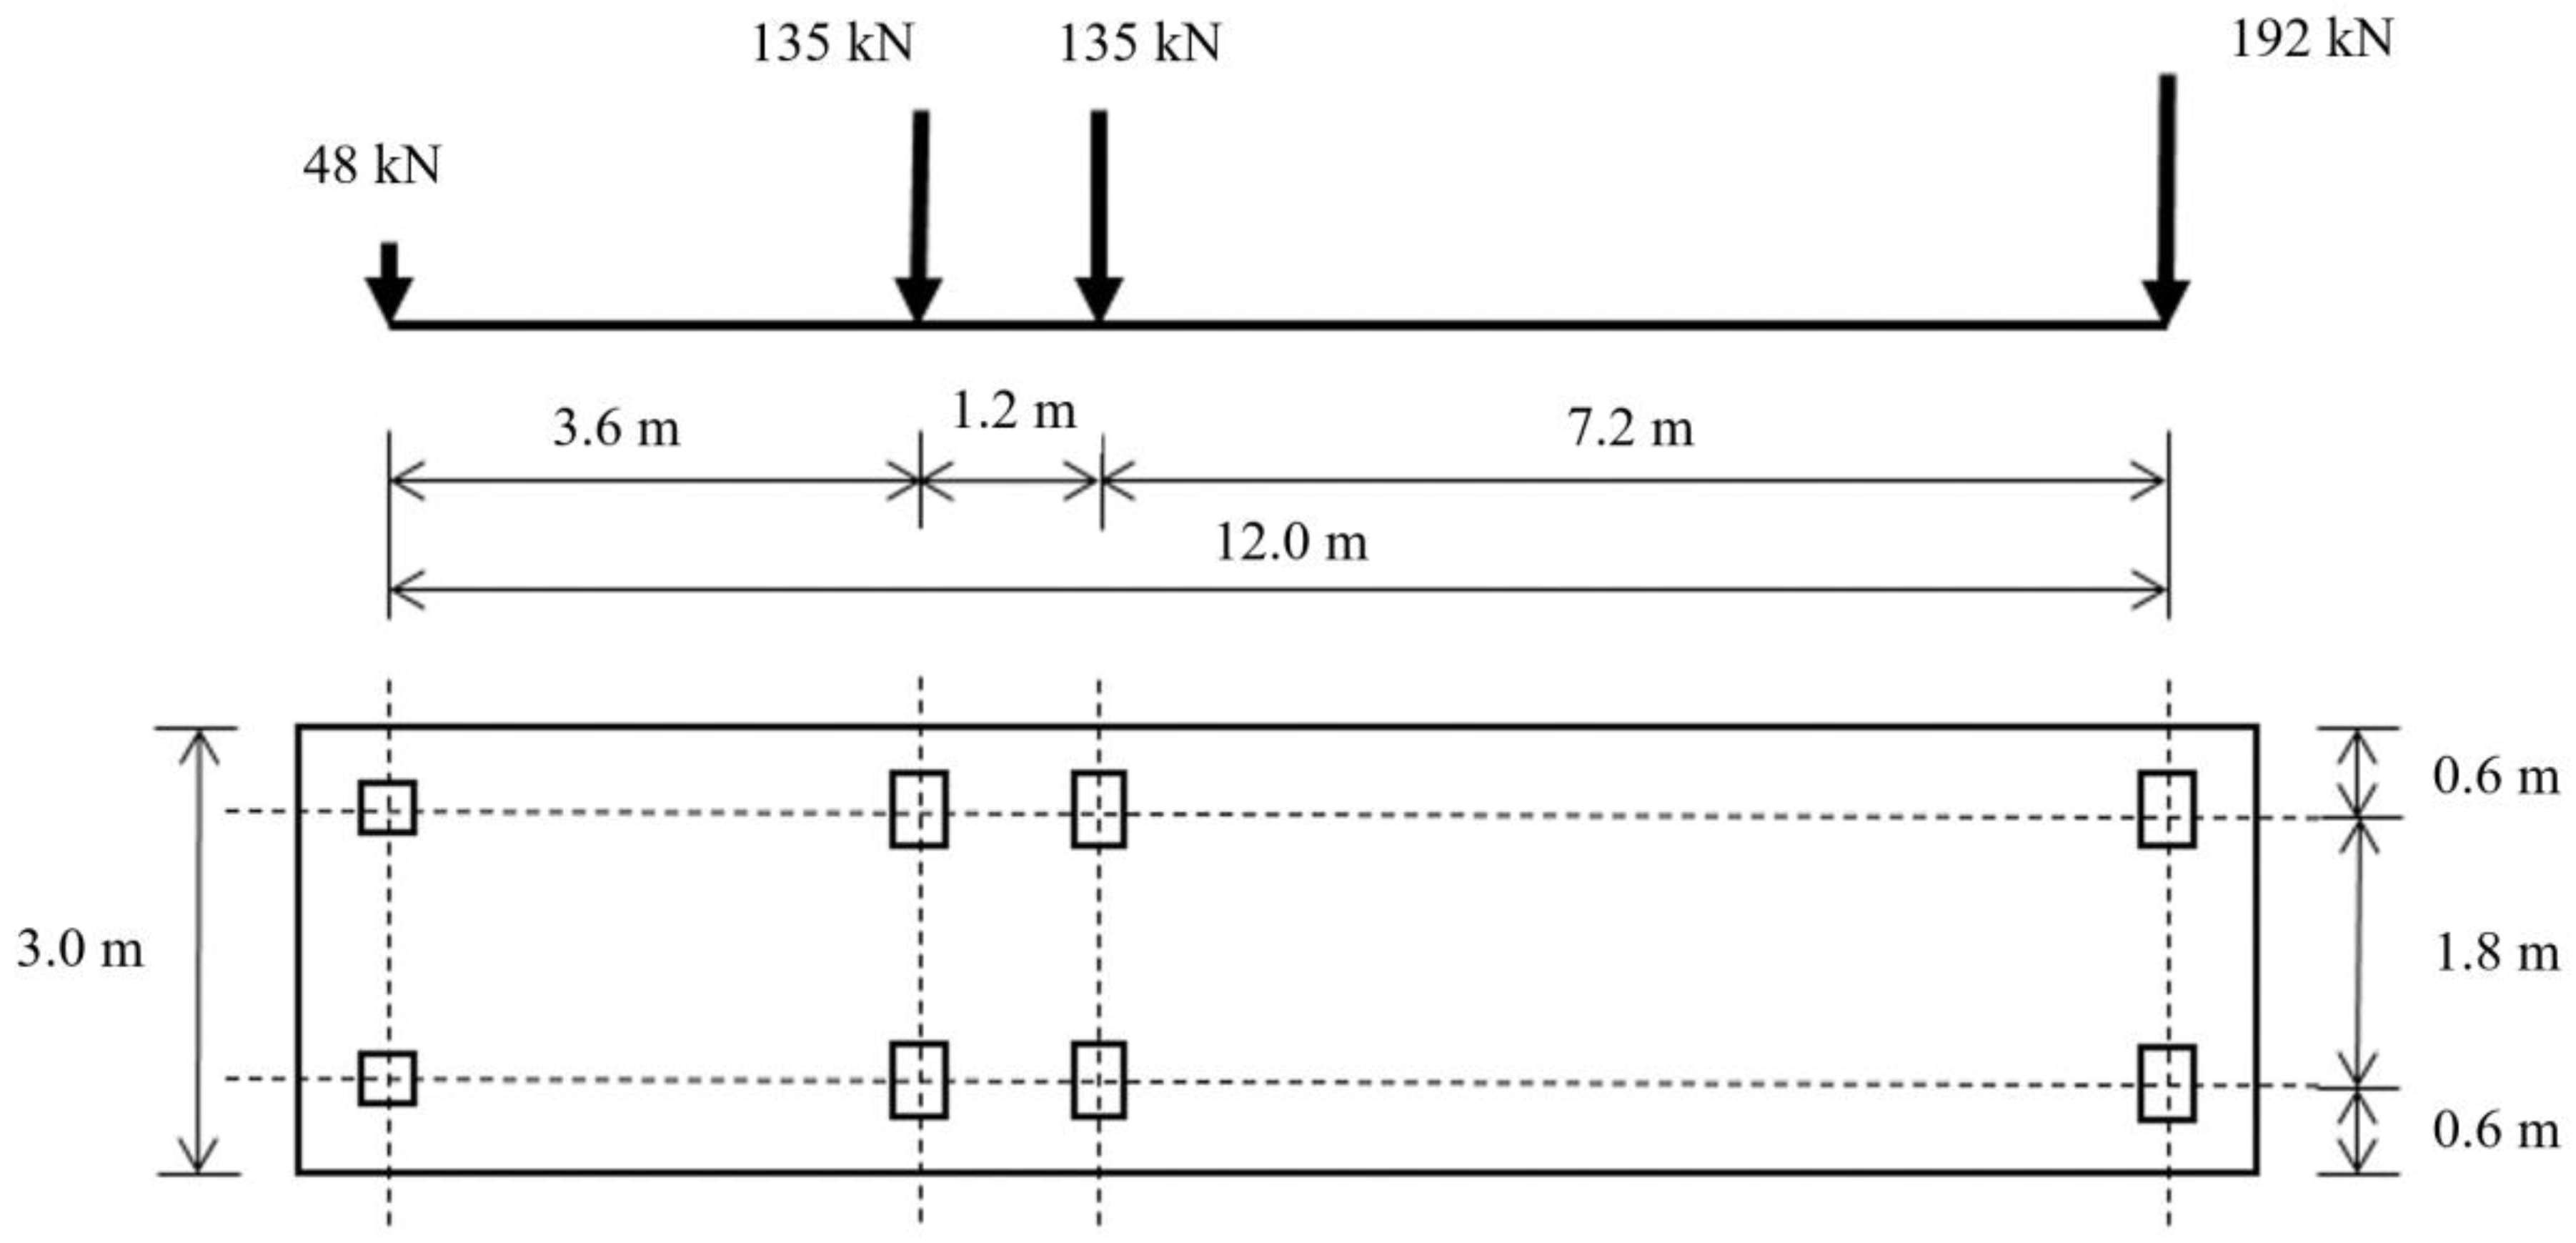
The design truck load (KL-510) of the Korean Highway Bridge Design Code for Limit State Design (LSD) with a 25% impact factor is utilized in the analysis for the GFRP decks. The design single-wheel load of KL-510 is more conservative than that (HL-93) of AASHTO LRFD, as shown in Table 1. Figure 2 shows the design wheel loads of KL-510, where half of the rear axle load is the maximum single-wheel load (96 kN = 192/2 kN). This is increased by a 25% impact factor to 120 kN, as shown in Table 1.

Figure 2.
KL-510 design truck load per Korean Highway Bridge Design Code [14].
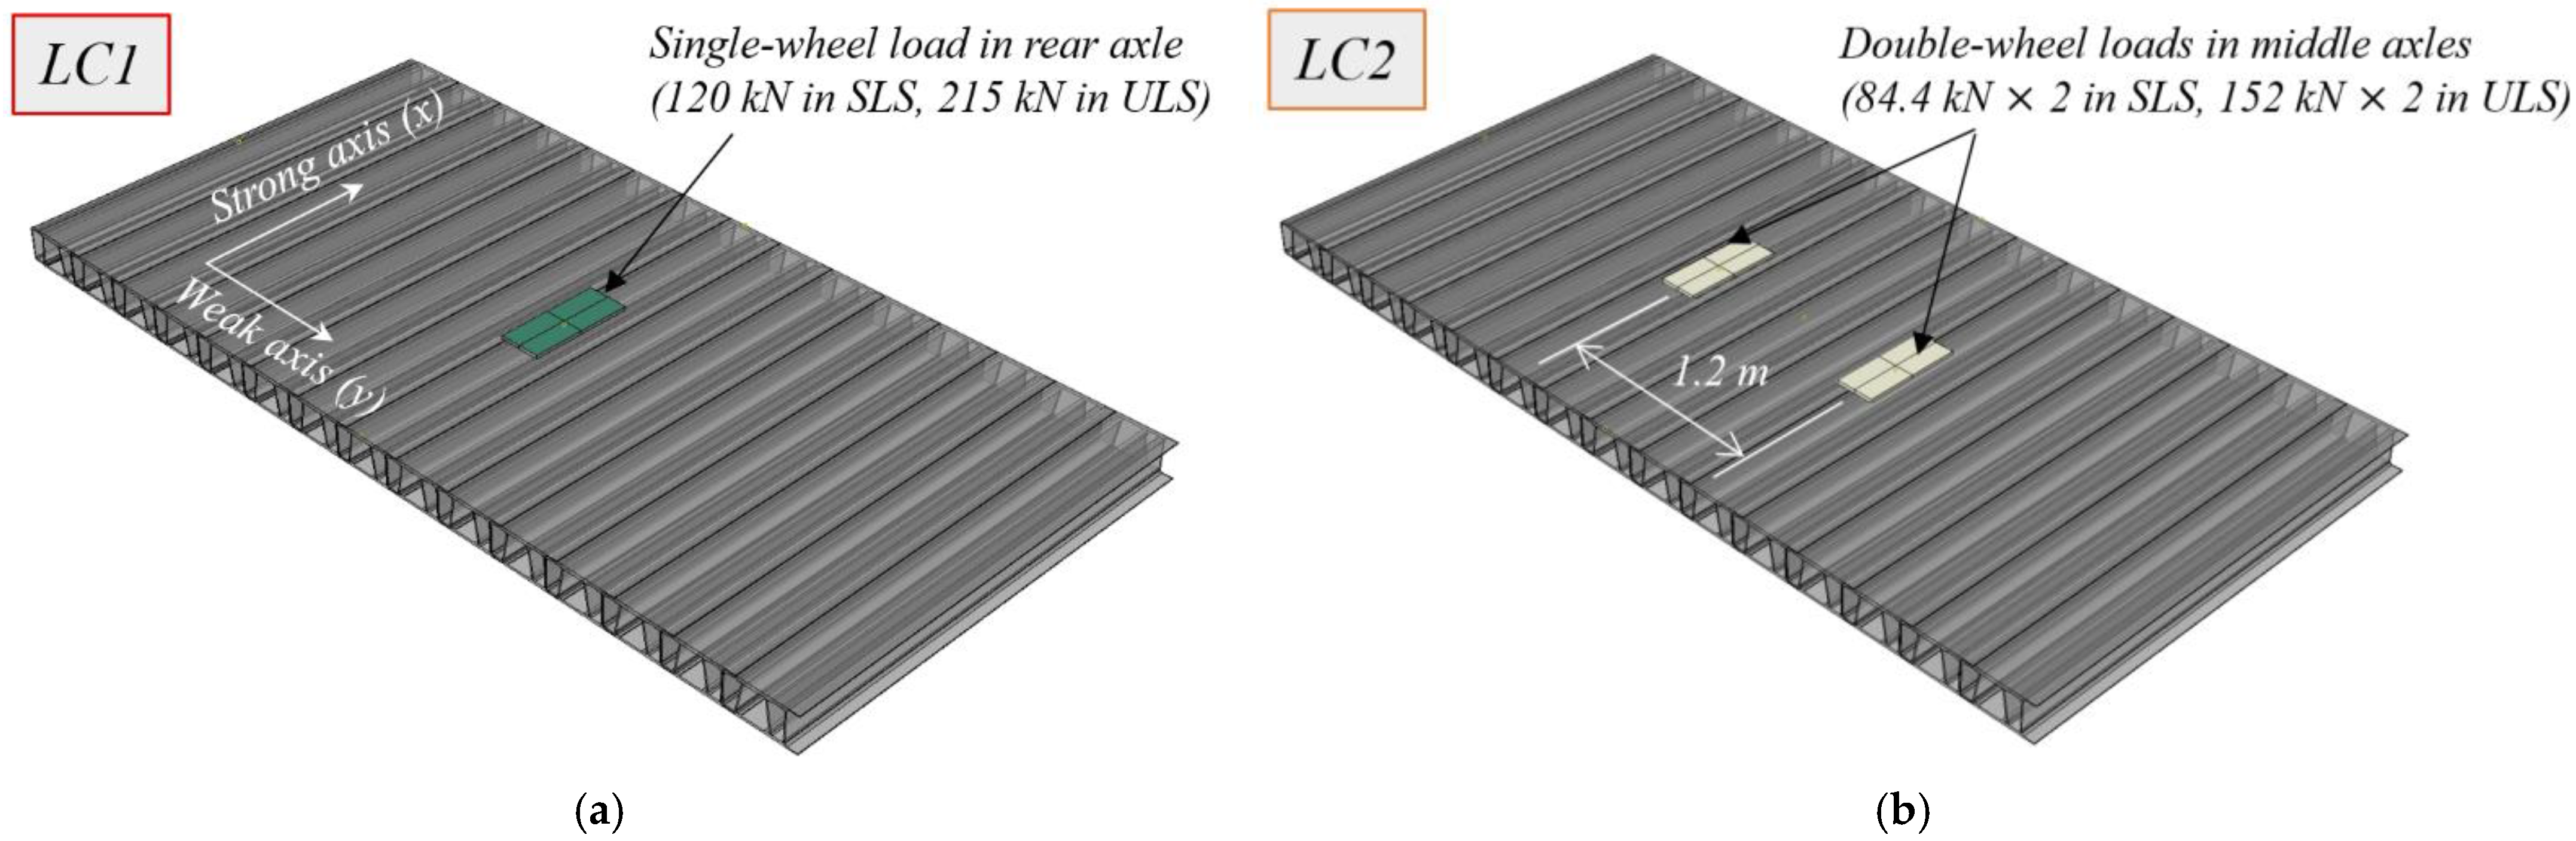
As shown in Figure 3, and according to the Korean Highway Bridge Design Code [14], two loading configurations are considered: (1) the force effect due to a single rear wheel (LC1 hereafter) and (2) the force effect due to two adjacent middle wheels (LC2 hereafter). The LC1 wheel load (120 kN) is distributed over the tire contact area (231 mm long and 577 mm wide) at the top surface of the deck. The two adjacent loads (84.4 kN each) in LC2 are distributed over the tire contact area (each 217 mm long and 540 mm wide) 1.2 m apart, as shown in Figure 2 and Figure 3.
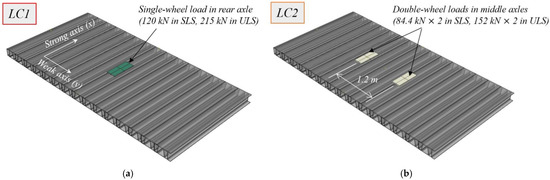
Figure 3.
Load configurations per Korean Highway Bridge Design Code [14]. (a) Load configuration 1 (LC1); (b) load configuration 2 (LC2).
The deflection criteria for GFRP bridge decks in different design standards and related documents are shown in Table 2. As mentioned above, the GFRP deck deflections are calculated via FE analysis and should satisfy these deflection criteria for SLS.
Table 2.
Deflection criteria in various design standards.
2.2. Ultimate Limit State (ULS)
ULS load combinations are prescribed in the bridge design standards [13,14]. These load combinations are used to check safety against the four failure modes of the deck substrate and adhesive. The wind load is omitted from these load combinations in this study. The self-weight of the deck and pavement are considered as dead loads, as shown in Table 3. Table 4 summarizes the factored dead and live loads for the two load configurations (LC1 and LC2), as mentioned in Section 2.1. As shown in Figure 3, the wheel load (215 kN) for LC1 is distributed over the tire contact area at the top surface of the deck, and the two adjacent wheel loads (152 kN each) for LC2 are distributed over the tire contact areas 1.2 m apart. In addition, the factored dead load (3.356 kN/m2) is applied to the top surface of the deck for both LC1 and LC2.
Table 3.
Self-weight of the deck and pavement.
Table 4.
Factored dead and live loads in ULS.
2.3. Partial Safety Factors
A partial safety factor for the design strengths of material should be applied in the design of a pultruded GFRP bridge deck. As given by Equation (2), the partial safety factor () for the deck substrate is obtained by multiplying three partial safety coefficients (). These consider the effect of deviations from the tested values (), the material and production processes (), and the environment and loading duration (), with respect to the material properties [17].
The partial safety coefficients for the strength of the deck substrate are shown in Table 5. A partial safety factor ( = 3.16), calculated from Equation (2), is multiplied by the tested strength of the deck substrate to obtain its design strength.
Table 5.
Partial safety coefficients for the strength of deck substrate [17].
As given by Equation (3), the partial safety factors for the adhesive in joints can be obtained by considering the adhesive properties (), the method of adhesive application (), the type of loading (), and environmental conditions () [17]. The partial safety coefficients applied to the adhesive strengths are shown in Table 6. The partial safety factor ( = 2.34), calculated using Equation (3), is multiplied with the test strength of the adhesive to obtain its design strength. The calculated design strengths of the deck substrate and adhesive are compared with the corresponding maximum stresses from the FE analysis to check the failure modes in Section 4.3, Section 4.4, Section 4.5 and Section 4.6.
Table 6.
Partial safety coefficients for the strengths of adhesives [17].
3. FE Analysis
For an FE analysis, the solid elements for simulating a deck system and its adhesive joints are used under prescribed loads and boundary conditions. A general-purpose FE analysis program, ABAQUS [18], is used. The material properties of the deck substrate are approximately assumed from the test results and previous studies because the results of corresponding coupon tests do not sufficiently represent the orthotropic material properties of the deck, as described in Section 3.3.
3.1. Dimensions and Boundary Conditions
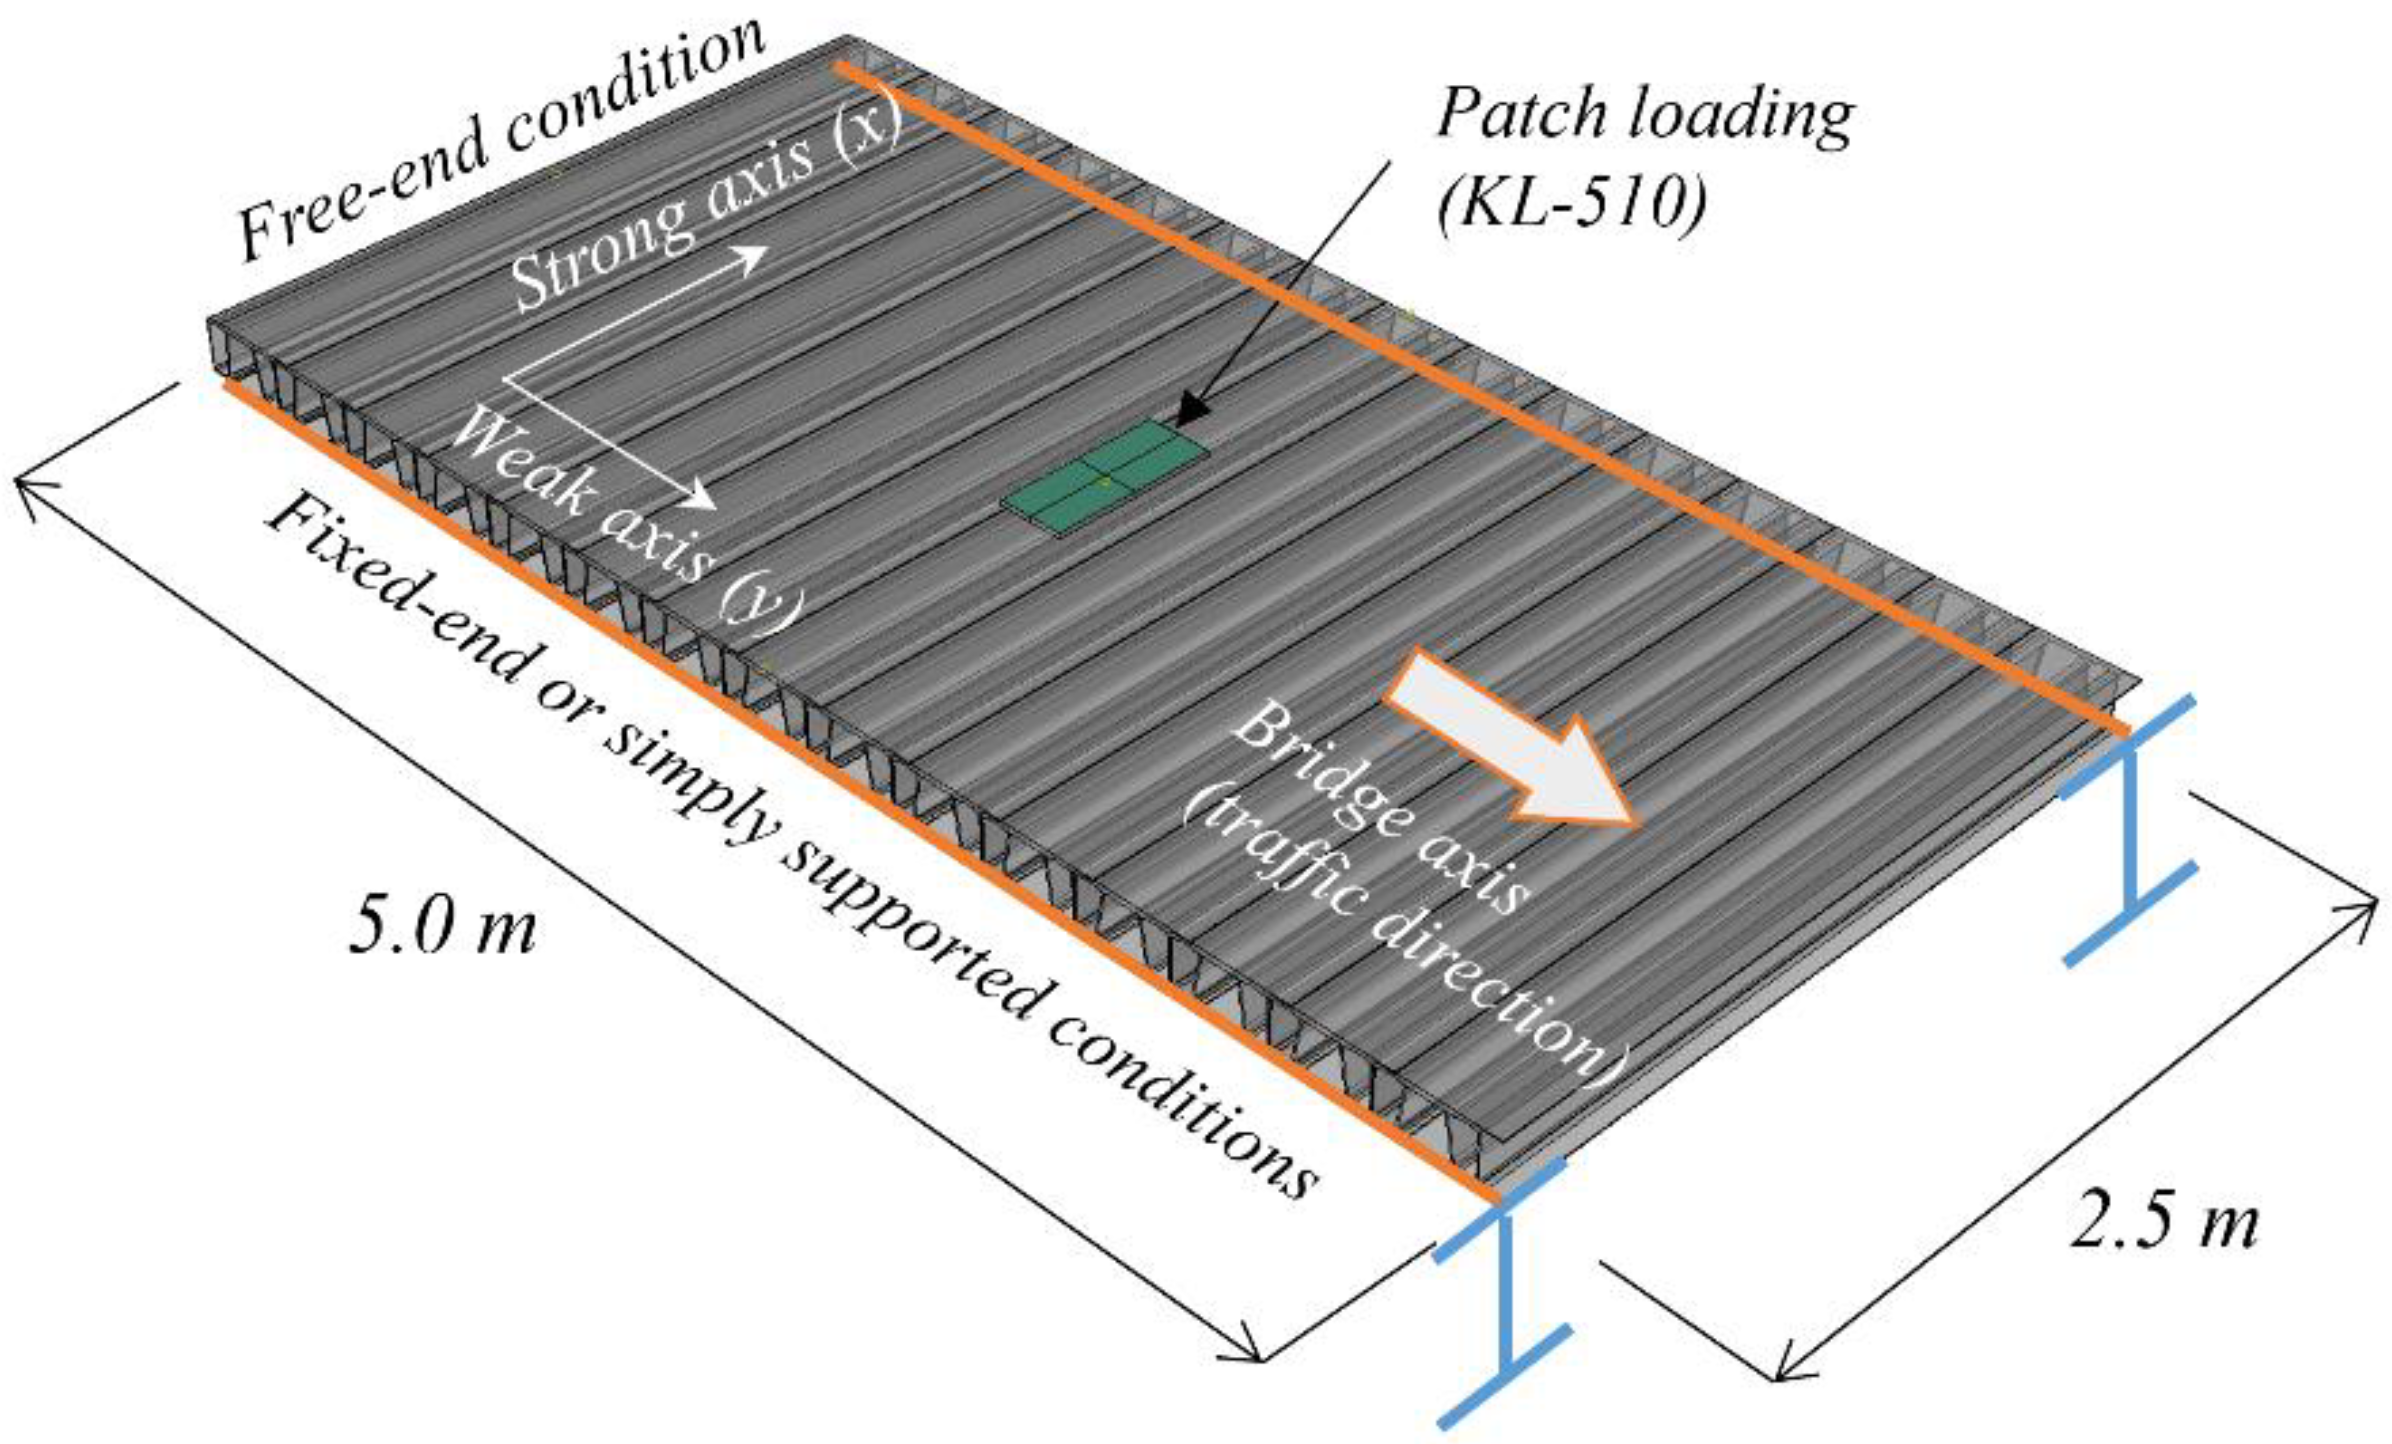
The adhesively connected GFRP bridge deck is supported by steel plate girders under design wheel loads distributed over the tire contact area (indicated by a green rectangle), as shown in Figure 4. The FE model is considered a one-way slab with a 2.5 m span length between the plate girders. To sufficiently represent the weak-axis bending behavior, the length of the deck FE model in the weak axis is selected as 5.0 m, which is twice the span length of the strong axis.
Figure 4.
Dimensions and boundary conditions of the deck.
Typically, bridge decks have multiple supports at girders to reduce the positive moment generated at midspan and generate an appropriate negative moment at supports. For simplicity, two extreme boundary conditions are considered, (1) fixed-end condition (FX) and (2) simply supported condition (SS), at two end supports (orange lines on steel plate girders). The two perpendicular edges are under free-end conditions.
3.2. FE Model with Solid Elements
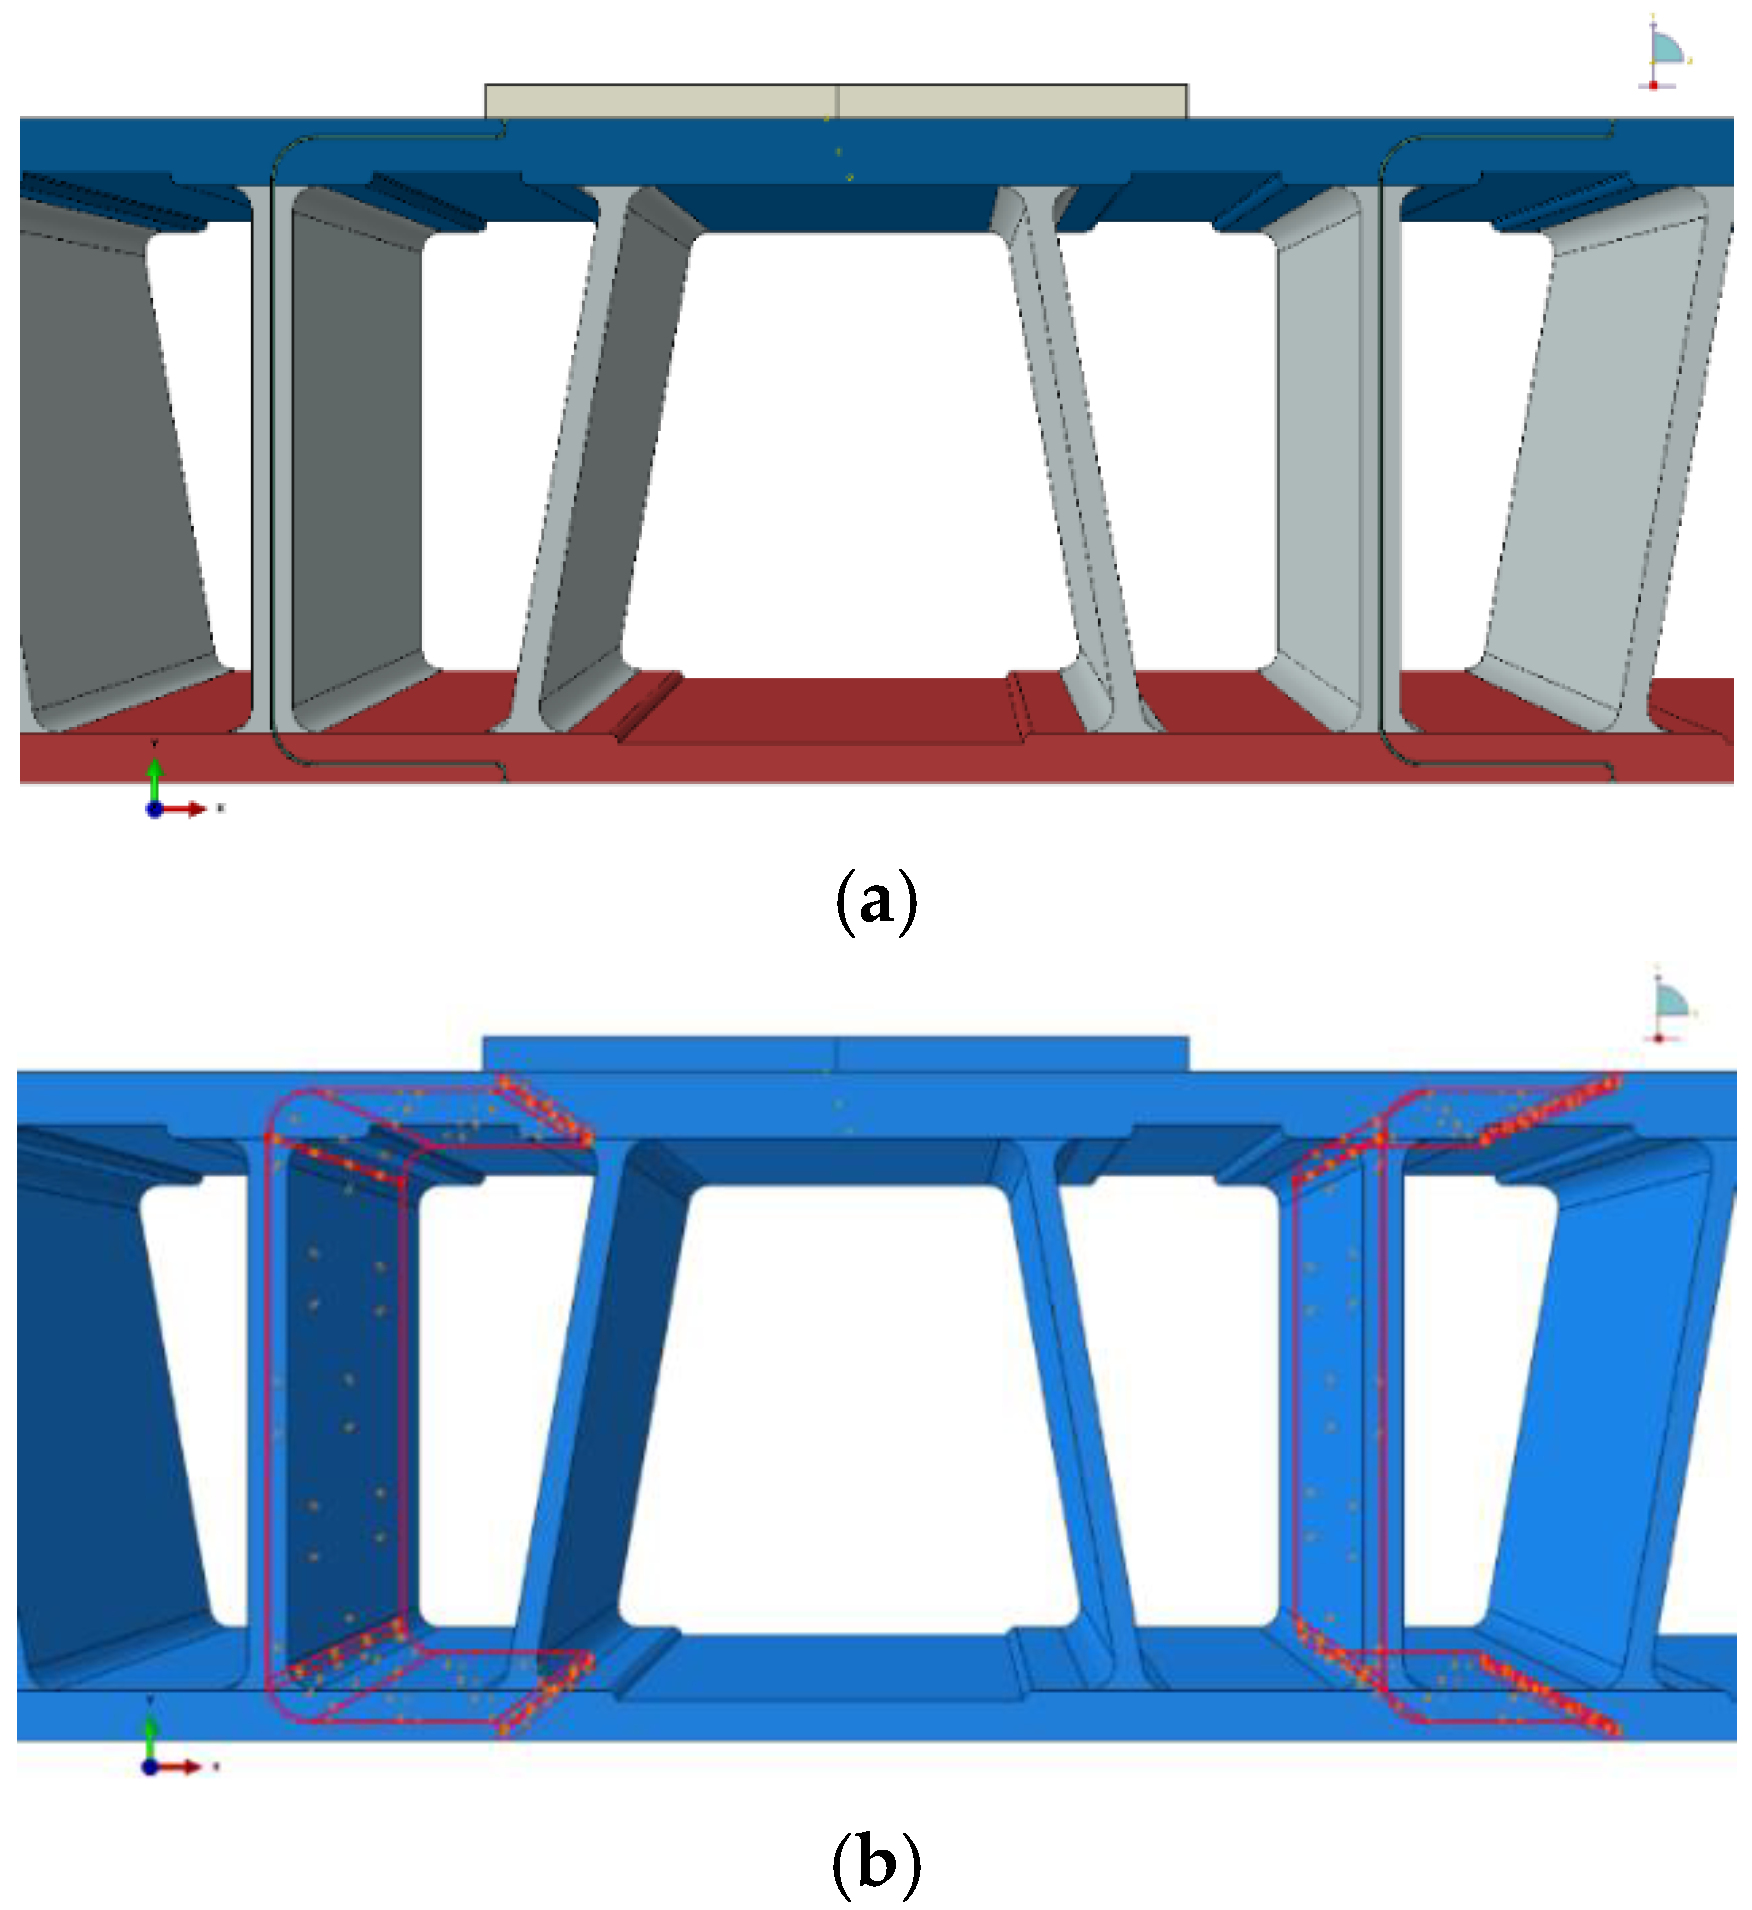
The pultruded GFRP deck tubes and adhesive joints between them are modeled using Element C3D8R (linear bricks of eight nodes with reduced integration) in ABAQUS [18]. As shown in Figure 5a,b, the FE models have four parts: (1) a deck tube discretized with high-density (HD) solid elements (red), (2) a deck tube discretized with low-density (LD) solid elements (blue), (3) an adhesive joint between the deck tubes (black lines between deck tubes), and (4) loading pads for the wheel loads (gray). High-density solid elements are used at the adhesive joints and loading pads to simulate local behaviors. Figure 6a shows the top (blue), bottom (red), and web plates (gray), the adhesive joints (blue line), and the loading pad (gray at top) in section.
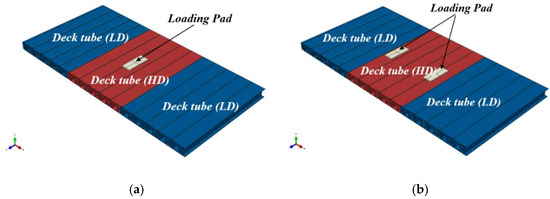
Figure 5.
Parts of FE model with different solid-element densities. (a) Load configuration 1 (LC1); (b) load configuration 2 (LC2).
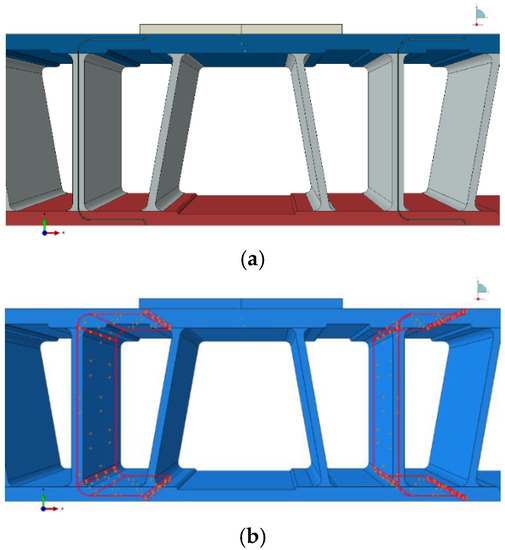
Figure 6.
Detailed section views of the FE model. (a) Top (blue), bottom (red), and web plates (gray) and joint adhesive (blue lines) of the deck tube; (b) tie elements (red) between deck tubes and adhesives.
In our previous weak-axis bending tests [11], failure was observed in the adhesive material but none at the bonding surface between the deck tubes and adhesive. Thus, the bonding between the deck tubes and adhesive is simulated by tie elements (Figure 6b) in ABAQUS, assuming complete bonding. However, to consider failures at the bonding surface between deck tubes and adhesive, nonlinear tie elements or contact elements should be used based on the corresponding test results.
Figure 7 shows a partial section view of the discretized FE model. The HD part (right-hand side) is discretized with a larger number of elements than the LD part (left-hand side) to simulate local behavior near the loading area. Moreover, the bottom and top plates at the joints are discretized with a large number of elements to simulate local behavior, and the adhesive at the joint is discretized using four element layers throughout the thickness to properly simulate its local behavior. The entire FE model is discretized into 924,802 solid elements.
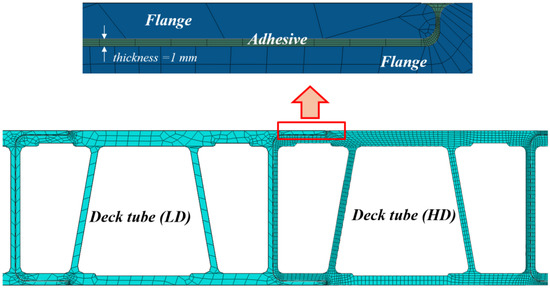
Figure 7.
Partial section view of the discretized FE model.
3.3. Material Properties
The top, bottom, and web plates in the TG200 decks are composed of several layers of matrix and angled fibers, and the amount of angled fibers critically determines the orthotropic material properties of these plates. The weight of angled fibers per unit area for the top plate in the prototype and modified-type TG200 are shown in Table 7. The modified type has more fibers in the longitudinal direction and chopped strand mat (CSM) material but significantly less fibers in other directions. For the prototype, coupon tests to determine , , and were performed [1,3], and the measured values are shown in Table 8. Coupon tests for the modified type were not performed.
Table 7.
Weight of angled fibers per unit area in the TG200 top plate.
Table 8.
Material properties of TG200 deck substrate.
Because these test results are not sufficient to determine the orthotropic material properties for 3D solid elements, all necessary material properties are assumed based on our previous test results [1,3] and other’s previous studies [19,20] as in the following procedure: (1) conservatively assume , , and by reducing our previous test results by 33% [1,3]; (2) select the same and as the previous test results of Kosmatka et al. [19]; (3) estimate , , , , and according to Hollaway’s method [20]; and (4) approximate and according to the calculation method of Qiao et al. [21]. These assumed values are shown in Table 8 and used for the analysis in this study. These approximations are sufficient because the focus of this study is on describing the analysis method for checking the safety of adhesive joints and the serviceability of the GFRP deck under bidirectional bending. For precise analysis, it is necessary to perform all types of coupon tests to measure the orthotropic material properties.
Table 9 summarizes the tested and prescribed material properties of the adhesive. The epoxy adhesive, HTA-210, is isotropic, and it is used as the bonding material for assembling the TG200 deck tubes. The shear strength value of the adhesive in this table is provided by the manufacturer, whereas the tensile strength and elastic modulus of the adhesive are determined from coupon tests. To simulate actual bonding environments, the coupon tests are performed after 30 d of curing at room temperature (20 ± 5 °C).
Table 9.
Properties of the adhesive.
The design strengths of the deck substrates and the adhesive are determined by applying the partial safety factors given in Section 2.3 to the corresponding test or prescribed values. They are then compared with the analysis results to check against the failure modes, as described in Section 4. Table 10 summarizes the design strengths for the deck substrates and adhesive.
Table 10.
Design strengths for the deck substrate and adhesive.
4. Analysis Results
FE analyses are conducted to investigate the behavior of the adhesively connected pultruded GFRP bridge decks subjected to wheel loads at SLS and ULS. The global deflection of the deck and the local deformation at the joints are evaluated in Section 4.1 and Section 4.2, respectively. To verify the safety of the joints, local stresses at the joints are evaluated to check against failure, as presented in Section 4.3, Section 4.4, Section 4.5 and Section 4.6.
4.1. Deflection
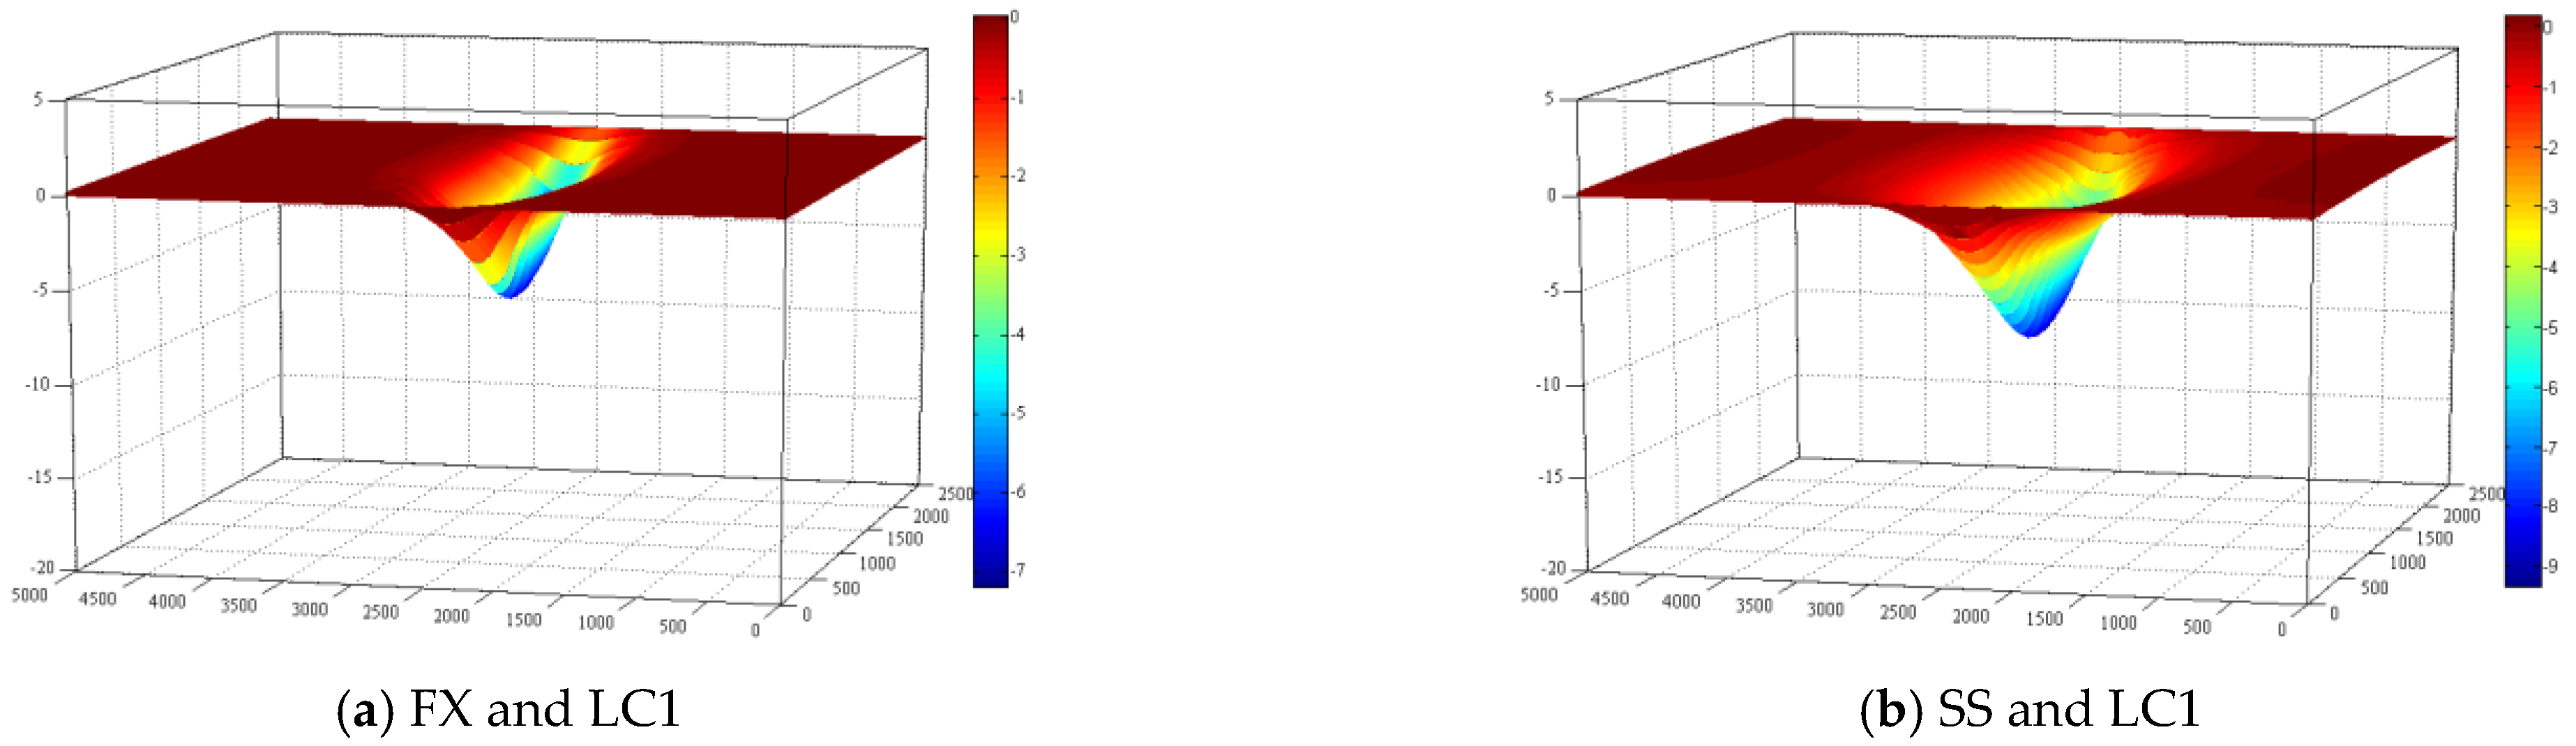
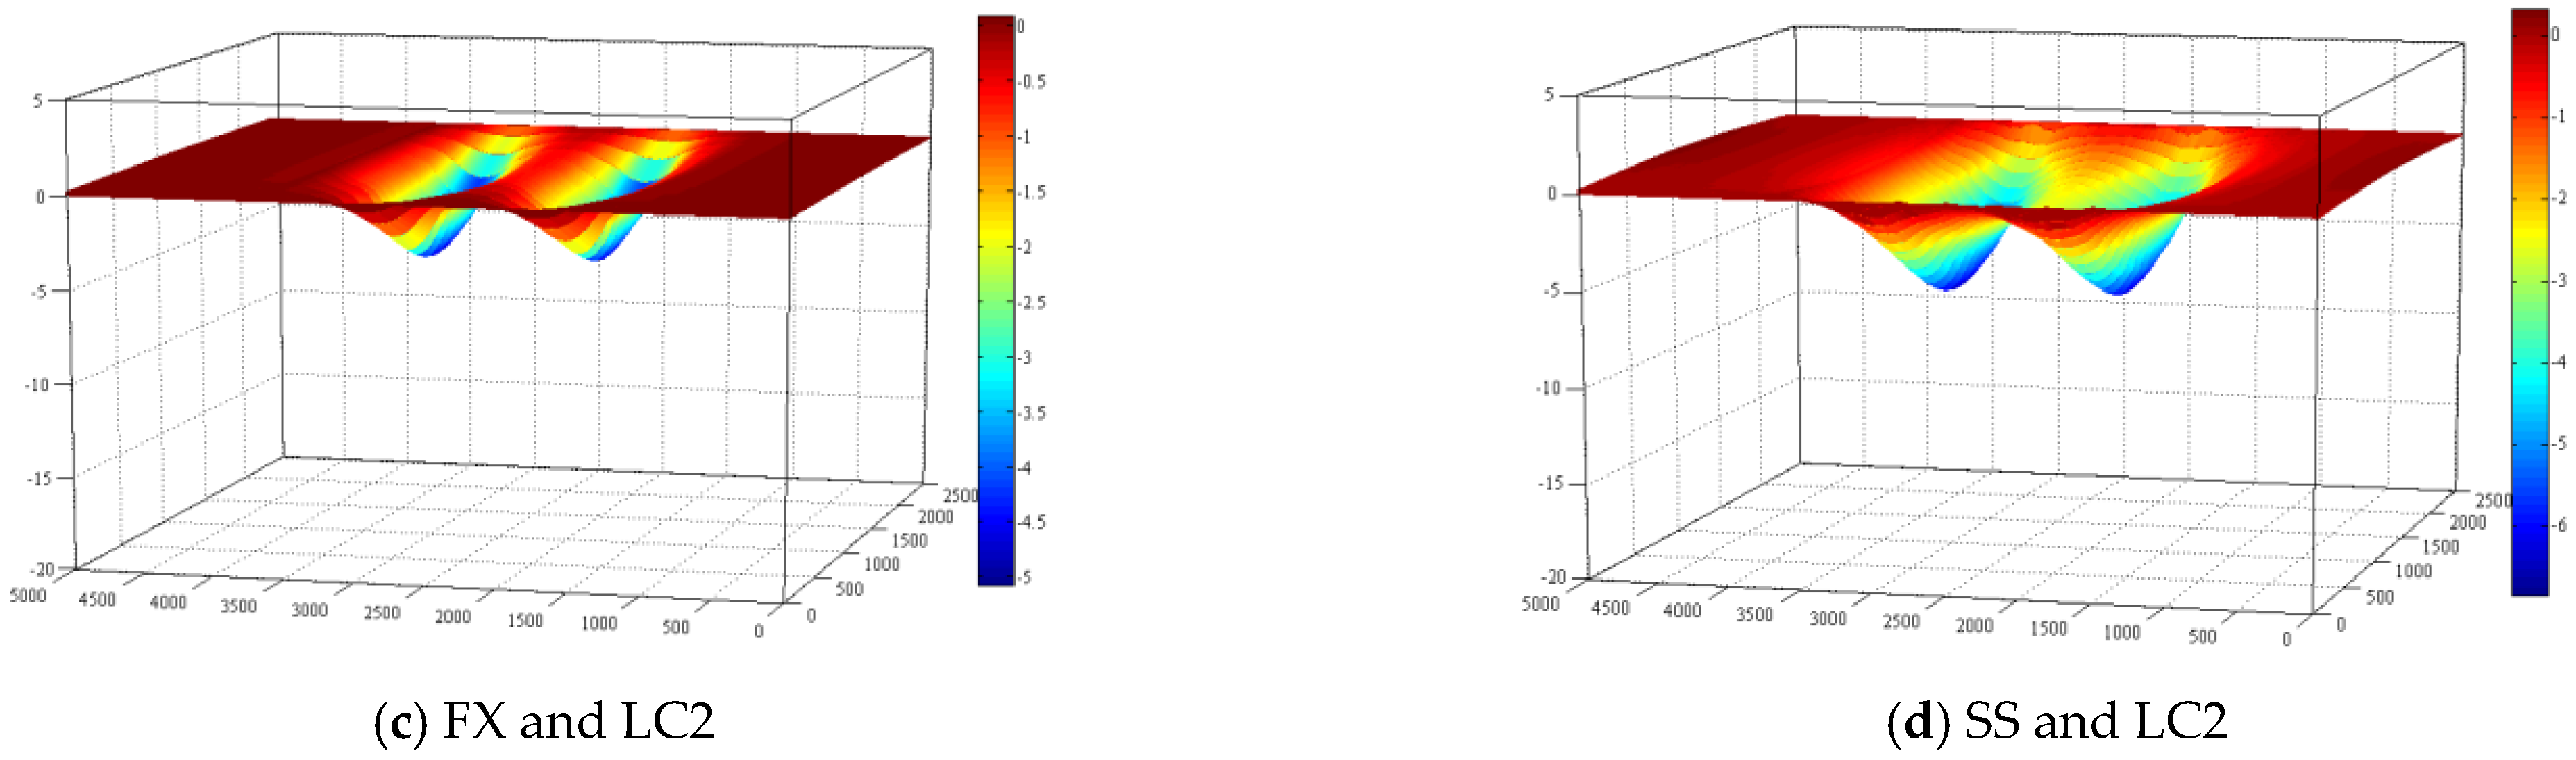
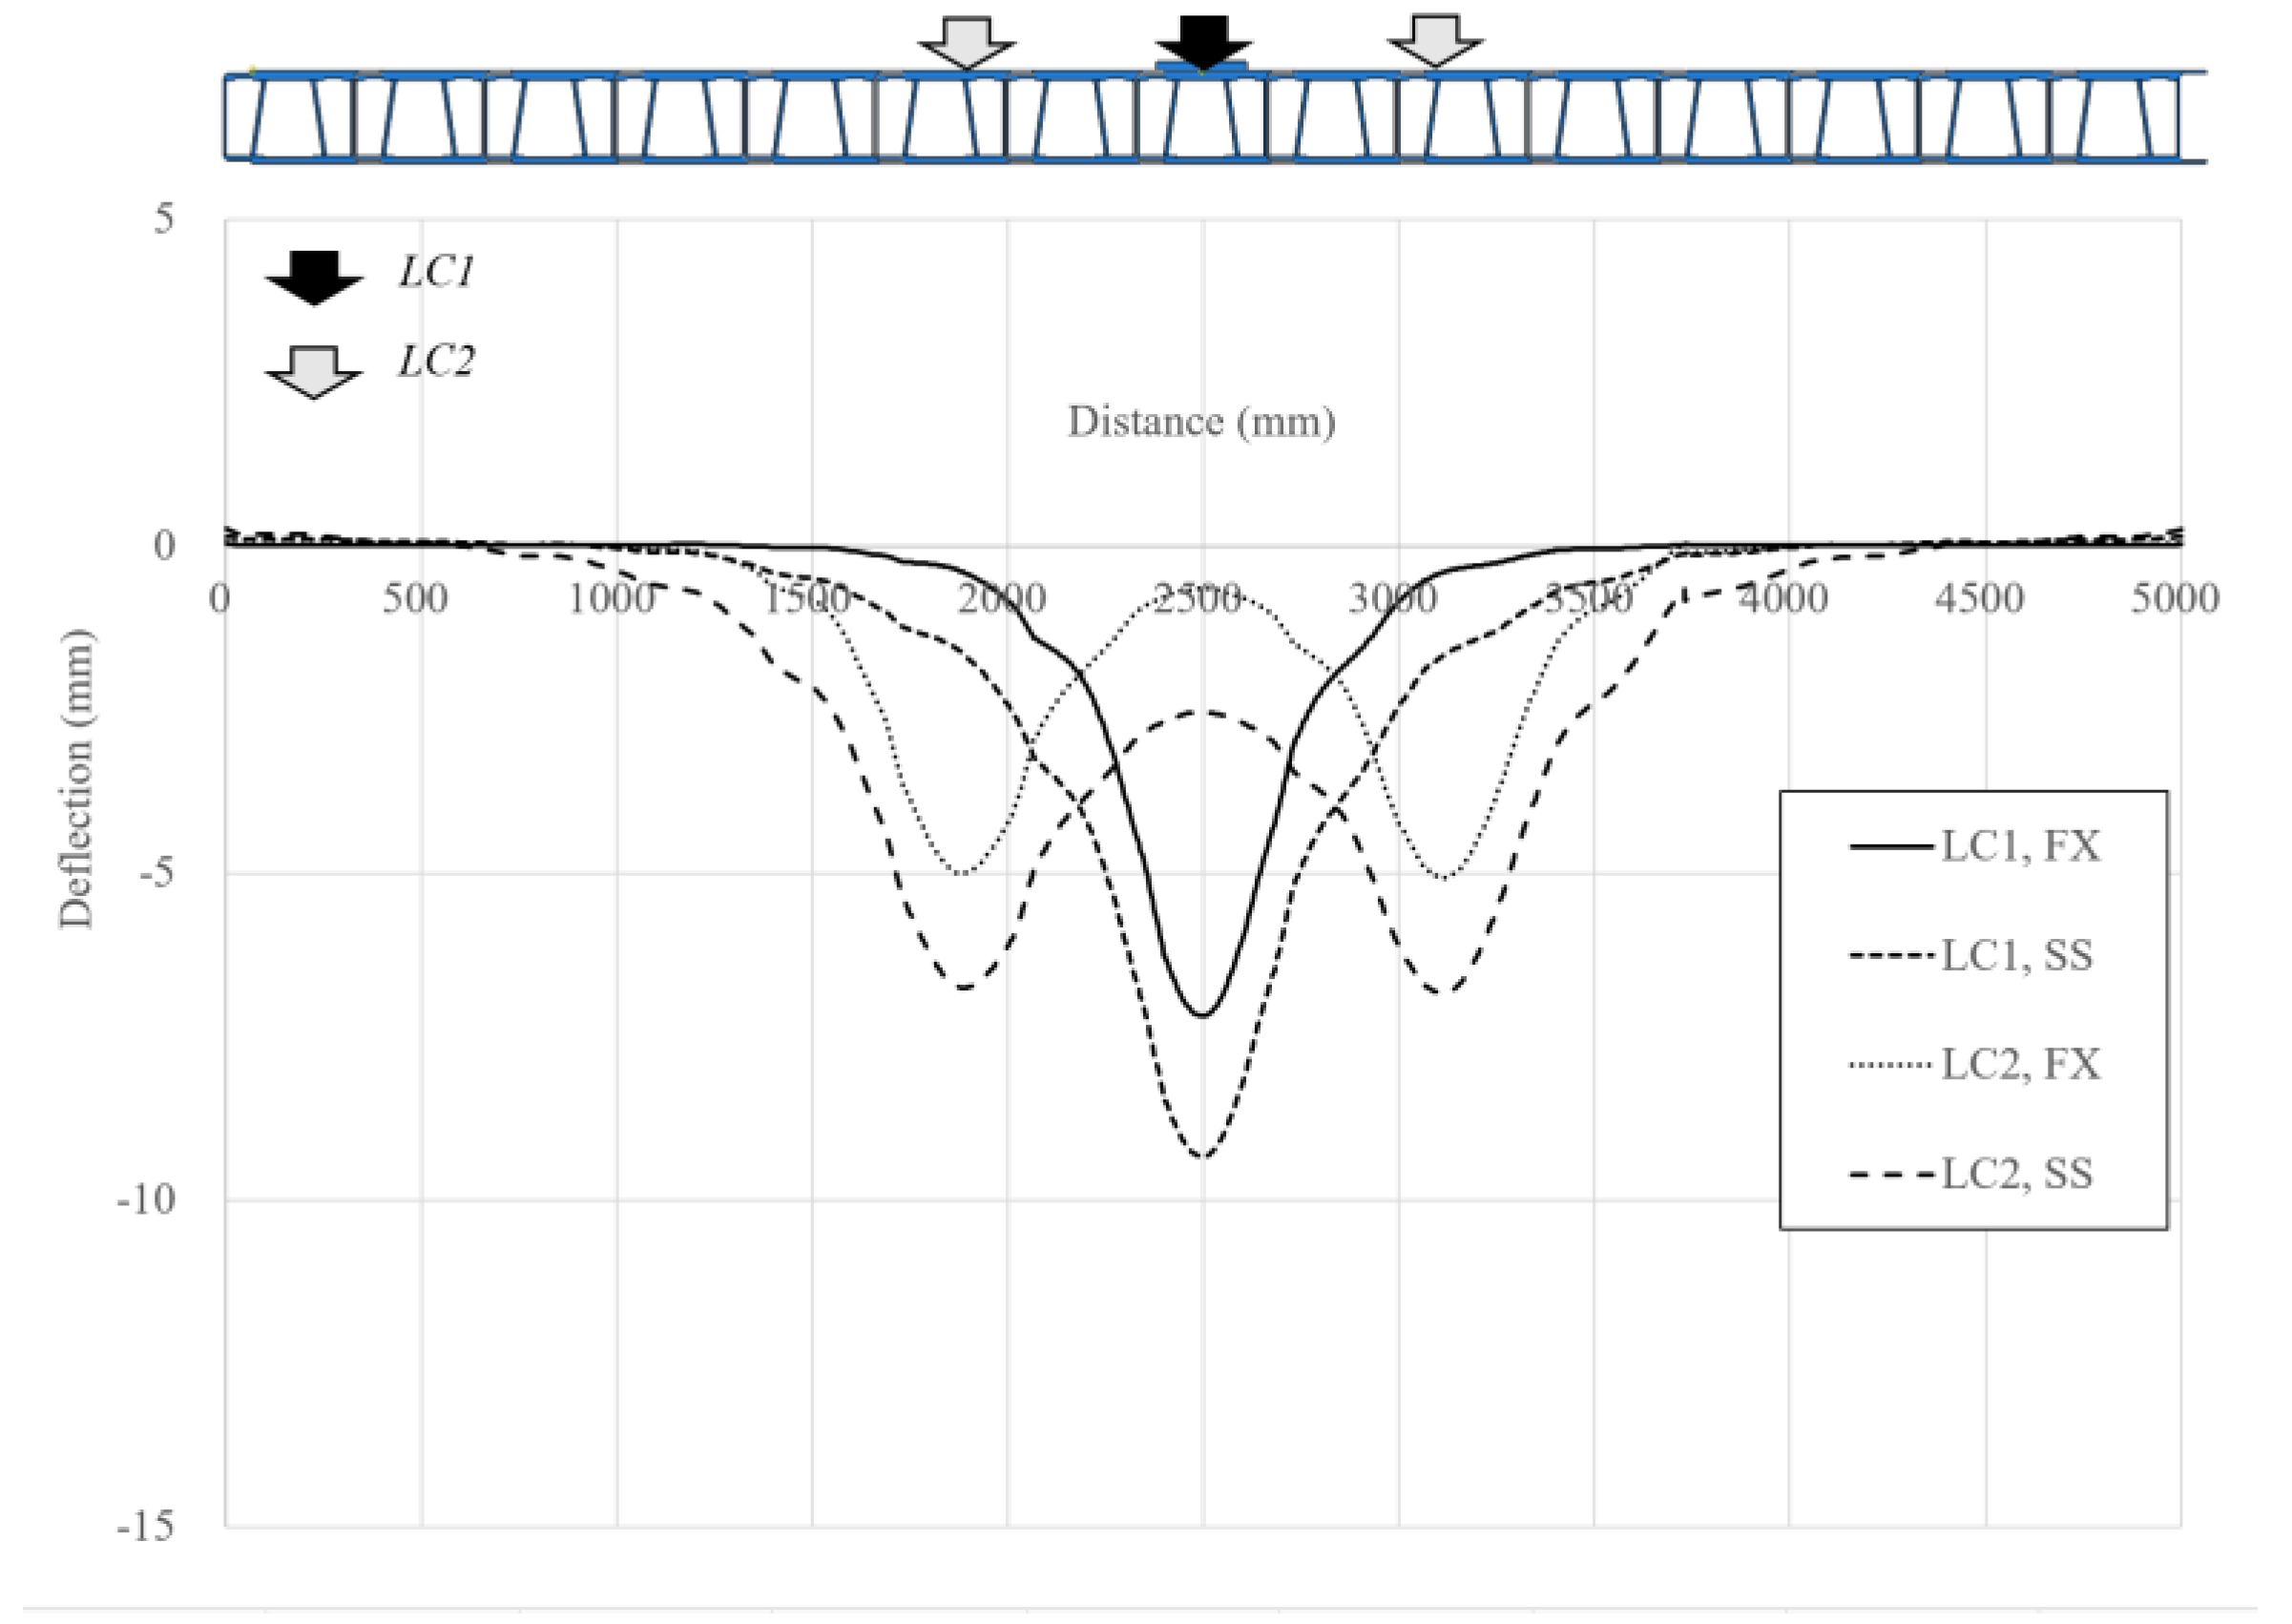
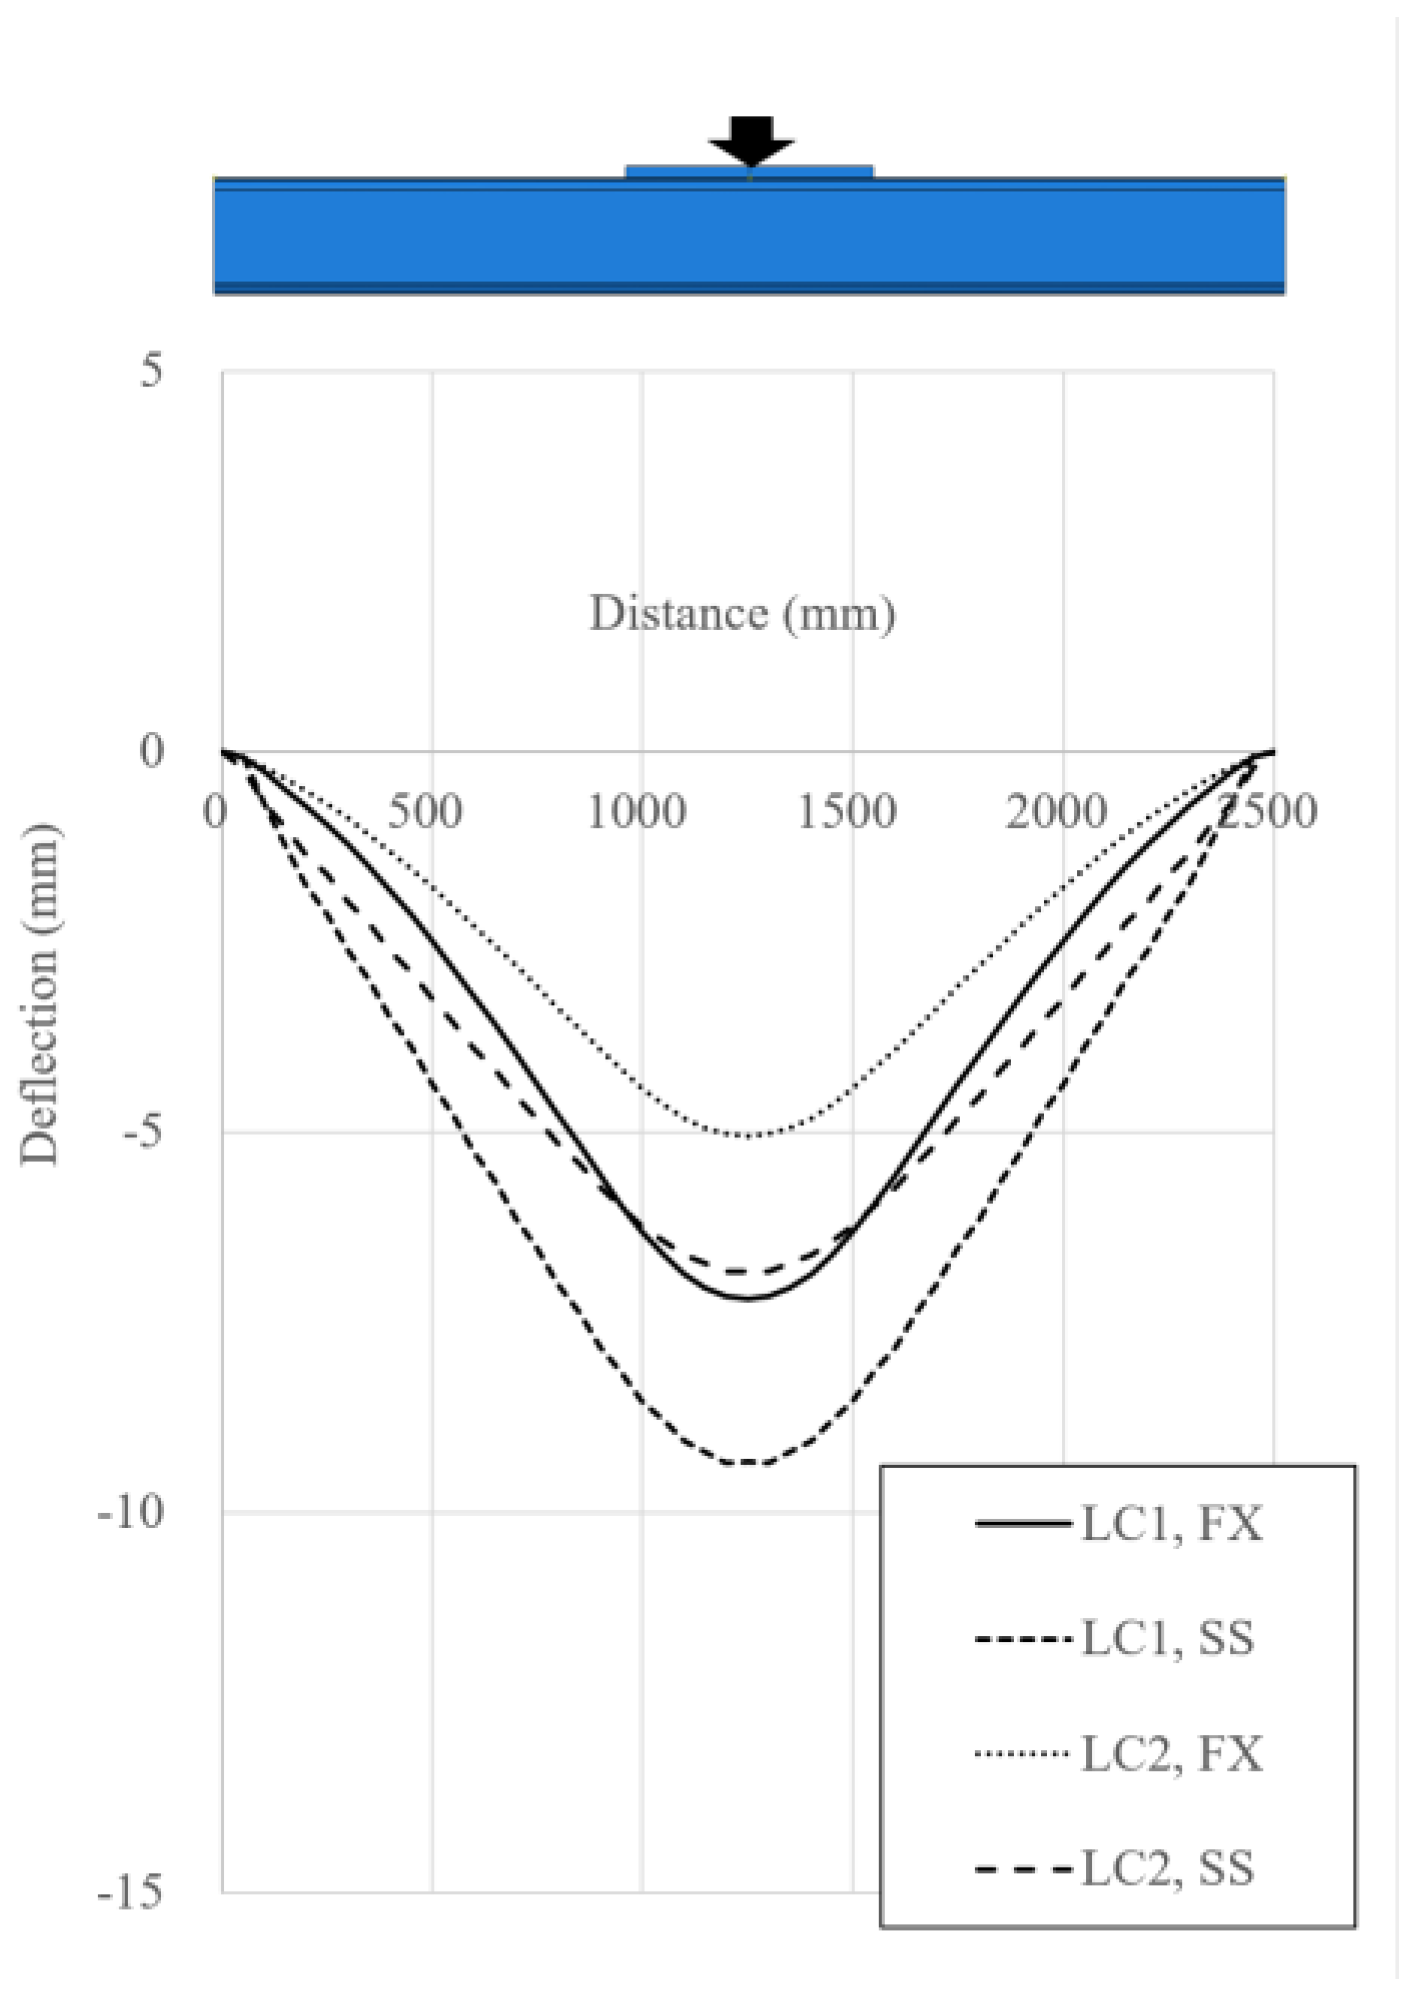
The global deflections are evaluated to investigate the serviceability of the deck under the service loads. Figure 8a,b shows the deformed shapes of the bottom plate in the deck under FX and SS, respectively, and LC1. Figure 8c,d shows the deformed shapes of the bottom plate in the deck under FX and SS, respectively, and LC2. The maximum deflection is larger in LC1 than in LC2; thus, LC1 governs the deflection requirements in SLS. Figure 9 and Figure 10 compare the deck deflections along the weak and strong axes, respectively. Notably, the deflected region is much narrower in the weak axis than in the strong axis because the flexural stiffness is much lower in the weak axis.
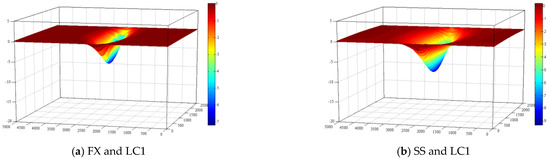

Figure 8.
Deflections of the deck with different boundary conditions and loading configurations.
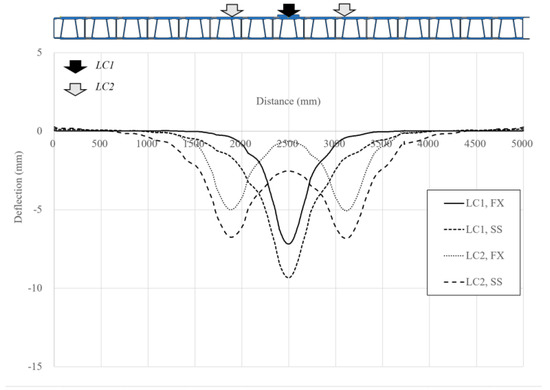
Figure 9.
Deflections along the weak axis.
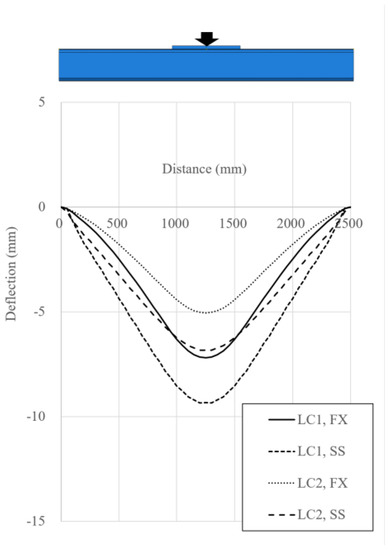
Figure 10.
Deflections along the strong axis.
Table 11 summarizes the maximum deck deflections. They are 7.19 mm and 9.34 mm under FX and SS and LC1, which can be represented as L/348 and L/268, respectively, for the 2500 mm span. The maximum deflections of the deck under LC2 are 5.08 mm and 6.84 mm in the FX and SS, which can be represented by L/492 and L/366, respectively. The deck under LC1 deflects more than that under LC2. Because the double-wheel loads are sufficiently separated, the deformations of the two adjacent wheel loads do not interfere during weak-axis bending. Thus, none of these GFRP decks satisfies the serviceability deflection limit for vehicular bridges (L/800) shown in Table 2. Therefore, it is necessary to increase the flexural stiffness or decrease the span in strong axis.
Table 11.
Maximum deflections of the deck with different boundary conditions and loading configurations under SLS.
4.2. Local Deformation of Adhesive at Joints
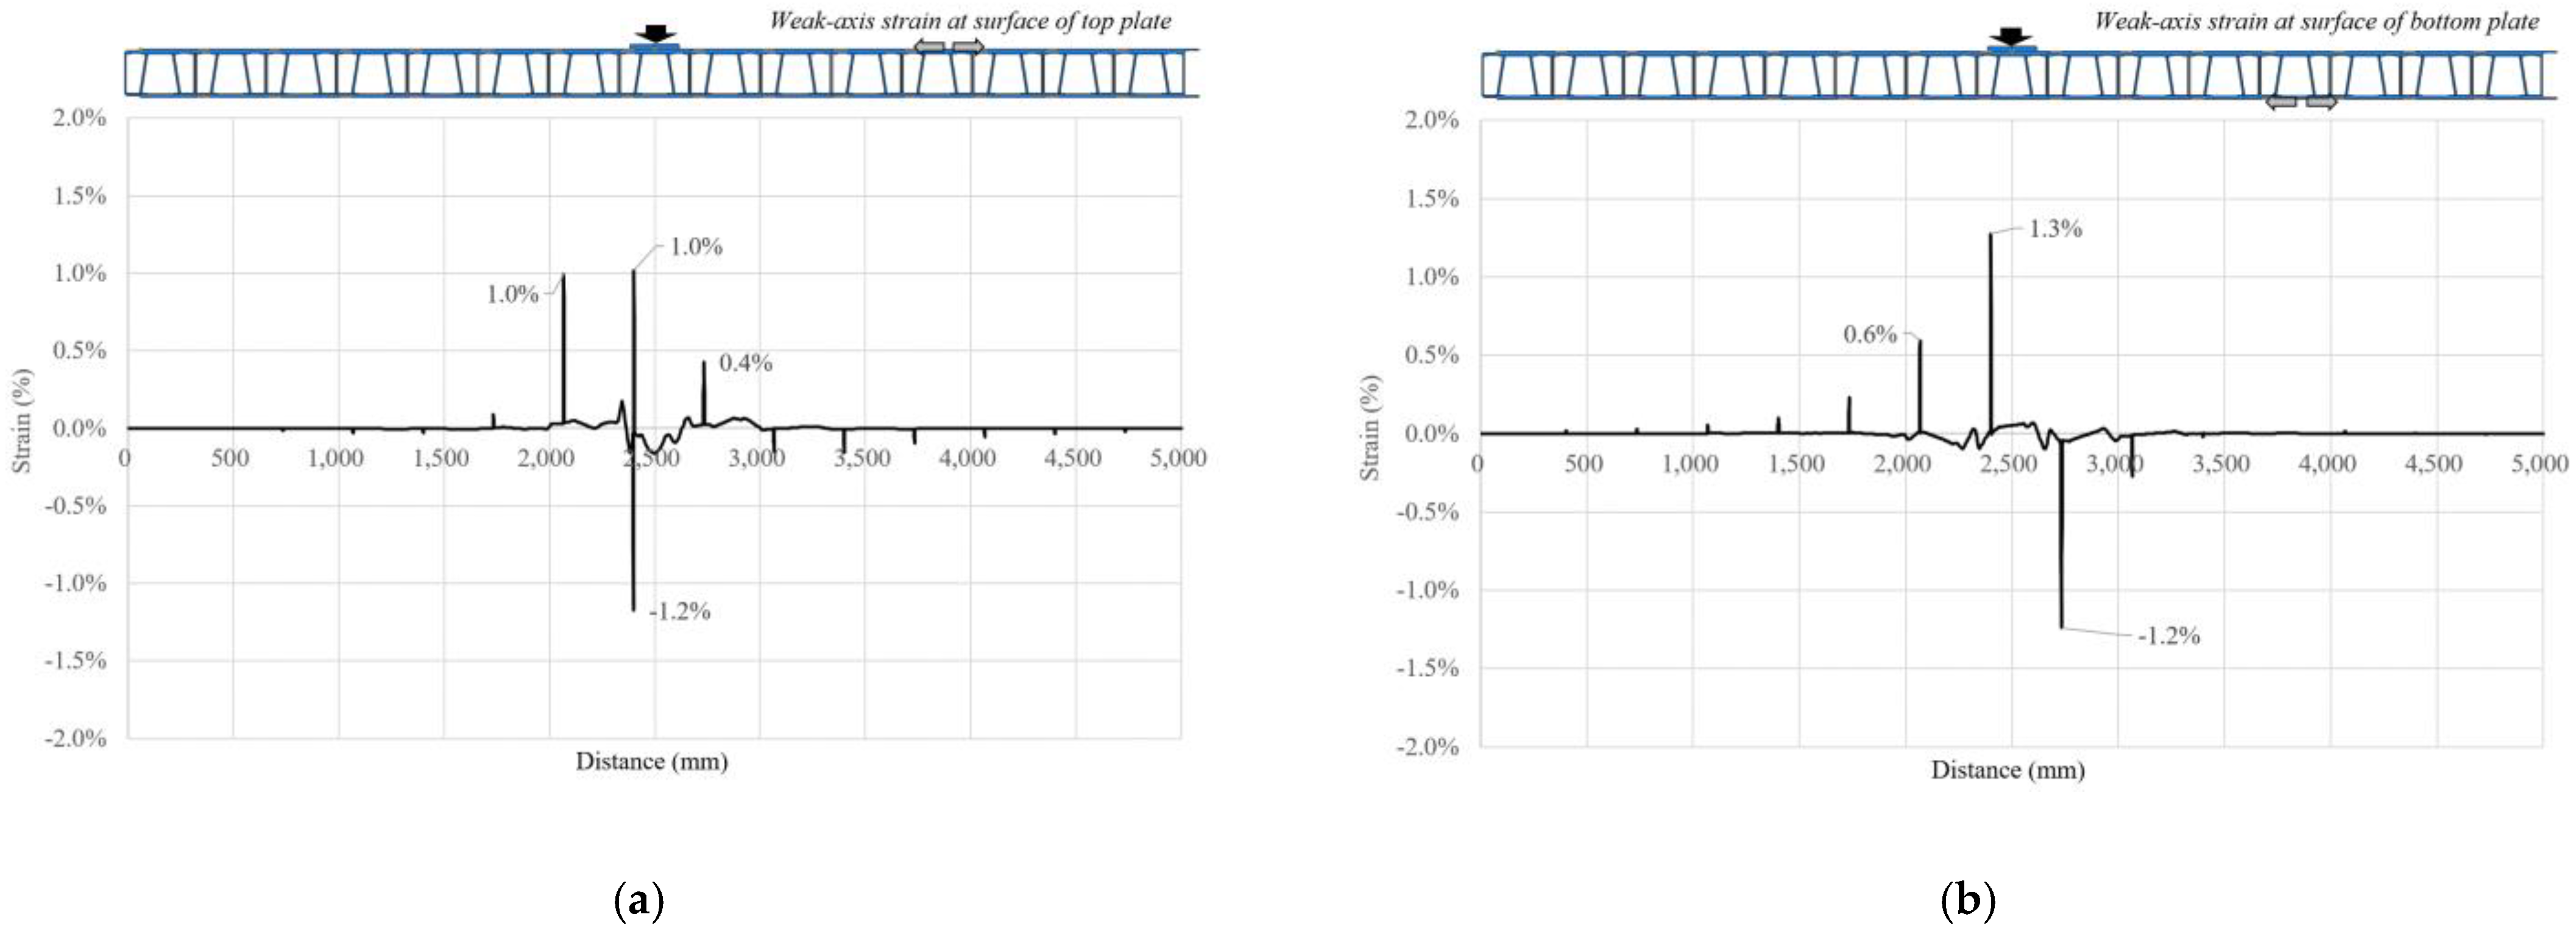
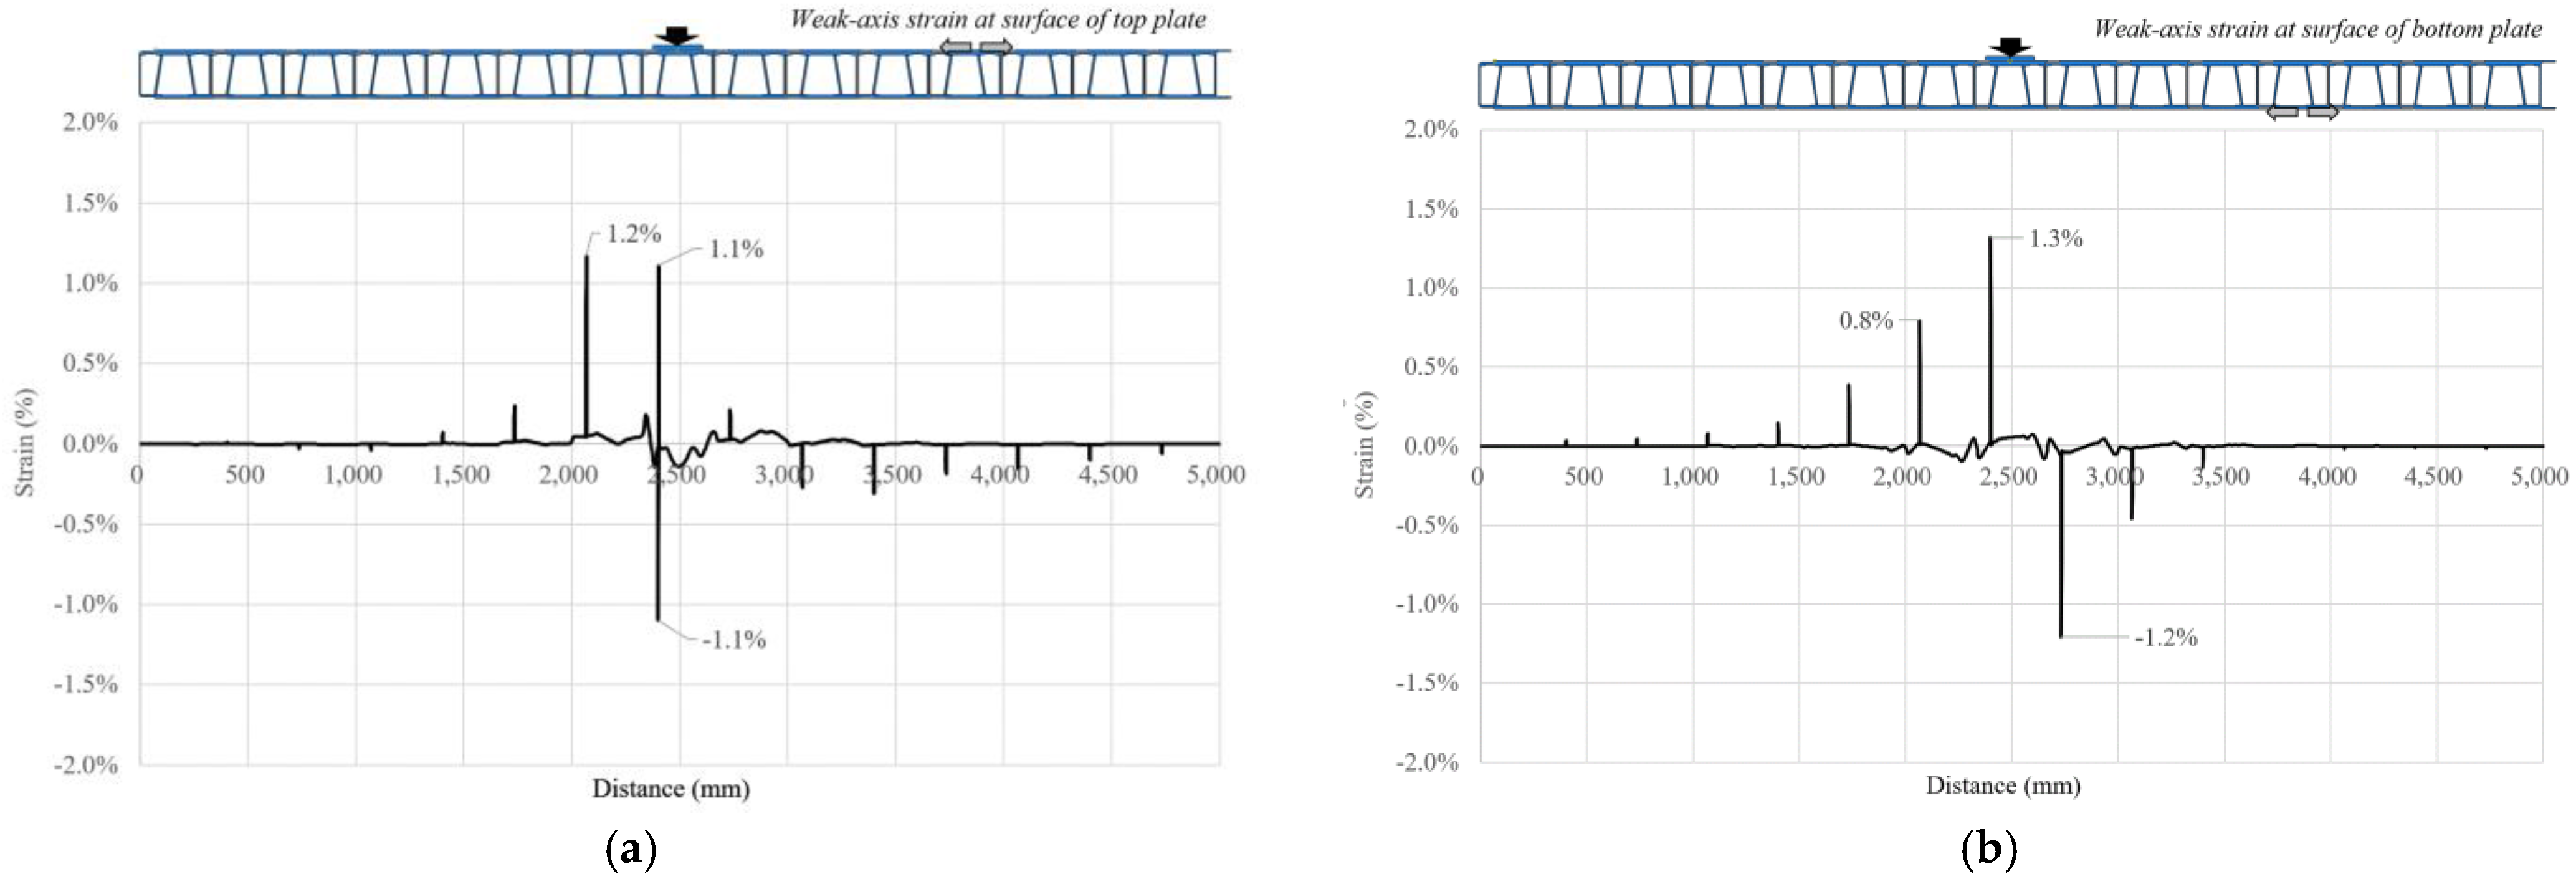
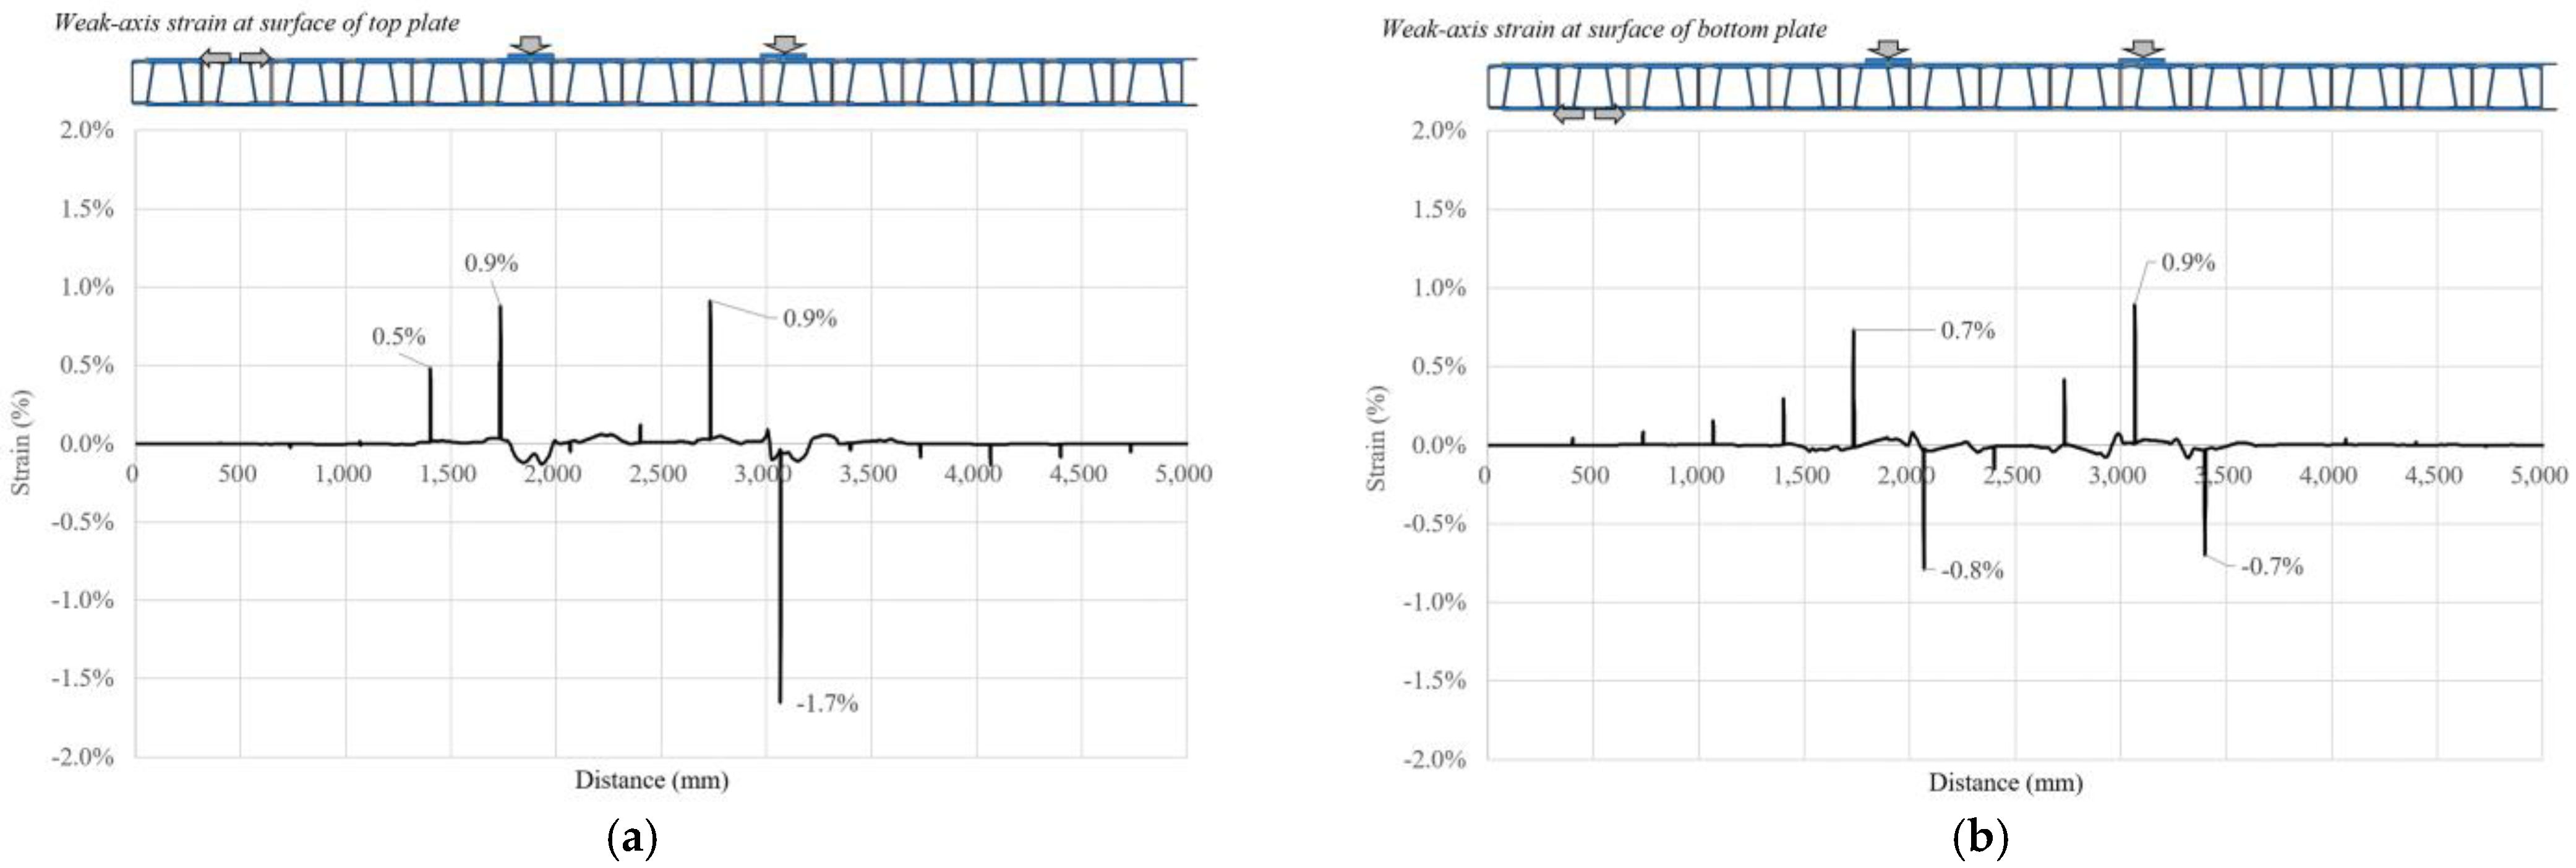
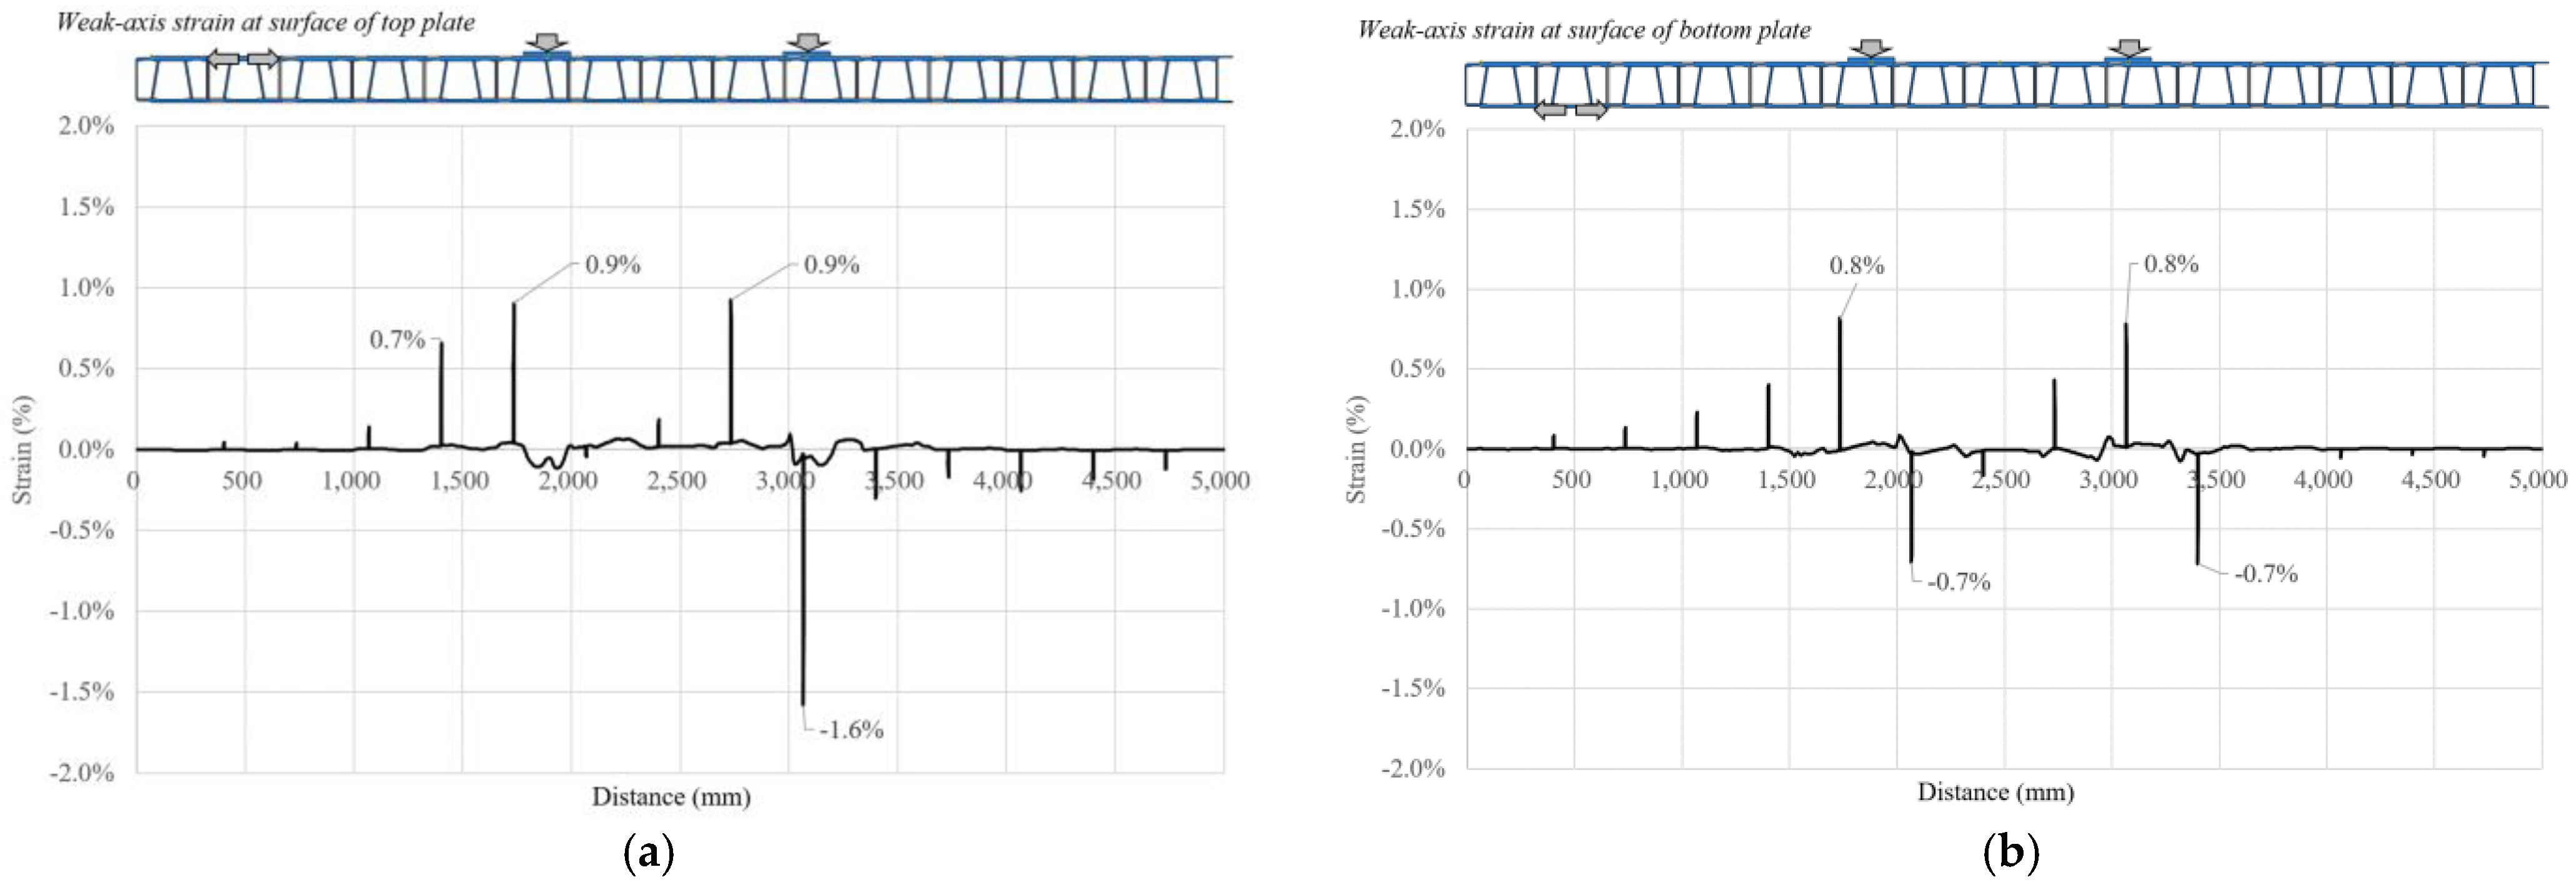
Deformation concentration at the edge of adhesive under weak-axis bending causes reflective cracks on the asphalt pavement [11]. In this study, the local deformation along the deck surfaces under design wheel loads is evaluated by FE analyses for SLS and ULS. Figure 11 and Figure 12 show the distribution of the weak-axis tensile strains along the bottom and the top surfaces of the deck under LC1 and SLS for FX and SS, respectively. Figure 13 and Figure 14 show the distribution of weak-axis tensile strains at the bottom and top surfaces of the deck under LC2 and FX and SS, respectively. The weak-axis tensile strains are much larger under ULS with similar trends to those in SLS.

Figure 11.
Weak-axis tensile strains along the (a) top surface and (b) bottom surface of the deck under FX and LC1 in SLS.
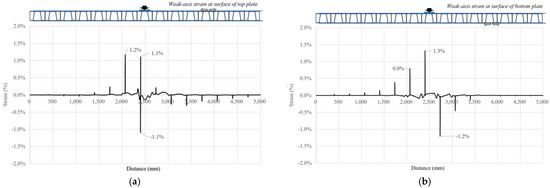
Figure 12.
Weak-axis tensile strains along the (a) top surface and (b) bottom surface of the deck under SS and LC1 in SLS.

Figure 13.
Weak-axis tensile strains along the (a) top surface and (b) bottom surface of the deck under FX and LC2 in SLS.
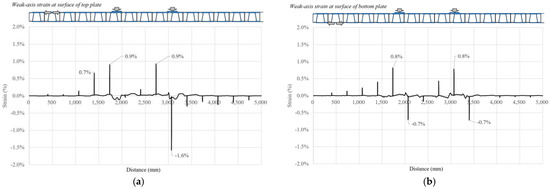
Figure 14.
Weak-axis tensile strains along the (a) top surface and (b) bottom surface of the deck under SS and LC2 in SLS.
As shown in Figure 11, Figure 12, Figure 13 and Figure 14, the weak-axis tensile strains along the bottom and the top surfaces of the deck highly concentrate at the adhesives near the loading area, as described by Park et al. [11]. This is caused by the local deformation of the deck section and relatively low stiffness of the adhesive. The highly concentrated tensile strains at the adhesive cause adhesive tensile failures and reflective cracks on the asphalt pavement. To avoid these problems, it is necessary to reduce the strain in the adhesive by selecting adhesives with higher stiffnesses or optimizing the joint configuration.
Table 12 summarizes the maximum weak-axis tensile strains at the adhesive calculated by FE analyses. Applying the partial safety factor (2.34) to the maximum tensile strain of the adhesive (7.0%) described in Table 9, the design limit of the tensile strain is determined as 3.0%. The maximum weak-axis tensile strains in the adhesive under SLS and ULS are lower than the design limit of tensile strain. The stress in the adhesive needs to be checked for safety, as described in Section 4.3, Section 4.4 and Section 4.5.
Table 12.
Comparison between the maximum weak-axis tensile strains and the design limit of the adhesive at the deck surfaces.
4.3. Tensile Failure of Adhesive at Joint Edge between Bonded Flanges (TAF)
The maximum tensile strain and stress in adhesives generally occur in the necking area, away from the deck surfaces [11]. Once the stress at the necking area exceeds the tensile strength of the adhesive, local tensile failure in the adhesive occurs, leading to crack propagation under repeated loadings.
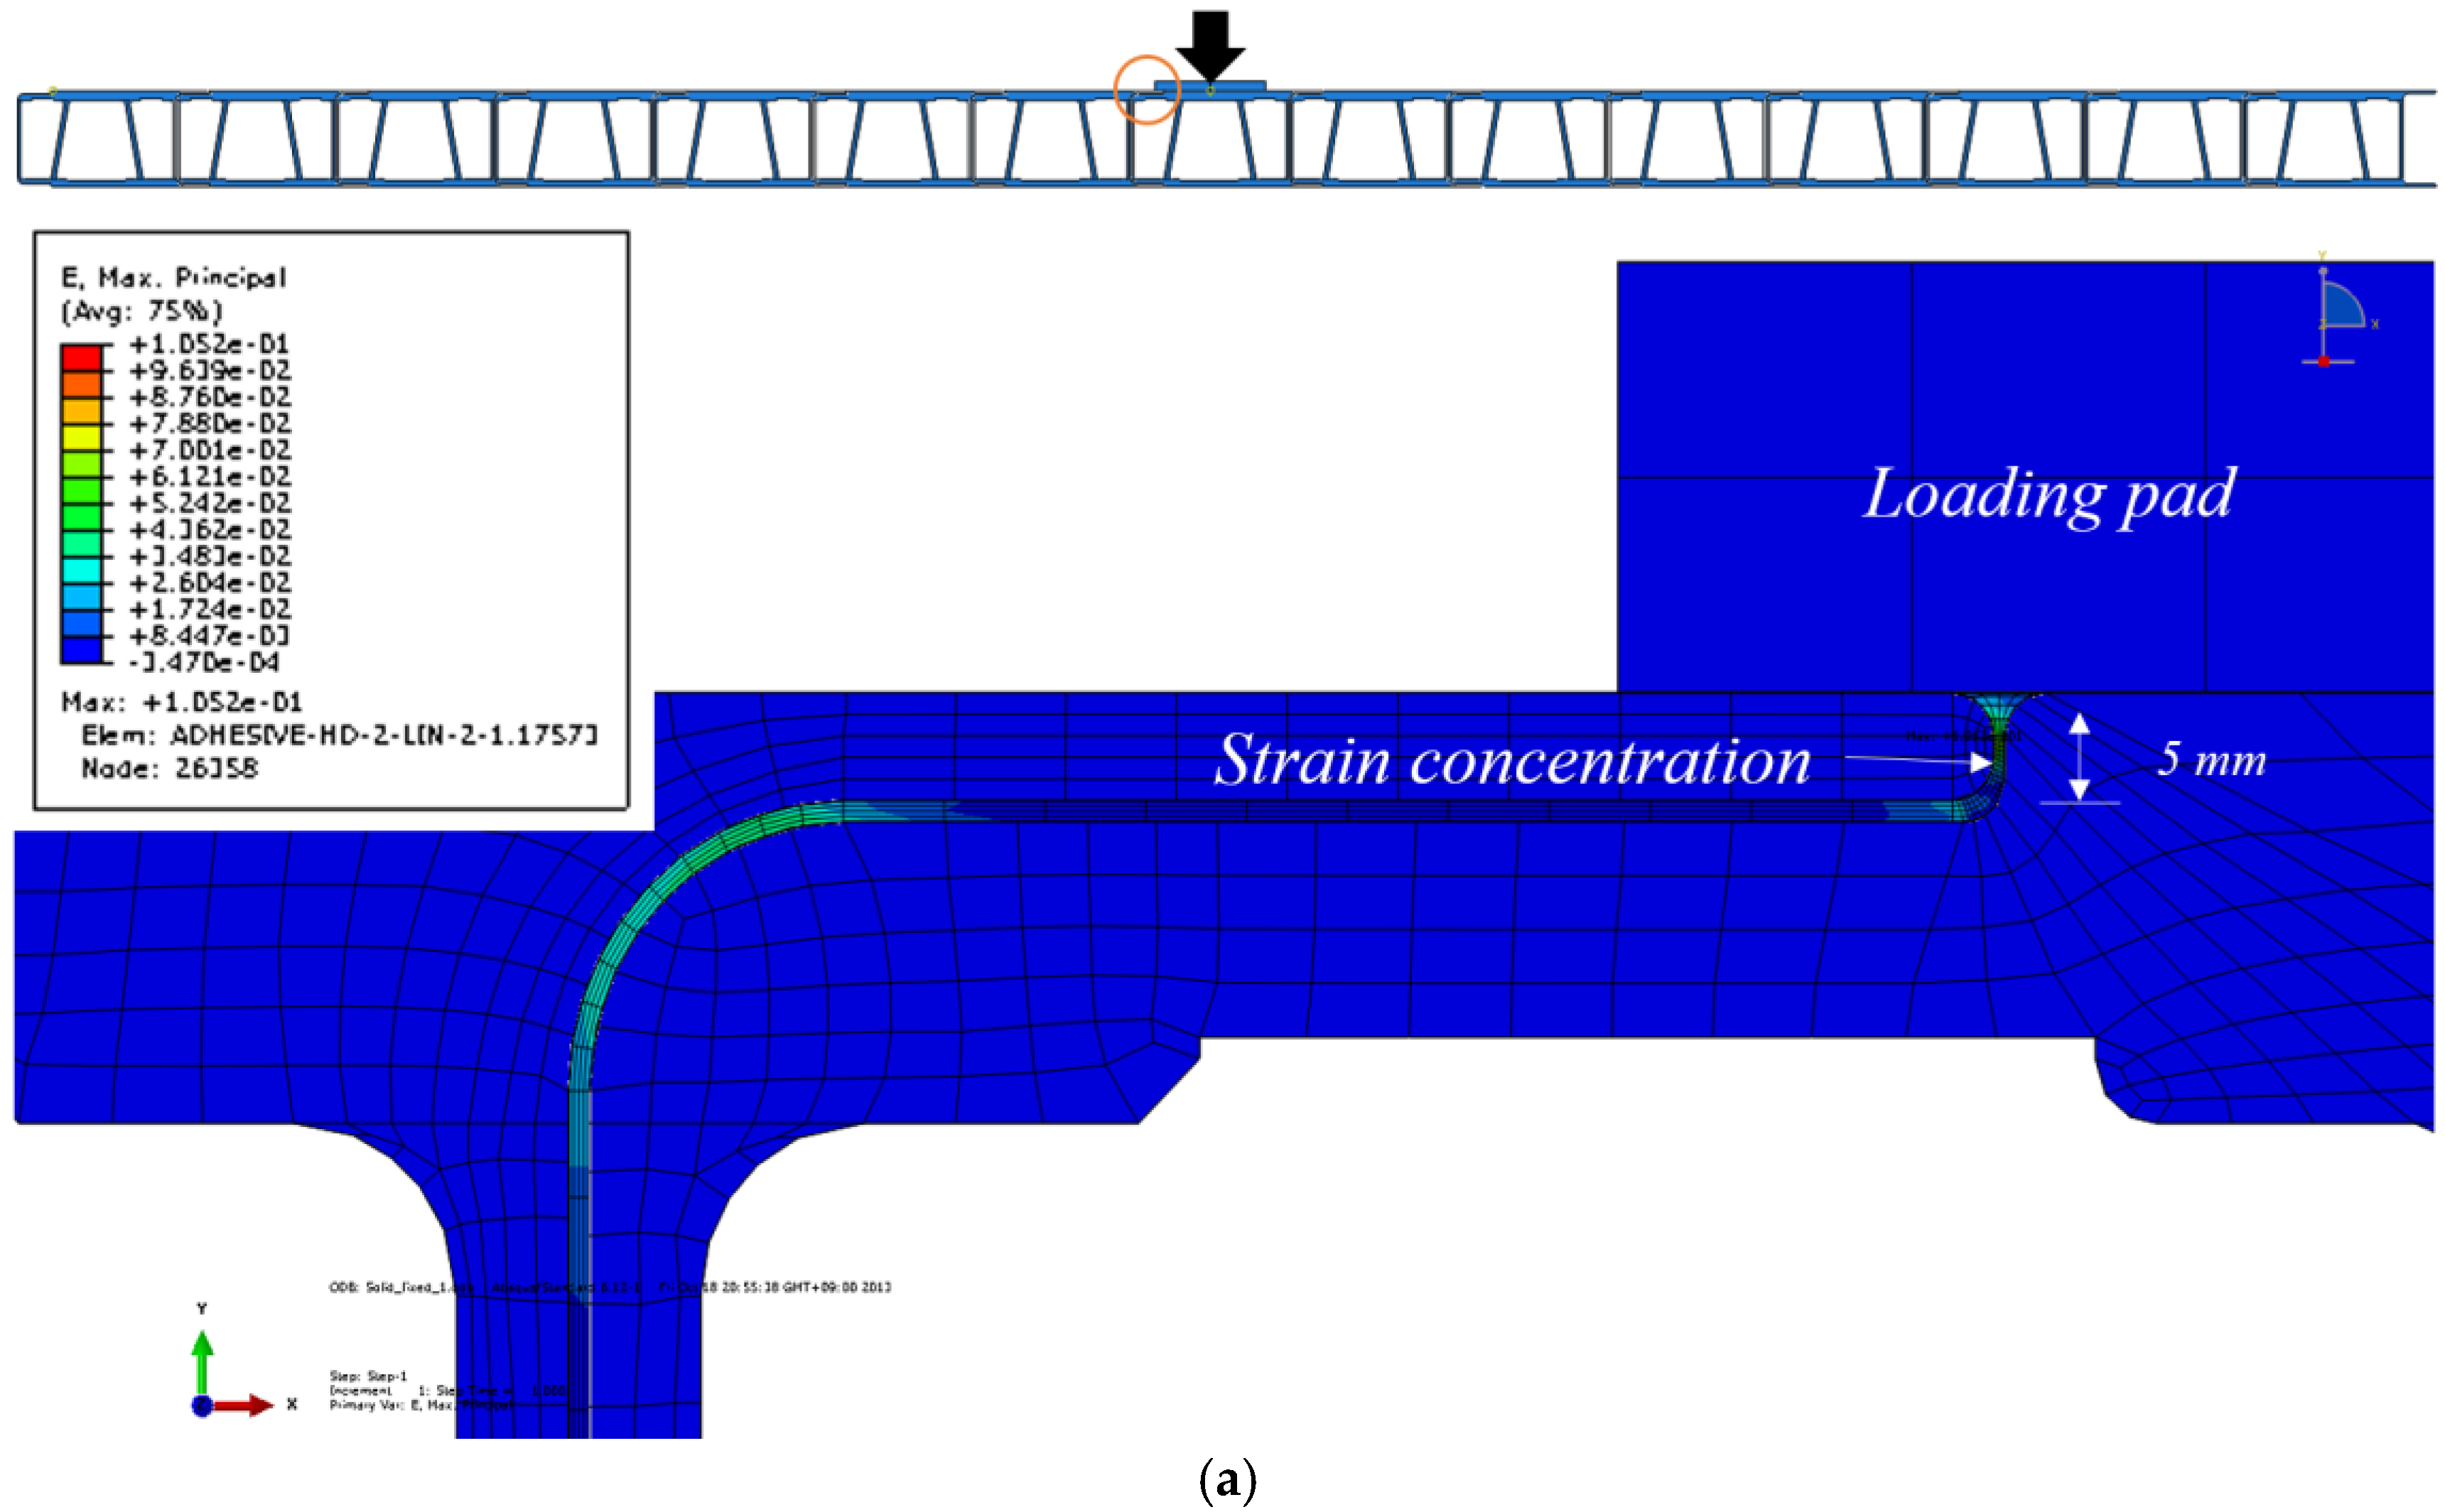
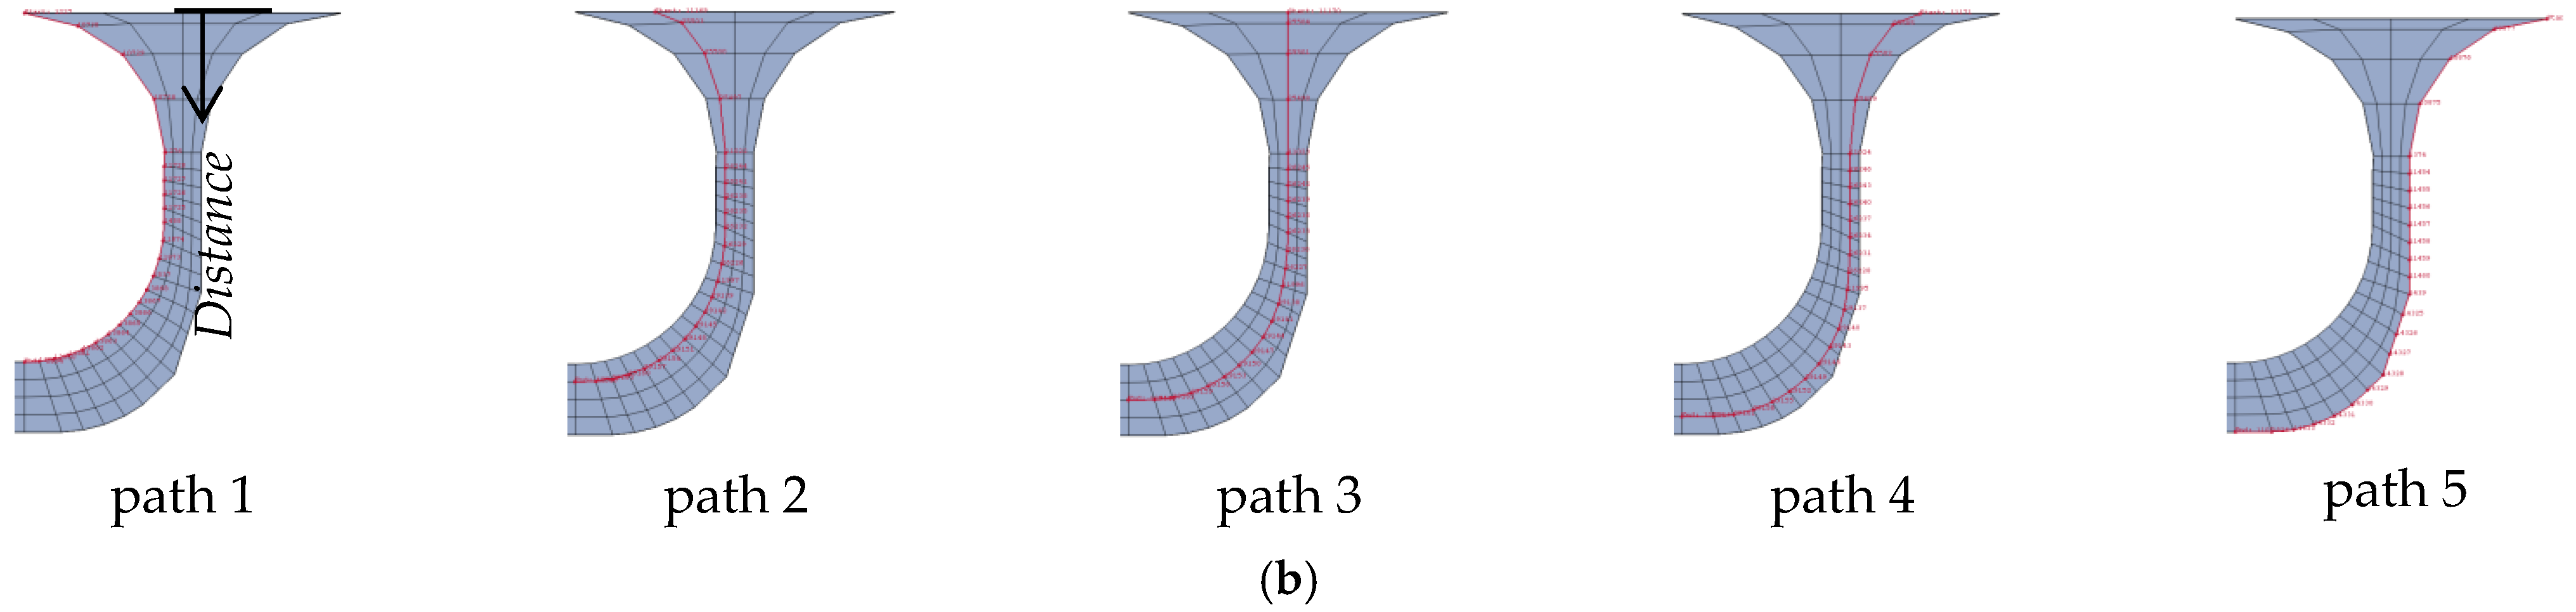
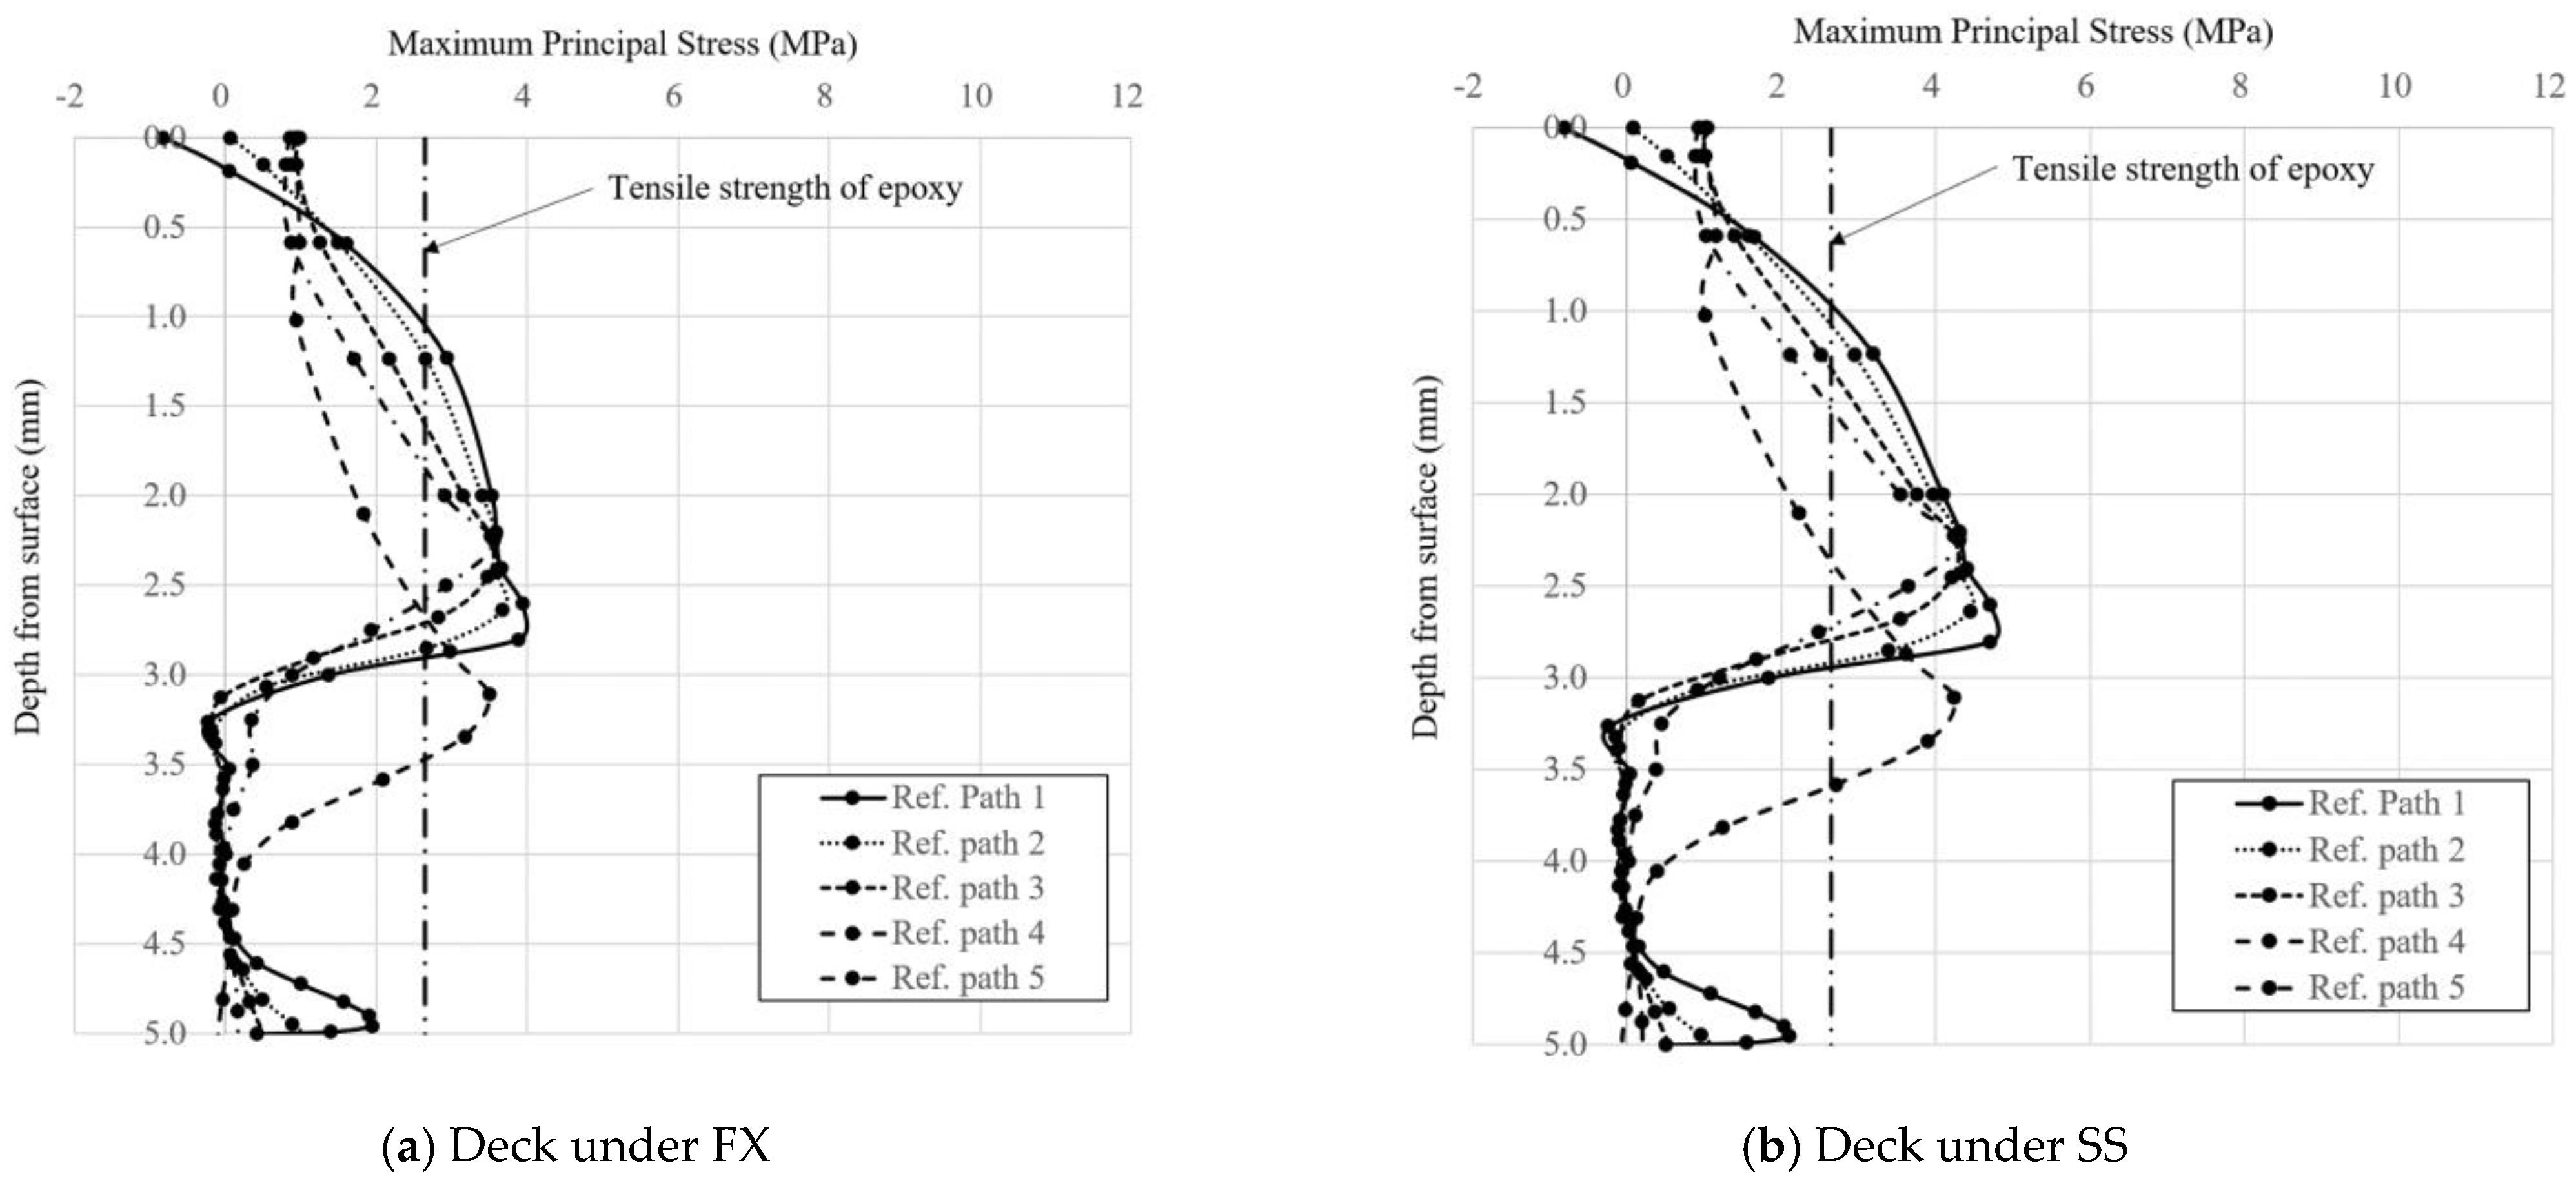
Figure 15a shows the contours of the principal strains near the loading area of the deck under FX and LC1 in SLS. Five reference paths are defined in Figure 15b, and each path has the node sets in the adhesive element. The principal stress distributions in the adhesive along these paths are investigated to determine the change in the distribution. Figure 16 and Figure 17 show the principal stress distributions along the reference paths under LC1 and LC2, respectively, in SLS. The maximum principal stresses occurr at the necking area 2.6 mm from the deck surface under LC1 and 2.8 mm under LC2. Because the stresses at these locations exceed the design tensile strength, 2.65 MPa (tested tensile strength 6.2 MPa/partial safety factor 2.34), the adhesive material undergoes tensile failure, even in SLS. Table 13 summarizes the maximum principal stresses along each reference path. Notably, even in SLS, the calculated maximum principal stresses in the epoxy adhesive exceed the design tensile strength of 2.65 MPa, resulting in a factor of safety below 0.65. For ULS, the factor of safety is below 0.38. To avoid this failure in the adhesive, it is necessary to change the shape of the lap joint to reduce the tensile stress in the adhesive.
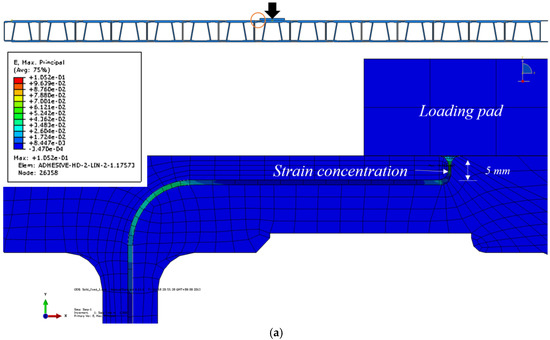
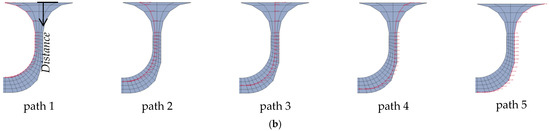
Figure 15.
Distribution of principal strain and reference paths in adhesive elements near the loading area under FX and LC1. (a) Principal strain contour near the loading area; (b) reference paths for stress examination at the edges of the adhesive joints.
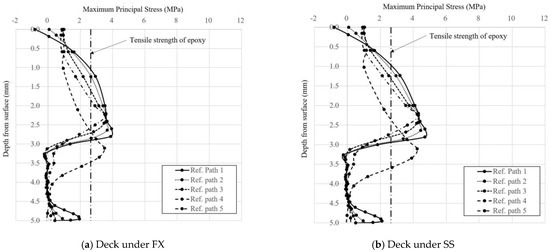
Figure 16.
Maximum principal stresses along the reference paths under LC1 in SLS.
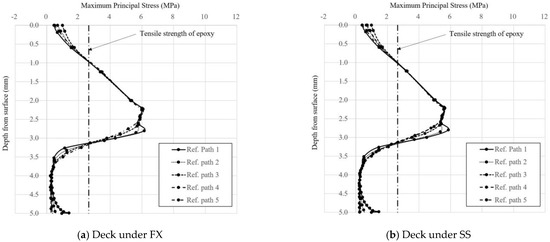
Figure 17.
Maximum principal stresses along the reference paths under LC2 in SLS.
Table 13.
Comparison between the maximum principal stress and design tensile strength of the adhesive.
4.4. Tensile Failure of Adhesive between Vertical Webs (TAW)
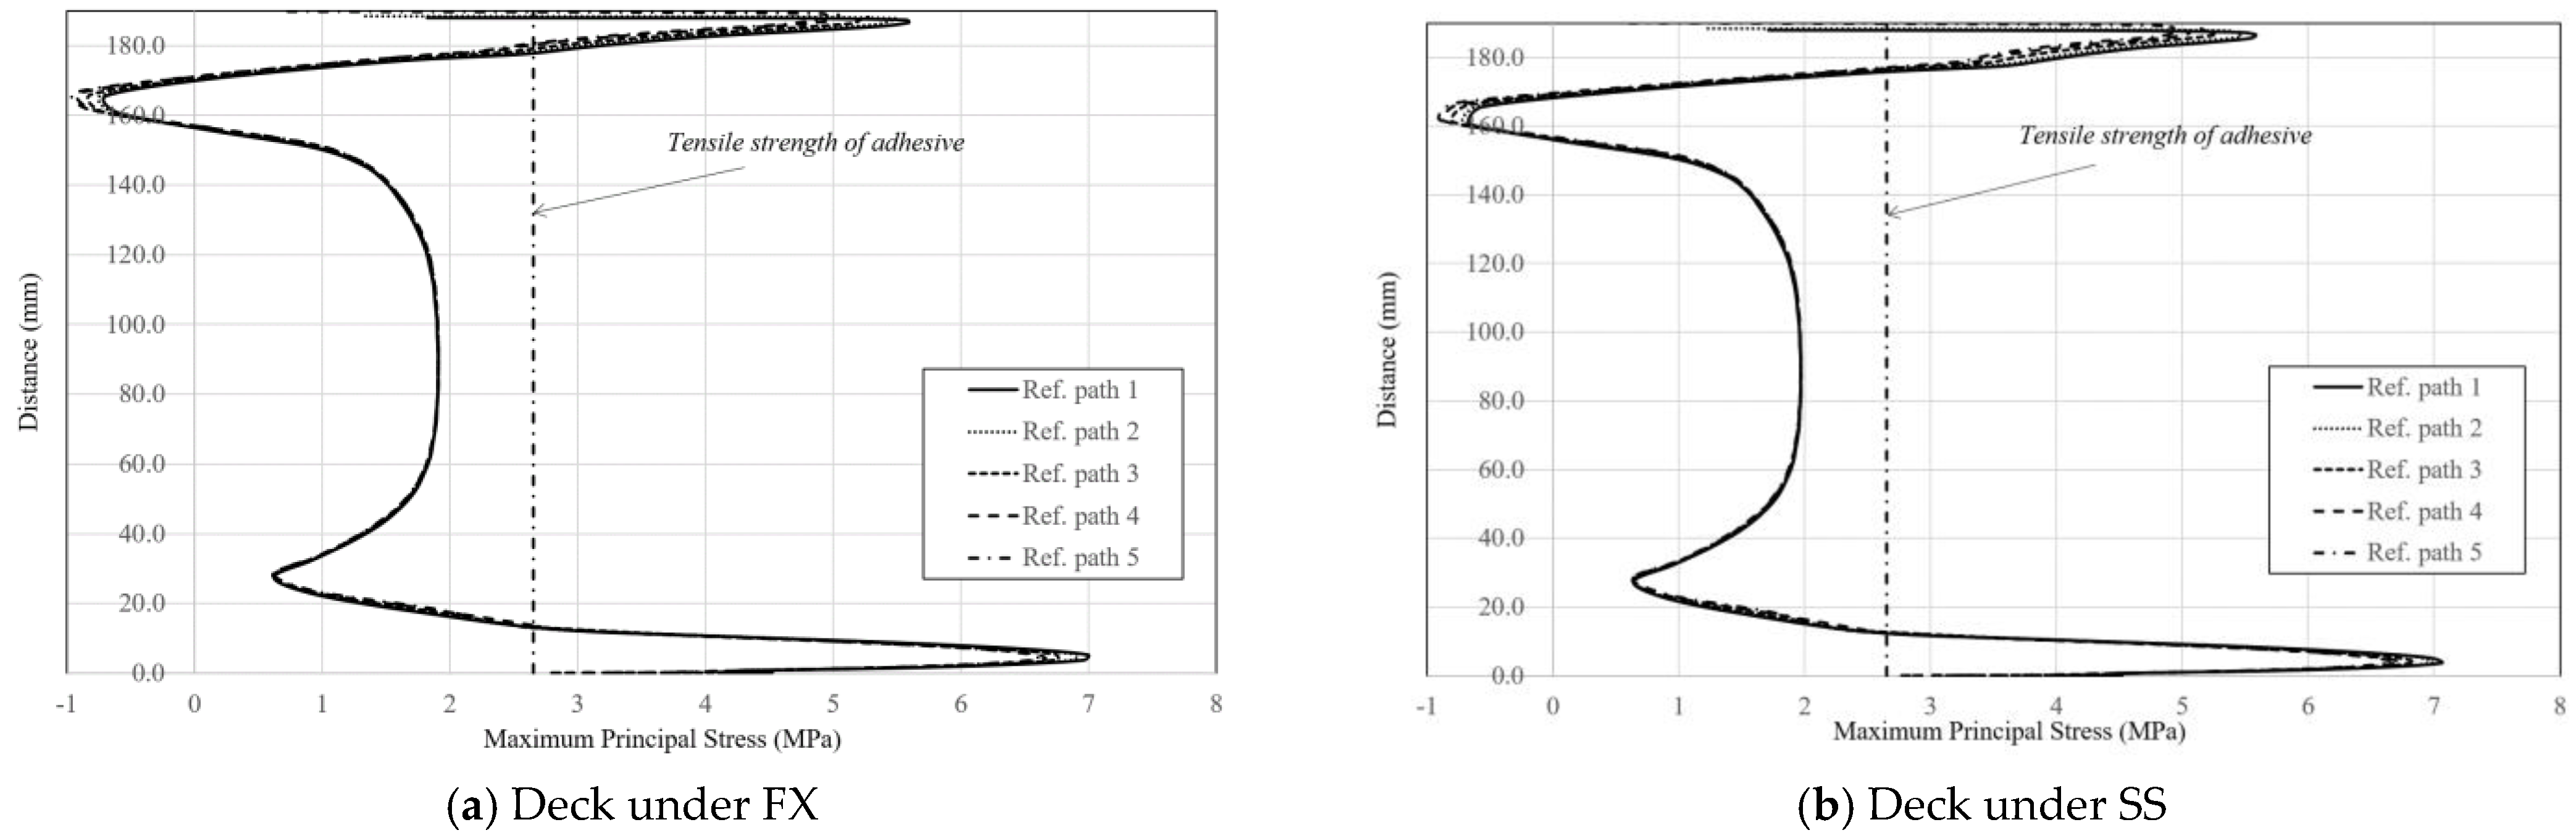
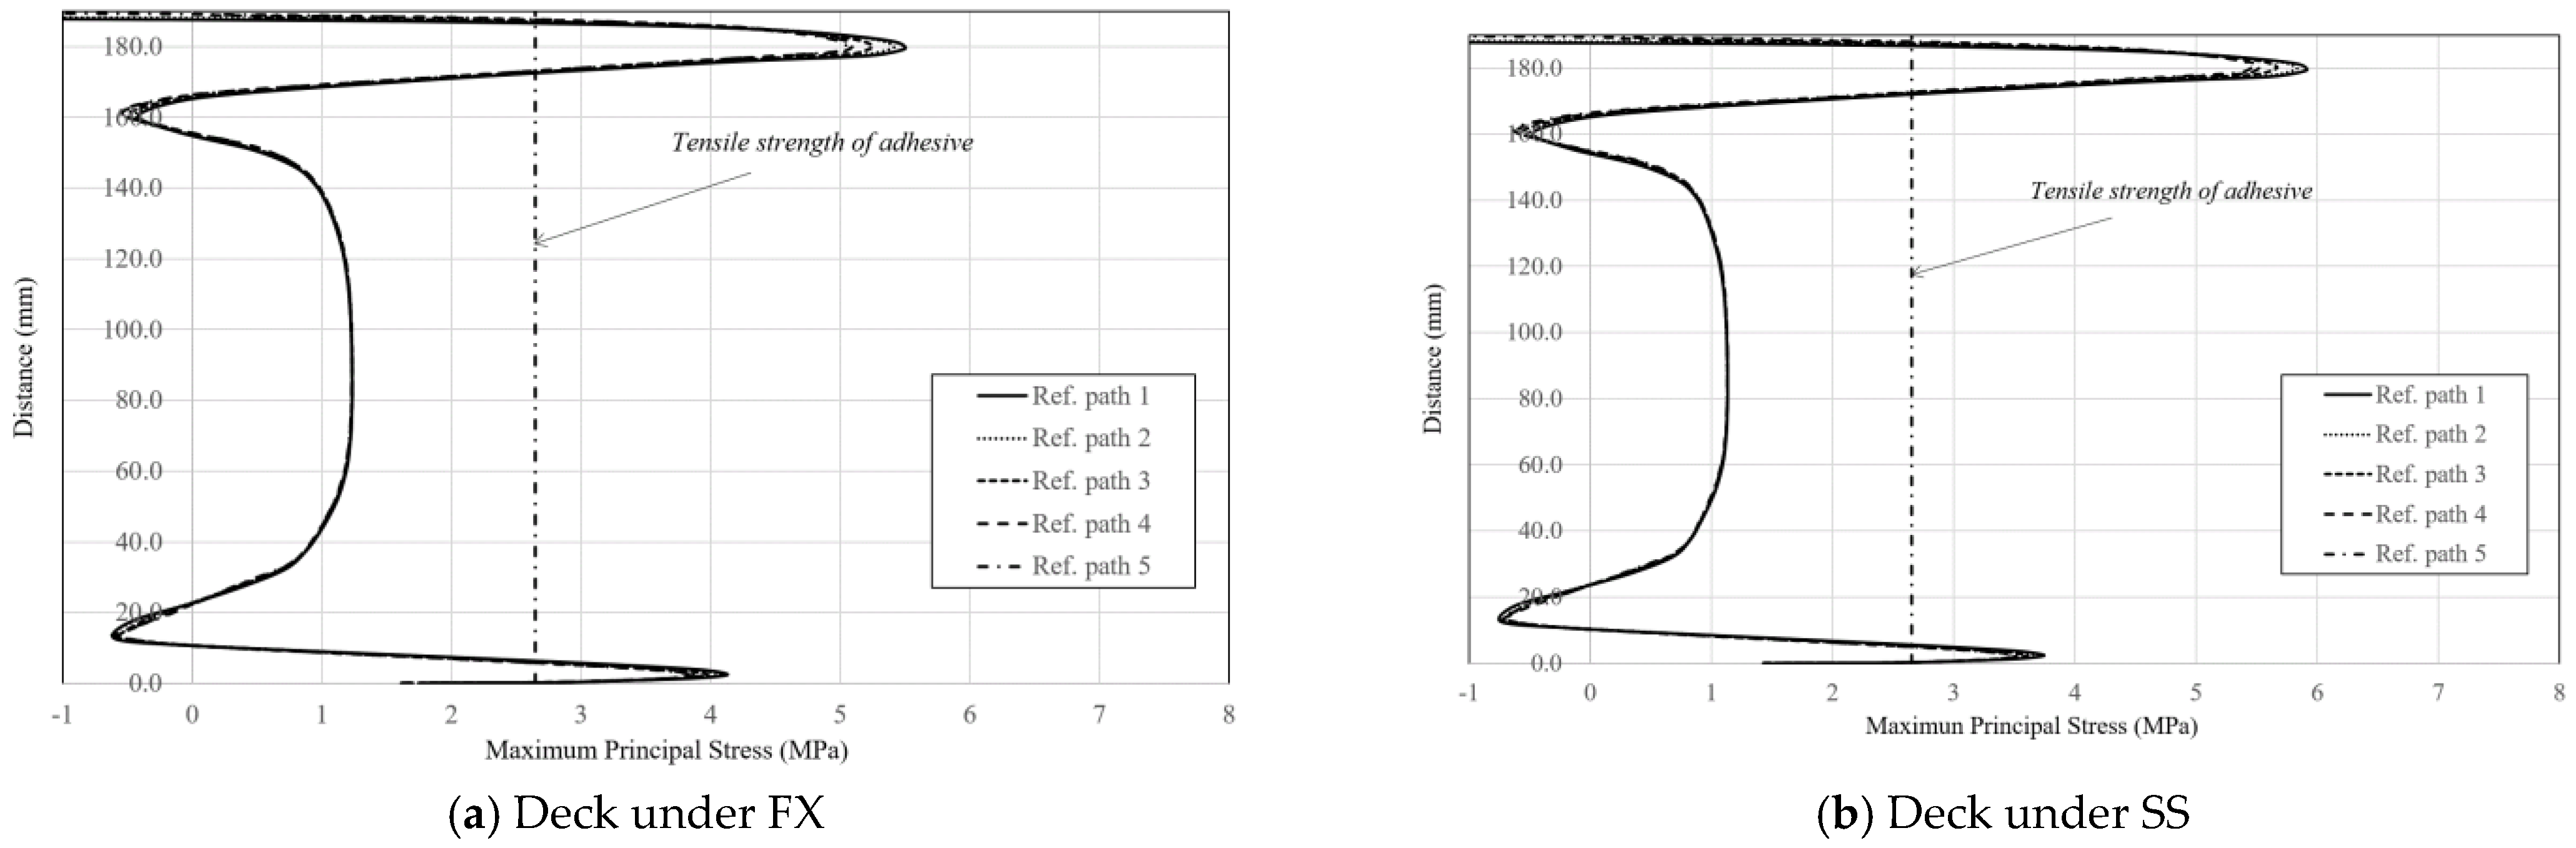
To check the stress in the adhesive between the vertical webs, five reference paths are defined from the bottom edge (0 mm) to the top edge (190 mm) in the adhesive. The safety against TAW is investigated under wheel loads in SLS and ULS. Figure 18 and Figure 19 show the distribution of principal stress along the reference paths under LC1 and LC2, respectively, in ULS. Highly concentrated principal stresses are observed near the bottom and top of the adhesive, where the orientation of the adhesive layer changes to horizontal, as shown in Figure 15a (the green curved layer on the left). At these points, the shear stress increases and, thus, governs the adhesive behavior, as described in the next section. In other words, the concentrated stresses at these locations are not categorized as TAW, but the principal stresses in the middle region of adhesive are categorized as TAW. These principal adhesive stresses are lower than the design tensile strength of 2.65 MPa without stress concentration.
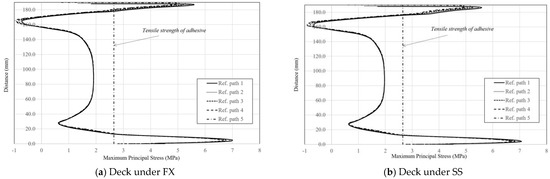
Figure 18.
Maximum principal stress in the adhesive between the vertical webs under LC1 in ULS.
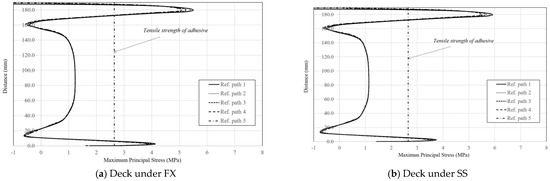
Figure 19.
Maximum principal stresses of adhesive between vertical webs under LC2 in ULS.
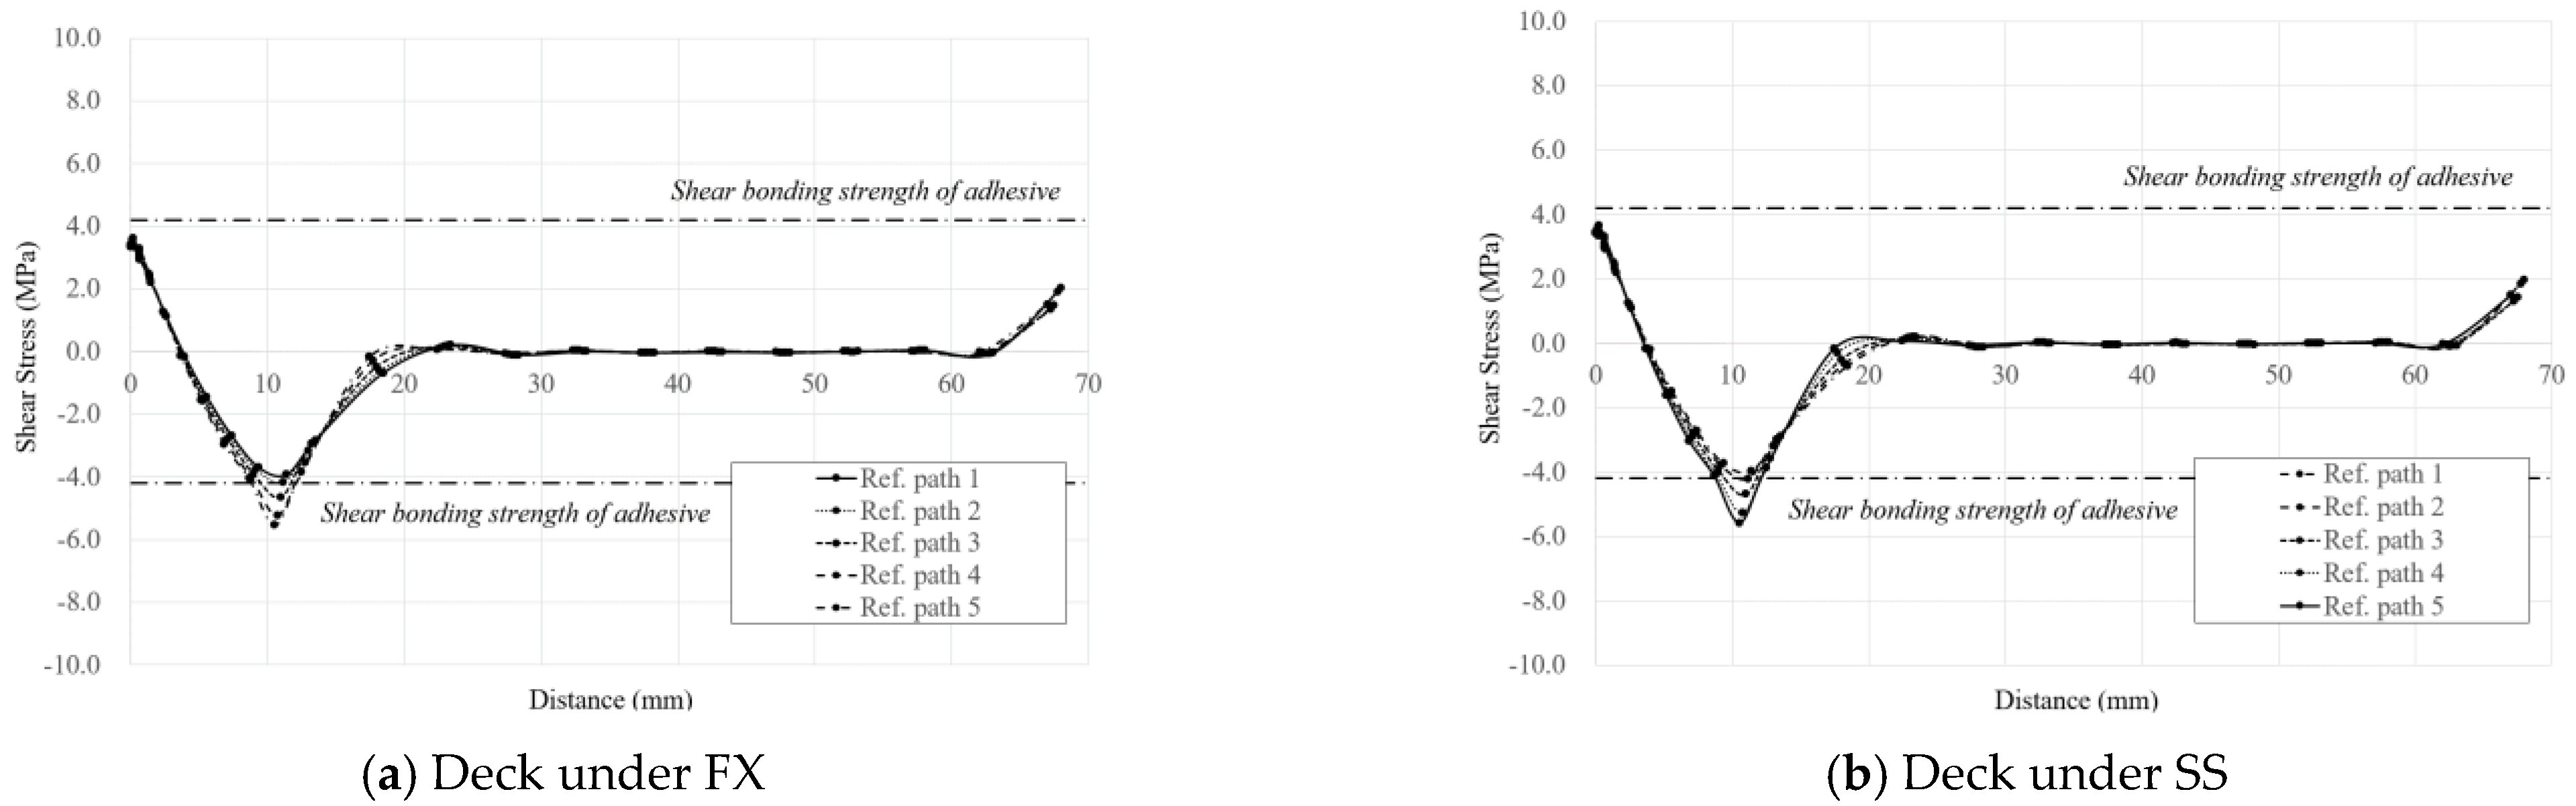
4.5. Shear Failure of Adhesive between Flanges (SAF)
TG200 bridge decks typically have stepped lap joints at the bottom and top plates that connect the deck tubes (Figure 1a). In this joint configuration, the strain and stress of adhesive between flanges tend to concentrate at the edges [22,23,24,25,26]. The stresses along the five reference paths in the adhesive layer shown in Figure 20 are calculated, and safety against SAF is checked.
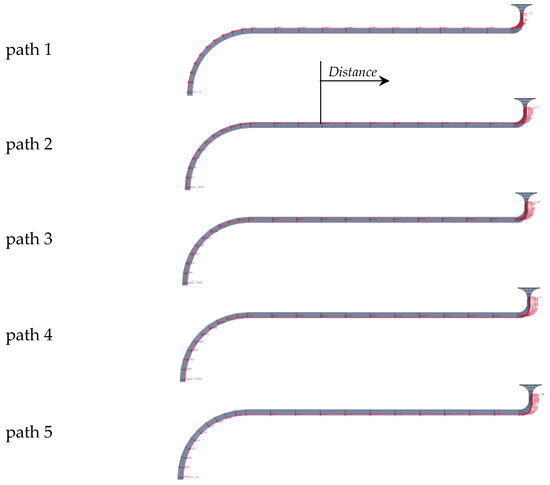
Figure 20.
Reference paths along the adhesive between flanges.
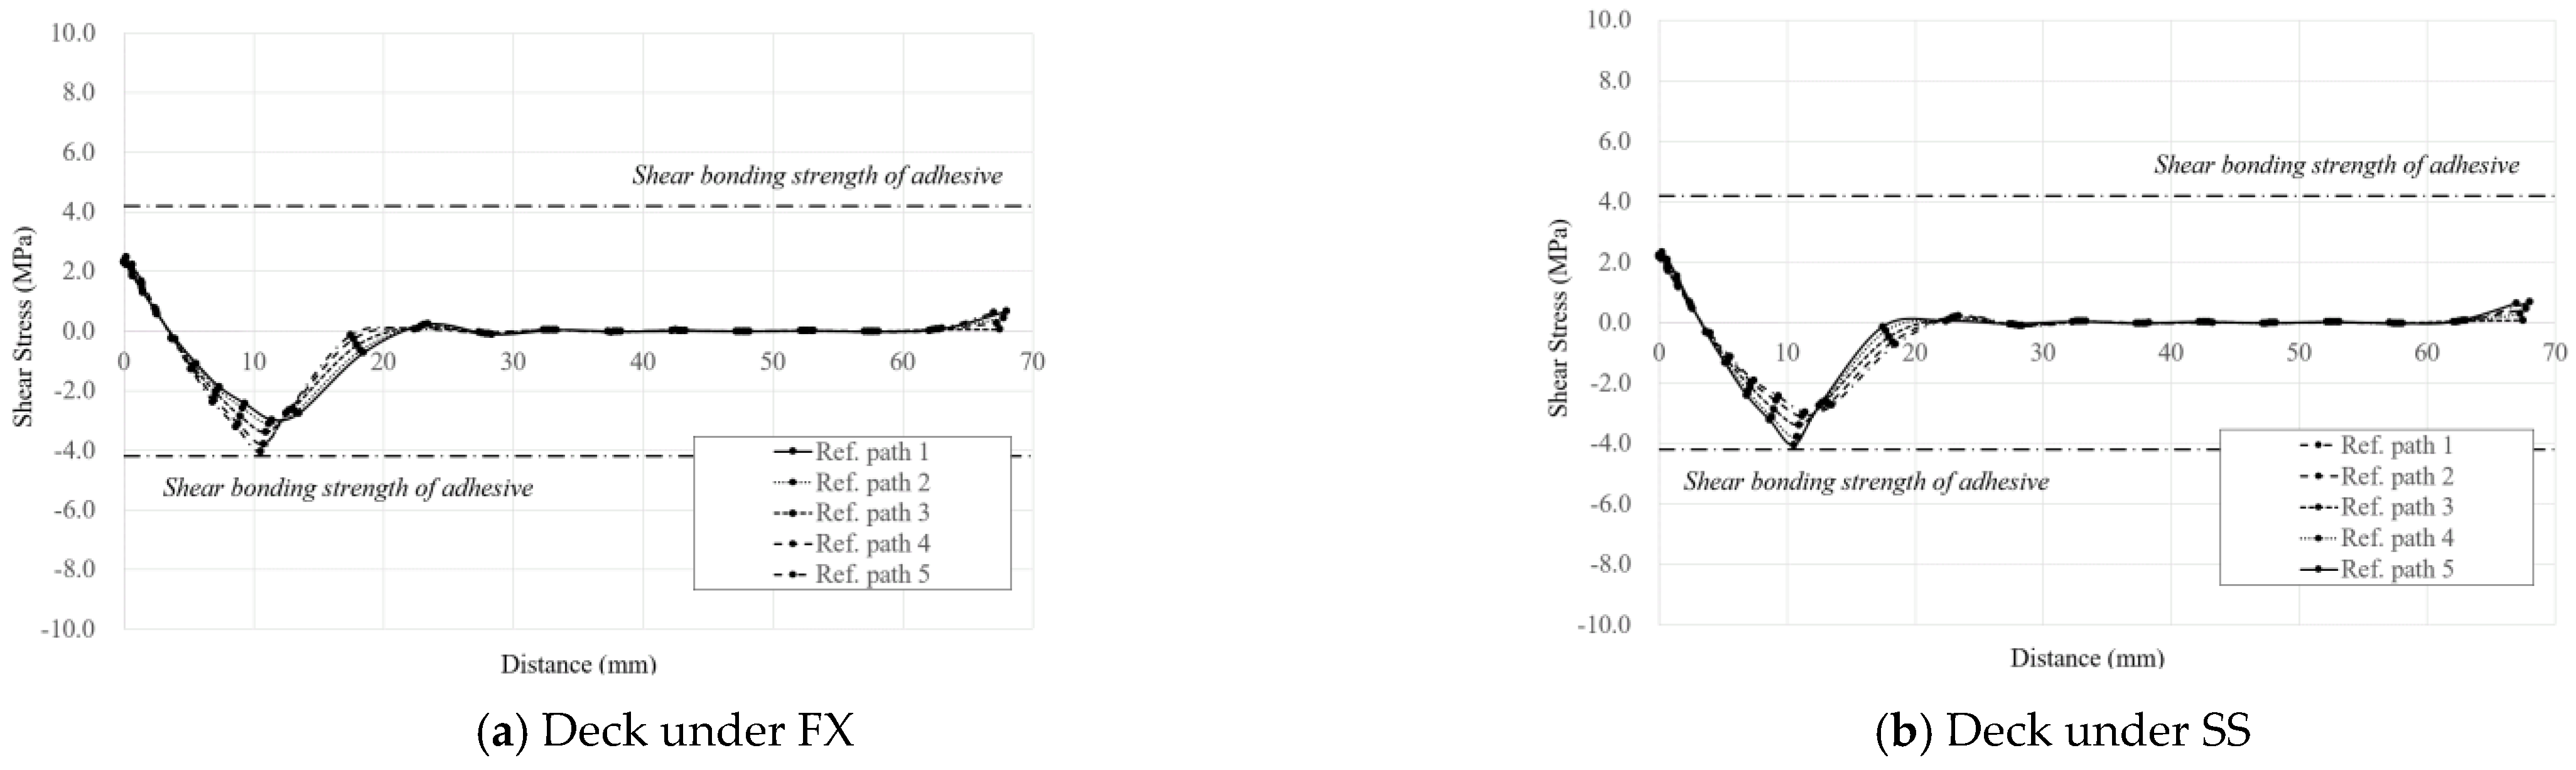
Figure 21 and Figure 22 show the shear stress distributions along the reference paths under LC1 and LC2, respectively, in ULS. The distributions of the shear stress are almost the same, regardless of the boundary conditions under the same load configuration. Table 14 summarizes the maximum shear stresses of the adhesive layer along the reference paths between bonded flanges. For the deck in ULS and LC1, the maximum shear stresses in the adhesive are 5.53 MPa and 5.58 MPa under FX and SS, respectively, which exceed the 4.19 MPa design shear strength of the adhesive (shear strength 9.8 MPa/partial safety factor 2.34). To prevent this failure, it is necessary to reduce the shear stress by modifying the bonding configuration or selecting adhesives with higher shear strength.
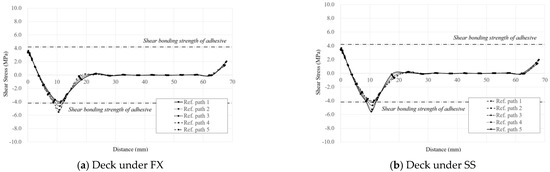
Figure 21.
Shear stress of adhesive between flanges under LC1 in ULS.
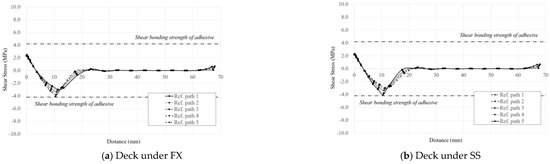
Figure 22.
Shear stress of adhesive between flanges under LC2 in ULS.
Table 14.
Maximum shear stresses in adhesive between bonded flanges.
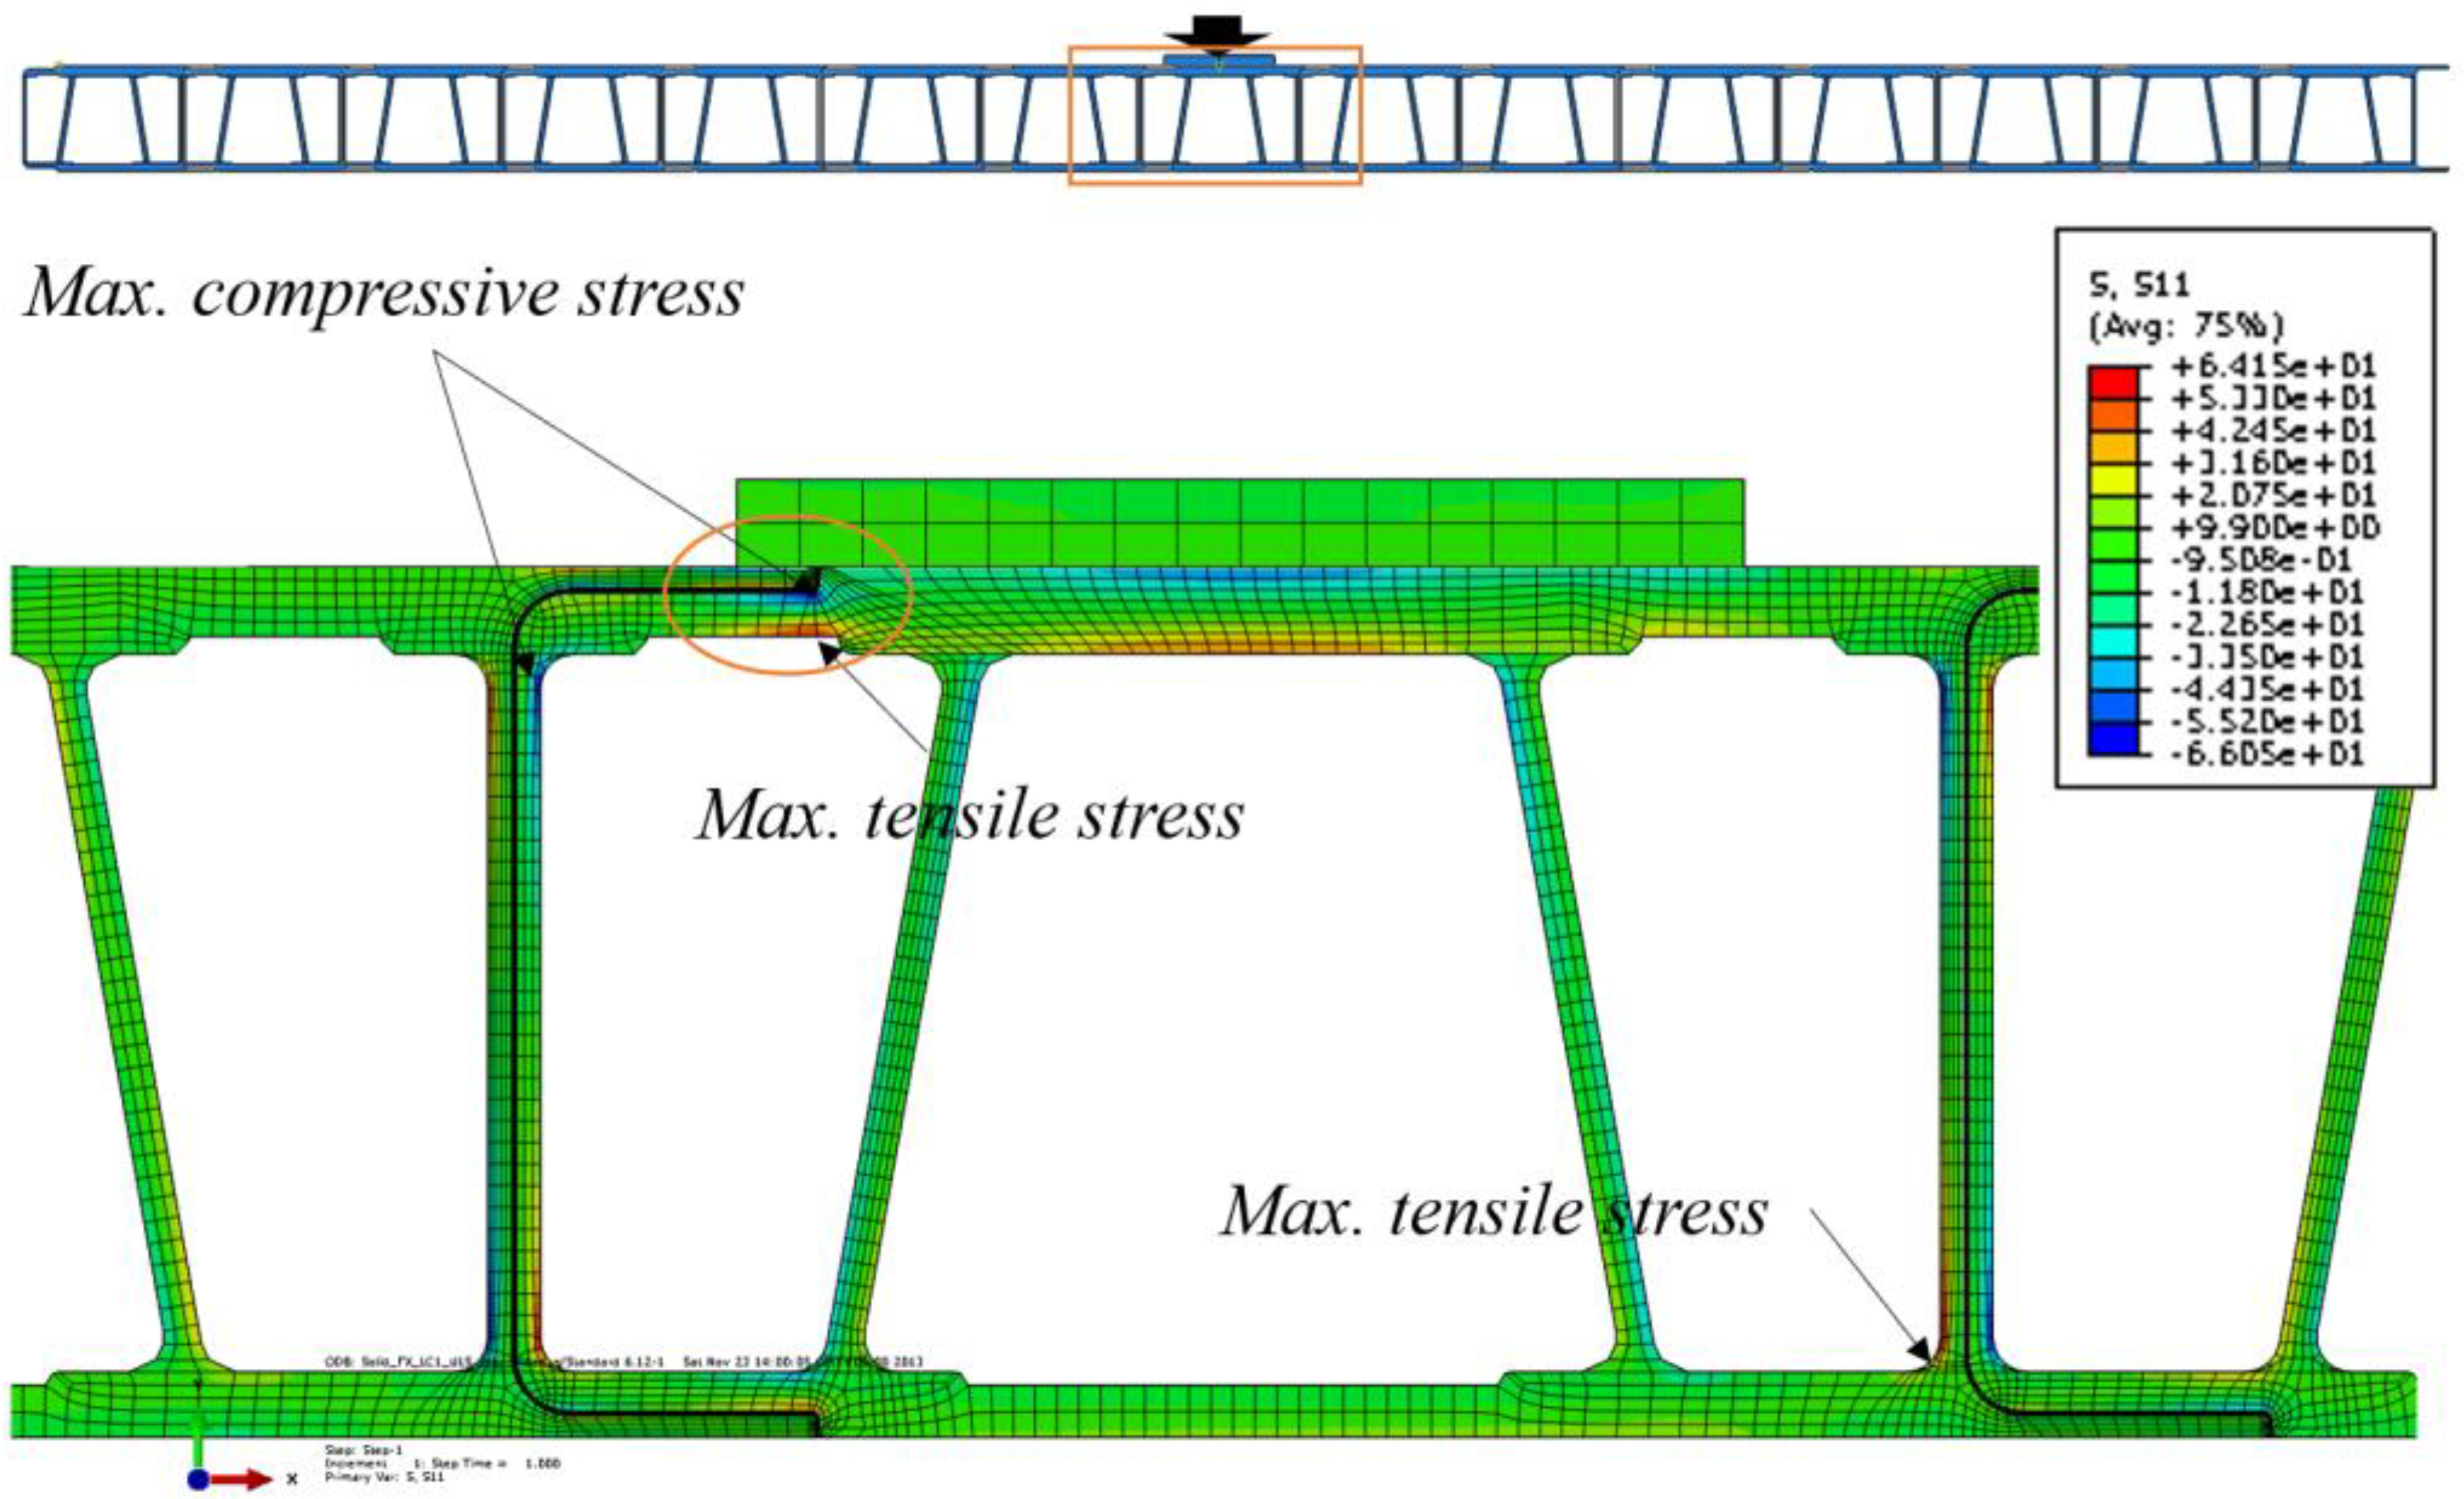
4.6. Failure of Deck Substrate at Discontinuous Dimension in Section (FSD)
Where the thicknesses of horizontal (top and bottom) plates change or the web and horizontal plate are joined together, the amount of fibers changes. These geometric (thickness change) and material (fiber amount change) discontinuities in the section cause stress concentration in the deck substrate due to local flexure under weak-axis bending [11]. Geometric discontinuity is considered in the FE model, but the material discontinuity is not fully considered because the coupon test results are not sufficient. For more precise analyses, coupon tests should be performed for all parts with different thicknesses or fiber layers.
The tensile and compressive stress in the deck substrate are calculated to check for safety against FSD. Figure 23 shows the contours of the compressive and tensile stresses of the deck substrate near the loading area under LC1 and FX in ULS. The stresses concentrate where dimensions change discontinuously in the section, such as in the stepped lap joint in the flange and the corner between the flange and the web. Table 15 and Table 16 summarize the maximum values of these compressive and tensile stresses. At the stepped lap joint in the flange, the maximum compressive and tensile stresses slightly exceed the design strength of the deck substrate in ULS (bold numbers in Table 15). At the corner between the flange and the web, the maximum compressive and tensile stresses are considerably greater than the design strength of the deck substrate in ULS (bold numbers in Table 16). The design strengths of the flange and web are determined, as shown in Table 10, based on the test strengths [1,3] and the partial safety factor (Table 5). The minimum of the design strengths for the flange and the web is taken as the corner design strength. To prevent this failure, more fibers should be provided at these locations to increase the compressive and tensile design strengths.

Figure 23.
Contour of compressive and tensile stresses near the loading area under LC1 and FX in ULS.
Table 15.
Maximum tensile and compressive stresses at the stepped lap joint in the flange.
Table 16.
Maximum tensile and compressive stresses at the corner between the flange and web.
5. Conclusions
This paper presents an analysis example of an adhesively connected GFRP bridge deck under bidirectional bending from traffic wheel loads, as per the Korean Highway Bridge Design Code. The FE analyses are performed considering the local behavior of the deck substrate and adhesive at the joints. The global deflection of the deck and the local deformation of the adhesive joint under SLS are determined. The local stresses are calculated to check the four failure modes of the adhesive joint: (1) TAF, (2) TAW, (3) SAF, and (4) FSD. The following conclusions are drawn:
- (1)
- Analysis Method for Checking Joint Safety: The analysis method for checking the failures of the joints are newly presented for FRP decks under traffic loads. This method can be applied for designing and evaluating joints of other FRP decks.
- (2)
- Deflection: The deck deflects more under the single-wheel load of the rear axle than under the double-wheel loads of the middle axle. Thus, the former case governs the deflection limit in SLS. The GFRP decks do not satisfy the serviceability deflection limit for vehicular bridges (L/800); thus, it is necessary to increase the flexural stiffness or decrease the span in strong axis.
- (3)
- Local Deformation of Adhesive at Joints: The weak-axis tensile strains along the top and bottom surfaces of the deck tend to highly concentrate at the adhesives near the loading area. These concentrated tensile strains cause tensile failure of the adhesive and reflective cracks on the asphalt pavement. To avoid these problems, it is necessary to reduce the strain in the adhesive by selecting an adhesive with a higher stiffness or optimizing the joint configuration.
- (4)
- Tensile Failure of Adhesive at Joint Edge between Bonded Flanges (TAF): The maximum tensile stress occurs in the necking area, away from the deck surface. Tensile failure in the adhesive occurs under SLS and ULS. This adhesive tensile failure should be avoided by changing the lap joint shape to reduce tensile stresses.
- (5)
- Tensile Failure of Adhesive between Vertical Webs (TAW): Because the principal adhesive stresses are lower than the design tensile strength, the adhesive is safe against TAW.
- (6)
- Shear Failure of Adhesive between Flanges (SAF): For the deck subjected to the single-wheel load of the rear axle under ULS, the shear failure in adhesive occurs. To prevent this failure, it is necessary to reduce the shear stress by modifying the bonding configuration or selecting adhesives with higher shear strengths.
- (7)
- Failure of Deck Substrate at Discontinuous Dimension in Section (FSD): At the stepped lap joint in the flange, the maximum compressive and tensile stresses are slightly higher than the design strength of the deck substrate in ULS. At the corner between the flange and the web, the maximum compressive and tensile stresses are signifcantly greater than the design strength of the deck substrate in ULS. To prevent this failure, more fibers should be provided at these locations to increase the design strength of the deck substrate.
- (8)
- Limitation and future study: Because the test results are not sufficient to determine the orthotropic material properties for the 3D solid elements of the deck, it is necessary to perform all types of coupon tests to measure them, considering geometric (thickness change) and material (fiber amount change) discontinuities in the section. If failure at the bonding surface between the deck tubes and adhesive is to be considered, nonlinear tie elements or contact elements should be used, based on the corresponding test results.
Author Contributions
Conceptualization, S.-Z.P., S.-H.J., H.L. and K.-J.H.; Data curation, S.-Z.P. and K.-J.H.; Formal analysis, S.-Z.P., H.L. and K.-J.H.; Funding acquisition, S.-H.J.; Investigation, S.-Z.P. and H.L.; Methodology, K.-J.H.; Project administration, K.-J.H.; Resources, S.-H.J. and K.-J.H.; Supervision, K.-J.H.; Writing—original draft, S.-Z.P., S.-H.J., H.L. and K.-J.H.; Writing—review & editing, S.-Z.P., S.-H.J., H.L. and K.-J.H. All authors have read and agreed to the published version of the manuscript.
Funding
This study was supported by the Inha University Research Grant.
Institutional Review Board Statement
Not applicable.
Informed Consent Statement
Not applicable.
Data Availability Statement
Data sharing is not applicable to this article.
Acknowledgments
This study was supported by the Inha University Research Grant.
Conflicts of Interest
The authors declare no conflict of interest.
References
- Lee, S.-W. Development of High Durable, Light Weight and Fast Installable Composite Deck; Ministry of Construction and Transportation: Seoul, Korea, 2004.
- Lee, S.-W.; Hong, K.-J.; Park, S.-Z. Current and future applications of glass-fibre-reinforced polymer decks in Korea. Struct. Eng. Int. 2010, 20, 405–408. [Google Scholar] [CrossRef]
- Park, S.-Z. A Study on Weak-Axis Bending Behavior of a Pultruded GFRP Bridge Deck; Kookmin University: Seoul, Korea, 2013. [Google Scholar]
- Mara, V.; Haghani, R.; Harryson, P. Bridge decks of fibre reinforced polymer (FRP): A sustainable solution. Constr. Build Mater. 2014, 50, 190–199. [Google Scholar] [CrossRef] [Green Version]
- Zhou, A.; Keller, T. Joining techniques for fiber reinforced polymer composite bridge deck systems. Compos. Struct. 2005, 69, 336–345. [Google Scholar] [CrossRef]
- Telang, N.M. Field Inspection of in-Service FRP Bridge Decks; The National Academies Press: Washington, DC, USA, 2006. [Google Scholar]
- Triandafilou, L.N.; O’Connor, J.S. Field issues associated with the use of fiber-reinforced polymer composite bridge decks and superstructures in harsh environments. Struct. Eng. Int. J. Int. Assoc. Bridge Struct. Eng. 2010, 20, 409–413. [Google Scholar] [CrossRef]
- Park, K.-Y.; Kim, S.-H.; Lee, Y.-H.; Hwang, Y.-K. Pilot test on a developed GFRP bridge deck. Compos. Struct. 2005, 70, 48–59. [Google Scholar] [CrossRef]
- Zi, G.; Kim, B.M.; Hwang, Y.-K.; Lee, Y.-H. An experimental study on static behavior of a GFRP bridge deck filled with a polyurethane foam. Compos. Struct. 2008, 82, 257–268. [Google Scholar]
- Xin, H.; Mosallam, A.; Liu, Y.; Wanga, C.; Zhang, Y. Analytical and experimental evaluation of flexural behavior of FRP pultruded composite profiles for bridge deck structural design. Constr. Build. Mater. 2017, 150, 123–149. [Google Scholar] [CrossRef]
- Park, S.-Z.; Hong, K.-J.; Lee, S.-W. Behavior of an adhesive joint under weak-axis bending in a pultruded GFRP bridge deck. Compos. Part B Eng. 2014, 63, 123–140. [Google Scholar] [CrossRef]
- King, L.; Toutanji, H.; Vuddandam, R. Load and resistance factor design of fiber reinforced polymer composite bridge deck. Compos. Part B Eng. 2012, 43, 673–680. [Google Scholar] [CrossRef]
- AASHTO. AASHTO LRFD Bridge Design Specifications, 9th ed.; American Association of State Highway Transportation Officials: Washington, DC, USA, 2020. [Google Scholar]
- KDS 24 12 21; Korean Highway Bridge Design Code (Limit State Design Code). Korean Ministry of Land, Infrastructure and Transport: Sejong, Korea, 2021.
- CD 368; Design of Fiber Reinforced Polymer Bridges and Highway Structures. Highways England: Birmingham, UK, 2020.
- AASHTO. Guide Specifications for Design of FRP Pedestrian Bridges, 1st ed.; American Association of State Highway and Transportation Officials: Washington, DC, USA, 2008. [Google Scholar]
- Clarke, J.L. Structural Design of Polymer Composites: Eurocomp Design Code and Handbook; CRC Press: Boca Raton, FL, USA, 2019. [Google Scholar]
- ABAQUS. ABAQUS Standard: User’s Manual 6.12; SIMULIA: Providence, RI, USA, 2012. [Google Scholar]
- Kosmatka, J.B.; Grippo, W.; Policelli, F.; Charbonnet, S.; Randolph, B.; Hegemier, G. Advanced Composites for Bridge Infrastructure Renewal: Phase II, DARPA; University of California: San Diego, CA, USA, 2000; p. 326. [Google Scholar]
- Hollaway, L. Polymer Composites for Civil and Structural Engineering; Springer: Berlin/Heidelberg, Germany, 1993. [Google Scholar]
- Qiao, P.; Davalos, J.F.; Brown, B. A systematic analysis and design approach for single-span FRP deck/stringer bridges. Compos. Part B 2000, 31, 593–609. [Google Scholar] [CrossRef]
- Jiang, X.; Kolstein, M.H.; Bijlaard, F.S.K. Study on mechanical behaviors of FRP-to-steel adhesively-bonded joint under tensile loading. Compos. Struct. 2013, 98, 192–201. [Google Scholar] [CrossRef]
- Jiang, X.; Kolstein, M.H.; Bijlaard, F.S.K. Experimental and numerical study on mechanical behavior of an adhesively-bonded joint of FRP-steel composite bridge under shear loading. Compos. Struct. 2014, 108, 387–399. [Google Scholar] [CrossRef]
- Keller, T.; Vallée, T. Adhesively bonded lap joints from pultruded GFRP profiles. Part II: Joint strength prediction. Compos. Part B Eng. 2005, 36, 341–350. [Google Scholar] [CrossRef]
- Keller, T.; Vallée, T. Adhesively bonded lap joints from pultruded GFRP profiles. Part I: Stress–strain analysis and failure modes. Compos. Part B Eng. 2005, 36, 331–340. [Google Scholar] [CrossRef]
- Zetterberg, T.; Åström, B.T.; Bäcklund, J.; Burman, M. On design of joints between composite profiles for bridge deck applications. Compos. Struct. 2001, 51, 83–91. [Google Scholar] [CrossRef]


Publisher’s Note: MDPI stays neutral with regard to jurisdictional claims in published maps and institutional affiliations. |
© 2022 by the authors. Licensee MDPI, Basel, Switzerland. This article is an open access article distributed under the terms and conditions of the Creative Commons Attribution (CC BY) license (https://creativecommons.org/licenses/by/4.0/).