Abstract
South Korea relies on imports for most of its oil consumption, but its oil refining industry has grown into one of the most important national industries and ranks fifth in the world in terms of refining capacity. This study seeks to examine the export competitiveness of the South Korean oil refining industry over the period 2000–2019. To this end, an analysis of the trade specialization index, the revealed comparative advantage, and the 2 × 2 matrix of these two measurements is carried out. The results show that automobile gasoline, jet oil, and lubricant oil belonged to the ‘high competitiveness group’ for the entire period, whereas naphtha belonged to the ‘import-specialized group with comparative advantage’ for the entire period. Finally, aviation gasoline, bunker A oil, bunker B oil, and bunker C oil fluctuated between the ‘low competitiveness group’ and the ‘export-specialized group with comparative disadvantage’. To enhance the export competitiveness of the oil refining industry, this research suggests reorganizing the irrational tax structure and actively utilizing by-products generated during the refining process.
1. Introduction
The global oil refining industry is facing various changes in the policy environment. The regulation of the International Maritime Organization, called IMO 2020, requires a reduction in the sulfur content of fuel oil from 3.5 to 0.5% or less for all ships operating international routes from 2020 [1]. Considering that the global demand for marine fuel accounts for 7% of the total oil demand, and 50% of the world demand for high sulfur oil is for ships, the change in demand for oil is expected to be large following the introduction of IMO 2020 [2].
Policies for the dissemination of eco-friendly vehicles are also causing major changes in the oil refining industry. Canada has committed to 100% of new cars sold being zero emission vehicles by 2040. The European Union imposes fines on automakers when they exceed the average CO2 emission target, and credits companies that make a high proportion of vehicles with emissions of 50 g of CO2 per km or less.
On the other hand, the oil refining industry is one of the key industries in South Korea. As of 2020, South Korea’s oil consumption ranked eighth in the world, and South Korea was the fifth largest oil importer in the world after China, the United States, India, and Japan. Accordingly, the oil refining industry has an important position in the South Korean economy. The contribution of the oil refining industry to South Korea’s total output in 2018 was 3.32%, higher than the contributions of the semiconductor (3.10%) and steel industries (2.28%). In addition, the export contribution of the oil refining industry in 2018 was 5.96%, lower than the contribution of the semiconductor industry (9.10%), but higher than those of the steel (4.39%) and automobile industries (3.33%).
However, the South Korean oil refining market is facing a deterioration in business performance due to a decrease in domestic and export demand, a decrease in refining margins, and a drop in oil prices. Refining margin is the price of petroleum products minus crude oil price, refining cost, freight cost, etc. The higher the refining margin, the higher the profitability of an oil refinery. In general, the decrease in the demand for petroleum products, such as gasoline and naphtha leads to a decrease in the demand for crude oil, which is a raw material. Therefore, during the period of falling oil prices, South Korean oil refineries experienced difficulties in management due to the decline in refining margins. The losses made by the oil industry in 2020 exceeded 4 billion dollars, and the outlook for domestic demand and exports is also not bright amid the global enthusiasm for carbon neutrality.
This study aims to analyze the export competitiveness of the South Korean oil refining industry by using import and export data from 2000 to 2019. To this end, the concentration of export items is comparatively analyzed using the Herfindahl–Hirschman Index (HHI) for the oil refining industry. Moreover, the degree of specialization of the South Korean economy in the oil refining industry and the comparative advantage of domestic oil products are comparatively analyzed through the trade specialization index (TSI), the revealed comparative advantage (RCA), and an analysis of their 2 × 2 matrix.
2. Current Situation of the South Korean Oil Refining Industry and Literature Review
2.1. Current Situation of the South Korean Oil Refining Industry
Petroleum products are South Korea’s top five export items after semiconductors, petrochemicals, general machinery, and auto parts as of 2021, occupying an important position in the national economy and competing with global companies. The South Korean oil refining industry is a typical oligopoly market composed of four companies: SK Energy, GS Caltex, S-OIL, and Hyundai Oilbank. SK Energy ranks first in the domestic market with a market share of over 30%, and the remaining three companies have an even market share of around 20%. The market share of the four companies has been maintained without significant change since 2000. The South Korean government even created a government-led retail supply chain called “thrifty gas stations” to break the oligopoly and promote competition, but it did not produce any meaningful results.
Table 1 presents the export volume and export value statistics of the South Korean oil refineries. Exports, which were only 341 million barrels (29,814 million dollars) in 2020, achieved the best performance at 494 million barrels (39,978 million dollars) in 2018. However, due to the impact of the pandemic that started in 2020, exports in 2021 decreased to 420 million barrels, but due to the price increase of petroleum products, exports in 2021 returned to the pre-pandemic level.

Table 1.
Export statistics of South Korean refining industry.
Table 2 presents South Korea’s export volume by country as of 2021. Exports to China account for the largest share at 21.5%, followed by Japan, Singapore, the United States, and Australia. Petroleum product exports to these five countries accounted for 66.5%, indicating a high degree of export dependence on these countries.
Table 2.
South Korea’s petroleum product exports by country (as of 2021).
2.2. Literature Review on Export Competitiveness of Oil Refining Industry
Because economies of scale play an important role in the oil refining industry, which involves large-scale production facilities, previous studies consider crude oil refining capacity as a major factor in the export competitiveness of the oil refining industry [3,4,5]. Table 3 shows the number of refineries with more than 200,000 B/D (Barrels per day) that can enjoy economies of scale. All of the five refining facilities in Korea have a capacity of over 200,000 B/D, which is similar to Singapore and Taiwan in terms of refining capacity.
Table 3.
The ratio of refining facilities over 200,000 B/D (Barrels per day).
Previous studies consider the facility utilization rate as another determinant of export competitiveness [3,6]. As the capacity utilization rate increases, the proportion of fixed costs in production costs decreases, and thus, the refining margin increases. As of 2015, the utilization rate of refining facilities in South Korea was 86.1%, which is higher than the average utilization rate of the Asia-Pacific region (84.8%) [3].
In addition, geographical conditions are considered as factors affecting the export competitiveness of the oil refining industry [7]. The farther away from the country where the oil is produced or exported, the higher the cost of transporting crude oil and petroleum products. These transporting costs vary by country and are estimated to be about USD 2.5 to 4.3 per barrel [8].
There are three previous studies that analyzed the export competitiveness of the South Korean oil refining industry. Ahn (2015) compared the RCA of the oil refining industry in South Korea, Japan and China from 2007 to 2013. It elucidates that the export competitiveness of China and Japan improved after the global financial crisis in 2007, while the export competitiveness of the South Korean oil refining industry decreased somewhat [9]. Choi and Cho (2015) compared the export competitiveness of South Korea and China’s oil refining industry for the period 2007–2015. As a result, the RCA of the South Korean oil refining industry compared to China’s was 1.66 implying that they have a comparative advantage [10]. Lastly, a study by Lee and Oh (2011) calculated the RCA index of the South Korean oil refining industry. The value of the RCA index was 1.5 in 2009 and 2.1 in 2010 and proved that the oil refining industry had a comparative advantage [11].
3. Materials and Methods
3.1. Petroleum Product Classification
The harmonized system (HS) Code was established by the World Customs Organization (WCO) for the purpose of imposing customs duties, but it is somewhat difficult to use in trade statistics analysis. Accordingly, in 1988 the South Korean government created a new classification system for import/export items called the Ministry of Trade and Industry (MTI) Code for the purpose of policy enforcement and economic analysis, through the reclassification of items covered by industrial policy. Under the MTI Code, ‘petroleum products’ consist of 12 listed petroleum products: aviation gasoline, automobile gasoline, diesel, jet oil, kerosene, naphtha, bunker A oil, bunker B oil, bunker C oil, other heavy oil, lubricants, and other petroleum products.
Each petroleum product in the MTI Code is matched with the ten digits of the HS Code used in Korea (HSK Code). The first six digits of the HSK Code are the internationally accepted digits, but the last four digits are added by the South Korean government as its own standard. Therefore, although the listed petroleum products of the MTI Code are suitable for understanding South Korea’s import and export information, there is a limit to how they can be used to analyze imports and exports abroad that do not follow the HSK Code. Nevertheless, to compare the export competitiveness of each petroleum product, the MTI Code is the most appropriate, so in this study, petroleum products are classified on the basis of the MTI Code.
3.2. Data
For the calculations of South Korea’s export and import statistics by MTI Code, the MTI export statistics for the period 2000–2019 provided by Korea International Trade Association (KITA, Seoul, South Korea) were used and they are all annual data. However, in order to calculate the RCA index, world export data, by MTI Code, were also required. World export information (used for and ) is provided by UN Comtrade from 2002 based on the 6-digit HS Code. Matching between the MTI Code and the 6-digit HS Code of United Nations (UN) Comtrade was performed using the MTI Code linkage table provided by the South Korean government.
The TSI was calculated for the period 2000–2019, but the RCA index was only calculated for the period 2002–2019 to match the time series interval of UN Comtrade, where the time series is relatively short. Although the 6-digit HS Codes from MTI and UN Comtrade do not match perfectly one-to-one, this method was judged to be the best considering the availability of data. There is no global common classification standard with the related export statistics for detailed petroleum product items.
3.3. TSI
The TSI, which is an index that judges the comparative advantage of a specific product in the global market [12,13], is defined as:
where indicates the exports of the good from country i and indicates the imports of the good into country .
If the sign of the trade specialization index is positive, the product is export-specialized, and if the sign is negative, the product is import-specialized. The higher the absolute value of the TSI, the greater the degree of export specialization or import specialization. The TSI has a value between −1 and 1; when the TSI is −1, this means perfect import specialization, and when the TSI is 1 this means perfect export specialization. In this study, the TSI is calculated using the statistical data for imports and exports, by MTI classification, produced by the South Korea KITA from 2000 to 2019.
3.4. RCA
The RCA index is used to evaluate a country’s comparative advantage in the world market for a product. The RCA index, which is defined as the ratio between the share of the exports of a specific product in the global market and the share of the exports of that product among the exports of a specific country [14,15], has the form:
where is the exports of the good k from the country , is the total exports of country i, is the world’s exports of the good , and is the world’s exports. If the RCA has a value greater than 1, it is judged that the country has a comparative advantage in exports of that product.
4. Results
4.1. Status of Exports by the South Korean Oil Refining Industry
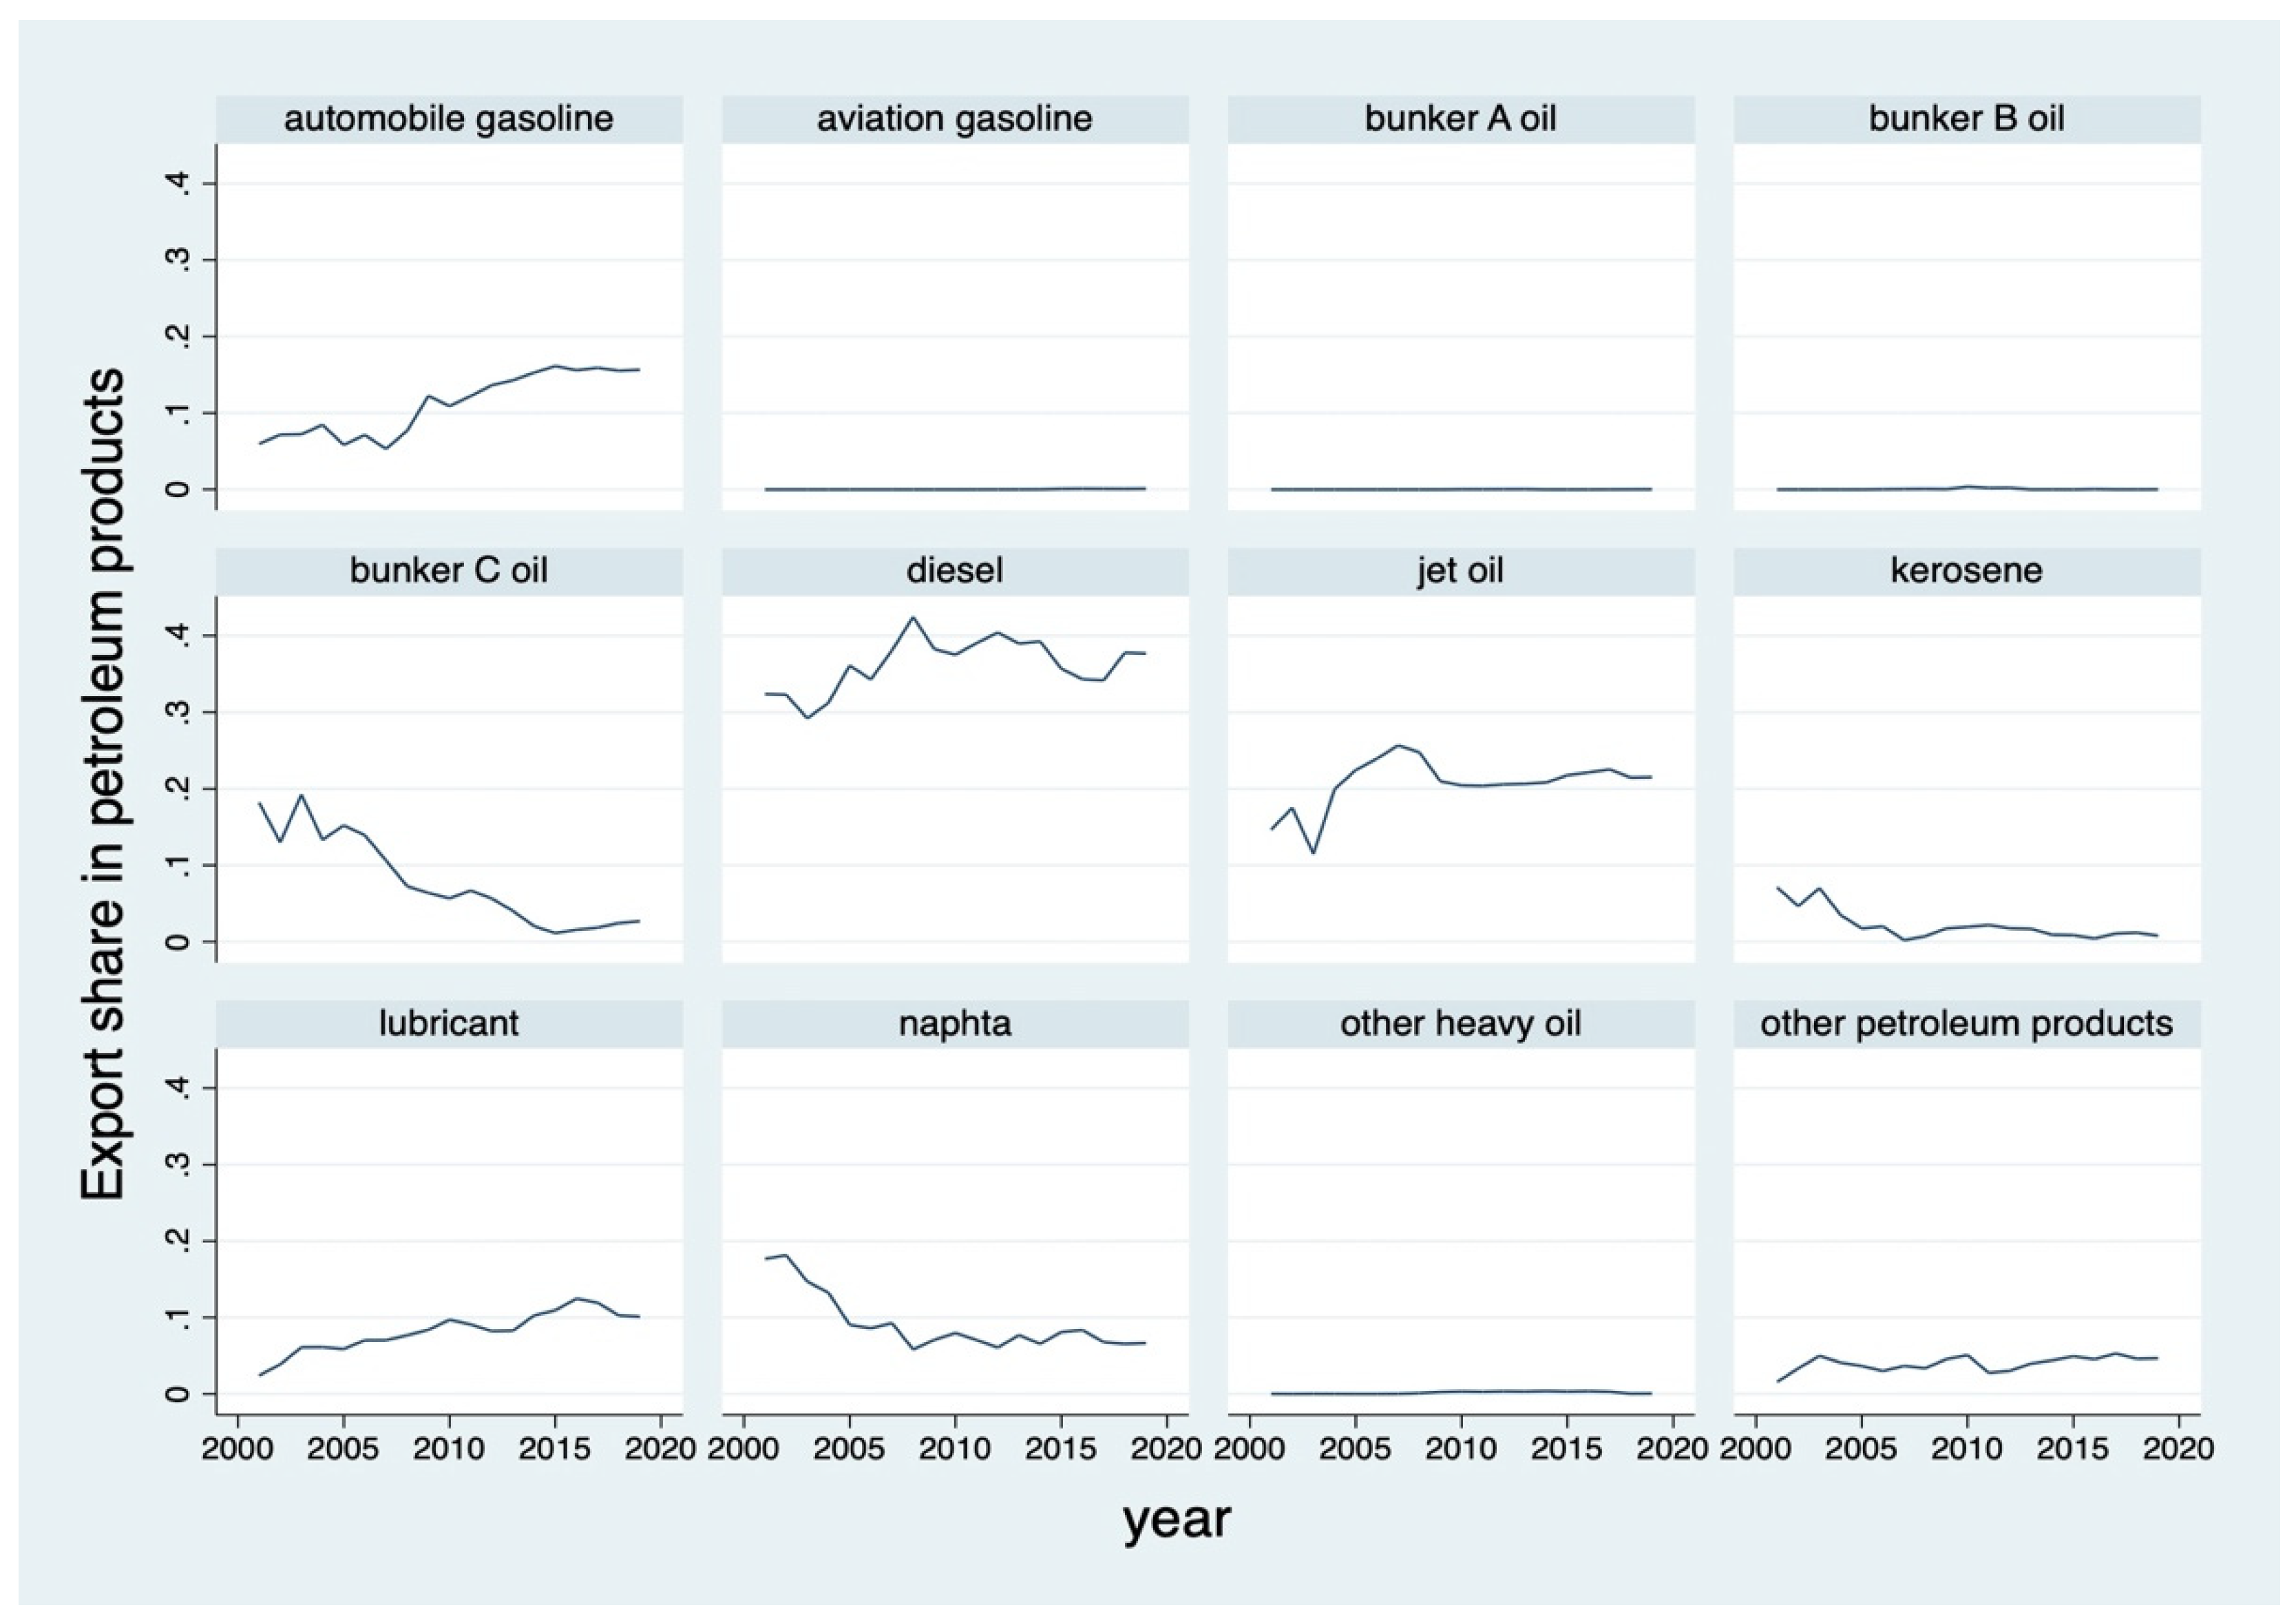
4.1.1. Export Share of Petroleum Products
Figure 1 shows the trend of export share by petroleum product. Considering the export value of each product as a proportion of the total export value of petroleum products, diesel, jet oil, automobile gasoline, and lubricants, in that order, have the highest values. The export share of diesel rose from 35.2% in 2000 to 40.4% in 2012 and then fell to 37.7% in 2019, but diesel still has the highest proportion among South Korea’s petroleum product exports. The export shares of automobile gasoline and lubricants have increased continuously. The export share of automobile gasoline increased from 5.2% in 2000 to 10.9% in 2010 and 15.6% in 2019. The export share of lubricants also increased, from 1.9% in 2000 to 9.7% in 2010 and 10.1% in 2019. The total share of the four major export items—diesel, jet oil, automobile gasoline, and lubricants—among the total exports increased from 55.4% in 2000 to 85.0% in 2019.
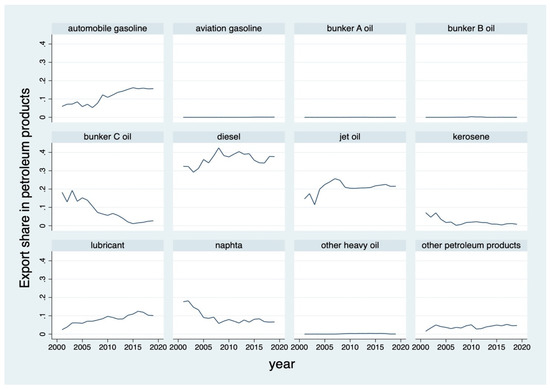
Figure 1.
Trend of export share by petroleum product.
The share of naphtha among the exports of petroleum products since 2003, and that of bunker C oil since 2004, has been steadily decreasing. The share of naphtha among petroleum product exports peaked at 18.1% in 2002 and has continued to decline, dropping to 6.7% as of 2019. The share of bunker C oil exports peaked at 19.2% in 2003 and has continued to decline, dropping to 2.7% as of 2019. Bunker A oil, bunker B oil, aviation gasoline, and other heavy oils account for less than 0.1% of the exports of petroleum products. Kerosene also fell to 0.78% in 2019.
4.1.2. Export Concentration of Petroleum Products
The HHI is an index used to determine the degree of monopoly in the market and is defined as the sum of the squares of the market shares of each company [16,17,18].
where is the market share of firm , and is the number of firms in the market. The HHI has a value between 0 and 1, with the value approaching 0 as the market approaches perfect competition and approaching 1 as the market approaches monopoly. In general, if the HHI is less than 0.15, the market is not concentrated, if it is 0.15 to 0.25 the market is a partially concentrated market, and if it is 0.25 or more, the market is judged to be a very concentrated market.
By substituting the export share for each petroleum product for the market share into the HHI, the concentration of petroleum product exports can be identified. If the export performance of each petroleum product was uniform, the HHI would be close to 0, and the HHI would converge to 1 as the export dependence on a specific item became high. As shown in Figure 2, the HHI for South Korean oil refining products has stayed between 0.21 and 0.23, being at its lowest, 0.174, in 2003 and its highest, 0.264, in 2008. Since 2010, the HHI has been below 0.25, so it can be confirmed that the export of petroleum products from South Korea does not have a high level of dependence on specific items.
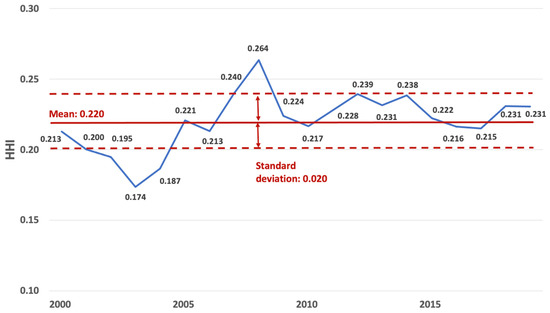
Figure 2.
Export concentration of petroleum products.
4.2. Results for the TSI in the Oil Refining Industry
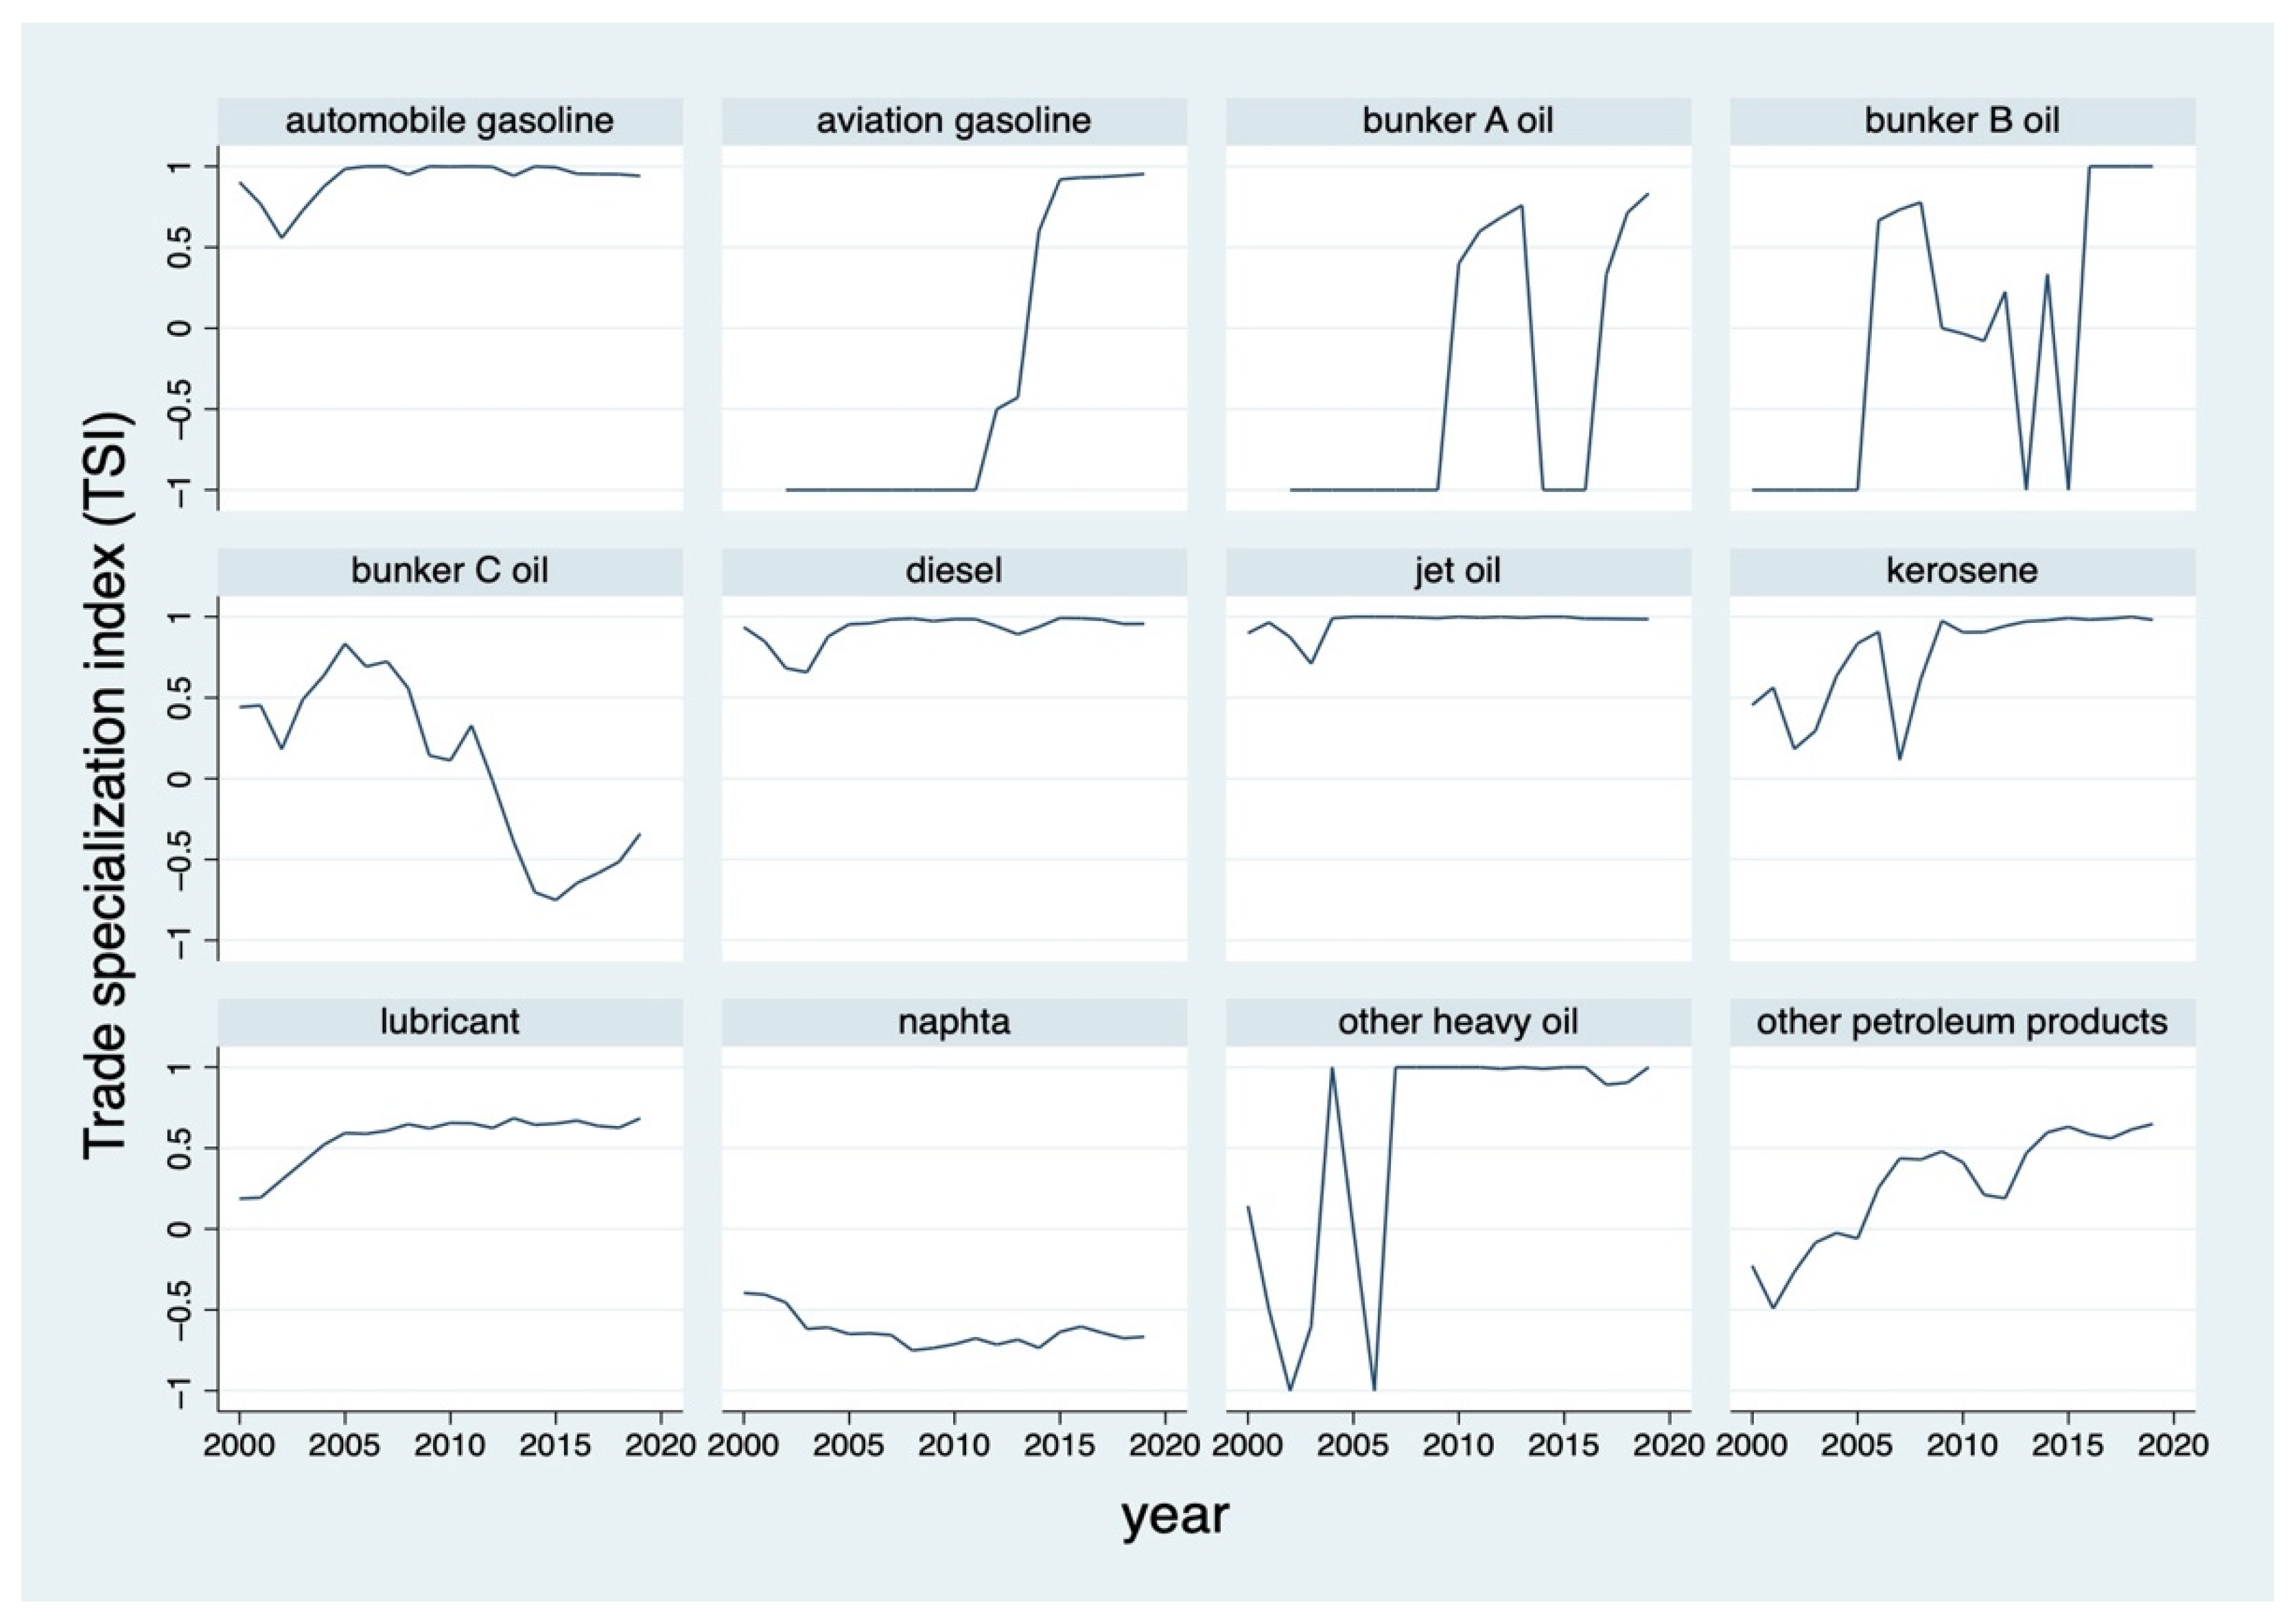
The TSI results for the period 2000–2019, using statistical data on imports and exports by MTI classification provided by KITA, are presented in Figure 3. The main results are as follows. First, the export-specialized items are diesel, other heavy oil, kerosene, bunker A oil, bunker B oil, lubricating oil, automobile gasoline, jet oil, and aviation gasoline. Diesel shows a TSI close to perfect export specialization (TSI = 1) for the entire period from 2000 to 2019, and kerosene also has a high TSI, of 0.971 to 1.000, after 2013. In the case of lubricants, the TSI increased rapidly, from 0.188 in 2000 to 0.684 in 2019, so lubricants became an export-specialized item. In the case of bunker A oil and bunker B oil, after varying between import specialization and export specialization, they became export-specialized items after 2017.
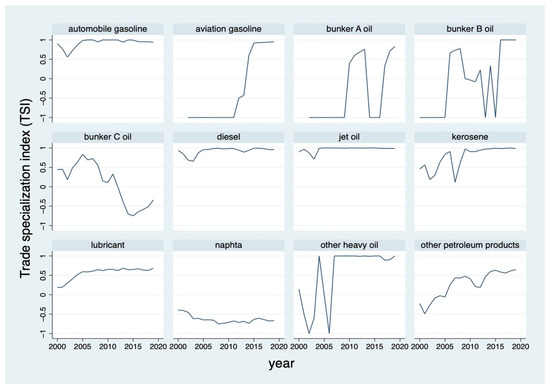
Figure 3.
Trade specialization index by petroleum product.
Second, the import-specialized items include naphtha. This is the only petroleum product that was import-specialized for the entire period from 2000 to 2019, and the TSI was also in continuous decline, from −0.395 in 2000 to −0.666 in 2019.
Third, the petroleum product that was converted from an export-specialized item to an import-specialized item is bunker C oil. Bunker C oil was an export-specialized item until 2011. From 2012, it became an import-specialized item. The TSI decreased to −0.751 in 2015 and slightly improved to −0.340 in 2019.
Lastly, the petroleum products that were converted from import-specialized to export-specialized items are other petroleum products and aviation gasoline. Other petroleum products were converted to export-specialized items after 2006 and aviation gasoline was converted after 2014. Aviation gasoline has maintained a high trade specialization index of 0.9 or higher since 2015.
4.3. Results for the RCA Index in the Oil Refining Industry
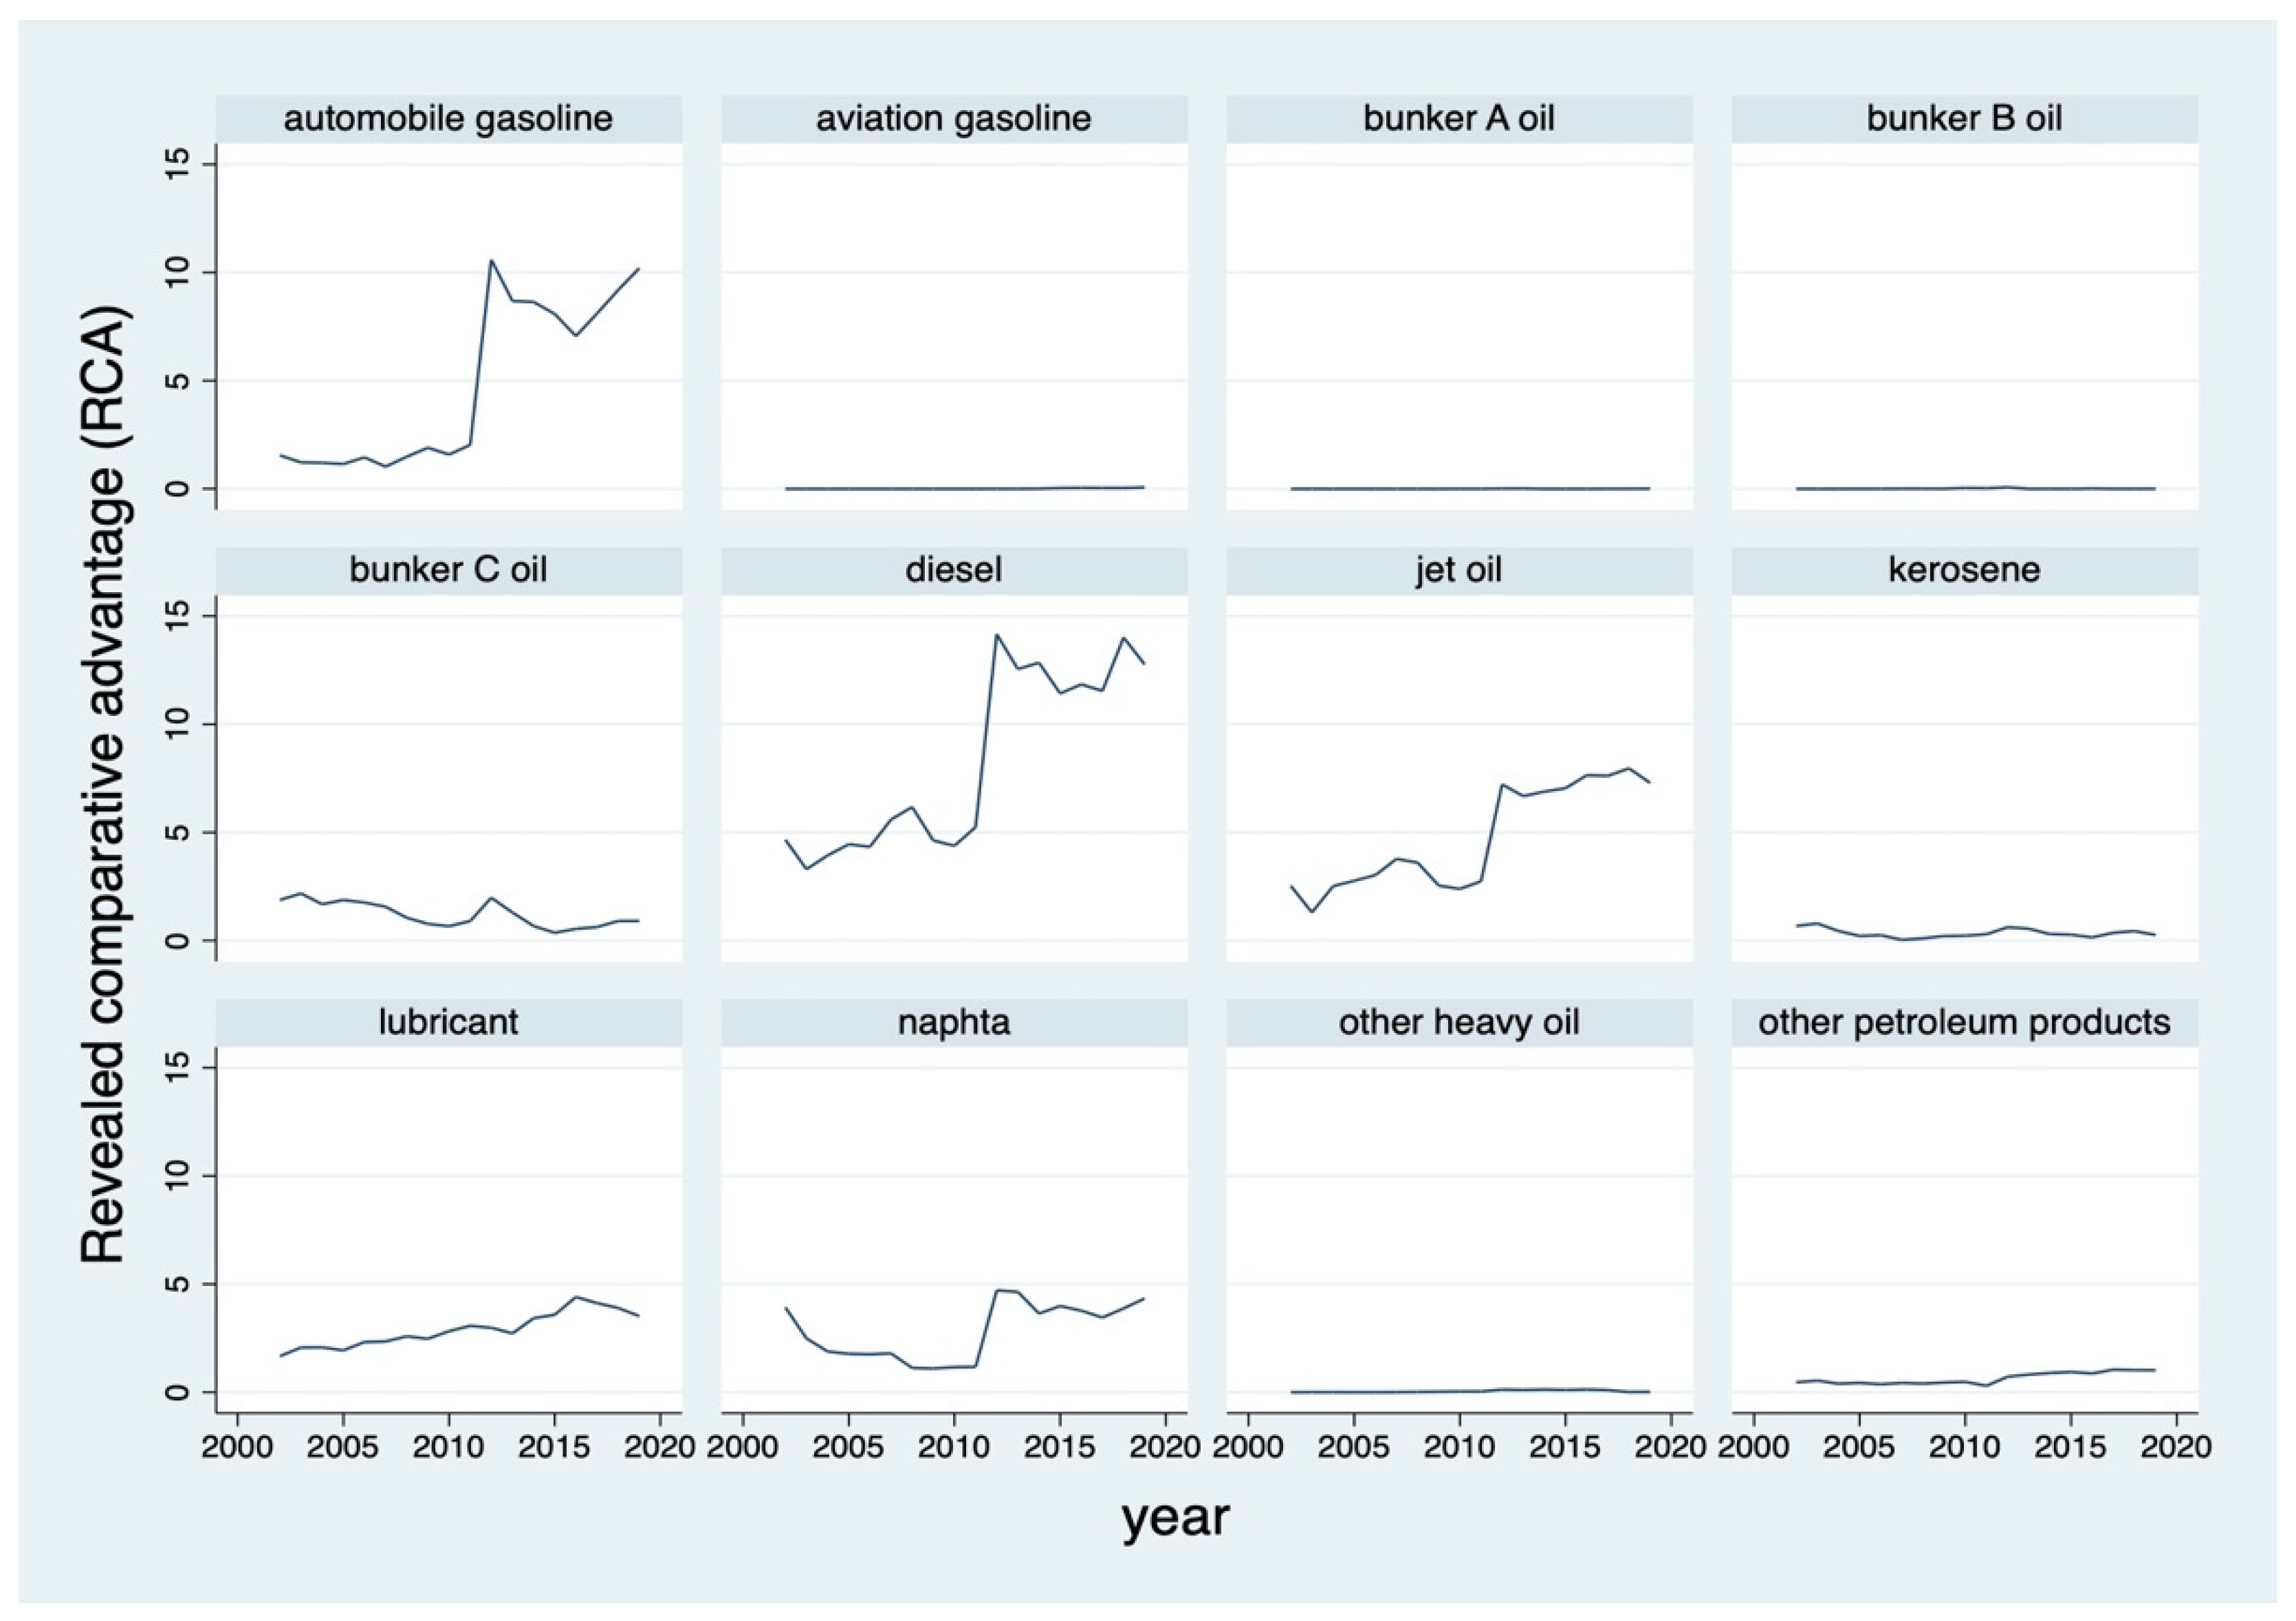
The results of analyzing the RCA index by petroleum product for the period 2002–2019 are shown in Figure 4. The items with a comparative advantage are diesel, automobile gasoline, jet oil, lubricants, and naphtha. Since 2012, the comparative advantage index of the above items has been on the rise. As of 2019, the RCA indexes for diesel and automobile gasoline were 10.204 and 12.763, respectively, so they can be said to have a relatively high level of revealed comparative advantage compared to the global average.
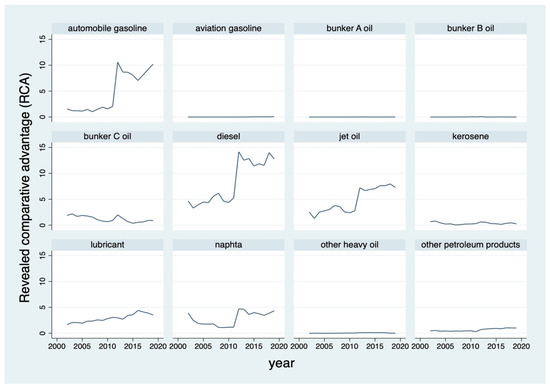
Figure 4.
Revealed comparative advantage index by petroleum product.
The comparative disadvantage items are kerosene, bunker A oil, bunker B oil, bunker C oil, and aviation gasoline. Kerosene, bunker A oil, bunker B oil, and aviation gasoline showed comparative disadvantage in the entire period from 2002 to 2019, and bunker C oil showed a comparative advantage in 2002–2008 and 2012–2013, but then became comparative disadvantage item.
4.4. Dynamic Change of Export Competitiveness by Matrix Analysis
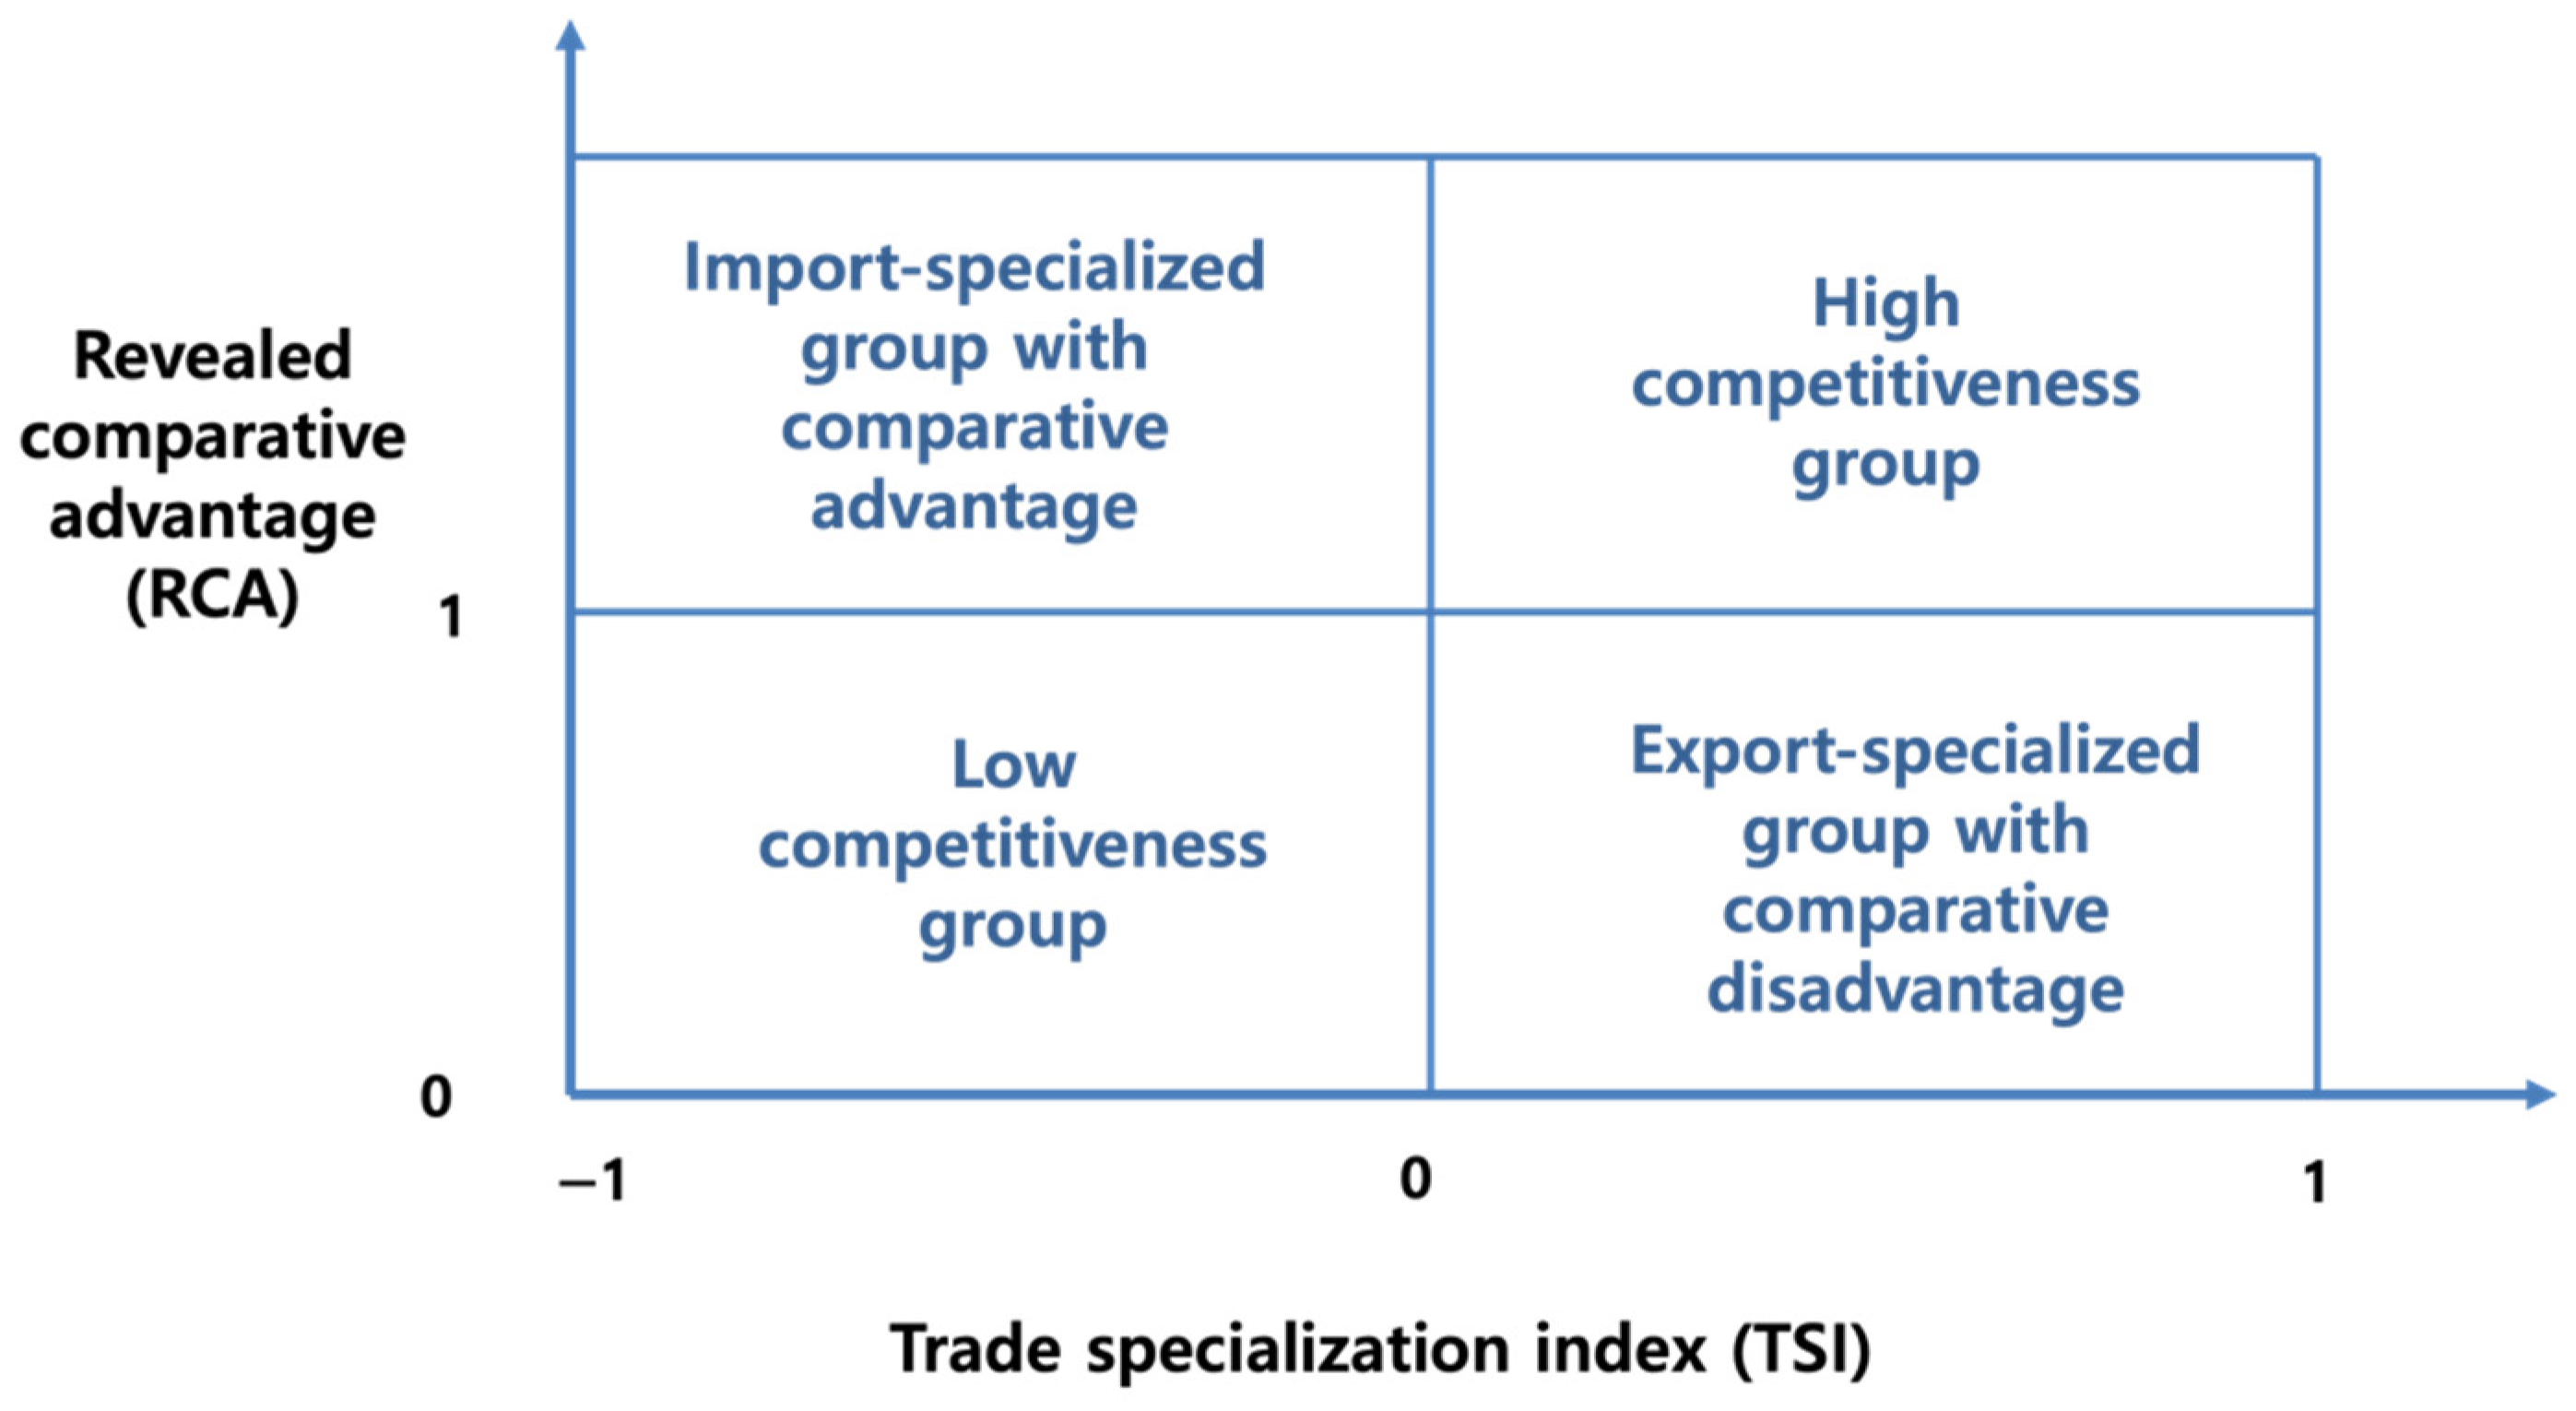
The competitiveness of each petroleum product can be comprehensively judged using a 2 × 2 matrix of the TSI and the RCA index. As shown in Figure 5, items that are export-specialized and have a comparative advantage are classified as being in the ‘high competitiveness group’. Import-specialized and comparative disadvantage items can be classified as the ‘low competitiveness group’.

Figure 5.
Portfolio classification of trade specialization index and revealed comparative advantage index.
The third group consists of items that have a comparative advantage but fall under the import specialization definition, and this group can be classified as the ‘import-specialized group with comparative advantage’. For these items, South Korea has sufficient export competitiveness but has to rely on imports to meet domestic demand.
Finally, items that are comparatively inferior and fall under the export specialization definition have a weak competitive advantage compared to other items but depend on exports because of a narrow domestic market. This group can be classified as the ‘export-specialized group with comparative disadvantage’.
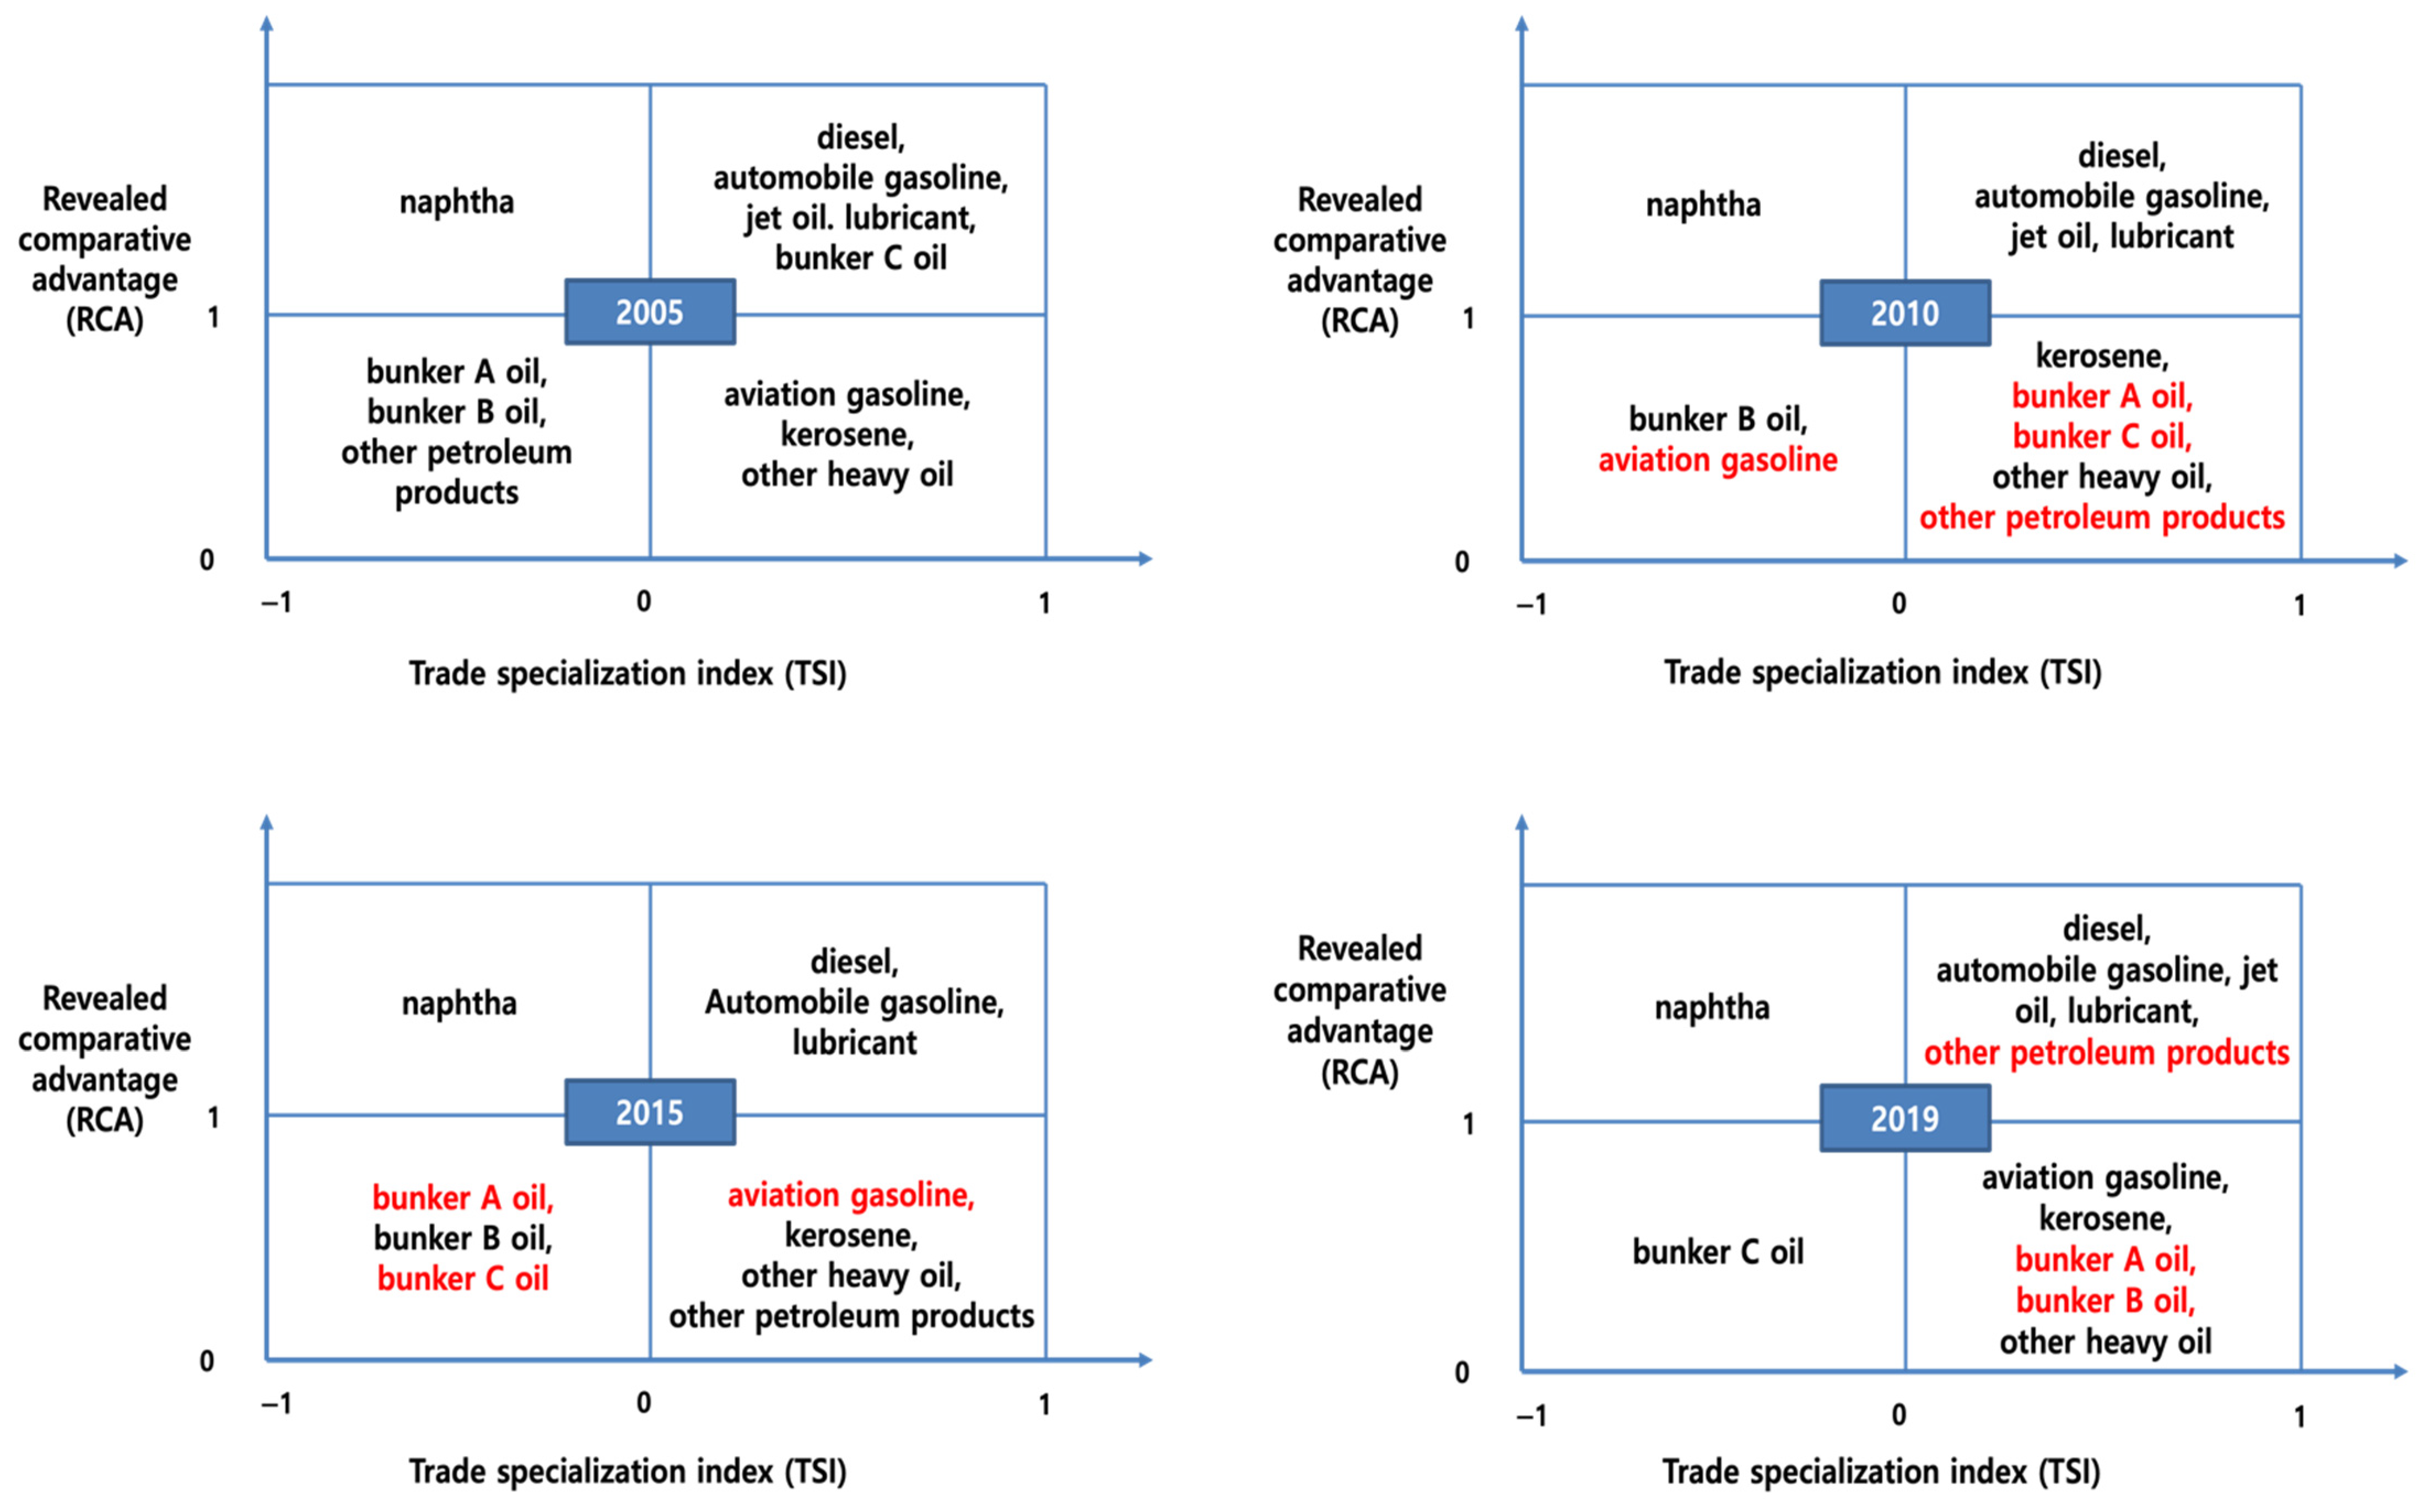
The result of dynamic changes of portfolio classification of TSI and RCA are presented in Figure 6. As of 2005, diesel, automobile gasoline, jet oil, lubricating oil, and bunker C oil fell within the ‘high competitiveness group’.
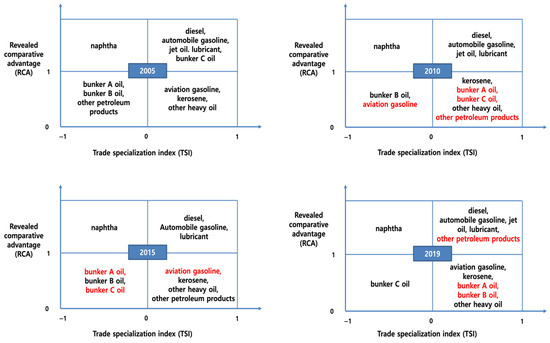
Figure 6.
Dynamic changes of portfolio classification consisting of trade specialization index and revealed comparative advantage index.
However, while bunker C oil, which belonged to the ‘high competitiveness group’ in 2005, moved to the ‘export-specialized group with comparative disadvantage’ in 2010, bunker A oil, which belonged to the ‘low competitiveness group’ in 2005, switched to the ‘export- specialized group with comparative disadvantage’ in 2010.
Aviation gasoline, which belonged to the ‘low competitiveness group’ in 2010, moved to the ‘export-specialized group with comparative disadvantage’ in 2015, while bunker A oil and bunker C oil, which belonged to the ‘export-specialized group with comparative disadvantage’ in 2010, switched to the ‘low competitiveness group’ in 2015.
Bunker A oil and bunker C oil, which belonged to the ‘low competitiveness group’ in 2015, moved to the ‘export-specialized group with comparative disadvantage’ in 2019. As South Korea is the only OECD country to impose an individual consumption tax and education tax when heavy oil is used as an intermediate product, export competitiveness may be weaker compared to other countries [19].
Naphtha belonged to the ‘import-specialized group with comparative advantage’ throughout the entire period. South Korea has a comparative advantage in naphtha production. However, due to its high production of petrochemical products, the demand for naphtha is also high, and, as a result, domestic production is not meeting domestic demand [20].
On the other hand, diesel, automobile gasoline, jet oil, and lubricating oil belonged to the ‘high competitiveness group’, since they were export-specialized items with a comparative advantage over the entire period. The source of the high competitiveness of these industries can be found in economies of scale and the high percentage of advanced facilities [21]. All four major South Korean oil refineries (SK Energy(Seoul, South Korea), GS Caltex (Seoul, South Korea), Hyundai Oil Bank (Seoul, South Korea), and S-Oil (Seoul, South Korea)) have outstanding economies of scale so that the refining capacity of every single plant lies in the top ten in the world. In addition, the ratio of advanced facilities that extract high value-added light oil (such as expensive automobile gasoline and diesel) from cheap bunker C oil reaches as high as 40%. Thus, South Korea has high quality competitiveness. Advanced facilities that can create economies of scale and high added value enhance cost competitiveness, and world-class eco-friendly performance contributes to quality competitiveness; together these have become the driving force for the export strategy of industrializing the South Korean petroleum industry.
Bunker A oil, bunker B oil, and bunker C oil have fluctuated between the ‘low competitiveness group’ and the ‘export-specialized group with comparative disadvantage’. The revealed comparative disadvantage of bunker oils can be attributed to the irrational tax policy. Chile, the United States and South Korea are the only OECD countries that impose 3% tariffs on crude oil for raw materials. In addition, South Korea is the only OECD country that imposes an individual consumption tax of 1.5 cents per liter when heavy oil is used as an intermediate product, while intermediate petroleum products are used as raw materials for pharmaceuticals, fertilizers, pesticides, and petrochemicals are conditionally exempted from tax.
5. Discussion of the Results
This study analyzed export competitiveness using import and export data for the South Korean oil refinery industry from 2000 to 2019, and the main results are as follows. First, the TSI analysis confirms that diesel and kerosene were close to complete export specialization (TSI = 1) during this period, and lubricants were quickly established as export-specialized items. On the other hand, naphtha was an import-specialized item for the entire period, and its degree of import-specialization is on the rise. Bunker C oil was converted from an export-specialized item to an import-specialized item after 2012, while aviation gasoline was converted from an import-specialized item to an export-specialized item after 2014.
Second, the RCA index analysis shows that diesel, automobile gasoline, jet oil, lubricating oil, and naphtha have comparative advantages, whereas kerosene, bunker A oil, bunker B oil, bunker C oil, and aviation gasoline have comparative disadvantages. Among the comparative advantage groups, changes in diesel and automobile gasoline are very dramatic. The RCA index of diesel increased 2.7 times from 4.665 in 2002 to 12.763 in 2019. The RCA index of automobiles gasoline also significantly improved the RCA index from 1.552 to 10.204 during the same period. Both diesel and automobile gasoline have been supported by strong domestic demand, which enables oil refineries to secure economies of scale, and compete successfully with global oil refineries.
Third, a comprehensive analysis of the competitiveness of each petroleum product using a 2 × 2 matrix of the TSI and the RCA index shows that diesel, automobile gasoline, jet oil, and lubricant oil belonged to the ‘high competitiveness group’ for the entire period, whereas naphtha belonged to the ‘import-specialized group with comparative advantage’ for the entire period. ‘High competitiveness group’ could maintain their export competitiveness by actively introducing advanced facilities that extract high value-added light oil. On the other hand, naphtha has a comparative advantage, but production capacity could meet domestic demand because South Korea is specialized in the petrochemical industry and naphtha is a major ingredient of petrochemical products.
The portfolio classification analysis presented in this study is useful in deriving major implications for fostering the oil refining industry. For example, in the case of ‘the Import-specialized group with comparative advantage’ to which naphtha belongs, it has a comparative advantage in exports, but since production does not meet domestic consumption, government support for investment in expanding production facilities is needed. On the other hand, since the low competitiveness group is in a situation where the existence of the industry is threatened, it is urgent to achieve economies of scale through market restructuring and introduce advanced facilities.
6. Concluding Remarks
In order for the export competitiveness of the oil refining industry to recover, it is necessary for South Korea to reorganize its irrational tax structure [22,23]. First, there is a need to eliminate tariffs on crude oil imports for producing petroleum products, as the South Korean government imposes no tariff on coal and iron ore for mitigating the cost burden of manufacture. Chile, the United States and South Korea are the only OECD countries that impose tariffs on crude oil for raw materials. In general, differential tariffs are imposed on raw materials, intermediate goods, and finished products, in that order, but the South Korean government imposes the same tariff of 3% on crude oil and petroleum products. On the other hand, essential raw materials, such as coal and iron ore are subject to a 0% tariff rate to enhance industrial competitiveness. Of course, import duties on crude oil are refunded when petroleum products are exported, but the domestic consumption of crude oil that contributes to the export of petroleum products does not give rise to a refund, increasing the tax burden on refineries.
Second, it is necessary to eliminate the individual consumption tax on heavy oil, which is an intermediate product in the refining process. The individual consumption tax levied only on intermediate products for petroleum refining processes can cause a problem of equity between industries because intermediate petroleum products used as raw materials for other products are tax free.
Third, it is necessary to improve the refining margin by actively utilizing by-products generated during the refining process. For example, since the by-product, hydrogen, generated in the refining process can be used to upgrade heavy oil, it is necessary to have a production system that can efficiently use hydrogen in the refining process [3,24,25]. Furthermore, hydrogen, which is insufficient even with by-product hydrogen, can create new business through blue hydrogen production combined with carbon capture and storage technology [26].
Finally, in addition, the production of carbon black, which is a raw material for tires, high-grade lubricants, and of alkylate, which is a raw material for high-grade gasoline, can contribute to increasing the added value in the oil refining industry.
The RCA index has a disadvantage in that pairwise comparison is not possible because it is calculated by summing all export performances of the world or competing countries to be compared. In addition, since RCA cannot control various factors that affect exports other than industrial productivity, there is a possibility that the comparative advantage may be distorted by factors other than productivity. To overcome these limitations of RCA, the new RCA index developed by Cosinot et al. (2012) can be used as an alternative to the new RCA index [27].
Author Contributions
Conceptualization, S.-H.Y.; methodology, C.B.; investigation, C.B.; writing—original draft preparation, C.B.; writing—review and editing, S.-H.Y.; visualization, C.B.; supervision, S.-H.Y. All authors have read and agreed to the published version of the manuscript.
Funding
This research received no external funding.
Institutional Review Board Statement
Not applicable.
Informed Consent Statement
Not applicable.
Conflicts of Interest
The authors declare no conflict of interest.
References
- Halff, A.; Younes, L.; Boersma, T. The likely implication of the new IMO standards on the shipping industry. Energy Policy 2019, 126, 277–286. [Google Scholar] [CrossRef]
- International Energy Agency (IEA). Oil 2019: Analysis and Forecasts to 2024; IEA: Paris, France, 2019. [Google Scholar] [CrossRef]
- Kim, J.; Kim, T. Mid-to-Long-Term Development Strategy of Korea’s Oil Industry with Changes in International Oil Market Structure (3/3); Korea Energy Economic Institute Research Papers: Ulsan, Korea, 2019. [Google Scholar]
- Enerdata. World Refinery Database. 2016. Available online: https://www.enerdata.net/research/world-refineries-database.html (accessed on 3 February 2022).
- Kim, T. Analysis of the Economic Ripple Effect of International Oil Prices According to Changes in Oil Dependence; Korea Energy Economics Institute Research Paper: Uiwang-si, Korea, 2017; p. 13-02. [Google Scholar]
- Ruble, I. The U.S. crude oil refining industry: Recent developments, upcoming challenges and prospects for exports. J. Econ. Asym. 2019, 20, e00132. [Google Scholar] [CrossRef]
- Nikolaichuk, L.; Sinkov, L.; Malisheva, A. Analysis of the problems and development prospects of the oil refining industry of Russia. J. Bus. Retail Manag. Res. 2017, 11, 177–183. [Google Scholar] [CrossRef]
- The Wall Street Journal, Barrel Breakdown. Available online: http://graphics.wsj.com/oil-barrel-breakdown (accessed on 8 March 2022).
- Ahn, H. Analysis on Competitiveness by Industry, Shinhan Investment Corp. 2015. Available online: https://bbs2.shinhaninvest.com/board/message/file.do?attachmentId=147157 (accessed on 8 March 2022).
- Choi, D.; Cho, Y. Impact of China’s Rising Self-Sufficiency on Domestic Oil Refining and Petrochemical Industries and Countermeasures; Korea Institute for Industrial Economics & Trade: Sejong, Korea, 2015; Issue Paper 2015-388; Available online: https://www.kiet.re.kr/part/sDownload.jsp?s_idx=43558 (accessed on 8 March 2022).
- Lee, D.; Oh, S. Oil Industry Future Strategy Research: Downstream Sector Strategy; Korea Energy Economic Institute Research Papers: Uiwang-si, Korea, 2011. [Google Scholar]
- Sujová, A.; Hlaváčková, P.; Marcineková, K. Evaluating the Competitiveness of Wood Processing Industry. Drv. Ind. 2015, 66, 281–288. [Google Scholar] [CrossRef]
- Kang, M. Comparative Analysis of Korea’ s Trade in Ceramic Industry and Its Policy Implications. KIET Ind. Econ. Rev. 2016, 21, 42–54. [Google Scholar]
- Balassa, B. Trade liberalisation and “revealed” comparative advantage. Manch. Sch Econ. Soc. 1965, 33, 99–123. [Google Scholar] [CrossRef]
- Balassa, B. ‘Revealed’ comparative advantage revisited: An analysis of relative export shares of the industrial countries, 1953–1971. Manch. Sch. Econ. Soc. 1977, 45, 327–344. [Google Scholar] [CrossRef]
- Ginevičius, R.; Čirba, S. Determining Market Concentration. J. Bus. Econ. Manag. 2007, 8, 3–10. [Google Scholar] [CrossRef] [Green Version]
- Ginevičius, R.; Čirba, S. Additive Measurement of Market Concentration. J. Bus. Econ. Manag. 2009, 10, 191–198. [Google Scholar] [CrossRef] [Green Version]
- Ginevičius, R.; Krivka, A. The Research on Business Concentration in Lithuanian Economy. Bus. Theory Pract. 2009, 10, 191–203. [Google Scholar] [CrossRef]
- Cho, S.; Kim, Y.K. Tax Reform for the Energy Transition in Korea’s Power Generation Sector. Energies 2020, 13, 5233. [Google Scholar] [CrossRef]
- Nam, J. Current State of Korea’s Petrochemical Industry in the Era of New Normal and the Development Strategy. KIET Ind. Econ. Rev. 2017, 22, 23–36. [Google Scholar]
- Jeong, J. Reinforcement of competitiveness in the oil refining industry according to changes in the domestic oil market. Korea Pet. Assoc. J. 2017, 304, 22–25. (In Korean) [Google Scholar]
- Shim, K.; Jung, Y. Trade liberalization and tax reform strategies: The case of the Korean oil industry. Energy Policy 2012, 41, 686–691. [Google Scholar] [CrossRef]
- Park, H. An Analysis on the Competitiveness of the Oil Refinery Market in South Korea. J. Asian Financ. Econ. Bus. 2020, 7, 145–155. [Google Scholar] [CrossRef]
- Jung, J.-H.; Do, H.-J. Mid-to-Long-Term Development Strategy of Korea’s Oil Industry with Changes in International Oil Market Structure (1/3); Korea Energy Economic Institute Research Papers: Uiwang-si, Korea, 2016. [Google Scholar]
- Lim, C.; Lee, J. An analysis of the efficiency of the oil refining industry in the OECD countries. Energy Policy 2020, 142, 111491. [Google Scholar] [CrossRef]
- Newborough, M.; Cooley, G. Developments in the global hydrogen market: The spectrum of hydrogen colours. Fuel Cells Bull. 2020, 2020, 16–22. [Google Scholar] [CrossRef]
- Costinot, A.; Donaldson, D. What Goods Do Countries Trade? A Quantitative Exploration of Ricardo’s Ideas. Rev. Econ. Stud. 2012, 79, 581–608. [Google Scholar] [CrossRef]

Publisher’s Note: MDPI stays neutral with regard to jurisdictional claims in published maps and institutional affiliations. |
© 2022 by the authors. Licensee MDPI, Basel, Switzerland. This article is an open access article distributed under the terms and conditions of the Creative Commons Attribution (CC BY) license (https://creativecommons.org/licenses/by/4.0/).