Article

Numerical and Experimental Study on the Duration of Nozzle Starting of the Reflected High-Enthalpy Shock Tunnel

1
School of Engineering Science, University of Chinese Academy of Sciences, Beijing 100049, China
2
State Key Laboratory of High Temperature Gas Dynamics, Institute of Mechanics, Chinese Academy of Sciences, No.15 Beisihuanxi Road, Beijing 100190, China
*
Author to whom correspondence should be addressed.
Appl. Sci. 2022, 12(6), 2845; https://doi.org/10.3390/app12062845
Submission received: 14 February 2022 / Revised: 3 March 2022 / Accepted: 8 March 2022 / Published: 10 March 2022

Abstract

:
The starting process of the flow in the nozzle of the JF-14 shock tunnel (1.6 m in length, 500 mm in outlet diameter) in the State Key Laboratory of High Temperature Gas Dynamics is analyzed by calculation and experiment. Two key factors which directly affect the duration of the nozzle starting are the velocity of the expansion wave and the low-velocity zone generated by the interaction between the secondary shock wave and boundary layer on the wall surface. In the process of the nozzle starting, the flow field stabilizes at the center of the nozzle outlet first, and then gradually stabilizes along the radius direction, thus defining the central startup and complete startup of the nozzle. It is found that there is a critical initial pressure. When the initial pressure is lower than the critical pressure, the airflow can reach stability in the nozzle outlet center with the shortest time, otherwise, the time required is much longer. The time required for the airflow to stabilize in the whole outlet section is mainly affected by the size of the low-velocity zone. It is also found that only at a very low initial pressure can the airflow simultaneously reach stability at the entire outlet of the nozzle.

1. Introduction

With an increase in the flight Mach number of an aircraft, the temperature of the gas near the stagnation point rises sharply. When flying at an altitude of 30 km at Mach number 10, the stagnation point temperature of the gas is about 4500 K. However, when the flight Mach number is increased to 20, the total temperature of the gas is as high as 10,000 K [1]. Vibrational excitation, dissociation, ionization and other phenomena are more intense in high-temperature air, making the air a complex medium for constant thermochemical reactions [2], which complicates the phenomenon of high-enthalpy flow. Due to the strong nonlinearity and complexity of the high-enthalpy flow, theoretical research is extremely difficult. The numerical calculation greatly simplifies the flow process, and the accuracy of the results needs to be experimentally verified, which makes the experimental study an indispensable means to study the high-enthalpy flow. The experimental study of this problem depends on flight tests and shock tunnel tests. A flight test reproduces the real flight environment and is the most accurate. However, due to its high cost, it is often used to verify the aircraft model after confirmation. Previous hypersonic flight experiments were conducted in shock tunnels.
A high-enthalpy shock tunnel is a type of pulse tunnel that produces high-enthalpy flow by compressed air with strong shock waves [3,4]. It is widely used in hypersonic fields, such as Earth reentry, planet entry, hypersonic aircraft, scramjet, etc. However, due to the excessive power of high-enthalpy shock tunnels [5], it is very difficult to develop continuously-running shock tunnels. At the same time, the effective test duration is far less than the theoretical value due to the interaction of tunnel waves, viscous boundary layer interference [6,7], diaphragm rupture, the nozzle starting process, and other factors [8,9]. Furthermore, with the increase of the total enthalpy of the gas, the test duration decreases further [10]. For example, the T4 high-enthalpy shock tunnel at the University of Queensland has a length of 26 m and an inner diameter of 229 mm [11]. When the total enthalpy of the test gas is 7.6 MJ/kg, there is 1 ms for conducting the test. However, when the total enthalpy exceeds 15 MJ/kg, the effective test duration is shortened to 0.5 ms [12,13,14,15]. It also takes some time to start up the model, which will further shorten the efficient test time [16,17]. The T5 high-enthalpy shock tunnel at GALCIT (Graduate Astronautics Laboratory, California Institute of Technology, Pasadena, CA, USA) [18] extended the duration by enlarging the equipment, but the effective test duration is still only 1 ms when it is running in high-enthalpy conditions (the total enthalpy is greater than 20 MJ/kg) [19,20]. Other well-known shock tunnels in the world, such as the HEG (High Enthalpy shock tunnel Göttingen) in Germany and HIEST (High-Enthalpy Shock Tunnel) in Japan, when operating under high-enthalpy conditions, the effective test duration is also around 1 ms [21,22,23,24]. There are various factors that restrict the effective test duration of a high-enthalpy shock tunnel, one of which is the nozzle starting process.
Nozzle starting refers to the process by which the test gas enters the nozzle to form a steady flow field at the nozzle outlet. Under the influence of the starting wave [25], the flow field in the starting process is unstable and the experimental data fluctuates greatly. In addition, since there is no obvious interface between the nozzle starting process flow field and the steady flow field, this part of the data is connected with effective data, and although they are close in some cases, they cannot reflect the real situation and therefore, must be accurately eliminated. In past years, the starting process of a supersonic nozzle driven by a shock tunnel has been investigated experimentally and numerically by many researchers. Smith experimentally investigated the supersonic nozzle starting process by using shadowgraph methods [25]. They found that there is a primary shock and a secondary shock that matches the pressures between the nozzle inlet and outlet. Amann studied the influence of many parameters on the starting process, such as nozzle inlet radius, throat width and nozzle half-angle [26,27]. Igra calculated the flow field of the wedge-like nozzle studied by Amann [28]. Saito used Navier–Stokes equations to numerically study the flow field in a two-dimensional nozzle and described the flow characteristics of the supersonic nozzle in detail [29]. They found it necessary to include viscous effects in the numerical analysis to simulate the details of the flow process, such as the interaction between shock waves and the boundary layer [30]. Candler and Perkins found that turbulent and vibrational non-equilibrium play a crucial role in nozzle flow [31,32]. They investigated the turbulent boundary layer on the nozzle wall using the Spalart–Allmaras turbulence model, and compared numerical results with the experimental data reported by the Arnold Engineering Development Center Tunnel 9 (White Oak, MD, USA) and Calspan-University at the Buffalo Research Center shock tunnel facilities (Buffalo, NY, USA), which show good agreement, qualitatively. However, the current research mainly focuses on the flow field structure and uniform area of the nozzle, and pays less attention to the startup duration. In the case of the high-enthalpy shock tunnel, whose effective test duration is quite short, the research on the startup duration of the nozzle is attracting increasing attention, especially the effects of the initial pressure and the reservoir region conditions on the starting process.
In order to accurately understand the starting characteristics of the nozzle, an experimental study on the nozzle starting process was conducted by using the JF-14 shock tunnel (the State Key Laboratory of High Temperature Gas Dynamics, Institute of Mechanics, Chinese Academy of Sciences, Beijing, China), and the nozzle starting process was numerically calculated using the thermochemical non-equilibrium reaction model. The influences of the initial pressure and the reservoir region conditions on the starting process were emphatically analyzed.

2. Physical Process of the Nozzle Starting

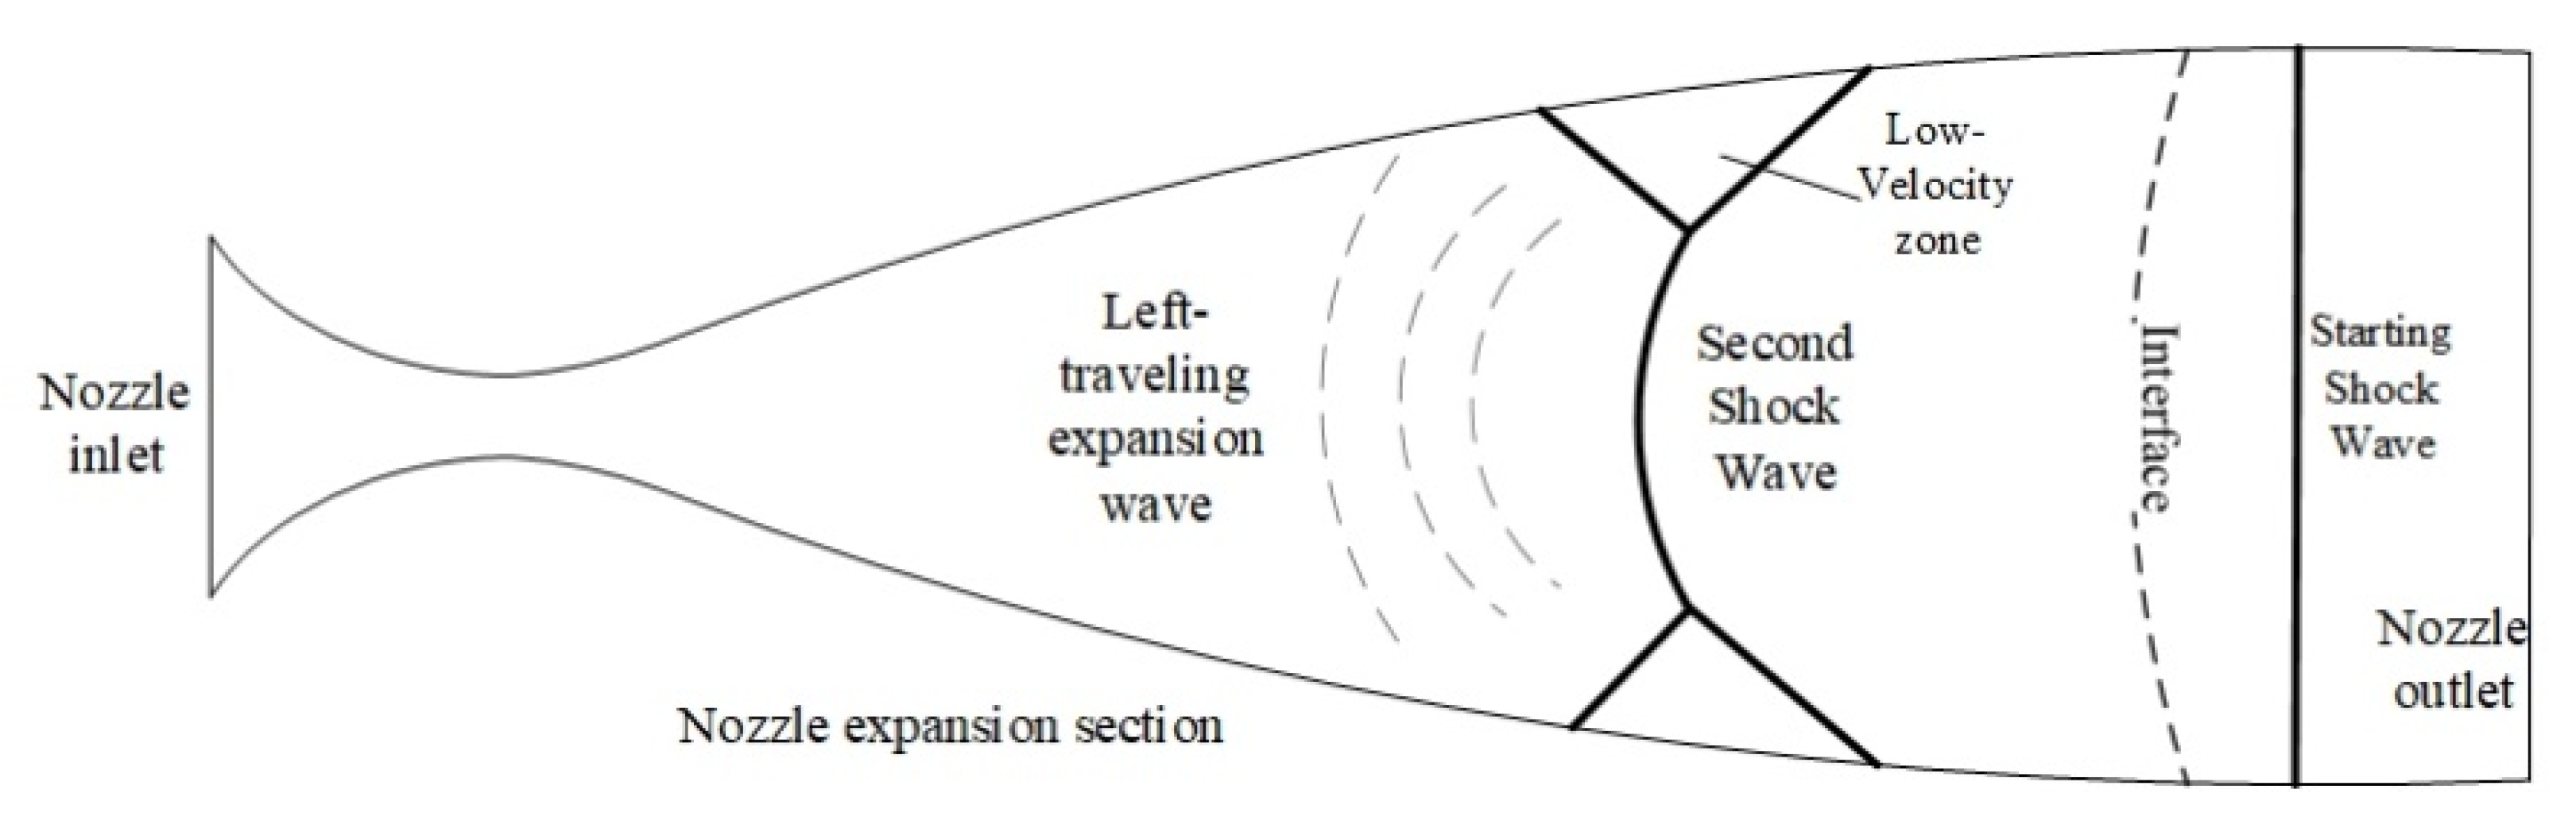
When the test gas enters the nozzle, the nozzle starts, and an incident shock wave is then generated in the nozzle; that is, the starting shock wave as a result of the much higher reservoir region pressure than the initial pressure in the nozzle. The high-temperature and high-pressure gas in the reservoir region accelerates through expansion in the nozzle and produces a series of left-traveling expansion waves in the expansion section. As the cross-sectional area of the nozzle expansion section increases, the starting shock wave is continuously attenuated, resulting in the left-traveling compression waves. A series of compression waves then coalesce into a shock wave, forming the second shock wave. The second shock wave is a left-traveling wave, but due to the high velocity of the gas in the expansion section, it is carried to the nozzle outlet by the airflow [6]. The second shock wave interacts with the boundary layer, bending inward and forming a local low-velocity zone and oblique shock wave on the wall. Only when the low-velocity zone flows out of the nozzle can the flow field at the nozzle outlet be stable, as shown in Figure 1.
Since the flow in the center of the nozzle is not affected by the low-velocity zone, the flow field reaches stability first, which is called center startup. Then, as the low-velocity zone moves, the flow field gradually becomes stable from the nozzle center to the wall. When the flow field is stable at the entire nozzle outlet, it is called complete startup.
In the nozzle starting process, the starting shock wave first contacts the model, followed by the second shock wave, and eventually the left-traveling expansion waves. At the starting process, the flow field in the nozzle is not stable due to the influence of waves, and the test data changes sharply, which is greatly different from the design condition [33]. The period from the time when the gas enters the nozzle to the time when the flow field in the center of the outlet reaches stability is defined as the center startup duration, and the time interval between the starting shock wave and the steady flow flowing through the center of the nozzle outlet is defined as the center instability duration. This represents the time period when the model located at the center of the nozzle outlet is hit by the unstable airflow during the starting process, i.e., the period when the experimental data fluctuates violently. Moreso, according to the moment when the flow field reaches stability at the entire nozzle outlet section, the complete startup duration and the instability duration are correspondingly defined. The gas that can be used for the testing in the shock tunnel is the finite amount of gas in the driven section. The longer the nozzle startup duration, the shorter the effective test duration. Furthermore, the longer the duration of the instability of the starting process, the longer the time period of the impact on the experiment data. Therefore, a shorter duration of both startup and instability is beneficial to the experiment.

3. Research Methods

In order to start the nozzle as quickly as possible, prolong the effective test time, and reduce the influence of the starting process on the test data, the nozzle startup is studied numerically and experimentally.

3.1. Numerical Method

The two-dimensional axisymmetric viscous compressible N-S equations and a thermochemical non-equilibrium model are used to compute the nozzle starting process. The solving equation is as follows:
Q t + x + ( F x + G x ) + r ( F r + G r ) = 0
Among them:
Q = r [ ρ , ρ σ 1 , ρ σ 2 , ρ σ 7 , ρ u , ρ v , e ]
F x = r [ ρ u , ρ u σ 1 , , ρ u σ 7 , ρ u 2 + p , ρ u v , u ( e + p ) ] T
G x = r [ 0 , ρ D σ 1 x , , ρ D σ 7 x , τ x x , τ x r , q ˙ x u τ x x v τ x r ] T
F r = r [ ρ v , ρ v σ 1 , , ρ v σ 7 , ρ v u , ρ v 2 + p , v ( e + p ) ] T
G r = r [ 0 , ρ D σ 1 r , , ρ D σ 7 r , τ r x , τ r r , q ˙ r u τ r x v τ r r ] T
where ρ, p, u, v are the density, pressure, flow velocity components in the x and r directions, respectively; σi is the mass fraction of component i; τ is the viscous stress tensor. G(x,r) is calculated from the shear stress relationship under the Stokes assumption of the N-S equations, Fourier’s law of heat conduction, and Fick’s law of mass diffusion.
The internal energy per unit mass, e, is defined as follows:
e = P γ 1 + ρ ( u 2 + v 2 ) 2 + i = 1 N ρ σ i H f i
Each component of the mixture satisfies the ideal gas equation, and using Dalton’s law, we can write:
P = i = 1 7 P i = ρ T R 0 σ i M i
where Mi is the molecular weight of component i, and R0 is the universal gas constant.
These equations are discretized by the two-order precision finite volume method, using the TVD-minmod high-resolution shock capture format. The thermodynamic property parameters of the gas use the polynomials of McBride et al. [34]. The Sutherland–Wilke model is used for the viscosity and heat transfer coefficient. Seven components (O2, N2, O, N, NO, e, NO+), two temperatures (translational temperature and vibration temperature) are used in the chemical reaction model, according to the Gupta model, which is described in detail in the literature [35], and the reaction temperature uses the Park’s dual temperature model [36,37,38].
The initial condition of the flow field is the air at room temperature (T = 300 K) at a given pressure, the wall boundary condition is the non-slip and non-catalytic wall, and the temperature of the wall is 300 K. The gas at the inlet boundary condition is the equilibrium gas component at the corresponding temperature and pressure.
The length of the nozzle is 2.6 m, and the outlet diameter is 510 mm. Considering that the nozzle is a rotating body, the calculated region is a 1/2 section, as shown in Figure 2a At a total temperature of 4119 K, a total pressure of 1.333 MPa, and an initial pressure of 50 Pa, the nozzle startup process is calculated by using 260 × 30, 520 × 50 and 1040 × 80 mesh node models, respectively. The results show that when the grid node number of 520 × 50 or 1040 × 50 is used, the startup duration is the same, and the temperature and pressure distributions are more similar, the difference is not more than 3%. In order to reduce the calculation time, the 520 × 50 grid node model is selected. The finite volume method is used to discretize the governing equations. Additionally, the four-stage Runge–Kutta method is employed for time integration. The CFL number is 0.8. The computational criteria are the flow field parameters, including temperature, pressure, velocity and mass fraction of each component converging to 1.0 × 10⁻⁶. The length of the nozzle is 2.6 m, and the outlet radius is 255 mm. Considering that the nozzle is a rotating body, the calculated region is a 1/2 section, as shown in Figure 2a. There are 520 grids in the length direction and 50 grids in the radius direction. The number of grids is 26,000. The height of the grid near the wall surface is 0.1mm and gradually increases with a growth rate of 1.05 in the process of approaching the nozzle center, as shown in Figure 2a’s the grid graph, and Figure 2b’s enlarged grid graph near the wall. However, the calculation of the heat flux has strict requirements on the mesh scale and orthogonality, and the Reynolds number of the wall grid must be less than 20. In this study, a denser grid is used to calculate the heat flux. Therefore, the mesh is encrypted (the height of the near-wall mesh is 1 × 10⁻⁵ m) and orthogonal in order to meet the requirements of the heat flux calculation.

3.2. Experimental Facility

The JF-14 shock tunnel—which is based on the backward-running detonation driving technique—structure and wave diagram is shown in Figure 3. It consists of a driving tube of 15 m in length, a driven tube of 11 m in length with an attached axisymmetric Laval nozzle, a vacuum tank, and a 3-m long damping section. The inner diameter of the driving and driven tubes reaches 224 mm. A premixed hydrogen-oxygen-nitrogen explosive gas is filled into the evacuated driving tube and ignited with a 520-V electric spark close to a 1-mm thick steel main diaphragm, which separates the driving and driven tubes. Then, after the test gas is filled into the evacuated driven tube and the pressure of the gas in the driving tube jumps across the detonation wave and causes a fast rupture of the main diaphragm, the high-pressure gas enters the driven tube and forms an incident shock wave. When the incident shock wave ruptures the second diaphragm, separating the driven section and nozzle, the shock wave is simultaneously reflected, which further compresses and stagnates the gas in the driven tube, thereby forming the high-temperature and high-pressure gas in the nozzle inlet. As the diaphragm ruptures, a quasi-steady nozzle flow is established after the start transient [39].
In order to study the impacts of the starting waves on the test data, and to verify the accuracy of the program, the experiment uses the half-sphere with a radius of 20 mm to measure the heat flux at the stagnation point and nearby, and uses the pitot rod to measure the pressure at the stagnation point. The hemispheres, shown in Figure 4 (left), are made of stainless steel. Five E-type coaxial thermocouple heat flux sensors are mounted on the surface of the sphere, with an interval of 15°. The three hemispheres are installed side by side on the horizontal direction of the pitot harrow, with a center distance of 100 mm and the leading edge of the spheres flush with the nozzle outlet, as shown in Figure 4 (right). The Pitot rod has a front radius of 8 mm and is equipped with a piezoresistive sensor.
The thermocouples are homemade type-E coaxial thermocouple heat flux sensors, as shown in Figure 5 (left). This has the advantages of strong erosion resistance, high-temperature resistance, and quick response. The measurement error is less than 8% after many experiments. More details are available in the literature [40,41,42,43,44,45,46]. The pressure gauges are NS-3 pressure sensors from the Shanghai Tianmu company, as shown in Figure 5 (right). The grade of accuracy is 0.2%, and the working temperature is −30 °C~+80 °C. The characteristics are high measurement accuracy and reliability.
During the experiment, the driving section is filled with a 2:1:2 hydrogen, oxygen and nitrogen mixture at a pressure of 0.33 MPa. The air pressure in the driven section is 2600 Pa, and the measured pressure of the reservoir region is 1.333 MPa. From the incident shock wave velocity and the initial components of the driven section, the temperature of the reservoir region is calculated to be 4120 K by assuming the region is in chemical equilibrium.
The numerical results and experimental data are shown in Figure 6a—heat flux; Figure 6b—pitot tube pressure. These results reveal that the heat flux has two obvious peaks corresponding to the starting shock wave and the second shock wave. The comparison between the numerical the experimental results reveals that there is a difference in the wave height, but the take-off time and the stable heat flux value are basically the same. For the stagnation point pressure, the calculation results show the same wave characteristics as those of the heat flux results, and there are also two peaks, but they fail to appear in the experimental results. There are two reasons for this. First, the airflow does not directly contact the pressure-sensitive element, but acts on the pressure guiding material through the cavity and indirectly acts on the pressure-sensitive material to generate signals to protect the pressure sensor. Thus, the small cavity structure has little effect on the pressure measurement, but it prolongs the response time. Second, the sensor itself has a certain response time. Thus, the piezoresistive sensor used in the experiment does not capture the two shock signals. However, when the flow field is stable, the pitot pressure is in good agreement with the numerical results.

4. Results and Discussions

4.1. The Influence of the Initial Pressure on Nozzle Startup

The movement of gas in the nozzle can be regarded as the movement of gas in the shock tube with a variable cross-section. For a given reservoir region pressure, it can be seen from theoretical relation Equation (9) that the Mach number of the moving shock wave can be increased by reducing the initial pressure (Pe).
p 5 e = [ 1 + 2 γ e γ e 1 ( M s 2 1 ) ] [ 1 γ 5 1 γ e + 1 a e 5 ( M s 1 M s ) ] 2 γ 5 γ 5 1
This indicates that the shock wave can be accelerated by reducing the initial pressure, so as to shorten the nozzle startup time.
In order to analyze the influence of the initial pressure on the nozzle startup, the duration of the nozzle starting process was calculated under the conditions of P5 = 1.333 MPa and T5 = 4120 K with different initial pressure. Through the analysis of the calculation results, it was found that the higher the initial pressure, the lower the velocity of the waves in the nozzle, including the starting shock wave, the second shock wave, and the left-traveling expansion wave. The velocity distribution of the nozzle axis (left) and Ma contour (right) in different initial pressures at the same moment is shown in Figure 7 and reveals that the increase of the initial pressure not only changes the wave velocity but also the shape of the waves, both of which have different levels of influence on the nozzle startup duration. Because the flow field in the center of the nozzle is not directly disturbed by the low-velocity zone, the central startup duration is related to the velocity of the waves, while the complete startup duration is more closely related to the shape of the waves.
The calculation results of the duration of the nozzle starting under different initial pressure show that the relationship between the nozzle center startup duration, instability duration and initial pressure is complex. As the initial pressure increases from a small value, the center startup duration does not change, but when the initial pressure exceeds a certain value, the center startup duration begins to increase. At the same time, the central instability duration decreases at first and then increases, and there is a critical pressure to minimize it, as shown in Figure 8.
When the initial pressure is less than 100 Pa, the center startup duration remains unchanged at about 1.6 ms. In this stage, the center instability duration decreases gradually with an increase in the initial pressure. However, when the initial pressure is greater than 100 Pa, the center startup duration and instability duration begin to increase. As can be seen in Figure 8, when the initial pressure is increased to 200 Pa, the center startup duration increases from 1.6 to 2.6 ms, and the center instability duration increases from the lowest 0.72 to 1.54 ms. In other words, when the initial pressure is about 100 Pa, the flow field in the center of the nozzle stabilizes quickly, and the starting wave has the shortest action time of the model.
The stability of the center flow field directly depends on the velocity of the left-traveling expansion waves. Under different initial pressure, the factors that affect the velocity of the left-traveling expansion waves are different, resulting in the existence of a critical initial pressure in the starting of the nozzle center. When the initial pressure is greater than the critical pressure, the starting shock wave, the secondary shock wave, and the left-traveling expansion waves all decelerate during the nozzle starting process. The deceleration of the left-traveling expansion waves directly increases the center startup duration. Moreover, the second shock wave and expansion wave decelerate faster, which lengthens the unstable region, resulting in an increase in the center instability duration. When the initial pressure is lower than the critical pressure, the starting shock wave and the second shock wave accelerate, but at this time, the velocity of the left-traveling expansion waves is no longer dependent on the initial pressure, which is related to the profile of the nozzle and the parameters of the reservoir region. As a result, the velocity of the left-traveling expansion waves remains unchanged, so the center startup duration remains unchanged. However, due to the acceleration of the starting shock wave and the second shock wave, the unstable region is prolonged, which leads to an increase in the center instability duration.
The second shock wave curves inward under the influence of the boundary layer during its movement, forming a low-velocity zone and an oblique shock wave on the wall surface, as shown in Figure 9. Only when all the low-velocity zone and oblique shock waves move outside the nozzle can the flow field be stabilized in the entire outlet section (complete startup). Under the conditions of P5 = 1.333 MPa, T5 = 4120 K, and Pe = 100 Pa, the pressure distribution at the nozzle outlet changes with time, as shown in Figure 10. At 1.8 ms, the flow field reaches stability at the center of the nozzle outlet, but it is not until 2.6 ms that the flow field reaches a stable state at the whole outlet. It takes 1.8 ms to start the nozzle from the center to the complete startup. It can be seen that the low-velocity zone significantly prolonged the startup duration of the nozzle and resulted in a huge loss to the effective test time.
Increasing the initial pressure changes not only the velocity of the waves in the nozzle but also the shape of the waves. When the initial pressure rises, the second shock wave contracts inward and the low-velocity zone expands, as shown in 
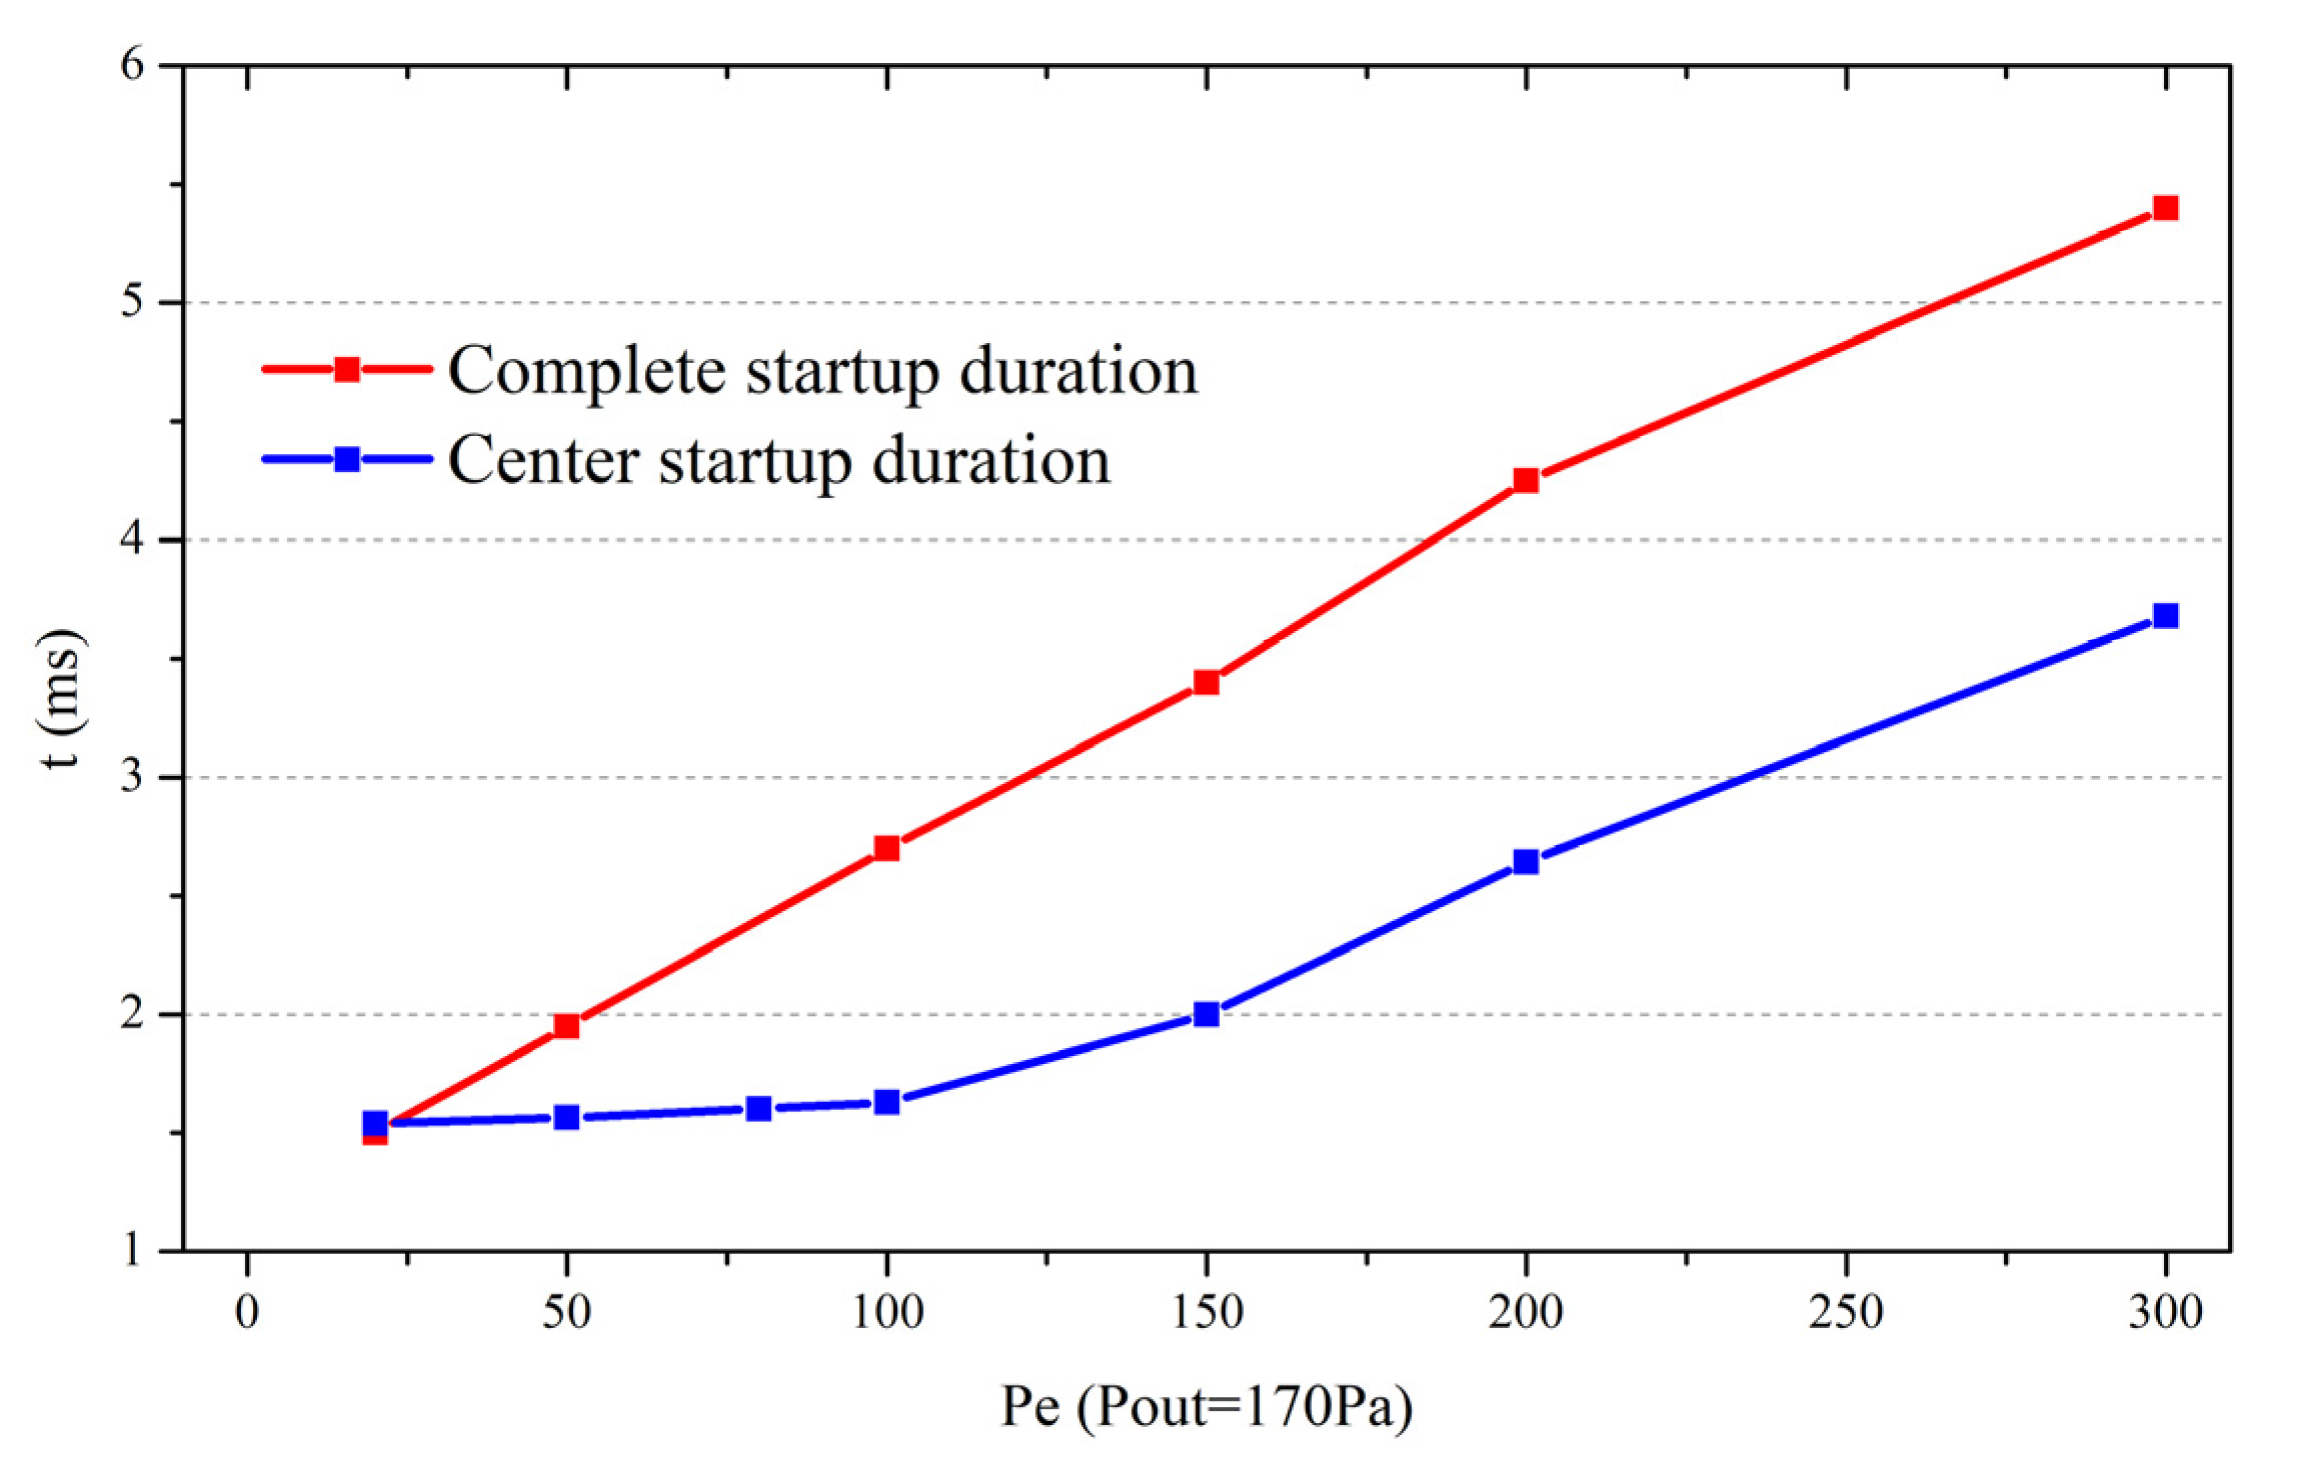
Figure 11. In the above-mentioned reservoir region conditions, when the initial pressure is 20 Pa, the second shock wave curves slightly inward and still occupies most of the exit area. However, when the initial pressure increases to 50 Pa, the degree of bending of the second shock wave increases significantly, and the second shock wave can only occupy about half of the exit section. When the backpressure continues to increase to 150 Pa, there is only an oblique shock wave at the nozzle exit. The curve of the complete startup duration with the initial pressure is shown in Figure 12.
Additionally, Figure 12 also compares the center startup and the complete startup duration of the nozzle under different initial pressures. For the complete startup, there is no critical pressure, and the startup duration increases linearly with an increase in the initial pressure. In addition, it can be seen from Figure 12 that, at a very low initial pressure (about 0.1 times the pressure at the outlet of the nozzle when the flow field is stable), the complete startup duration is equal to the center startup duration. In other words, the low-velocity zone is very small, and the flow field can be stable in the entire nozzle outlet at the same time.

4.2. The Influence of the Reservoir Region Condition on Nozzle Startup

In order to evaluate the influence of the reservoir region temperature and pressure on the nozzle starting parameters (startup time, instability time and critical initial pressure), the following two cases are studied:
Case 1: P5 = 15 MPa; T5 = 3000 K, 4500 K, 6000 K
Case 2: T5 = 6000 K; P5 = 5 MPa, 15 MPa, 25 MPa
A large number of numerical calculations are performed for the starting process under different initial pressure values. Both Case 1 and Case 2 used the above nozzle with a nominal Mach number of 8 and an outlet diameter of 510 mm. The reservoir region component of each case is the equilibrium gas.
In Case 1, when the total temperature is 3000, 4500, and 6000 K, the critical initial pressure of the nozzle is 1700, 1000, and 800 Pa, respectively, and the minimum center startup duration is 1.95, 1.5, and 1.25 ms, respectively. At the same time, the center instability duration also decreases slightly. In other words, with an increase in the total temperature, the critical initial pressure of the nozzle decreases, and the minimum center startup duration and instability duration also decrease. The minimum center startup duration is approximately proportional to −0.6 power of the total temperature, as shown in Figure 13—center startup duration. In addition, the curve of the center startup duration with the initial pressure also shows that when the initial pressure is greater than the critical pressure, the center startup and instability duration grow faster under the condition of high total temperature. In other words, the center startup and instability duration of the nozzle is more sensitive to the initial pressure when the nozzle is operated under the high total temperature.
The center startup and instability duration of the nozzle depends on the time when the left-traveling expansion waves leave the nozzle completely. Since these waves are left-traveling waves, they move with a velocity of ua, and travel from the nozzle throat to the outlet in the following time:
t = 0 x d x u a = 0 x d x a ( M 1 )
where t is the time for the left-traveling expansion waves to move from the throat to the nozzle outlet, x is the distance from the throat to the nozzle outlet along the nozzle axis, u is the local velocity, a is the local sound velocity, and M is the local Mach number. The parameters u, a, and M are all functions of x. When the reservoir region temperature rises, the temperature of the flow field in the nozzle increases, and the local sound velocity increases, and although M depends on the gas expansion ratio, it is only related to the nozzle profile. As can be seen from Equation (10), as the local sound velocity increases, the integral value decreases, and the movement time of the left-traveling expansion wave in the nozzle is reduced. Therefore, the reservoir region temperature is higher, and the nozzle can start more quickly. There is a premise that the initial pressure is less than the critical pressure; if the initial pressure is high, the nozzle center startup duration is also affected by the initial pressure.
In Case 2, the reservoir region temperature is 6000 K, and the pressure varies greatly (5~25 MPa), but the difference between the center startup and the instability duration is very small, especially when the initial pressure is less than the critical pressure. The critical initial pressure varies with the different reservoir region pressure, but it is the same as the ratio of the critical initial pressure to the flow pressure at the nozzle outlet when the flow field is stable, which is about 0.4 in this case. When the initial pressure is greater than the critical pressure, with an increase in the initial pressure, the center startup duration and the instability duration increase proportionately with the pressure ratio to the power of 0.5, but there is still a difference. When the residence pressure is low, the growth is slightly faster, as shown in Figure 14.
The low-velocity zone makes the complete startup of the nozzle lag behind the central startup, and the lag time depends on the size of the low-velocity zone. Generally speaking, the higher the initial pressure, the larger the low-velocity zone. The analysis of more calculation results shows that the complete startup duration and the instability duration of the nozzle starting process are approximately proportional to the pressure ratio of 0.5 power, and there is no critical pressure. Moreso, the higher the initial pressure, the longer the startup duration. Only at a very low initial pressure, the startup duration changes gently. When the reservoir region pressure increases, the velocity of the shock wave in the nozzle is accelerated, which is conducive to the rapid starting of the nozzle; however, the low-velocity zone has a greater impact on the starting, so the complete startup and the instability duration only decreases slightly. The influence of the total temperature on the complete starting is not significant in the calculation range. For the complete starting of the nozzle, the size of the low-velocity zone is the biggest influence factor, as shown in Figure 15a,b.

5. Conclusions

In this paper, the starting process of the nozzle in a shock tunnel is experimentally and numerically studied. First, the starting process of the nozzle is described, and the accuracy of the program is experimentally verified. Then, the effects of the initial pressure and reservoir region conditions on the nozzle startup and instability duration are analyzed.
The starting shock wave, the second shock wave, and the left-traveling expansion waves are generated during the nozzle starting process. As the second shock wave interacts with the boundary layer and curls inward, a low-velocity zone and an oblique shock wave are generated near the wall. The flow field at the outlet center reaches stability at first, and only when the low-velocity zone moves out of the nozzle completely can the flow field reach stability in the entire nozzle outlet.
It is found that the initial pressure has two effects on the starting process, namely the velocity of the left-traveling expansion wave and the size of the low-velocity zone. As the initial pressure increases from a small value, the expansion wave velocity at first remains constant and then gradually increases. The center startup duration is not affected by the low-velocity zone and only depends on the expansion wave velocity, so it is constant at first and then gradually increases. The central instability duration decreases at first and then increases. The increase in the initial pressure leads to the expansion of the low-velocity zone, and the complete startup and the instability duration of the nozzle are significantly extended.
For the center startup, the initial pressure corresponding to the shortest center instability duration is defined as the critical pressure. With an increase in the total temperature, the critical initial pressure gradually decreases, and the center startup and the minimum instability duration also decrease. The minimum center startup duration is approximately proportional to the total temperature to the power of −0.6. As the total pressure increases, the critical initial pressure increases, but the ratio of the critical initial pressure to the nozzle outlet pressure remains constant. The total pressure has little effect on the center startup and instability duration of the nozzle.
For a complete startup, there is no critical initial pressure. The complete startup and instability duration of the nozzle both increase with an increase in the initial pressure, which is approximately proportional to the 0.5 power of the pressure ratio. The size of the low-velocity zone is the most important factor affecting the complete starting, while the total temperature and pressure have little effect.

Author Contributions

Formal analysis, J.Y. and J.L.; investigation, J.Y.; software, J.Y.; writing—original draft, J.Y.; writing—review and editing, J.L., Q.W., X.Z. and S.Z. All authors have read and agreed to the published version of the manuscript.

Funding

This research was funded by the National Natural Science Foundation of China (Grant No. 12072352) and the Youth Innovation Promotion Association CAS (Grant No. 2021020).

Institutional Review Board Statement

Not applicable.

Informed Consent Statement

Not applicable.

Data Availability Statement

Not applicable.

Conflicts of Interest

The authors declare no conflict of interest.

References

  1. Iang, Z.L. Progresses on experiment techniques of hypersonic and high-enthalpy windtunnels. Acta Aerodyn. Sin. 2019, 37, 347–355. [Google Scholar]
  2. Hong, Q.; Wang, X.; Hu, Y. Development of a stagnation streamline model for thermochemical nonequilibrium flow. Phys. Fluids 2020, 32, 046102. [Google Scholar] [CrossRef]
  3. Yamanaka, A.; Ariga, Y.; Obara, T.; Cai, P.; Ohyagi, S. Study on performance of detonation-driven shock tube. JSME Int. J. Series B: Fluids Therm. Eng. 2002, 45, 425–431. [Google Scholar] [CrossRef] [Green Version]
  4. Dai, C.; Sun, B.; Zhou, C.; Zhuo, C.; Du, L.; Zhou, S. Numerical investigation of real-gas effect of inward-turning inlet at Mach 12. Aerosp. Sci. Technol. 2021, 115, 106786. [Google Scholar] [CrossRef]
  5. Jang, Z.; Li, J.; Hu, Z.; Liu, Y.; Yu, H. Shock tunnel theory and methods for duplicating hypersonic flight conditions. Chin. J. Theor. Appl. Mech. 2018, 50, 1283–1291. [Google Scholar]
  6. Petersen, E.L.; Hanson, R.K. Nonideal Effects behind Reflected Shock Waves in a High-Pressure Shock Tube. Shock Waves 2001, 10, 405–420. [Google Scholar] [CrossRef] [Green Version]
  7. Goozée, R.J.; Jacobs, P.A.; Buttsworth, D.R. Simulation of a complete reflected shock tunnel showing a vortex mechanism for flow contamination. Shock Waves 2006, 15, 165–176. [Google Scholar] [CrossRef] [Green Version]
  8. Luo, K.; Wang, Q.; Li, J.; Li, J.; Zhao, W. Numerical modeling of a high-enthalpy shock tunnel driven by gaseous detonation. Aerosp. Sci. Technol. 2020, 104, 105958. [Google Scholar] [CrossRef]
  9. Jewell, J.S.; Huffman, C.C.; Juliano, T.J. Transient Startup Simulations for a Large Mach 6 Quiet Ludwieg Tube. In Proceedings of the American Institute of Aeronautics and Astronautics 55th AIAA Aerospace Sciences Meeting, Grapevine, TX, USA, 9–13 January 2017. [Google Scholar]
  10. Wang, Q.; Zhao, W.; Yu, X.L.; Jiang, Z.L. Effective test time measurement research for high enthalpy shock tunnel. Acta Aeronatica Astronaut. Sin. 2015, 36, 3534–3539. [Google Scholar]
  11. Hannemann, K.; Itoh, K.; Mee, D.J.; Hornung, H.G. Free Piston Shock Tunnels HEG, HIEST, T4 and T5. In Experimental Methods of Shock Wave Research; Springer: Cham, Switzerland, 2015; pp. 181–264. [Google Scholar] [CrossRef]
  12. Boyce, R.R.; Takahashi, M.; Stalker, R.J. Mass spectrometric measurements of driver gas arrival in the T4 free-piston shock-tunnel. Shock Waves 2005, 14, 371–378. [Google Scholar] [CrossRef]
  13. Hannemann, K.; Krek, R.; Eitelberg, G. Latest Calibration Results of the HEG Contoured Nozzle. In Proceedings of the 20th International Symposium on Shock Waves, Pasadena, CA, USA, July 1995; Sturtevant, B., Sheperd, J.E., Hornung, H.G., Eds.; World Scientific: Singapore, 1996; pp. 1575–1580. [Google Scholar]
  14. Skinner, K.A. Mass Spectrometry in Shock Tunnel Experiments of Hypersonic Combustion. Ph.D. Thesis, The University of Queensland, Brisbane, Australia, 1994. [Google Scholar]
  15. Mee, D.J. Uncertainty Analysis of Conditions in the Test Section of the T4 Shock Tunnel; Report No. 4/93; University of Queensland: Brisbane, Australia, 1993. [Google Scholar]
  16. Chang, E.W.K.; Chan, W.Y.; Hopkins, K.J.; McIntyre, T.J.; Veeraragavan, A. Electrically-heated flat plate testing in a free-piston driven shock tunnel. Aerosp. Sci. Technol. 2020, 103, 105856. [Google Scholar] [CrossRef]
  17. Trudgian, M.A.; Landsberg, W.O.; Veeraragavan, A. Experimental investigation of inclining the upstream wall of a scramjet cavity. Aerosp. Sci. Technol. 2020, 99, 105767. [Google Scholar] [CrossRef]
  18. Stalker, R.J. A study of the free-piston shock tunnel. AIAA J. 1967, 5, 2160–2165. [Google Scholar] [CrossRef]
  19. Gu, S.; Olivier, H. Capabilities and limitations of existing hypersonic facilities. Prog. Aerosp. Sci. 2020, 113, 100607. [Google Scholar] [CrossRef]
  20. Leibowitz, M.G.; Austin, J.M. Assessment of Reflected Shock Tunnels for Mars Entry Vehicle Ground Testing. In Proceedings of the 2018 AIAA Aerospace Sciences Meeting, Kissimmee, FL, USA, 8–12 January 2018. [Google Scholar] [CrossRef]
  21. Hannemann, K.; Schnieder, M.; Reimann, B.; Martinez Schramm, J. The influence and delay of driver gas contamination in HEG. In Proceedings of the 21st AIAA Aerodynamic Measurement Technology and Ground Testing Conference, Denver, CO, USA, 19–22 June 2000. [Google Scholar]
  22. Hannemann, K. High Enthalpy Flows in the HEG Shock Tunnel: Experiment and Numerical Rebuilding (Invited). In Proceedings of the 41st AIAA Aerospace Sciences Meeting and Exhibit, Reno, NV, USA, 6–9 January 2003. [Google Scholar] [CrossRef]
  23. Hannemann, K.; Martinez Schramm, J.; Karl, S. Recent extensions to the High Enthalpy Shock Tunnel Göttingen (HEG). In Proceedings of the 2nd International ARA Days “Ten Years after ARD”, Arcachon, France, 21–23 October 2008. [Google Scholar]
  24. Itoh, K.; Ueda, S.; Tanno, H.; Komuro, T.; Sato, K. Hypersonic aerothermodynamic and scramjet research using high enthalpy shock tunnel. Shock Waves 2002, 12, 93–98. [Google Scholar] [CrossRef]
  25. Smith, C.E. The starting process in a hypersonic nozzle. J. Fluid Mech. 1966, 24, 625–640. [Google Scholar] [CrossRef]
  26. Amann, H.O. Experimental Study of the Starting Process in a Reflection Nozzle. Phys. Fluids Suppl. 1969, 12, 150–153. [Google Scholar] [CrossRef]
  27. Mouronval, A.-S.; Hadjadj, A. Numerical Study of the Starting Process in a Supersonic Nozzle. J. Propuls. Power 2005, 21, 374–378. [Google Scholar] [CrossRef]
  28. Igra, O.; Wang, L.; Falcovitz, J.; Amann, O. Simulation of the starting flow in a wedge-like nozzle. Shock Waves 1998, 8, 235–242. [Google Scholar] [CrossRef]
  29. Saito, T.; Takayama, K. Numerical simulations of nozzle starting process. Shock Waves 1999, 9, 73–79. [Google Scholar] [CrossRef]
  30. Chaudhuri, A.; Hadjadj, A. Numerical simulations of nozzle starting process. In Proceedings of the 50th AIAA Aerospace Sciences Meeting including the New Horizons Forum and Aerospace Exposition, Nashville, TN, USA, 9–12 January 2012. [Google Scholar]
  31. Candler, G.; Perkins, J. Effects of vibrational nonequilibrium on axisymmetric hypersonic nozzle design. In Proceedings of the 29th Aerospace Sciences Meeting, Reno, NV, USA, 7–10 January 1991. Paper 1991-0297. [Google Scholar] [CrossRef]
  32. Candler, G. Hypersonic Nozzle Analysis Using an Excluded Volume Equation of State. In Proceedings of the 38th AIAA Thermophysics Conference, Toronto, ON, Canada, 6–9 June 2005. AIAA Paper 2005-5202. [Google Scholar] [CrossRef]
  33. Narayana, G.; Selvaraj, S. Transient heat transfer measurements on pulsating and oscillating flows in a shock tunnel. Aerosp. Sci. Technol. 2020, 104, 105879. [Google Scholar] [CrossRef]
  34. McBride, B.J.; Heimel, S.; Ehlers, J.G.; Gordon, S. Thermodynamic Properties to 6000 K For 210 Substances Involving the First 18 Elements; NASA SP-3001; 1963. Available online: https://ntrs.nasa.gov/citations/19630013835 (accessed on 13 February 2022).
  35. Gupta, R.N.; Yos, J.M.; Thompson, R.A.; Lee, K.P. A Review of Reaction Rates and Thermodynamic and Transport Properties for an 11-Species Air Model for Chemical and Thermal Nonequilibrium Calculation to 30,000K; NASA Reference Publication 1232; 1990. Available online: https://ntrs.nasa.gov/citations/19900017748 (accessed on 13 February 2022).
  36. Park, C. Review of Chemical-Kinetic Problems of Future NASA Missions, Part I: Earth Entries. J. Thermophys. Heat Transf. 1993, 7, 385–398. [Google Scholar] [CrossRef]
  37. Gokgen, T. Computation of Nonequilibrium Radiating Shock Layers. In Proceedings of the 31st Aerospace Sciences Meeting and Exhibit, Reno, NV, USA, 11–14 January 1993. [Google Scholar]
  38. Boyd, I.D.; Gokgen, T. Computation of Axisymmetric and Ionized Hypersonic Flows Using Particle and Continuum Methods. AIAA J. 1994, 32, 1828–1835. [Google Scholar] [CrossRef]
  39. Li, J.P.; Zhang, S.Z.; Yu, J.P.; Zhang, X.Y.; Chen, H.; Yu, H.R. A detonation tunnel with high temperature burnt gas as test medium. Phys. Gases 2018, 3, 1–8. [Google Scholar]
  40. Kovács, Á.; Mesler, R.B. Making and testing small surface thermocouples for fast response. Rev. Sci. Instrum. 1964, 35, 485–488. [Google Scholar] [CrossRef]
  41. Coblish, J.J.; Coulter, S.M.; Norris, J.D. Aerothermal measurement improvements using coaxial thermocouples at AEDC hypervelocity wind tunnel No. 9. In Proceedings of the 45th AIAA Aerospace Sciences Meeting and Exhibit, Reno, NV, USA, 8–11 January 2007. AIAA 2007-1467. [Google Scholar]
  42. Bendersky, D. A special thermocouple for measuring transient temperatures. Mech. Eng. 1953, 75, 117. [Google Scholar]
  43. Alkidas, A.C. Heat transfer characteristics of a spark-ignition engine. J. Heat Transf. 1980, 102, 189–193. [Google Scholar] [CrossRef]
  44. Frankel, J.I.; Keyhani, M. Theoretical development of a new surface heat flux calibration method for thin-film resistive temperature gauges and co-axial thermocouples. Shock Waves 2013, 23, 177–188. [Google Scholar] [CrossRef]
  45. Buttsworth, D.R. Assessment of effective thermal product of surface junction thermocouples on millisecond and microsecond time scales. Exp. Therm. Fluid Sci. 2001, 25, 409–420. [Google Scholar] [CrossRef] [Green Version]
  46. Olivier, H.; Gronig, H.; Schulze, B. Instrumentation techniques of the Aachen shock tunnel TH2. In Proceedings of the International Congress on Instrumentation in Aerospace Simulation Facilities, Wright-Patterson AFB, Dayton, OH, USA, 18–21 July 1995. [Google Scholar]
Figure 1. Nozzle starting waves.
Applsci 12 02845 g001
Figure 2. Grid diagram (a) and enlarged grid diagram near the wall (b).
Applsci 12 02845 g002
Figure 3. Schematic diagram of the high-enthalpy shock tunnel facility.
Applsci 12 02845 g003
Figure 4. Sphere model (left) and installation diagram (right).
Applsci 12 02845 g004
Figure 5. Type-E coaxial thermocouple heat flux sensor (left) and NS-3 pressure sensor (right).
Applsci 12 02845 g005
Figure 6. Comparison of the CFD (computational fluid dynamics) results and experimental data. (a) Heat Flux. (b) Pitot pressure.
Applsci 12 02845 g006aApplsci 12 02845 g006b
Figure 7. Velocity distribution of nozzle axis (left) and Ma contour (right) in different initial pressure at 0.5 ms.
Applsci 12 02845 g007
Figure 8. Nozzle center startup and instability duration under different initial pressure.
Applsci 12 02845 g008
Figure 9. Low velocity zone and oblique shock.
Applsci 12 02845 g009
Figure 10. Pressure distribution at different moments of the nozzle outlet.
Applsci 12 02845 g010
Figure 11. Schematic diagram of the low-velocity flow zone under different initial pressure values. (a) Pe = 20 Pa, (b) Pe = 50 Pa, (c) Pe = 100 Pa, (d) Pe = 150 Pa.
Applsci 12 02845 g011
Figure 12. Center startup time and complete startup time.
Applsci 12 02845 g012
Figure 13. The center startup time and instability time of the nozzle variation with the initial pressure (P5 = 15 MPa).
Applsci 12 02845 g013
Figure 14. The center startup time and instability time of the nozzle variation with the dimensionless pressure (T5 = 6000 K) (The dimensionless pressure is equal to the ratio of the initial pressure to the pressure at the outlet of the nozzle when the flow field is stable).
Applsci 12 02845 g014
Figure 15. Nozzle starting parameters for different chamber conditions. (a) T5 = 6000 K, (b) P5 = 15 MPa.
Applsci 12 02845 g015
Publisher’s Note: MDPI stays neutral with regard to jurisdictional claims in published maps and institutional affiliations.

