Article

Hydrodynamic Investigation on a Land-Fixed OWC Wave Energy Device under Irregular Waves

1
Science and Technology on Underwater Test and Control Laboratory, The 760th Research Institute of China Shipbuilding Industry Corporation, Dalian 116013, China
2
The State Key Laboratory of Coastal and Offshore Engineering, Dalian University of Technology, Dalian 116024, China
*
Author to whom correspondence should be addressed.
Appl. Sci. 2022, 12(6), 2855; https://doi.org/10.3390/app12062855
Submission received: 8 February 2022 / Revised: 6 March 2022 / Accepted: 9 March 2022 / Published: 10 March 2022
(This article belongs to the Special Issue Numerical Study on Wave Energy Converters)

Abstract

:
The hydrodynamic response of a land-based oscillating water column (OWC) wave energy converter under various irregular wave conditions is investigated numerically. Based on the potential flow theory, a two-dimensional fully nonlinear numerical wave flume (NWF) is developed to model the hydrodynamic characteristics using the time-domain higher-order boundary element method (HOBEM). The inner-domain sources method and JONSWAP energy spectrum is used to generate the irregular incident waves, and a linear pneumatic model is used to determine the pneumatic pressure inside the chamber. The free surface elevations at the chamber centre and the oscillatory pneumatic pressures induced by the vertical motion of the water column are recorded. The influence of irregular waves on the hydrodynamic characteristics of the OWC device is carried out by comparison with the regular waves, and a number of significant wave heights and peak wave periods are considered. The hydrodynamic efficiency of the OWC device in irregular wave conditions is observed to be lower than that in regular waves for most wave frequencies, especially near the resonant frequency.

1. Introduction

With the rapid development of industry and environmental problems caused by the overexploitation of limited fossil fuels resources, the adoption of green and safe renewable energy technologies is now crucial to meet increasing global energy demands. In this regard, ocean energy resources, especially wave energy, have attracted significant attention due to a number of advantages [1]. The average energy density of wind farms is approximately 0.4–0.6 kW/m2 and solar parks is 0.1–0.2 kW/m2 [2]. Wave farm energy density is significantly higher at approximately 2–3 kW/m2. In addition, wave farms can efficiently operate for longer durations, functioning up to about 90% of the time, which is higher than wind farms and solar parks that are affected by the weather and usually generate power 20–30% of the time [2]. These factors demonstrate that wave power is suitable to provide a stable energy supply to the market. Wave energy presents lower negative environmental impacts [3,4], and is regarded as one of the most promising future renewable energy sources.
In the recent decades, a large amount of research has been carried out on wave energy devices and thousands of wave energy patents have been issued [5,6]. The oscillating water column (OWC) device is one of the most effective technologies in the range of various wave energy converter (WEC) concepts because of its geometric and mechanical simplicities [7]. A number of reviews have been published on the design, working principles, modeling, and optimization of WECs, see for example, Falnes [8], Falcão [5], and Cui et al. [9]. Some review studies specific to OWC-WECs have been conducted by Heath [10], Falcão and Henriques [11], and Delmonte et al. [12].
According to the aforementioned reviews, most of the past research works on OWC devices concentrated on the hydrodynamic performance of the device in regular wave conditions, and there have been few studies on OWC-WECs in irregular wave conditions. Gervelas et al. [13] developed a 1D time-domain model for an OWC-WEC. The air pressure and water elevation inside the chamber for regular and irregular waves were computed and the findings were compared with scaled experimental data. Koo and Kim [14] developed a 2D fully nonlinear idealized numerical wave flume (NWF) to investigate wave interaction with a land-based OWC device using a lower-order boundary element method. The hydrodynamic performance of the WEC, and the available power, computed using the time series of the chamber free surface elevation at the chamber midpoint together with the chamber pressures, was studied in irregular wave conditions. However, the chamber-duct area ratio (46.6%) was too large to effectively study the pneumatic effect within the chamber. Vyzikas et al. [15] performed scaled model experiments to examine the hydrodynamic performance of four different OWC models in regular and irregular wave conditions. The relevant integral formula was introduced to calculate the hydrodynamic efficiency in this study. Later, they investigated the hydrodynamic characteristics of the OWC-WECs with a stepped seabed in regular and irregular wave conditions using the open-source code OpenFOAM [16]. Validation of their model was achieved by comparing the experiment data with the numerical results (wave surface spectrum and pressure spectrum inside the central chamber) in irregular wave conditions. The effect of turbine damping and wave conditions on the hydrodynamic performance of an OWC device was evaluated in both regular and random waves by Rezanejad et al. [17]. They found that the influence of the wave height was less significant when compared with the wave period and turbine damping. Mitchell Ferguson et al. [18] conducted a model scale test to analyze the operation of OWCs in regular, polychromatic and irregular waves by employing PIV (Particle image velocimetry) technology. Liu et al. [19] performed a number wave-flume tests on a model-scale OWC chamber-turbine system in irregular wave conditions. Their research focused on the first-stage and second-stage efficiencies (calculated from the turbine system) under various test conditions. Zabihi et al. [20] performed a scaled model test to investigate the sloshing phenomenon at the chamber interior in irregular wave conditions.
Real ocean wave conditions are manifest as various irregular wave forms. These irregular sea conditions can be investigated by employing various forms of random wave spectra calculated from measured and statistical wave data. Due to the presence of the air phase within the chamber, the interaction between the wave and the OWC device is complex and nonlinear [21]. Based on the fully nonlinear potential flow theory, the hydrodynamic characteristics of a land-fixed OWC device in the irregular wave conditions are numerically investigated using higher-order boundary element method (HOBEM) in the present study. Due to the fact that the numerical tests conducted using irregular waves require longer simulation times to ensure sufficient statistical data, this model adopts an inner-source wave generation technique to generate waves, which can eliminate re-reflection and maintain model stability in the long duration simulations [6]. The characteristics of the wave height and pneumatic pressure inside the chamber, a comparison of the hydrodynamic performance between the irregular and regular waves and, specifically, the water motion inside the chamber is analyzed.
The overall structure of this paper is as follows. In Section 2, the numerical model is introduced. The wave generation and model capability validations are presented in Section 3. The influence of irregular wave conditions on the hydrodynamic characteristics of the fixed OWC device are analyzed in Section 4. The main conclusions are summarized in Section 5.

2. Numerical Model

2.1. Governing Equations and Boundary Conditions

In this section, the governing equation and the boundary problems are described. Figure 1 shows a schematic layout of the numerical wave flume (NWF). The damping layer is set at the left end of the flume to absorb the reflected waves and the OWC device is placed at the other end. The Cartesian coordinate system (Oxz) is introduced with its origin located at the edge position of the damping layer on the stationary free surface, with the z-axis positive in the upwards direction and the x-axis positive in the wave propagation direction.
B denotes the chamber width, C the front-wall thickness, d the front wall draught, e the air duct width, hc the chamber height and h the static water depth. Five numerical wave gauges (i.e., G1, G2, G3, G4 and G5) are used to record the continuous surface elevations at different locations. G1 is situated outside the chamber at 1.0 wavelengths from the exterior surface of the front wall. Four gauges are situated inside the chamber: G2 is at the inner side of the front wall, G3 is 0.25B from the internal side of the front wall, the third internal wave gauge, G4 is at the chamber center and G5 is at the rear wall.
Assuming that the water is incompressible, inviscid and the fluid flow is irrotational, the fluid motion can be described by the velocity potential ϕ. Here, the numerical model developed by Ning et al. [6] to simulate the hydrodynamic characteristics of the OWC device under regular waves is extend to model the hydrodynamic effects under irregular wave conditions. The inner-domain sources method is adopted to produce incident waves. Thus, the governing equation is modified from the Laplace equation to the Poisson equation as follows:
2 ϕ = q * ( x s , z , t )
where 2 = 2 / x 2 + 2 / z 2 is the 2D Laplacian operator, and q*(xs, z, t) = 2(xxs) is the pulsating volume flux density, xs is the horizontal position of vertical sources, u is the horizontal fluid velocity calculated from Stokes second-order analytical solution and the Dirac delta function is given by δ(xxs).
To account for the viscosity effects, an artificial viscous damping term with coefficient μ2 was introduced in free surface inside the OWC chamber [22,23]. Then, the kinematic and dynamic free surface boundary conditions can be written as follows:
{ d X ( x , z ) d t = ϕ μ 1 ( x ) ( X X 0 ) d ϕ d t = g η + 1 2 | ϕ | 2 p ρ μ 1 ( x ) ϕ μ 2 ϕ n
where d / d t = / t + v · is the material derivative. X (x, z) is the horizontal and vertical displacements of fluid particles on the free surface, respectively. X0 = (x0, 0) denotes the initial static position of the fluid particle. g is the gravity acceleration. p is the pneumatic pressure and ρ is the water density, μ1(x) and μ2 are the coefficients of the damping layer and artificial viscous damping term, respectively.
The boundaries at the OWC structure’s surface are considered impermeable. Therefore, the zero normal velocity condition ϕ / n = 0 at the bottom, rear wall and front wall of the OWC is satisfied.
The above boundary value problem can be transformed into a boundary integral equation by adopting the Green’s second identity. The HOBEM is adopted here to generate the solution. Further details on the numerical model can be found in [6].

2.2. Pneumatic Model and OWC Hydrodynamic Efficiency

The air pressure p at the water free surface is set to zero (i.e., atmospheric pressure) outside of the chamber. At the chamber interior, the pneumatic pressure is given by
p ( t ) = C d m U d ( t )
where Cdm is the pneumatic damping coefficient and Ud(t) is the air flow velocity through the ceiling orifice and can be calculated from the variation of the water column volume under the assumption that the air volume is incompressible [24].
The energy captured by the OWC device can be calculated as,
P a i r = 1 t e t s t s t e Q ( t ) p ( t ) d t = 1 t e t s t s t e A U d ( t ) C d m U d ( t ) d t
where Q(t) = AUd(t) is the air flow rate through the air duct. ts and te are the start and end time of the calculation. Additional details regarding the pneumatic model can be found in [25].
The average energy flux per unit width of incident wave is given by [26],
P i n = ρ g ω L ω H C g ( ω ) S ( ω ) d ω
C g ( ω ) = ω 2 k ( 1 + 2 k h sinh ( 2 k h ) )
ω 2 = g k tanh k h
where Cg(ω) is the wave group celerity with ω the wave angular frequency and k the wave number.
Thus, the hydrodynamic efficiency of an OWC device is calculated from:
ξ = P a i r / P i n

2.3. Irregular Wave Generation

In the present study, a Joint North Sea Wave Project (JONSWAP) [27] energy spectrum is chosen as the input wave spectrum. The frequency spectrum S(f) presents the distribution of the wave energy with frequency f as follows:
S ( f ) = β j H s f p 4 f 5 exp [ 5 4 ( f / f p ) 4 ] · γ exp [ ( f / f p 1 ) 2 / 2 σ 2 ]
β j = 0.06238 0.230 + 0.0336 γ 0.185 ( 1.9 + γ ) 1 ( 1.094 0.01915 ln γ )
where Hs is the significant wave height. fp is the peak wave frequency. γ is the spectral peak enhancement coefficient which is taken to be 3.3 and δ = 0.07 for ffp or δ = 0.09 for f > fp.
It is assumed that the energy of the input spectrum S(f) is mainly distributed in the frequency range (fL, fH), where fL and fH are the low and high cut-off frequencies respectively. The energy spectrum is discretized into a range of equidistant frequency components. The amplitude of each wave component can be defined as follows:
Δ f i = f i + 1 f i = ( f H f ) L / M
f ^ i = ( f i + f i + 1 ) / 2
A i = 2 S ( f ^ i ) Δ f i
where the number of wave components is represented by M. Δfi is the frequency increment of the i-th frequency range. f ^ i is the intermediate value of the i-th frequency range, which is used as the representative frequency of this range, and Ai is the amplitude of i-th component.

3. Validation

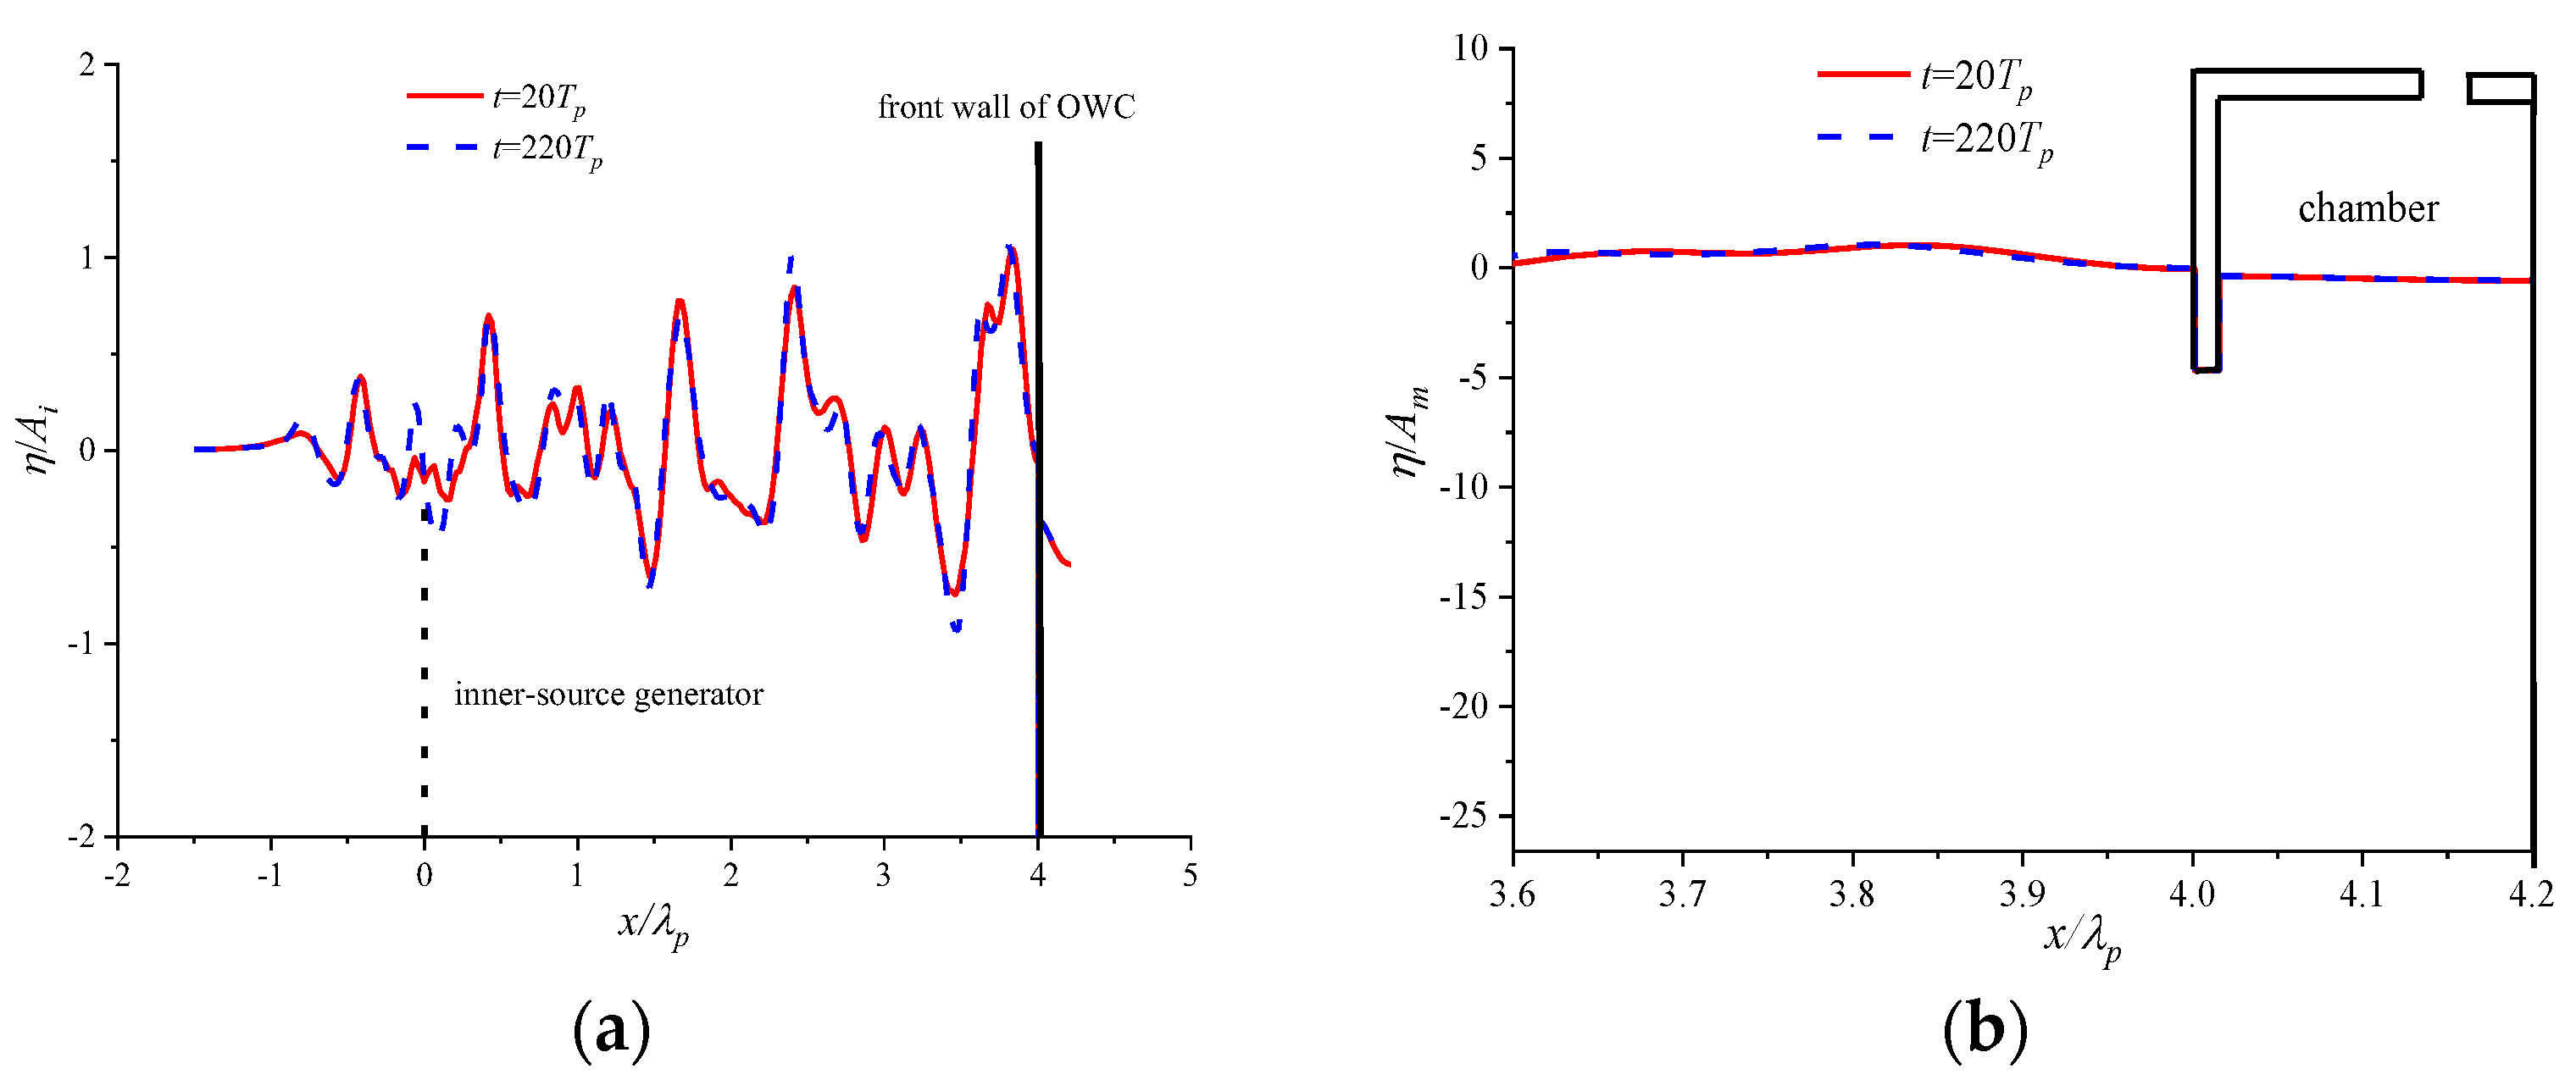
3.1. Irregular Wave Generation Validation

The irregular wave analyses in the numerical model is based on the JONSWAP spectrum with Hs = 0.06 m. The number of wave components, M is 200 with random phases uniformly distributed between 0 and 2π rad, the frequency range (fL, fH) of the input spectrum is set to (0.5 fp, 2.5 fp), with a frequency increment Δf = fp/100. Thus, the repeat interval of the signal is 100 Tp.
In order to validate irregular wave generation in the numerical tank, the wave generation test has been conducted on irregular wave conditions with static water depth h = 0.80 m without the OWC-WEC. The length of the NWT is set to seven times the peak wavelength (7.0 λp), of which 3.0 λp is used as a damping layer for reflected wave at the left- and right-hand ends of the flume (each one is 1.5 λp).
The simulation duration is selected as 100 Tp. This is determined to be sufficient to verify that all wave components are simulated and the correct spectrum distribution can be obtained at any location in the tank. Figure 2 presents the comparison of the theoretical input spectra and frequency spectra for two peak wave periods obtained by fast-Fourier transformation (FFT) performed on the free surface signals at three locations along the numerical wave tank. It is shown that there is a satisfactory agreement between the theoretical input spectrum and observed numerical wave spectrum.

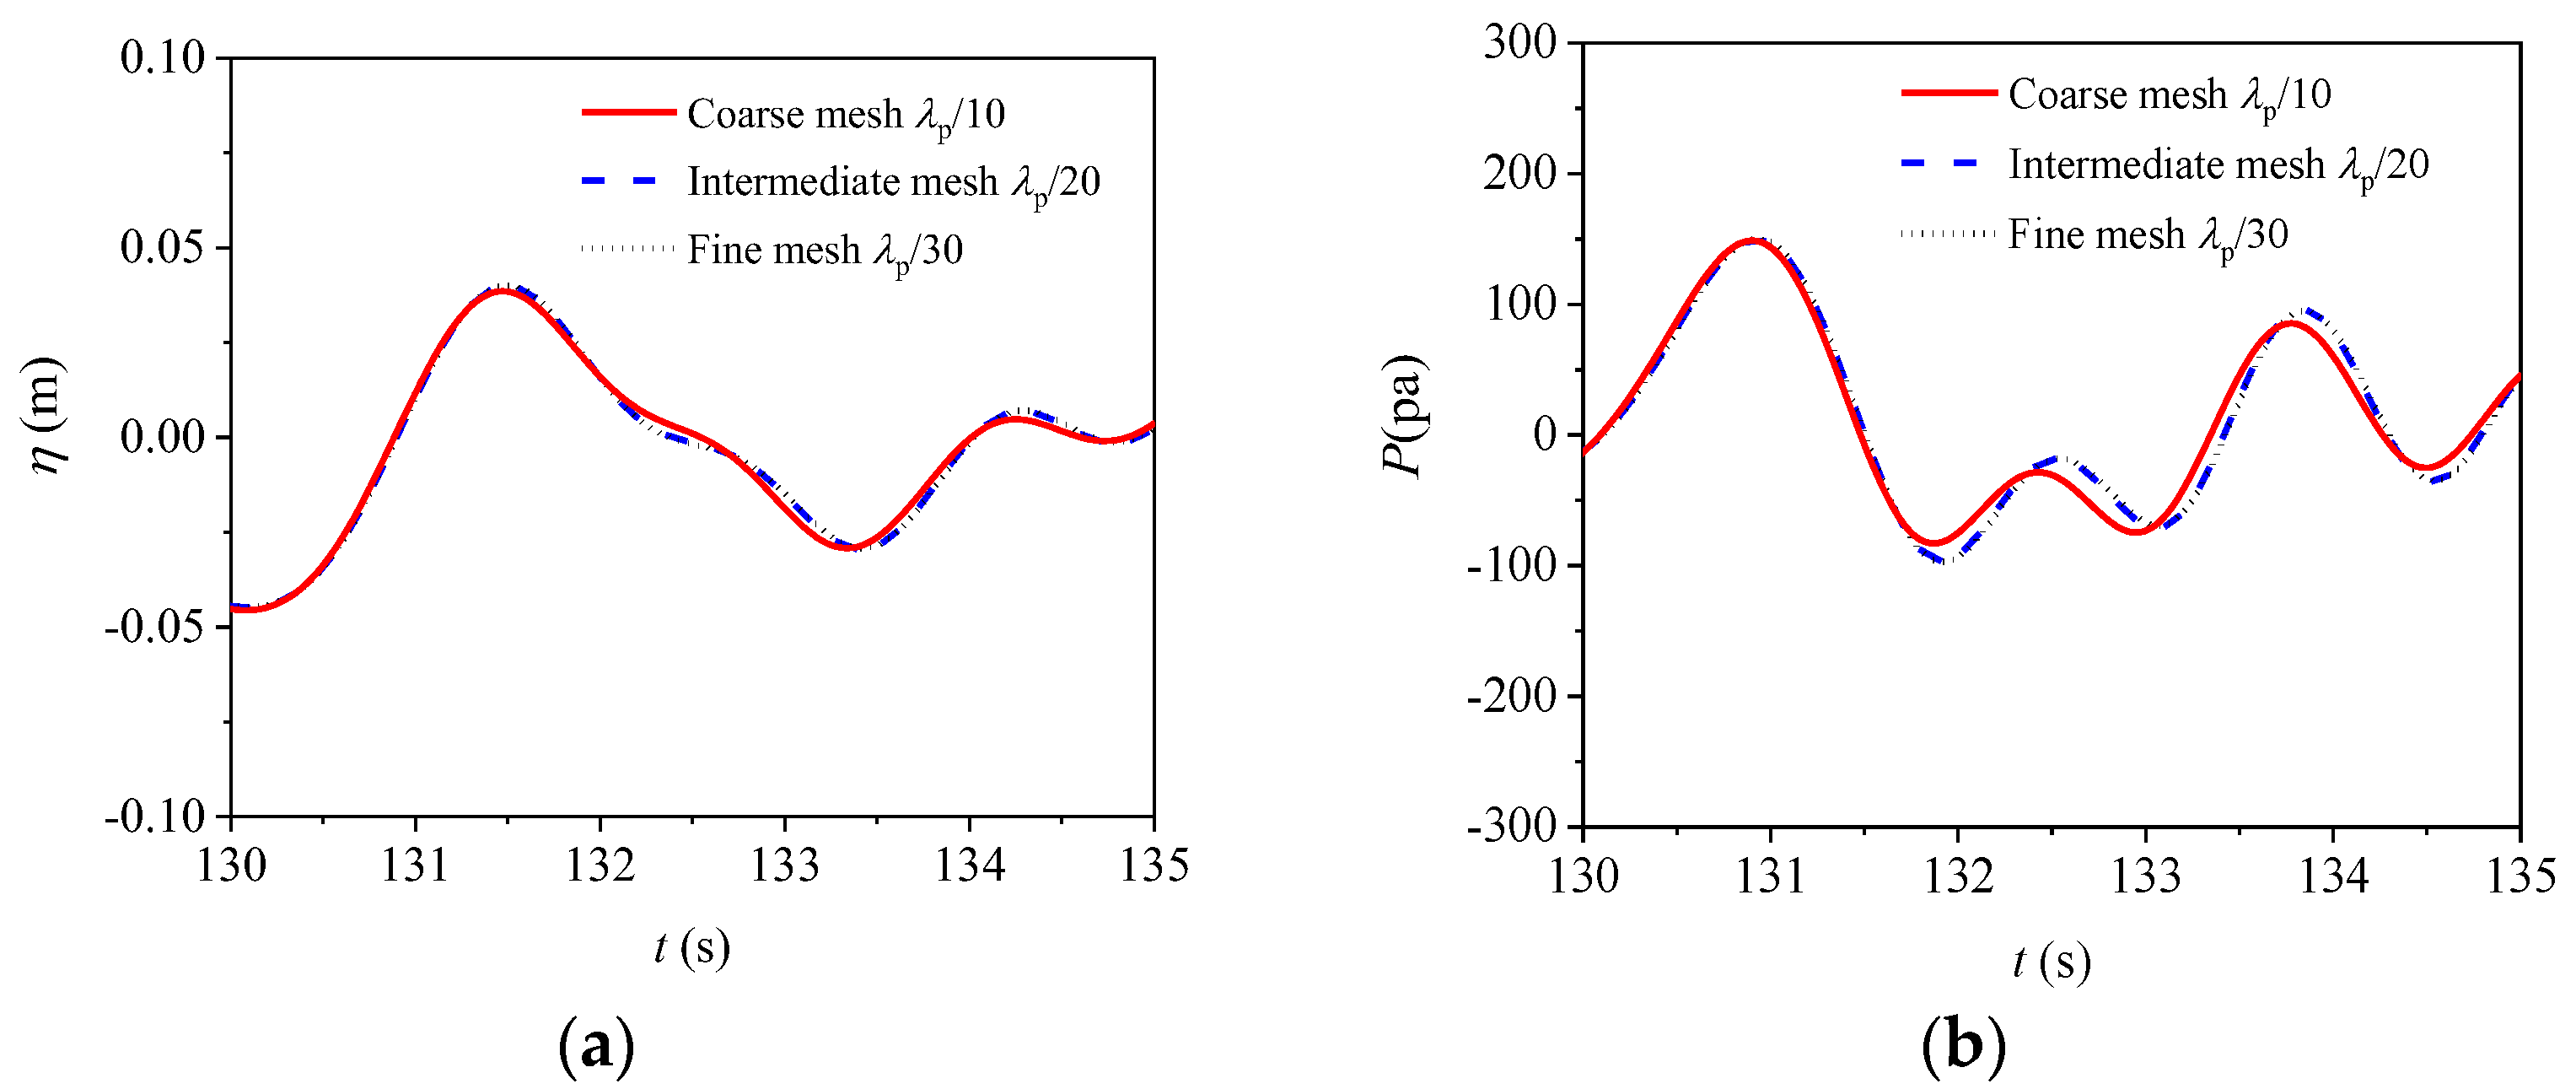
3.2. Model Validation

The numerical flume length is set to 5.5 times the peak wavelength (5.5λp), in which 1.5λp is used as the damping layer. Therefore, the length of the wave transportation is 4.0λp (from inner wave generation source to the OWC front wall), which is twice the maximum wavelength (2.0λmax) of the 200 input wave components.
The geometrical parameters of the OWC device are identical to the experiments carried out by Ning et al. [25]: the static water depth h = 0.8 m, chamber breadth B = 0.55 m, front wall draught d = 0.14 m, front-wall thickness c = 0.04 m, air duct width e = 0.0036 m and air chamber height hc = 0.20m. The values of the viscous coefficient μ2 and the linear pneumatic damping coefficient Cdm are also maintained identical as the study under regular wave, i.e., μ2 = 0.2 and Cdm = 9.5.
Convergence analyses on the spatial and temporal discretization were performed. The mesh elements size in the x and z direction is set as Δx, Δz = λp/10, λp/20 and λp/30, respectively with the peak wave period Tp = 3.0 s and Hs set to 0.06 m (corresponding to regular wave Ainc = 0.03 m). The free surface elevations at the chamber center-point are shown on Figure 3a, and the pneumatic pressures in the chamber are shown on Figure 3b. It can be seen from Figure 3 that the free surface displacement and pneumatic pressure results have both converged at the intermediate mesh size Δx = Δz = λp/20.
The time step is set as 0.5Δt, 1.0Δt, 2.5Δt for the temporal discretization convergence analysis. The duration of the spectral analysis is the complete repeat interval (100 Tp) and 16,384 continuous data points are selected for the FFT, therefore the time step is designed as Δt = 50 Tp/8192. The time step convergence results are showed in Figure 4 for Tp = 3.0 s. It is found that the time step duration set to Δt = 50 Tp/8192 is sufficient for temporal convergence.
Subsequent to the spatial and temporal convergence analyses, the spacing of the numerical grid in the x and z is set as Δx = Δz = λp/20 respectively. For different peak wave periods, the number of mesh elements for the OWC device is set to a constant value by adjusting the mesh encryption number. For each simulation case, a simulation duration of 100 Tp is performed with time step Δt = 50 Tp/8192.
Figure 5 presents the profile of the non-dimensional wave elevation (Am = Hs/2) along the wave flume for Tp = 1.366 s with t = 20 Tp, and t = 220 Tp, respectively. It can be seen that the two wave profiles match each other very well, irrespective of whether the location is inside or outside the chamber. Notably, the surface elevation progressively approaches zero in the damping layer, which confirms the wave damping capacity of the damping layer.

4. Results and Discussions

In this section, the influence of the irregular wave conditions on the free surface elevation and pneumatic pressure inside the OWC chamber are analyzed. The zero-up-crossing method was used to calculate the wave heights. By ordering the wave heights from the highest to the lowest, the maximum wave height Hmax, the mean height of the highest 1/3 of waves H1/3 (H1/3 also called significant wave height) and the mean height of the highest 1/10 of waves H1/10 can be obtained. The significant value of wave period TH1/3 is associated with H1/3. By using the same method, the statistical values for the time history of pneumatic pressure, i.e., the maximum value of pneumatic pressure Pmax significant value of pneumatic pressure P1/3 and the mean value of largest 1/10 of pneumatic pressures P1/10 can also be obtained.

4.1. Characteristic of the Wave Height and Pneumatic Pressure

Figure 6 presents the results of a typical numerical case to exhibit the time histories of the performance characteristics. The input wave spectrum parameters are selected to be Hs = 0.06 m, Tp = 1.545 s. Figure 6a shows the time series of the incident wave elevation, and Figure 6b shows the corresponding free surface elevation at the chamber center. The statistical characteristic values of the wave parameters for the incident wave and surface elevation at the chamber center are listed in Table 1. From this table, it can be seen that H1/3 = 0.060 m and the statistical peak period is Tp0 = 1.560 s. This statistical result, together with the wave spectrum verification as shown in Figure 2, confirms the accuracy of the irregular wave generation in the numerical model. The maximum free surface displacement observed at the chamber center is Hmax = 0.094 m, which is slightly lower than the statistical value of incident wave Hmax = 0.111 m, and the statistically significant height at the chamber center is H1/3 = 0.054 m, compared with the statistically significant height of the incident wave H1/3 = 0.060 m. As shown in Figure 6c, the maximum and significant values of pneumatic pressure in the chamber calculated by the same statistical method are 0.554 kPa and 0.306 kPa, respectively.
The instantaneous pneumatic power of the OWC device is presented in Figure 6d. The peak power is 32.95 W, which exceeds 14 times the average power, computed as 2.29 W.
To investigate the detailed hydrodynamic behavior of the device under the irregular wave conditions, the free surface elevation and the chamber pneumatic pressure in the period range 86 < t/Tp < 94 in Figure 6b,c are analyzed. This region of data exhibits an obvious Gaussian distribution envelop form. The time series of the non-dimensional surface elevation at the mid-point of the chamber and the pneumatic pressure in the chamber for various kph values are shown Figure 7. From Figure 7a, it is shown that the Hmax of the free surface elevation at the mid-point of the chamber increases with decreasing kph. Figure 7b indicates that the pneumatic pressure in the chamber is greater in the low wave-frequency range. In addition, Figure 7b also indicates a quarter wave cycle phase difference between the surface displacement and the pneumatic pressure, which is significant for the average power computed according to Equation (4). This phenomenon is comparable to the observed numerical results in the regular wave condition by Ning et al. [6] and irregular-wave physical experiments performed by Liu et al. [19].
Figure 8a shows the characteristic values of wave heights at different input peak periods. All three of the characteristic wave heights H1/3, H1/10 and Hmax decrease with the increase of kph. This can be explained by the transmission ability of the incident waves into the chamber. A smaller kph value (i.e., with longer incident wavelength) has a stronger transmission ability. Thus, the wave power transmitted into the chamber reduces with the increase of the incident wave frequency. Consequently, the fluctuation of the free surface elevation inside the chamber diminishes with the increase of incident wave frequency. Additionally, the maximum wave height Hmax, was influenced most by the incident wave frequency, with its greatest value reaching approximately 2.65 times the incident significant wave height H1/3 at kph = 0.75 and its lowest value 0.70 times the incident significant wave height H1/3 at kph = 3.00.
The characteristic values of pneumatic pressures at different input peak periods are presented in Figure 8b. In contrast to the free surface displacement, the pneumatic pressures initially increase with kph to their peak value and then decrease with further increasing kph. This phenomenon is similar to the observed behavior of the device in regular wave conditions [25]. This trend can be explained by the fact that the pneumatic pressures at the chamber interior are caused by the fluctuation of the free surface inside the chamber and are proportional to the variation of the free surface displacement according to Equation (4). To further analyze this behavior, the variation rate of the free surface elevation H1/3/Tp inside the chamber at different wave frequencies are calculated. Three different wave frequencies kph = 1.402, 1.037, 0.750 are selected, including the frequency at which the significant pneumatic pressure P1/3 reaches its peak value, i.e., kph = 1.037. According to Figure 8a, it is determined that H1/3/Tp = 0.587, 0.591 and 0.55 correspond to kph = 1.402, 1.037, 0.75. That is to say, the surface-elevation variation rate reaches its peak at kph = 1.037. Consequently, the significant pneumatic pressure P1/3 achieves its peak value at kph = 1.037 as shown in Figure 8b.

4.2. Comparison between the Irregular Wave and the Regular Waves

To analyze the influence of irregular waves on the hydrodynamic performance of the OWC, a comparison between the surface elevation, pneumatic pressure and hydrodynamic efficiency under irregular and regular wave conditions are performed. For the regular wave, the wave heights H at the chamber mid-point and the pneumatic pressures P in the chamber are normalized as follows:
H = 1 N i = 1 N ( η c r e s t i η t r o u g h i )
P = 1 N i = 1 N ( P c r e s t i P t r o u g h i )
where ηicrest, ηitrough, Picrest and Pitrough are the crest and trough values of free surface elevations and pneumatic pressures for the ith wave respectively, N is the number of wave crest and trough values selected from stable and continuous wave periods. In the present model, N is set to 10.
Figure 9 shows the significant wave height H1/3 at the chamber mid-point and the significant pneumatic pressure P1/3 in the chamber versus kph (kh for regular wave conditions). In general, the regular and irregular wave results exhibit the similar trend. However, there are some differences between the two curves. Considering the free surface elevations at the chamber center H1/3, the results for the irregular-wave are lower than the regular-wave results in the low-frequency region, and the discrepancy between the trends becomes to reduce with the increase of kph. The irregular wave results are marginally greater than the regular wave results in the high-frequency range. Considering the pneumatic pressures in the chamber, the irregular-wave results are lower than the regular-wave results in the mid-frequency region, most notably between 0.9 ≤ kph (kh) ≤ 2.7.
The comparison of the hydrodynamic efficiencies ξ in the regular and irregular wave conditions is shown in Figure 10. The general trends of regular- and irregular- wave results are similar. The hydrodynamic efficiencies ξ in irregular wave are higher than that in regular waves in the low-wave-frequency environment. Nevertheless, the hydrodynamic efficiencies for the irregular waves are lower than those of the regular waves over a relatively wide frequency band including the resonant frequency.

4.3. Water Motion inside the Chamber

In order to examine the spatial distribution of the free surface inside the chamber, four numerical wave gauges were used to record the surface displacements at different internal chamber locations as described in Figure 1. The energy distribution of the free surface elevation is obtained by FFT.
Figure 11 shows the difference in the dimensionless wave elevation for kph = 2.186 and kph = 1.258 along the numerical wave tank close to the chamber. It is found that the wave profile becomes sharper and the higher harmonic wave is more obvious with kph increasing due to the magnified wave nonlinearity. In addition, energy is transferred from the fundamental frequency to the higher frequency and waves are reflected by the chamber wall. This results in reduced wave transmission into the chamber interior. Thus, the water free surface elevation in the chamber with wave frequency kph = 1.258 (low frequency) is higher than that of wave frequency kph = 2.186 (high frequency).
A comparison of the incident wave spectrum with the free surface elevation spectra at G1 (external to the chamber) and G4 (chamber mid-point) is shown in Figure 12. There is a clear cut off frequency at approximately 1 Hz for the free surface spectrum at the chamber center for both kph = 1.258 and kph = 1.819. This is due to the high frequency waves being reflected by the front wall of the device; thus, the wave energy cannot transmit into the OWC chamber. Therefore, in high wave-frequency conditions, the energy at the chamber center is less than the energy of the incident wave. In addition, the amplified complex energy oscillation phenomena are recorded in the energy spectrum outside the chamber at the high-frequency region due to the strong wave nonlinearities and the interactions between incident waves and reflected waves.
Figure 13 presents the free surface elevation profiles at the interior of the chamber for kph = 3.010 and kph = 0.750 when the difference between the surface elevation at G2 and G5 reaches its maxima and minima, respectively. The wave profile is antisymmetric inside the chamber with the surface rising at one wall, whilst simultaneously falling at the other wall. Furthermore, the absolute value of the elevation difference between G2 and G5 in high frequency wave conditions (i.e., kph = 3.010) is greater than that at the lower frequency wave (i.e., kph = 0.750). This is manifest by the surface elevation inside the chamber becoming flatter under the longer wave conditions.
Considering the antisymmetric and fluctuating wave profiles inside the chamber in the irregular wave conditions, sloshing modes are used to analyze the sloshing motion of the free surface. Sloshing modes can be determined from kB = nπ, where n represents the nth mode. All odd harmonic modes are asymmetric while even harmonic modes are symmetric. The fundamental harmonic mode is excited when the OWC chamber width is half the incident wavelength (i.e., B/λp = 0.5). Other harmonic modes manifest with wavelengths equal to one half, one third, one fourth etc., of the wavelength of the fundamental mode. Since the chamber width in this model is 0.55 m, only the first mode of sloshing can be observed at frequency 1.19 Hz (kph = 4.563).
The free surface elevation spectra calculated from numerical wave gauges G3 and G4 at the interior of the chamber for six different kph are shown in Figure 14. There is clear evidence of sloshing energy at frequency 1.19 Hz for some higher incident wave frequencies, most notably at kph = 3.010 and 2.578. The sloshing becomes weaker as the wave frequency increases. This is due to the fact that piston motion and sloshing motion co-exist in the free surface displacement inside the chamber. The piston motion dominates and the sloshing motion becomes gradually weaker with the increasing of the incident wave frequency. As can be observed in Figure 14e,f, the difference between G3 and G4 is very small, and is negligible in Figure 14f. This signifies that the free surface elevation at the chamber interior is nearly flat, without sloshing motion, and is displacing in piston mode under the action of low-frequency waves.

5. Conclusions

In the present work, the hydrodynamic characteristics of a land-fixed OWC wave energy converter under the action of irregular wave conditions is numerically investigated. Based on potential flow theory, a 2D, fully nonlinear numerical wave flume is established using the time-domain higher-order boundary element method (HOBEM). In the numerical simulations, the inner-source technique and JONSWAP wave spectrum was used to generate the irregular incident wave conditions.
The results show that the significant wave heights at the chamber center-pointand the pneumatic pressures in the chamber are lower in irregular waves than those in regular waves over a relatively broad range of wave frequencies. Similarly, the hydrodynamic efficiency in irregular wave conditions is lower than that in regular waves over a relatively wide frequency range especially at the resonant frequency. In the low-frequency wave conditions, a slightly higher hydrodynamic efficiency is observed for the irregular waves when compared to the regular waves. The maximum instantaneous pneumatic power are approximately 14 times greater than average values. Thus, the stability of the PTO needs to be taken into consideration in the practical applications. The resonant sloshing phenomenon is observed in this model. With the relative peak wavelength (λp/B > 2) increasing, the sloshing motion in the chamber weakens and the piston motion free surface displacement dominates.
The viscous effects which could induce vortex shedding at the front wall and boundary layer shear stresses at the OWC device chamber walls are neglected in the present study. Future studies should consider these effects in order to obtain as more accurate prediction of the fluid structure-interactions, the forces applied to the OWC chamber walls and the free surface displacement. It is suggested that a systematic, fully nonlinear CFD study be undertaken in the future to investigate and quantify these aspects thoroughly.

Author Contributions

Conceptualization, Z.Z., R.W. and D.N.; validation, S.K., R.W. and R.M.; formal analysis, S.K., R.W. and R.M.; investigation, S.K., R.W., R.M. and D.N.; writing—original draft preparation, S.K.; writing—review and editing, Z.Z., S.K., R.W., R.M. and D.N.; supervision, D.N.; project administration, D.N. All authors have read and agreed to the published version of the manuscript.

Funding

This research was funded by the National Natural Science Foundation of China (Grant No. 52001054), Liaoning Revitalization Talents Program (Grant No. XLYC2002033), Liaoning BaiQianWan Talents Program (Grant No. 2020921007), Natural Science Foundation of Liaoning Province (Grant No. 2021-BS-060) and Fundamental Research Funds for the Central Universities (Grant No. DUT21LAB116).

Institutional Review Board Statement

Not applicable.

Informed Consent Statement

Not applicable.

Data Availability Statement

The data presented in this study can be obtained on request from the corresponding author.

Conflicts of Interest

The authors declare no conflict of interest.

References

  1. Borthwick, A.G.L. Marine Renewable Energy Seascape. Engineering 2016, 2, 69–78. [Google Scholar] [CrossRef] [Green Version]
  2. Khan, N.; Kalair, A.; Abas, N.; Haider, A. Review of ocean tidal, wave and thermal energy technologies. Renew. Sustain. Energy Rev. 2017, 72, 590–604. [Google Scholar] [CrossRef]
  3. Palha, A.; Mendes, L.; Fortes, C.J.; Brito-Melo, A.; Sarmento, A. The impact of wave energy farms in the shoreline wave climate: Portuguese pilot zone case study using Pelamis energy wave devices. Renew. Energy 2010, 35, 62–77. [Google Scholar] [CrossRef]
  4. Carballo, R.; Iglesias, G. Wave farm impact based on realistic wave-WEC interaction. Energy 2013, 51, 216–229. [Google Scholar] [CrossRef]
  5. Falcão, A.F.O. Wave energy utilization: A review of the technologies. Renew. Sustain. Energy Rev. 2010, 14, 899–918. [Google Scholar] [CrossRef]
  6. Ning, D.Z.; Shi, J.; Zou, Q.P.; Teng, B. Investigation of hydrodynamic performance of an OWC (oscillating water column) wave energy device using a fully nonlinear HOBEM (higher-order boundary element method). Energy 2015, 83, 177–188. [Google Scholar] [CrossRef]
  7. Wang, C.; Zhang, Y. Numerical investigation on the wave power extraction for a 3D dual-chamber oscillating water column system composed of two closely connected circular sub-units. Appl. Energy 2021, 295, 117009. [Google Scholar] [CrossRef]
  8. Falnes, J. A review of wave-energy extraction. Mar. Struct. 2007, 20, 185–201. [Google Scholar] [CrossRef]
  9. Cui, Y.; Liu, Z.; Zhang, X.; Xu, C. Review of CFD studies on axial-flow self-rectifying turbines for OWC wave energy conversion. Ocean Eng. 2019, 175, 80–102. [Google Scholar] [CrossRef]
  10. Heath, T.V. A review of oscillating water columns. Philos. Trans. A Math Phys. Eng. Sci 2012, 370, 235–245. [Google Scholar] [CrossRef] [Green Version]
  11. Falcão, A.F.O.; Henriques, J.C.C. Oscillating-water-column wave energy converters and air turbines: A review. Renew. Energy 2016, 85, 1391–1424. [Google Scholar] [CrossRef]
  12. Delmonte, N.; Barater, D.; Giuliani, F.; Cova, P.; Buticchi, G. Review of Oscillating Water Column Converters. IEEE Trans. Ind. Appl. 2015, 52, 1698–1710. [Google Scholar] [CrossRef]
  13. Gervelas, R.; Trarieux, F.; Patel, M. A time-domain simulator for an oscillating water column in irregular waves at model scale. Ocean Eng. 2011, 38, 1007–1013. [Google Scholar] [CrossRef]
  14. Koo, W.; Kim, M.-H. A time-domain simulation of an oscillating water column with irregular waves. Ocean. Syst. Eng. 2012, 2, 147–158. [Google Scholar]
  15. Vyzikas, T.; Deshoulieres, S.; Barton, M.; Giroux, O.; Greaves, D.; Simmonds, D. Experimental investigation of different geometries of fixed oscillating water column devices. Renew. Energy 2017, 104, 248–258. [Google Scholar] [CrossRef] [Green Version]
  16. Vyzikas, T.; Deshoulieres, S.; Giroux, O.; Barton, M.; Greaves, D. Numerical study of fixed Oscillating Water Column with RANS-type two-phase CFD model. Renew. Energy 2017, 102, 294–305. [Google Scholar] [CrossRef] [Green Version]
  17. Rezanejad, K.; Guedes Soares, C.; López, I.; Carballo, R. Experimental and numerical investigation of the hydrodynamic performance of an oscillating water column wave energy converter. Renew. Energy 2017, 106, 1–16. [Google Scholar] [CrossRef]
  18. Mitchell Ferguson, T.; Penesis, I.; Macfarlane, G.; Fleming, A. A PIV investigation of OWC operation in regular, polychromatic and irregular waves. Renew. Energy 2017, 103, 143–155. [Google Scholar] [CrossRef]
  19. Liu, Z.; Xu, C.; Shi, H.; Qu, N. Wave-flume tests of a model-scaled OWC chamber-turbine system under irregular wave conditions. Appl. Ocean Res. 2020, 99, 102141. [Google Scholar] [CrossRef]
  20. Zabihi, M.; Mazaheri, S.; Montazeri Namin, M.; Rezaee Mazyak, A. Irregular wave interaction with an offshore OWC wave energy converter. Ocean Eng. 2021, 222, 108619. [Google Scholar] [CrossRef]
  21. Gkikas, G.D.; Athanassoulis, G.A. Development of a novel nonlinear system identification scheme for the pressure fluctuation inside an oscillating water column-wave energy converter Part I: Theoretical background and harmonic excitation case. Ocean Eng. 2014, 80, 84–99. [Google Scholar] [CrossRef]
  22. Wang, R.-Q.; Ning, D.-Z.; Zou, Q.-P. Wave loads on a land-based dual-chamber Oscillating Water Column wave energy device. Coastal Eng. 2020, 160, 103744. [Google Scholar] [CrossRef]
  23. Ning, D.-Z.; Ke, S.; Mayon, R.; Zhang, C. Numerical Investigation on Hydrodynamic Performance of an OWC Wave Energy Device in the Stepped Bottom. Front. Energy Res. 2019, 7, 152. [Google Scholar] [CrossRef]
  24. Abbasnia, A.; Rezanejad, K.; Guedes Soares, C. Adaptive fully nonlinear potential model for the free surface under compressible air pressure of oscillating water column devices. Eng. Anal. Boundary Elem. 2021, 133, 153–164. [Google Scholar] [CrossRef]
  25. Ning, D.Z.; Wang, R.Q.; Zou, Q.P.; Teng, B. An experimental investigation of hydrodynamics of a fixed OWC Wave Energy Converter. Appl. Energy 2016, 168, 636–648. [Google Scholar] [CrossRef]
  26. Zabihi, M.; Mazaheri, S.; Namin, M.M. Experimental hydrodynamic investigation of a fixed offshore Oscillating Water Column device. Appl. Ocean Res. 2019, 85, 20–33. [Google Scholar] [CrossRef]
  27. Goda, Y. A Comparative Review on the Functional Forms of Directional Wave Spectrum. Coast. Eng. J. 2018, 41, 1–20. [Google Scholar] [CrossRef]
Figure 1. Sketch of the numerical wave flume with OWC-WECs.
Applsci 12 02855 g001
Figure 2. Comparison between input spectrum and incident wave elevation spectrum at different position in the NWT for two peak wave periods. (a) Tp = 1.5 s, (b) Tp = 3.0 s.
Applsci 12 02855 g002
Figure 3. Time histories of the (a) surface elevations at chamber center and (b) pneumatic pressures in the chamber for different mesh sizes.
Applsci 12 02855 g003
Figure 4. Time histories of the (a) free surface elevations at chamber center and (b) pneumatic pressures in the chamber for different temporal step intervals.
Applsci 12 02855 g004
Figure 5. Profile of wave elevation along the numerical wave flume for Tp = 1.366 s with t = 20 Tp, and t= 220 Tp. (a) Profile along the flume, (b) local view at the OWC chamber.
Applsci 12 02855 g005
Figure 6. Time histories of key hydrodynamic performance parameters at Tp = 1.545 s. (a) incident wave elevation, (b) Surface elevation at chamber center, (c) Pneumatic pressure, (d) Pneumatic power.
Applsci 12 02855 g006
Figure 7. Comparison of the (a) surface elevation at the chamber center and (b) pneumatic pressure in the chamber for three different values of kph in the OWC chamber.
Applsci 12 02855 g007
Figure 8. Comparison of different characteristic values of (a) wave heights at chamber center and (b) pneumatic pressures in the chamber versus kph.
Applsci 12 02855 g008
Figure 9. Comparison of (a) significant wave heights at the chamber mid-point and (b) significant pneumatic pressures in the chamber versus kph between regular and irregular wave conditions.
Applsci 12 02855 g009
Figure 10. Comparison of the hydrodynamic conversion efficiency versus peak wavenumber between regular and irregular wave conditions.
Applsci 12 02855 g010
Figure 11. Profile of the free-surface elevations along the numerical wave tank when the wave crest arrives at front wall of the OWC. (a) Overall view, (b) magnified view at OWC front wall.
Applsci 12 02855 g011
Figure 12. Comparison between wave input spectrum and free surface elevation spectrum at different positions along the NWT. (a) kph = 1.819, (b) kph = 1.258.
Applsci 12 02855 g012
Figure 13. Free surface elevation profiles in the chamber. (a) kph = 3.010, (b) kph = 0.750.
Applsci 12 02855 g013
Figure 14. The comparison of free surface elevation spectra at the chamber interior for G3 and G4. (a) kph = 3.010, (b) kph = 2.578, (c) kph = 2.186, (d) kph = 1.700, (e) kph = 1.258, (f) kph = 0.750.
Applsci 12 02855 g014
Table 1. Statistical characteristic value of wave parameters at Hs = 0.06 m, Tp = 1.545 s.
Tp0 (s)TH1/3 (s)H1/3 (m)H1/10 (m)Hmax (m)
Incident wave1.5601.6250.0600.0800.111
Chamber center 1.8120.0540.0760.094
Publisher’s Note: MDPI stays neutral with regard to jurisdictional claims in published maps and institutional affiliations.

