Article

Interfacial Properties and Antioxidant Activity of Whey Protein-Phenolic Complexes: Effect of Phenolic Type and Concentration

1
Department of Food Industry, School of Agricultural Technology and Food Industry, Walailak University, Nakhon Si Thammarat 80160, Thailand
2
Department of Biotechnology, College of Biomedical and Health Science, Nanotechnology Research Center, Konkuk University, Chungju 27478, Korea
*
Author to whom correspondence should be addressed.
Appl. Sci. 2022, 12(6), 2916; https://doi.org/10.3390/app12062916
Submission received: 16 February 2022 / Revised: 11 March 2022 / Accepted: 11 March 2022 / Published: 12 March 2022
(This article belongs to the Topic Applied Sciences in Functional Foods)

Abstract

:
Whey protein is a common food additive for enhancing product stability and texture, while phenolics are considered food antioxidants. As a consequence, combining whey protein with phenolics is an effective way to improve protein functionality while also maintaining polyphenol bioactivity. Herein, the functional properties and antioxidant activity of whey protein modified with various types and concentrations of oxidized phenolic compounds, including gallic acid (OGA), ferulic acid (OFA), and tannic acid (OTA), were studied. In general, the modified whey protein had a decrease in free amino content, but an increase in total phenolic content. Whey protein modified with 5% OTA showed the highest total phenolic content and the lowest free amino content. Modification of whey protein with OTA and OGA resulted in a loss of surface hydrophobicity in contrast to whey protein modified with OFA. However, no significant difference in surface activity including foam and emulsion properties in the whey protein with/without modification was observed. The modified whey protein had an increase in antioxidant activity when compared with that of the control.

1. Introduction

Whey protein is a by-product of cheese and casein manufacture, and it serves as an ingredient widely used in the food and drink industry due to its valuable nutritional and bioactive characteristic, and multiple functional properties such as solubility, viscosity, and emulsifying and foaming properties [1,2]. Currently, there is a growing demand to improve functional properties of natural food ingredients to have a variety of functions for food and drink application. Whey protein has been studied to enhance or alter its functional properties applications by various methods such as physical, enzymatic, and chemical techniques [3]. The modification of protein by conjugate and polymerization with phytochemical compounds has received attention recently because it can improve the functional properties of protein and improve human health [4].
Plant phenolics are phytochemical compounds with one or more aromatic rings containing a hydroxyl substituent, which can be found in plant origins such as fruits and vegetables [5]. Phenolic compounds can interact with proteins by covalent and non-covalent interactions. However, covalent interaction appears to play a crucial role in protein-phenolic interaction, which is used to enhance the functional properties of proteins [4]. Such an interaction affects the functional properties of proteins, such as emulsion formation [6], gelling properties [7] and antioxidant activity [5]. Due to cross-linking and complex formation, the conformation of proteins is changed and the exposure of some additional hydrophobic regions previously buried takes place [4,5,6,8]. Moreover, the increase in phenolic groups in modified protein can increase hydrophilicity and antioxidant activity [9].
Therefore, the interaction of whey protein with plant phenolic compounds is an interesting method that could possibly lead to an increase in the functional properties of the resulting whey protein. However, there is limited information on the modification of whey protein with phenolic compounds. The objective of this study was to investigate the effects of whey protein modified with phenolic compounds including gallic acid, ferulic acid, and tannic acid with different sizes and numbers of hydroxyl groups (Figure 1) on the characteristics and functional properties of the modified whey protein.

2. Materials and Methods
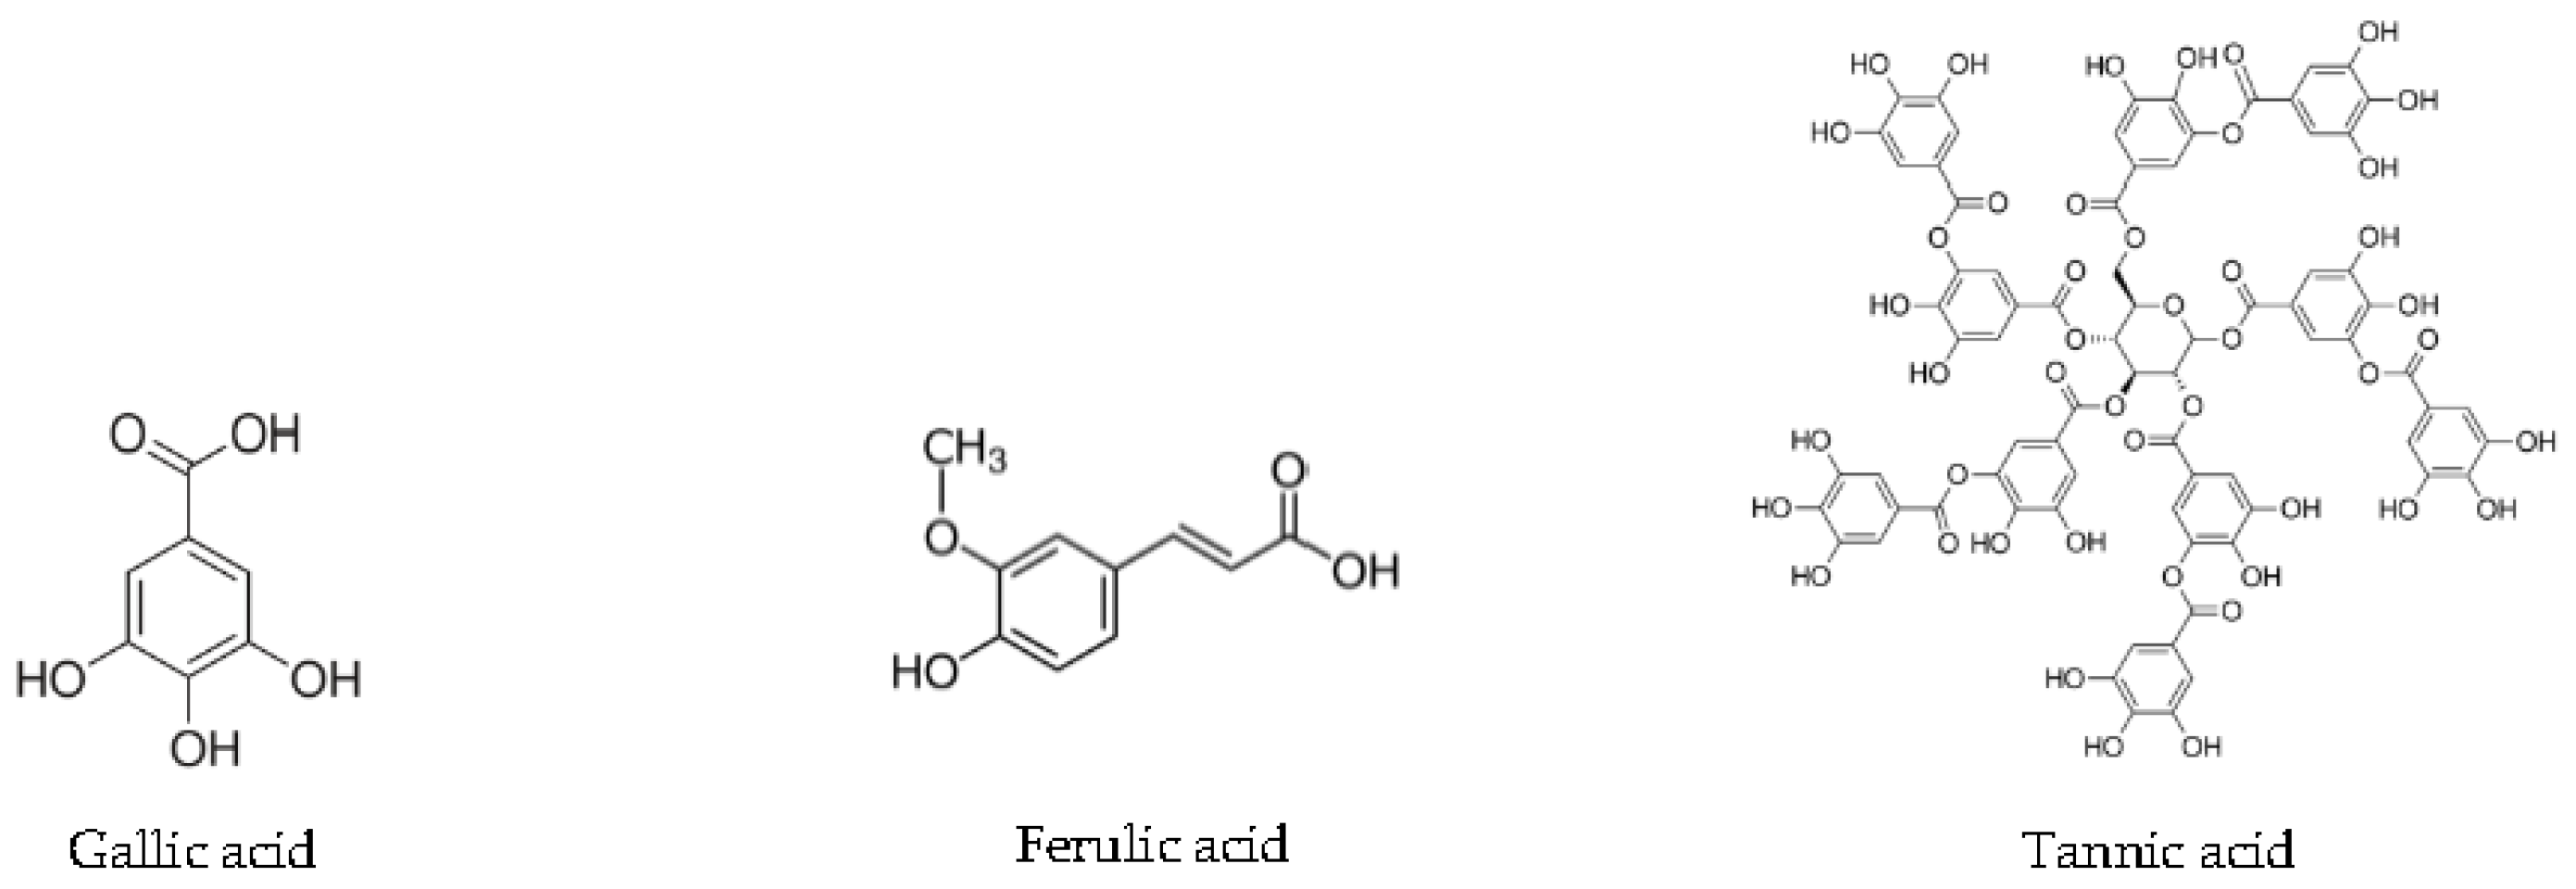
2.1. Chemicals

Whey protein concentrate (WPC) with 82.1% protein, 5.7% fat, 7.7% ash, and 4.5% moisture was purchased from I.P.S. International Co., Ltd. (Bangkok, Thailand). Gallic acid (MW 170.12 g/mol), ferulic acid (MW 194.18 g/mol), tannic acid (MW 1701.19 g/mol), 1,1-diphenyl-2-picrylhydrazyl (DPPH), 2,2′-azinobis(3-ethylbenzothiazoline-6-sulphonic acid) (ABTS), and 2,4,6-tripyridyl-triazine (TPTZ) were purchased from Sigma Chemical Co. (St. Louis, MO, USA). Sodium dodecyl sulfate (SDS) was purchased from Bio-Rad Laboratories (Hercules, CA, USA). Folin–Ciocalteu’s phenol reagent, hydrochloric acid, sodium hydroxide, and 2-thiobarbituric acid (TBA) were purchased from Merck (Darmstadt, Germany). All of the chemicals used were of analytical quality.

2.2. Preparation of Whey Protein Modified with Oxidized Phenolic Compounds

Phenolic compounds including gallic acid (OGA), ferulic acid (OFA), and tannic acid (OTA) were dissolved in distilled water at a concentration of 1% w/w, followed by pH adjustment to 9 using 1 M NaOH. Solutions were continuously stirred at room temperature (RT, 27–29 °C) for 1 h with free exposure to air to convert the phenolic compounds into oxidized form. A 75-mL whey protein solution (2% protein) was mixed with each oxidized phenolic compound solution at concentrations of 0.5, 1.0, 2.5, and 5.0%, based on protein content. Final volume was adjusted to 90 mL by distilled water to obtain a final concentration of 1.5% protein. The mixture solutions were stirred continuously at RT for 3 h. Thereafter, the mixture solutions were dialyzed (MW cut-off = 14,000 Da) at RT for 24 h against 20 volumes of water to remove residual phenolic compound. The control was carried out in the same way without phenolic compound. All samples were dried with a freeze dryer and stored at −20 °C.

2.3. Determination of Free Amino Group Content

Free amino group content was determined according to the method of Benjakul and Morrissey [10]. The sample solution (125 μL) was added with 2.0 mL of 0.2125 M phosphate buffer (pH 8.2) and 1.0 mL of 0.01% TNBS solution. The mixture solution was mixed thoroughly and incubated at 50 °C for 30 min in the dark in a temperature-controlled water bath (Model W350, Memmert, Schwabach, Germany). Two mL of 0.1 M sodium sulfite was added to stop the reaction. After cooling down to RT for 15 min, the absorbance was measured at 420 nm using a spectrophotometer (UV-160, Shimadzu, Kyoto, Japan), and free amino content was reported in terms of L-leucine.

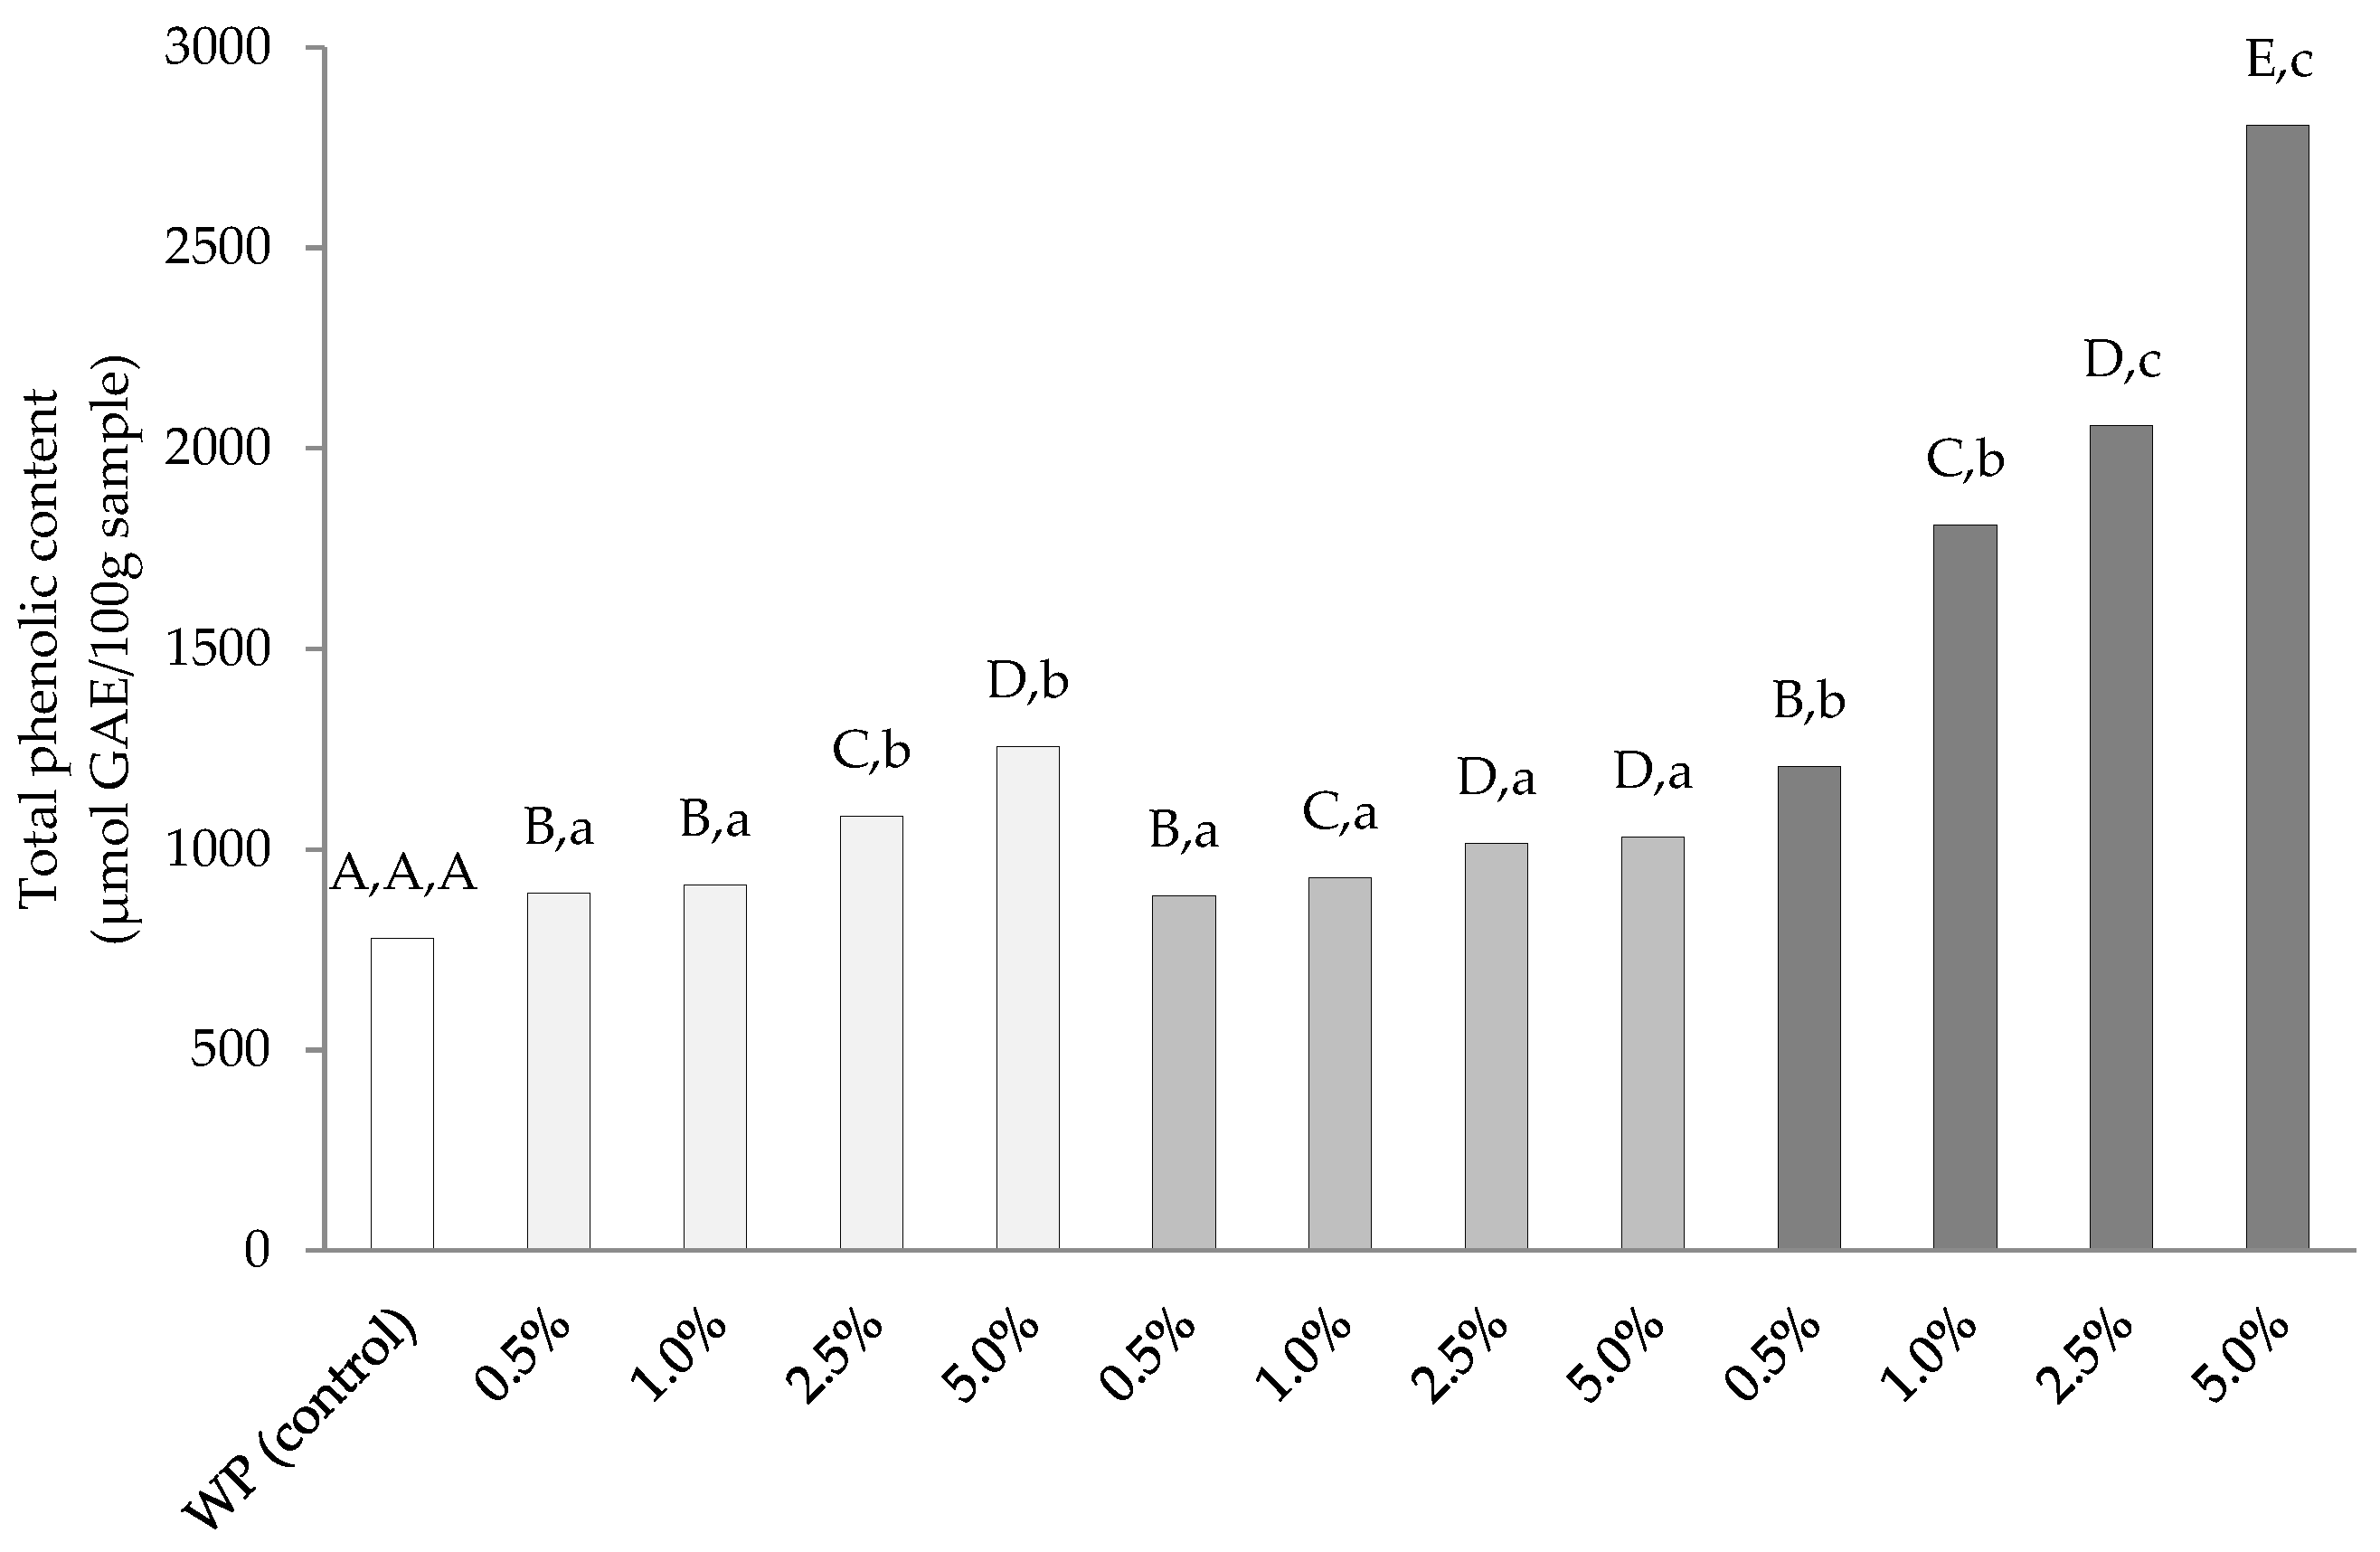
2.4. Determination of Total Phenolic Content

The total phenolic content of the samples was analyzed using a Folin–Ciocalteu reagent as described by Slinkard and Singleton [11]. Gallic acid was used as a standard, due to number of hydroxyl groups, and results were reported as mol gallic acid equivalent (GAE)/g dry weight (DW) basis.

2.5. Determination of Surface Hydrophobicity

Surface hydrophobicity (S0ANS) of the samples was determined according to the method of Benjakul et al. [12] using 1-anilinonaphthalene-8-sulphonic acid (ANS) as a probe. The initial slope of the plot of average fluorescence intensity versus protein concentration was referred to as S0ANS.

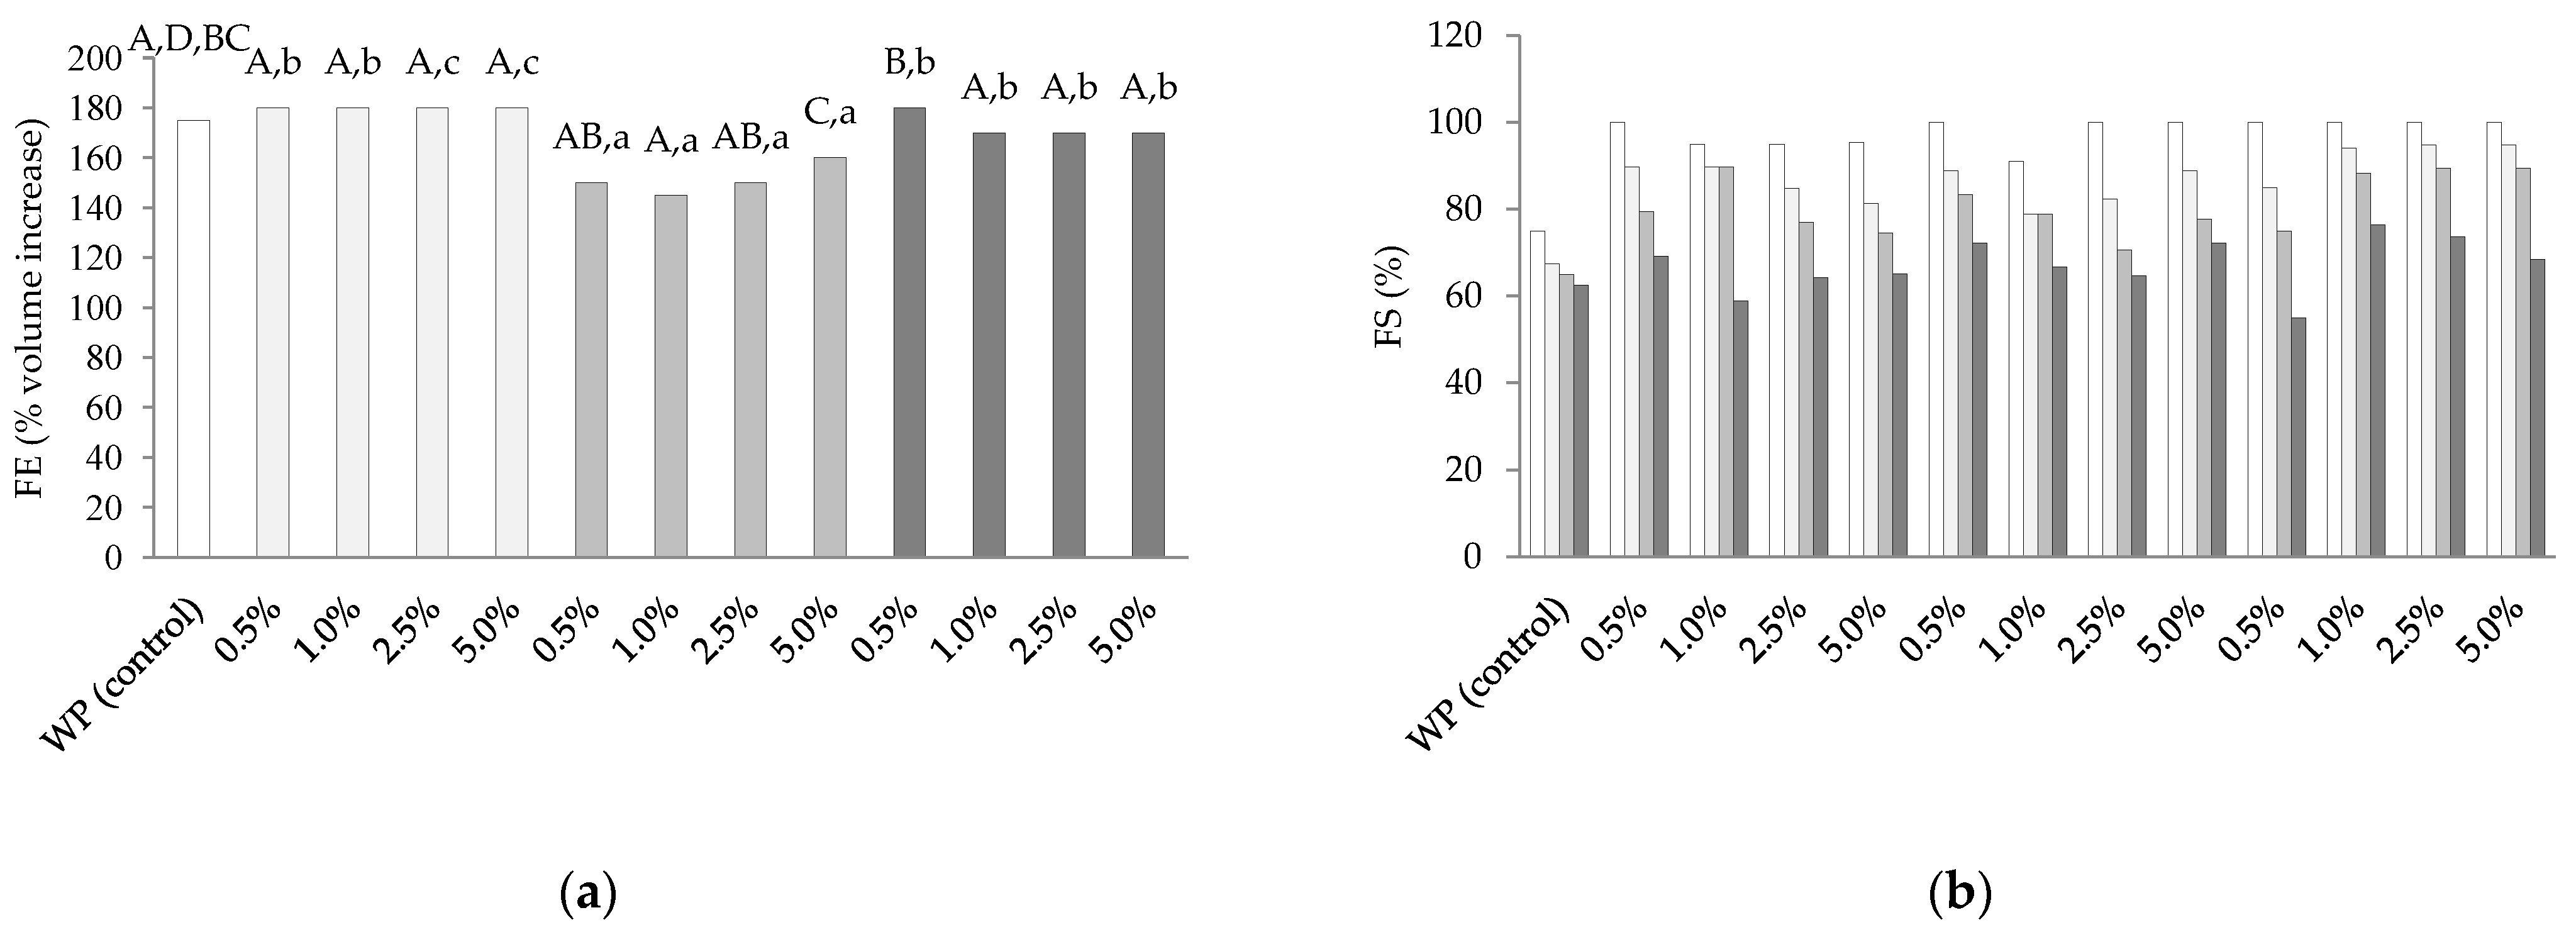
2.6. Determination of Foam Properties

Foam properties of the samples including foam expansion (FE) and foam stability (FS) were determined according to the method of Shahidi et al. [13]. Here, 20 mL of sample solutions at 0.1% (w/v) in 100 mL cylinders were homogenized using a homogenizer at 16,000 rpm for 1 min at 25 ± 1 °C. The samples were allowed to stand for 1, 5, 10, and 30 min. Foam expansion was calculated and reported as percentage of volume increase after homogenization at 0 min according to the following equation.
FE% = (A − B)/B × 100
where A is the volume (mL) after whipping and B is the volume (mL) before whipping. Foam stability was calculated and expressed as the volume of foam remaining after 1, 5, 10, and 30 min.

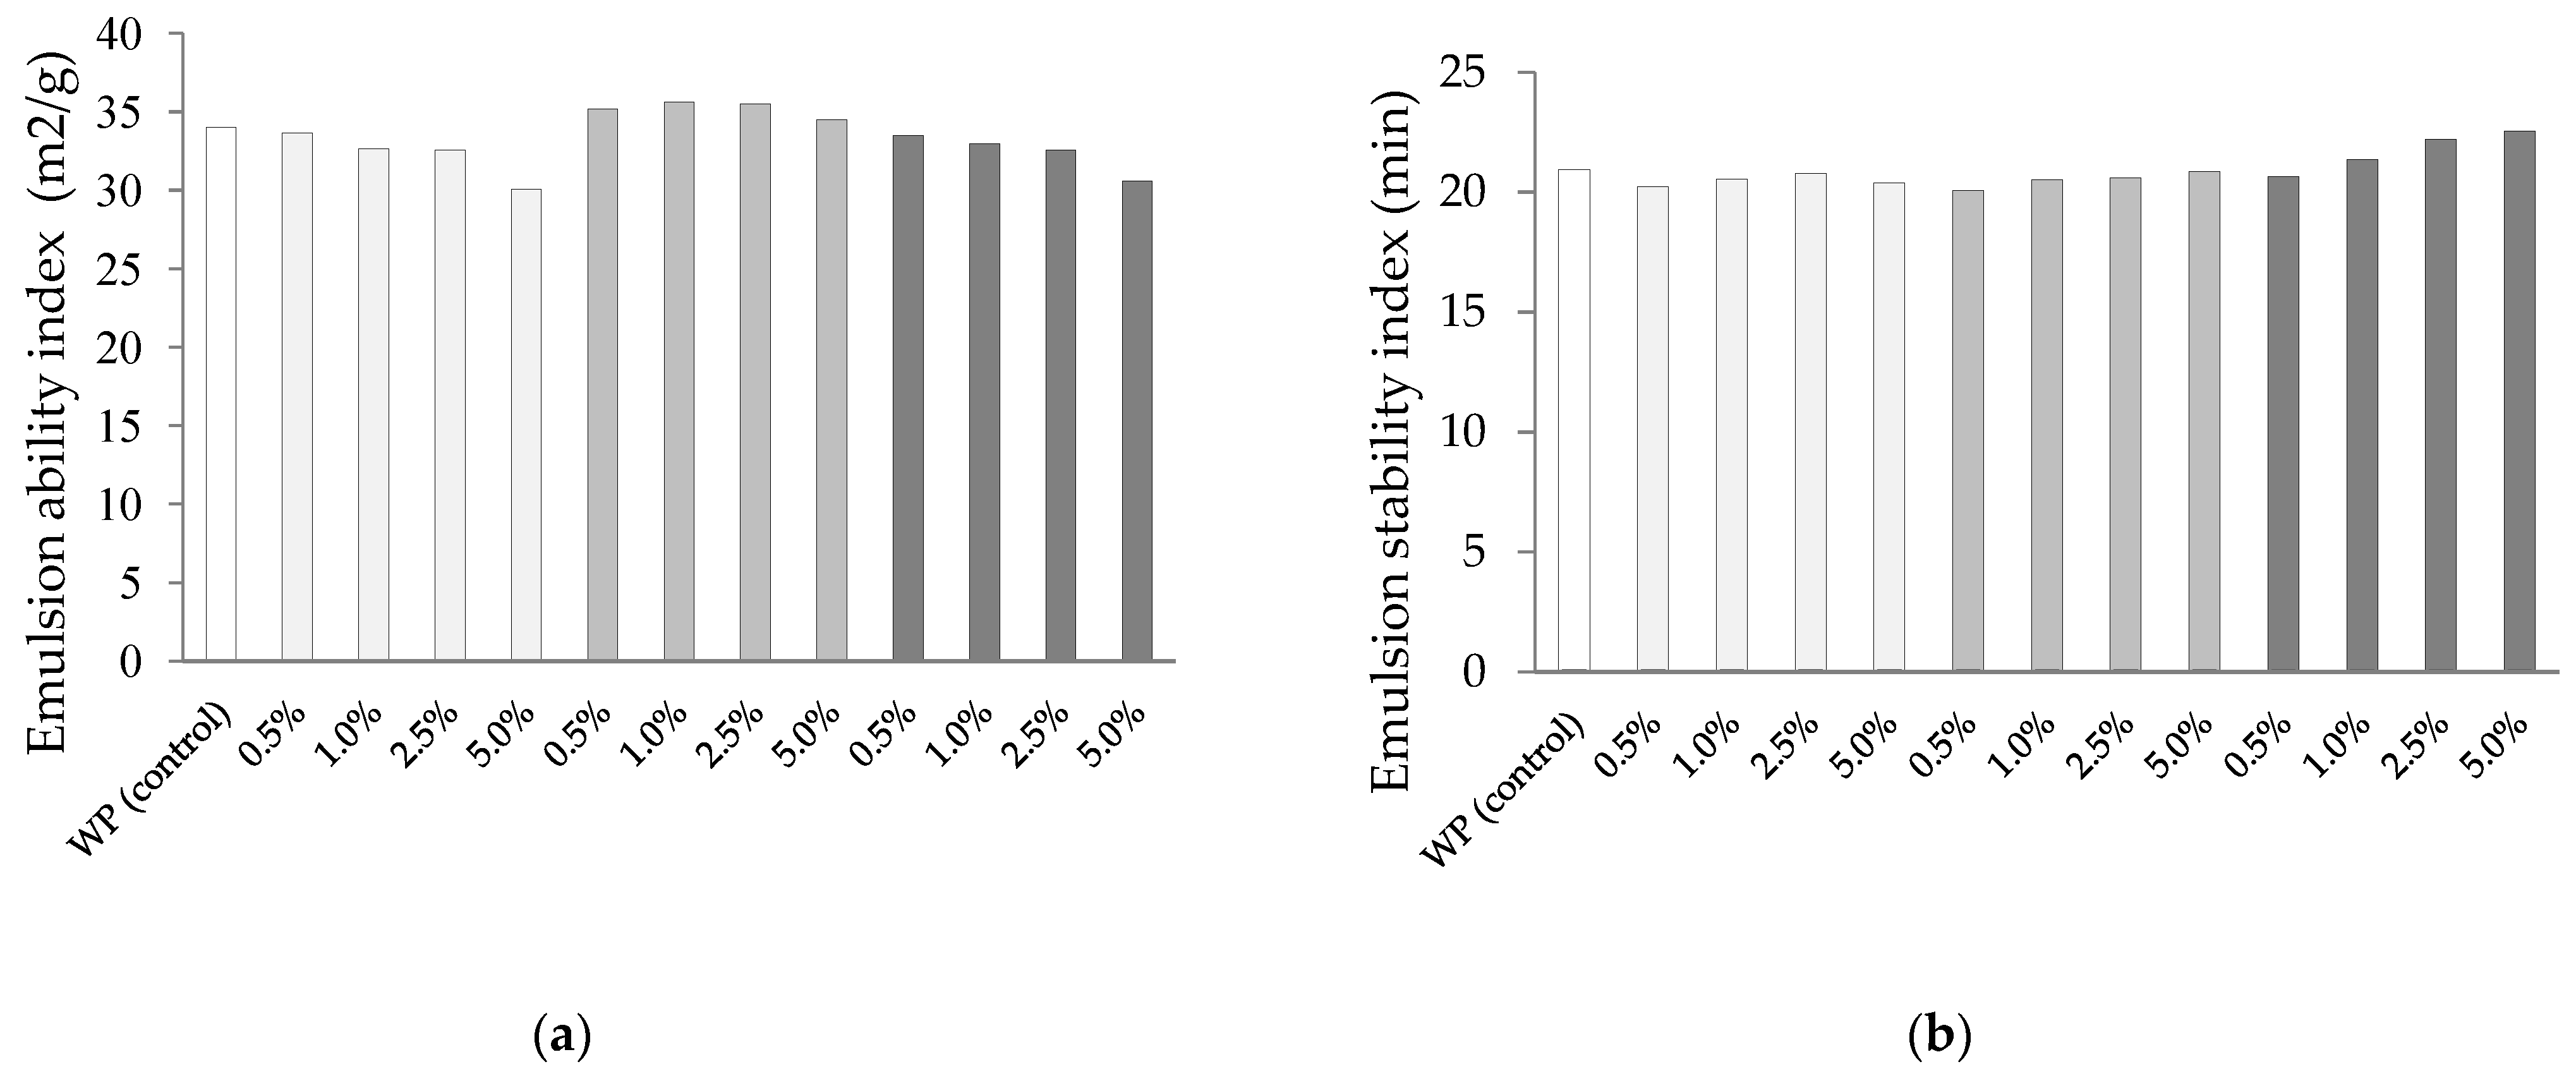
2.7. Determination of Emulsion Properties

The emulsion properties of the samples including emulsifying activity index (EAI) and emulsion stability index (ESI) were determined as described by Pearce and Kinsella [14]. Soybean oil (2 mL) and sample solution (1% w/v, 6 mL) were homogenized at a speed of 20,000 rpm for 1 min. Emulsions were pipetted out at 0 and 10 min and 50-fold diluted with SDS solution (0.1% w/v). The mixture was mixed for 10 s and the absorbance was measured at 500 nm. EAI and ESI were estimated by the following formulas:
EAI (m2/g) = (2 × 2.303 A)DF/lϕC
ESI (min) = A0 × Δt/ΔA
where A = absorbance at 500 nm, DF = dilution factor (100), l = path length (cm), ϕ = oil volume fraction (0.25), C = protein concentration in aqueous phase (mg/mL), ΔA = A0 − A10, and Δt = 10 min.

2.8. Determination of Antioxidative Activities

DPPH radical scavenging activity was determined according to the method of Binsan et al. [15]. The activity was recorded as μmol ferulic acid equivalent (FAE)/mg protein. ABTS radical scavenging activity was determined using the method of Re et al. [16]. The activity was reported as μmol FAE/mg protein and calculated by the following formula:
%Inhibition = [(A734 control − A734 test sample)/A734 control] × 100
Ferric reducing antioxidant power (FRAP) was determined by the Benzie and Strain’s approach [17]. FRAP was reported as μmol FE/mg protein.

2.9. Statistical Analysis

The results obtained were analyzed using SPSS statistical software version 13.0 (SPSS Inc., Chicago, IL, USA) and differences between means were evaluated by Duncan’s multiple range test. All results were reported as mean ± standard deviation (n = 3). Values of p < 0.05 were considered statistically significant.

3. Results and Discussion

Whey protein modified with gallic acid, ferulic acid, and tannic acid in oxidized form at different concentration of 0.5, 1.0, 2.5, and 5.0% based on protein content were investigate their characteristic and functional properties as follow.

3.1. Free Amino Group Content

The free amino group contents of the whey protein modified with oxidized phenolic compounds are shown in Figure 2. The free amino group content of the unmodified whey protein (the control) was 564.87 μmol L-leucine/100 g sample, whereas the modified whey protein exhibited lower free amino contents than that of the control (p > 0.05). This indicated that the electrophilic quinone oxidized form of phenolic compounds might have interacted with nucleophilic amino groups and led to the loss of the free amino group content. This result is in agreement with Ali [5], who reported that rosmarinic acid, quercetin, and chlorogenic acid oxidized to quinone radicals can interact with nucleophilic proteins or any amino acids (e.g., lysine, cysteine, and tryptophan) residues of whey protein by covalent interaction, resulting in a loss in free amino group, thiol groups, and tryptophan content of the modified whey protein. The rate of loss in the free amino group of the whey protein was governed by the type and concentration of oxidized phenolic compounds employed.
A decrease in the free amino group content was observed in all samples modified with oxidized phenolic compounds, especially at higher levels of oxidized phenolic compounds (p < 0.05). The free amino group of the whey protein modified with 5% OTA was 366.70 μmol L-leucine/100 g sample, whereas that of the whey protein modified with 5% OFA and 5% OGA was 418.41 and 421.34 μmol L-leucine/100 g sample, respectively. At the same concentration of oxidized phenolic compounds used, OTA showed more reactivity with the free amino group than OGA and OFA, as evidenced by the greatest decrease in the free amino group content of the resulting modified whey protein (p < 0.05), whereas whey protein modified with OGA and OFA had similar decreases in the free amino group content. The higher reactivity of OTA may be due to the large number of phenolic rings in its structure, which support interaction with the free amino group of whey protein more effectively; in contrast, OGA and OFA contained only one phenolic ring. This is in agreement with Dubeau et al. [18], who reported that polyphenolics with larger molecular weights and more hydroxyl groups (offering more than one site of interaction) were more likely to have better protein binding affinity.

3.2. Total Phenolic Content

The total phenolic contents of the modified and unmodified whey protein are shown in Figure 3. Generally, the control whey protein had a total phenolic content of 778 µmol GAE/100 g sample. The total phenolic content observed in unmodified whey protein might be due to the presence of tyrosine, tryptophan, cysteine, histidine, and asparagine, which can reduce the Folin–Ciocalteu reagent [19]. After modification of the whey protein with oxidized phenolic compounds, the total phenolic content of all modified whey proteins was greater than the control (p > 0.05). This result is associated with the incorporation of oxidized phenolic compounds into the whey protein molecule. Aewsiri et al. [9] reported that the modification of gelatin with oxidized phenolic compounds could induce the formation of a gelatin-phenolic complex, in which the obtained gelatin still had the reducing activity of the hydroxyl group, resulting in an increase in the total phenolic content of the modified gelatin [9].
Change in the total phenolic content of the modified whey protein are associated with the type and concentration of oxidized phenolic compounds. At the same concentration used, the whey protein modified with OTA showed the highest total phenolic content, followed by the proteins modified by OGA and OFA. The total phenolic contents of the whey proteins modified with 5% OTA, OGA, and OFA were 2806, 1256, and 1031 µmol GAE/100 g sample, respectively. This might be because OTA could integrate with the whey protein more effectively than OGA and OFA, as evidenced by the lower free amino content of the resulting whey protein, as well as OTA exhibiting a higher reducing power than OGA and OFA because of a higher abundance of hydroxyl groups. For the whey proteins modified with OGA and OFA, the whey protein modified with OGA showed a higher total phenolic content than the whey protein modified with OFA, although OFA showed a higher interaction with the whey protein, as evidenced by the lower free amino group content of the modified whey protein. This result might be because gallic acid had more hydroxyl groups on the aromatic benzene ring than ferulic acid, resulting in a higher total phenolic content in the whey protein modified with OGA.

3.3. Surface Hydrophobicity

The surface hydrophobicity of the whey protein with and without modification with oxidized phenolic compounds is shown in Table 1. Changes in the surface hydrophobicity of the modified whey protein occurred when compared with the control. This was possibly due to the difference of change in the structure and functional groups of the whey protein after modification. Interaction between the oxidized phenolic compounds and whey protein could change the protein conformation and the exposure of hydrophobic groups, resulting in a change in surface hydrophobicity of the whey protein [20]. The whey protein modified with OTA and OGA had decreased surface hydrophobicity with increasing concentrations of compounds used (p < 0.05). Rawel et al. [21] reported that the surface hydrophobicity of soy protein decreased when reacted with phenolic compounds. Kroll et al. [22] reported that the covalent attachment of the phenolic compound to proteins caused the blocking of hydrophilic groups such as amino and thiol groups. Incorporation of gallic acid and tannic acid with high hydroxyl and carboxyl group content into the whey protein led to an increase in hydrophilicity of the modified whey protein. When the increase rate of the hydrophilic group was higher than that of hydrophobic group, the whey protein modified with OTA and OGA showed a decrease in surface hydrophobicity.
However, the whey protein modified with OFA showed different results. The modification of the whey protein with OFA led to a change in surface hydrophobicity, depending on the OFA concentration used. The whey protein modified with 0.5–2.5% OFA had higher surface hydrophobicity than the control, whereas the whey protein modified with 5% OFA had similar surface hydrophobicity to the control. This might be associated with the degree of increase in the hydrophilic group on the whey protein attached with ferulic acid compared with the loss in the hydrophilic group (such as amino or thiol groups) of the whey protein during interaction. At an OFA concentration of 0.5–2.5%, the loss in the hydrophilic group of the whey protein from interaction with OFA was probably higher than the increase in the hydrophilic group on the whey protein attached with ferulic acid, leading to an increase in surface hydrophobicity. However, as the concentration of OFA was increased to 5%, the increase in the hydrophilic group on the whey protein attached with ferulic acid on the surface was probably higher than the loss in the hydrophilic group of the whey protein from interaction, resulting in a decrease in surface hydrophobicity of the resulting whey protein.

3.4. Foam Properties

Foam properties of the whey protein after modification by using oxidized phenolic compound are shown in Figure 4. Interaction between the whey protein and different oxidized phenolic compounds affected the foam properties of the modified whey protein. For foam expansion (FE) (Figure 4a), the whey protein modified with OFA and 1.0–5.0% OTA had poorer FE than the control whey protein (p < 0.05), whereas no difference in FE of the whey protein modified with OGA and 0.5% OTA was observed when compared with the control (p < 0.05). Protein foaming ability is corelated to water solubility and ability to form film at the air-water interface. Generally, proteins that adsorb quickly at the newly formed air-liquid interface during bubbling and undergo molecular rearrangement at the interface have superior foaming ability to proteins that adsorb slowly and resist molecular rearrangement at the interface [23]. Therefore, a decrease in FE of the whey protein modified with OFA and 1.0–5.0% OTA caused a loss in its water solubility. The whey protein modified with OFA had higher surface hydrophobicity, but protein solubility and dispersion in water were still necessary for foam forming. The presence of excess surface hydrophobicity in the whey protein modified with OFA might have caused a loss in foaming ability. Similarly, Bandyopadhyay et al. [24] revealed that incorporation of nonpolar polyphenols to protein increased surface hydrophobicity, but also reduced water solubility. For the whey protein modified with OTA, the foaming ability of the resulting whey protein decreased with increasing concentrations of OTA. Tannic acid with large molecules and high hydroxyl group content can increase the hydrophilicity of the modified whey protein or lead to protein precipitation. The interaction between polyphenol and protein may induce cross-linking of the protein, resulting in decreased water solubility [25]. The whey protein modified with OTA was not able to effectively disperse to the air-water interface.
For foam stability (Figure 4b), the whey protein modified with oxidized phenolic compounds had increased foam stability when compared with the unmodified whey protein. Foam stability of the modified whey protein increased with an increase of the oxidized phenolic compounds used. At the same level of the phenolic compound used, the whey protein modified with OTA had the highest foam stability, followed by whey protein modified with OGA and OFA, respectively. This result might be associated with the cross-linking of the whey protein after modification. Modified whey protein can form cohesive film at the air-water interface, which resists deformation effectively. Davis and Foegeding [26] reported that polymerized whey protein had a higher viscosity when compared with native whey protein, resulting in more stabilized foams due to the effective slowdown of drainage. Kuan et al. [27] reported that polymerization can improve the foaming properties of egg white protein due to the cross-linked structure enhancing the unfolding of the protein during foam forming and generating more elastic foam networks at the air-water interfaces.

3.5. Emulsion Properties

The emulsifying activity index (EAI) and emulsion stability index (ESI) of the modified and unmodified whey proteins are shown in Figure 5. Modification of the whey protein with oxidized phenolic compounds most likely affected the emulsion properties of the resulting whey protein, depending on the type and concentration of oxidized phenolic compounds used. For whey protein modified with OFA, concentrations of 0.5 and 1.0% OFA increased both the EAI and ESI of modified whey protein when compared with the control (p < 0.05). This result may be related to the increase of the surface hydrophobicity of the modified whey protein with OFA. Kato and Nakai [28] reported that protein surface hydrophobicity is often related with improved surface activity, resulting in a decrease in interfacial tension and an increase in emulsifying activity. The whey protein modified with OFA with higher surface hydrophobicity could localize and accumulate at the interface between oil and water, reducing the interfacial tension during homogenization and preventing flocculation and coalescence during storage, resulting in an increase of EAI and ESI. However, whey protein modified with OFA at concentrations of OFA above 1.0% decreased both EAI and ESI. The presence of excess surface hydrophobicity in the whey protein modified with OFA at a high level might cause a loss in water solubility, affecting the surface activity of the modified whey protein and resulting in a loss in emulsion properties as well as foam properties.
For the whey protein modified with OGA and OTA, the resulting whey protein had lower EAI and ESI when compared with the control (p > 0.05), especially for the whey protein modified with OTA. EAI and ESI of the whey protein modified with OGA and OTA decreased with the use of increasing concentrations. This result might be due to a decrease in surface hydrophobicity of the resulting whey protein causing a loss in ability of whey protein to localize to the oil-water interface, resulting in a decrease of both EAI and ESI. Moreover, interactions of OTA with the whey protein might lead to protein aggregation. Therefore, the whey protein may not move to the oil-water interface and form a film around the oil droplet effectively.

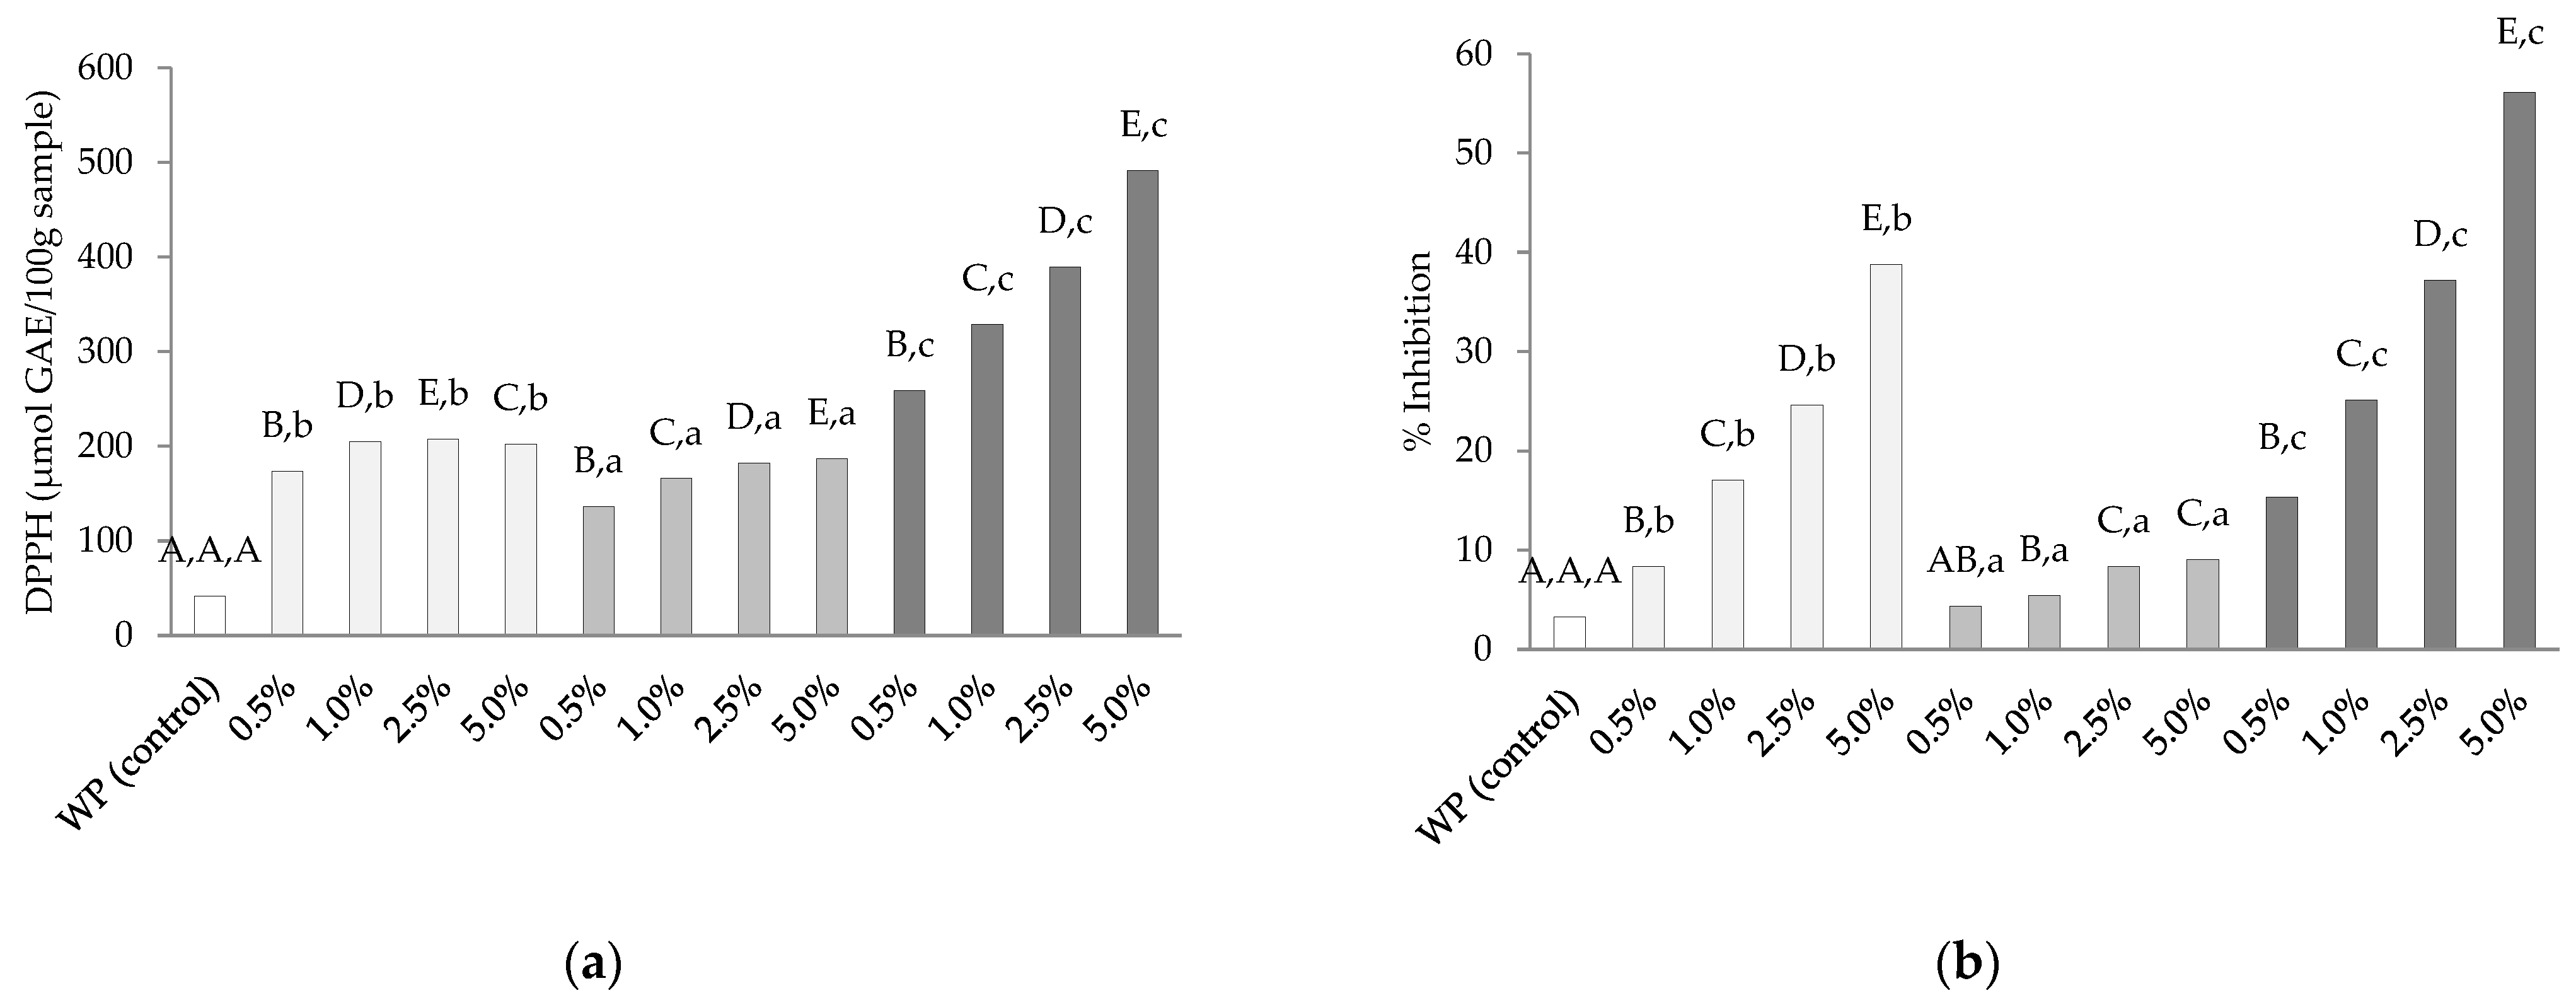
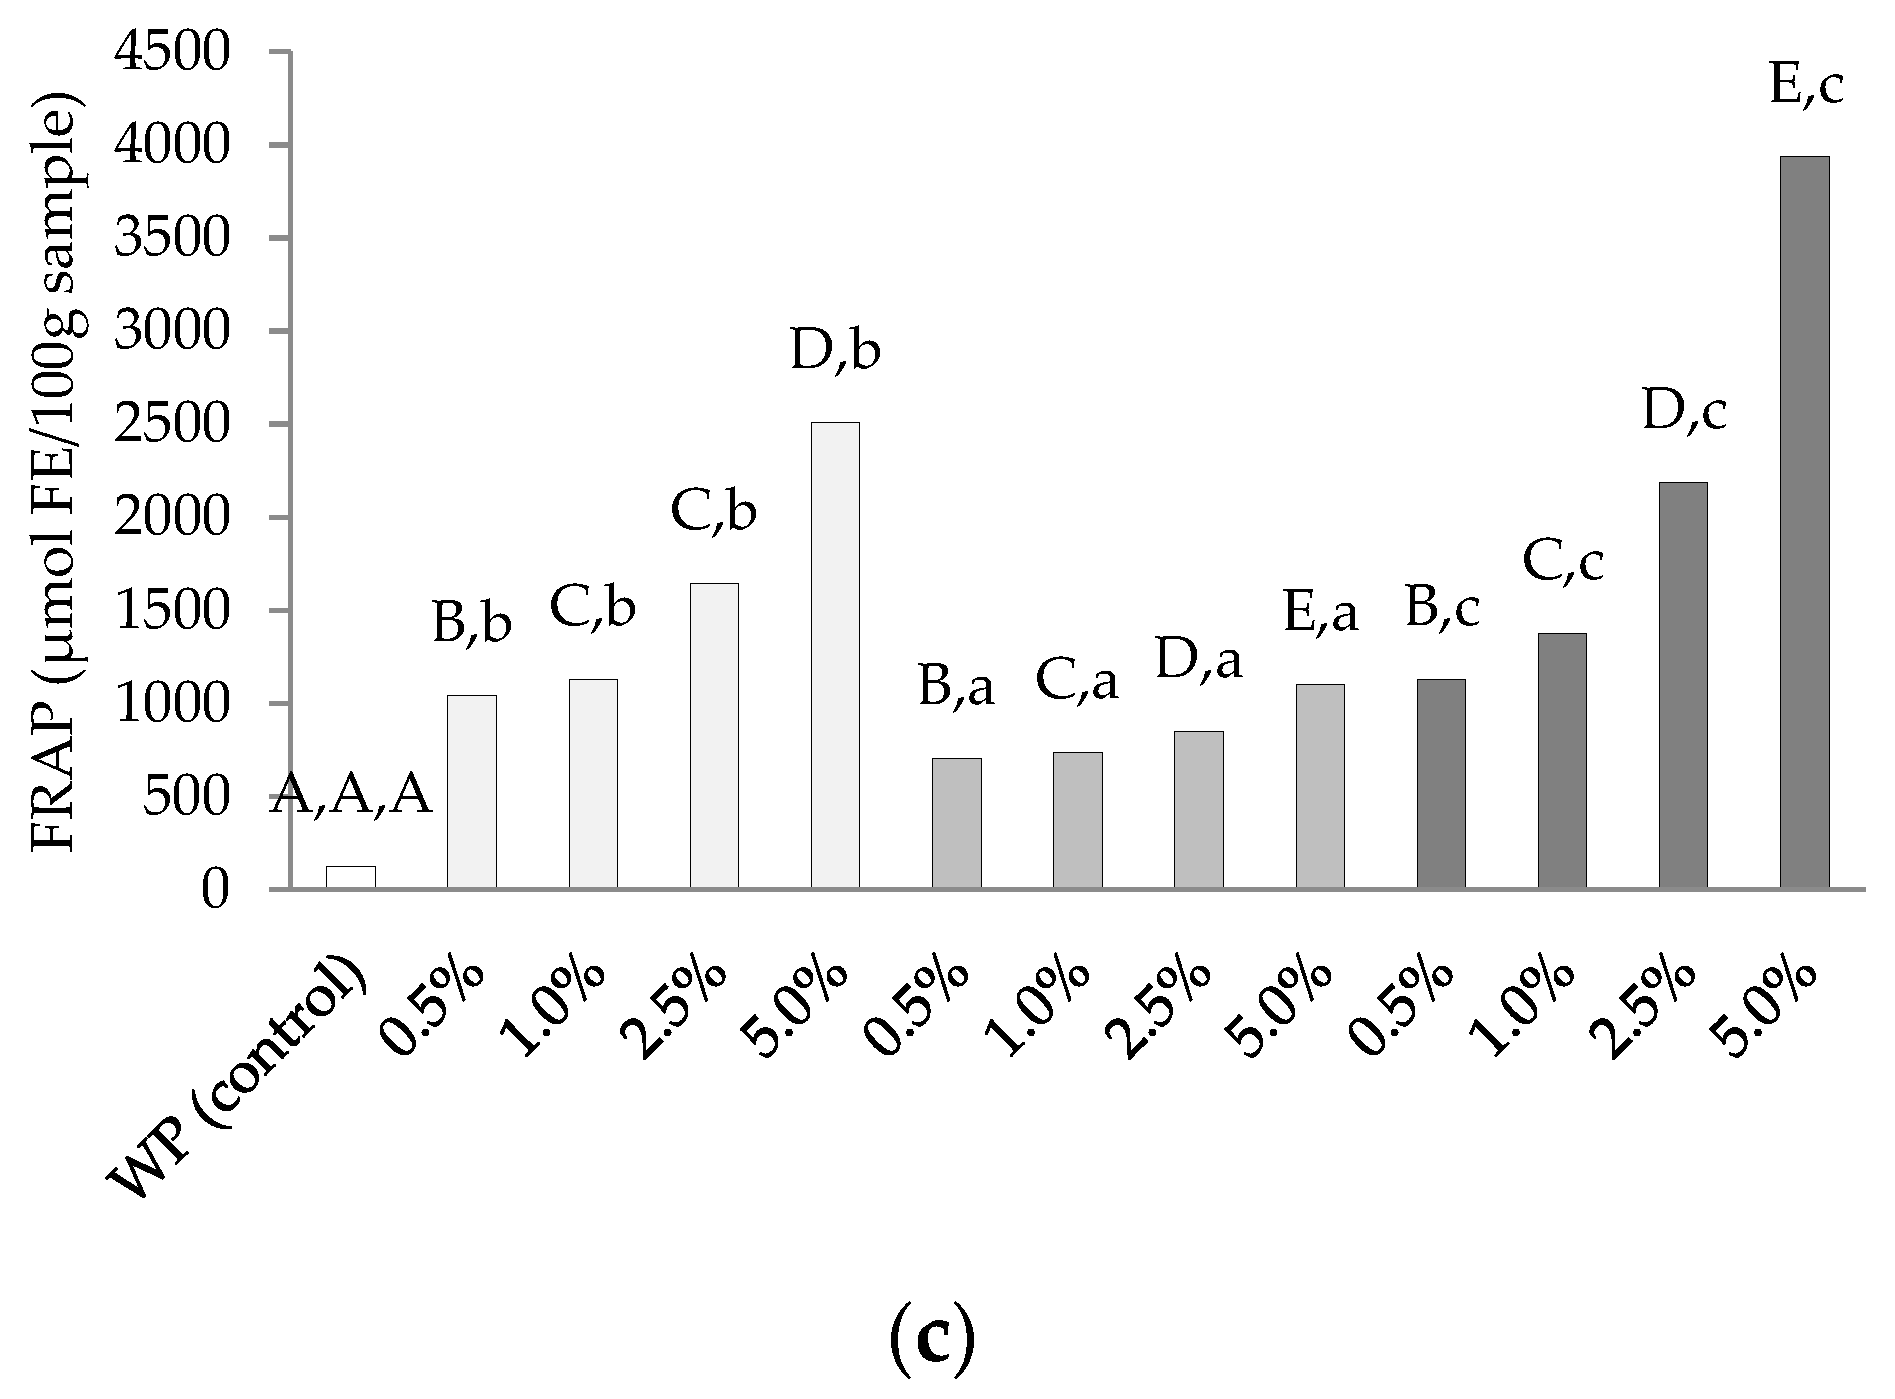
3.6. Antioxidative Activities

Antioxidative activities by different assays (DPPH, ABTS, and FRAP) of the whey protein modified with phenolic compounds were shown in Figure 6. The DPPH value of the control whey protein was 41.7 μmol FAE/mg protein (Figure 6a). These values of the whey protein increased after modification with oxidized phenolic compounds at concentrations of 0.5–5.0% as follows: 4.2–5.0 fold for OGA, 3.3–4.5 fold for OFA, and 6.2–12.0 fold for OTA when compared to the control whey protein. This result showed that the phenolic compounds were incorporated into the whey protein and contributed to the increase in the antioxidative activity of the modified whey protein. The capacity antioxidants to scavenge DPPH radicals was assumed to be related to their hydrogen-donating properties [15]. An increase of DPPH radical scavenging activity was found in all modified whey proteins, especially when higher levels of oxidized phenolic compounds were used (p < 0.05). The highest activity was observed in whey protein modified with 5% oxidized phenolic compound (p < 0.05). This result is in agreement with several studies that have reported that protein-polyphenol complexes have a greater antioxidative activity than the original proteins [29,30,31]. Ali [2] revealed that the antioxidative activity of whey protein increased after modification by covalent attachment of chlorogenic acid, rosmarinic acid, and quercetin. At the same concentrations used, the highest activities of all antioxidative parameters were found in the whey protein modified with OTA (p < 0.05), followed by the whey protein modified by OGA and OFA. These results were in agreement with an increase of the total phenolic content for each whey protein modified with different phenolic compounds. This revealed that the antioxidative activity of whey protein modified with phenolic compounds is dependent on the type and concentration of phenolic compounds. The whey protein modified with tannic acid possessed a greater number of phenolic groups and had higher antioxidative activity when compared with the other samples.
For ABTS assay (Figure 6b), similar results were found when compared with DPPH. ABTS of the control whey protein was 3.26% inhibition, and increased by about 5.5–25.3 fold for OGA, 2.9–6.0 fold for OFA, and 10.0–37.3 fold for OTA after modification with concentrations of 0.5–5.0%. ABTS radical scavenging activity of whey proteins modified with OTA and OGA was higher than whey protein modified with OFA. ABTS assay is used to determine antioxidative activity, in which free radicals are quenched to form ABTS-radical complexes [16]. It indicated that the whey protein modified with OTA and OGA could quench the free radicals and end the radical chain reaction more effectively than the whey protein modified with OFA. Ferric-reducing antioxidant activity (FRAP) of the whey protein after modification with 0.5–5.0% of oxidized phenolic compounds (Figure 6c) was increased by about 8.5–20.4 fold for OGA, 5.7–9.0 fold for OFA, and 9.2–32.0 fold for OTA. FRAP of all modified whey protein was higher than that of unmodified whey protein (123 µmol FE/100 g sample). FRAP assay is used to measure the reducing capacity of ferric ion, and is related to radical scavenging capacity [32]. However, differences in the value of each assay were observed, resulting in different mechanical antioxidative activity, but the antioxidative activity result of each assay showed a similar pattern. This reconfirmed that the phenolic compounds introduced to the whey protein contributed to an increase in the antioxidative activities of the whey protein. The maximum activities of all antioxidative parameters were found in the whey protein modified with OTA (p < 0.05), followed by the whey proteins modified by OGA and OFA, respectively.

4. Conclusions

Modification of whey protein with oxidized phenolic compounds led to an interaction between the whey protein and phenolic compounds, as evidenced by a loss of the free amino content and an increase in the total phenolic content of the modified whey protein. The modified whey protein had slightly lower interfacial activities, which results in foam and emulsion activities, but had greater antioxidative activities, depending on the type and concentration of oxidized phenolic compounds employed. The whey protein modified with OTA showed the highest antioxidative activities (DPPH, ABTS, and FRAP), whereas interfacial activities were slightly decreased. Therefore, whey protein modified with 5% OTA could be used as a food ingredient possessing antioxidative activity in food products.

Author Contributions

Conceptualization, H.T. and T.A.; Formal analysis, H.T.; Investigation, H.T., N.M. and P.G.; Methodology, H.T. and T.A.; Resources, N.M. and T.A.; Supervision, H.T., N.M., P.G. and T.A.; Validation, T.A.; Visualization, T.A.; Writing—original draft, H.T.; Writing—review and editing, H.T., N.M., P.G. and T.A. All authors have read and agreed to the published version of the manuscript.

Funding

This research was partially supported by the Walailak University fund, Thailand through the contact No.WU-COE-65-05.

Institutional Review Board Statement

Not applicable.

Informed Consent Statement

Not applicable.

Data Availability Statement

Not applicable.

Acknowledgments

We would like to thank the Center of Excellence in Innovation of Essential Oil, Walailak University, Nakohn Si Thammarat, Thailand 80160, for technical support and David C. Chang for English language and editing support.

Conflicts of Interest

The authors declare no conflict of interest.

References

  1. Zhao, C.; Chen, N.; Ashaolu, T.J. Whey proteins and peptides in health-promoting functions—A review. Int. Dairy J. 2021, 126, 105269. [Google Scholar] [CrossRef]
  2. Minj, S.; Anand, S. Whey proteins and its derivatives; Bioactivity, functionality, and current application. Dairy 2020, 1, 233–258. [Google Scholar] [CrossRef]
  3. Huppertz, T.; Vasiljevic, T.; Zisu, B.; Deeth, H. Novel processing technologies: Effects on whey protein structure and func-tionality. In Whey Proteins; Academic Press: London, UK, 2019; pp. 281–334. [Google Scholar]
  4. Quan, T.H.; Benjakul, S.; Sae-Leaw, T.; Balange, A.K.; Maqsood, S. Protein-polyphenol conjugates: Antioxidant property, functionalities and their applications. Trends Food Sci. Technol. 2019, 91, 507–517. [Google Scholar] [CrossRef]
  5. Ali, M. Chemical, structural and functional properties of whey proteins covalently modified with phytochemical compounds. J. Food Meas. Charact. 2019, 13, 2970–2979. [Google Scholar] [CrossRef]
  6. Chen, Y.; Hu, J.; Yi, X.; Ding, B.; Sun, W.; Yan, F.; Wei, S.; Li, Z. Interactions and emulsifying properties of ovalbumin with tannic acid. LWT 2018, 95, 282–288. [Google Scholar] [CrossRef]
  7. Zhao, Y.; Sun, Z. Effects of gelatin-polyphenol and gelatin-genipin cross-linking on the structure of gelatin hydrogels. Int. J. Food Prop. 2017, 20, 2822–2832. [Google Scholar] [CrossRef]
  8. Tosif, M.M.; Najda, A.; Bains, A.; Krishna, T.C.; Chawla, P.; Dyduch-Siemińska, M.; Klepacka, J.; Kaushik, R. A comprehensive review on the interaction of milk protein concentrates with plant-based polyphenolics. Int. J. Mol. Sci. 2021, 22, 13548. [Google Scholar] [CrossRef]
  9. Aewsiri, T.; Benjakul, S.; Visessanguan, W.; Eun, J.B.; Wierenga, P.A.; Gruppen, H. Antioxidative activity and emulsifying properties of cuttlefish skin gelatin modified by oxidsed phenolic compounds. Food Chem. 2009, 117, 160–168. [Google Scholar] [CrossRef]
  10. Benjakul, S.; Morrissey, M. Protein hydrolysis from Pacific whiting solid wastes. J. Agric. Food Chem. 1997, 45, 3423–3430. [Google Scholar] [CrossRef]
  11. Slinkard, K.; Singleton, V.L. Total phenol analyses; automation and comparison with manual method. Am. J. Enol. Vitic. 1977, 28, 49–55. [Google Scholar]
  12. Benjakul, S.; Seymour, T.A.; Morrissey, M.T.; An, H. Physicochemical changes in Pacific whiting muscle proteins during iced storage. J. Food Sci. 1997, 62, 729–733. [Google Scholar] [CrossRef]
  13. Shahidi, F.; Han, X.Q.; Synowiechi, J. Production and characteristics of protein hydrolysates from capelin (Mallotus villosus). Food Chem. 1995, 53, 285–293. [Google Scholar] [CrossRef]
  14. Pearce, K.N.; Kinsella, J.E. Emulsifying properties of proteins; evaluation of a turbidimetric technique. J. Agric. Food Chem. 1978, 26, 716–723. [Google Scholar] [CrossRef]
  15. Binsan, W.; Benjakul, S.; Visessanguan, W.; Roytrakul, S.; Tanaka, M.; Kishimura, H. Antioxidative activity of mungoong, an extract paste, from the cephalothorax of white shrimp (Litopenaeus vannamei). Food Chem. 2008, 106, 4185–4193. [Google Scholar] [CrossRef]
  16. Re, R.; Pellegrini, N.; Proteggente, A.; Pannala, A.; Yang, M.; Rice-Evans, C. Antioxidant activity applying an improved ABTS radical cation decolorization assay. Free Radic. Biol. Med. 1999, 26, 1231–1237. [Google Scholar] [CrossRef]
  17. Benzie, I.E.F.; Stain, J.J. The ferric reducing ability of plasma (FRAP) as a measure of “antioxidant power”: The FRAP assay, Anal. Biochem. 1996, 239, 70–76. [Google Scholar] [CrossRef] [PubMed] [Green Version]
  18. Dubeau, S.; Samson, G.; Tajmir-Riahi, H.A. Dual effect of milk on the antioxidant capacity of green, Darjeeling and English breakfast teas. Food Chem. 2010, 122, 539–545. [Google Scholar] [CrossRef]
  19. Lowry, Q.H.; Rosebrough, N.J.; Farr, L.A.; Randall, R.J. Protein measurement with the Folin phenol reagent. J. Biol. Chem. 1951, 193, 256–275. [Google Scholar] [CrossRef]
  20. Rohn, S.; Rawel, H.M.; Kroll, J. Reactions with phenolic substances can induce change in some physico-chemical properties and activities of bromelain-the consequences for supplementary food products. Int. J. Food Sci. Technol. 2005, 40, 771–782. [Google Scholar] [CrossRef]
  21. Rawel, H.M.; Czajka, D.; Rohn, S.; Kroll, J. Interactions of different phenolic acids and flavonoids with soy proteins. Int. J. Biol. Macromol. 2002, 30, 137–150. [Google Scholar] [CrossRef]
  22. Kroll, J.; Rawel, H.M.; Rohn, S. Reactions of plant phenolics with food proteins and enzymes under special consideration of covalent bonds. Food Sci. Technol. Res. 2003, 9, 205–218. [Google Scholar] [CrossRef] [Green Version]
  23. Damodaran, S. Protein-stabilized foams and emulsions. In Food Proteins and Their Application; Damodaran, S., Paraf, A., Eds.; Marcel Dekker: New York, NY, USA, 1997; pp. 57–110. [Google Scholar]
  24. Bandyopadhyay, P.; Ghosh, A.K.; Ghosh, C. Recent developments on polyphenol-protein interactions; effects in tea and coffee tate, antioxidant properties and the digestive system. Food Funct. 2012, 3, 592–605. [Google Scholar] [CrossRef] [PubMed]
  25. Ozdal, T.; Capanoglu, E.; Altay, F. A review on protein-phenolic interactions and associated changes. Food Res. Int. 2013, 51, 954–970. [Google Scholar] [CrossRef]
  26. Davis, J.P.; Foegeding, E.A. Foaming and interfacial properties of polymerized whey protein isolate. J. Food Sci. 2004, 69, C404–C410. [Google Scholar] [CrossRef]
  27. Kuan, Y.H.; Bhat, R.; Karim, A.A. Emulsifying and foaming properties of ultraviolet-irradiated egg white protein and sodium caseinate. J. Agric. Food Chem. 2011, 59, 4111–4118. [Google Scholar] [CrossRef] [PubMed]
  28. Kato, A.; Nakai, S. Hydrophobicity determined by a fluorescence probe method and its correlation with surface properties of proteins. Biochim. Biophys. Acta 1980, 624, 13–20. [Google Scholar] [CrossRef]
  29. Fan, Y.; Liu, Y.; Gao, L.; Zhang, Y.; Yi, J. Oxidative stability and in vitro digestion of menhaden oil emulsions with whey protein: Effects of EGCG conjugation and interfacial cross-linking. Food Chem. 2018, 265, 200–207. [Google Scholar] [CrossRef] [PubMed]
  30. Feng, J.; Cai, H.; Wang, H.; Li, C.; Liu, S. Improved oxidative stability of fish oil emulsion by grafted ovalbumin-catechin con-jugates. Food Chem. 2018, 241, 60–69. [Google Scholar] [CrossRef] [PubMed]
  31. Gu, L.; Peng, N.; Chang, C.; McClements, D.J.; Su, Y.; Yang, Y. Fabrication of surface-active antioxidant food biopolymers: Conjugation of catechin polymers to egg white protein. Food Biophys. 2017, 12, 198–210. [Google Scholar] [CrossRef]
  32. Moure, A.; Domínguez, H.; Parajó, J.C. Antioxidant properties of ultrafiltration-recovered soy protein fractions from industrial effluents and their hydrolysates. Process Biochem. 2006, 41, 447–456. [Google Scholar] [CrossRef]
Figure 1. Structures of gallic, ferulic, and tannic acids.
Applsci 12 02916 g001
Figure 2. Free amino group content of whey protein modified with different oxidized phenolic compounds at various concentrations.
Applsci 12 02916 g002
Figure 3. Total phenolic content of whey protein modified with different oxidized phenolic compounds at various concentrations. Different letters in the same concentration of oxidized phenolic compounds indicate significant differences. Different capital letters in the same type of oxidized phenolic compounds and control indicate significant differences.
Applsci 12 02916 g003
Figure 4. Foam expansion (a) and foam stability (b) at 1, 5, 10, and 30 min of whey protein modified with different oxidized phenolic compounds at various concentrations. Different letters in the same concentration of oxidized phenolic compounds indicate significant differences. Different capital letters in the same type of oxidized phenolic compounds and control indicate significant differences.
Applsci 12 02916 g004
Figure 5. Emulsifying activity index (a) and emulsion stability index (b) of whey protein modified with different oxidized phenolic compounds at various concentrations.
Applsci 12 02916 g005
Figure 6. Antioxidant activities (DPPH (a), ABTS (b), and FRAP (c)) of whey and whey modified with phenolic compounds (OGA, OFA, and OTA) at concentrations of 0.5, 1.0, 2.5, and 5.0% based on protein content. Different letters in the same concentration of oxidized phenolic compounds indicate significant differences. Different capital letters in the same type of oxidized phenolic compounds and control indicate significant differences.
Applsci 12 02916 g006aApplsci 12 02916 g006b
Table 1. Surface hydrophobicity of whey protein modified with different oxidized phenolic compounds at various concentrations.
Concentrations of
Oxidized Phenolic Compounds
ANS (S0)
WP-OGAWP-OFAWP-OTA
0 (control)1172.51172.51172.5
0.5905.81722.5845.0
0.1897.51730.0632.5
2.5540.01742.5578.3
5315.01197.5110.1
Publisher’s Note: MDPI stays neutral with regard to jurisdictional claims in published maps and institutional affiliations.

