1. Introduction
Personality has been recognized as a driver of decisions and behavior; it consists of singular characteristics on how individuals think, feel, and behave [
1]. Understanding personality provides a way to comprehend how the different traits of an individual merge as a unit, since personality is a mixture of traits and behavior that people have to cope with situations. Personality influences selections and decisions (e.g., movies, music, and books) [
2]. Personality guides the interactions among people, relationships, and the conditions around them. Personality has been shown to be related to any form of interaction. In addition, it has been shown to be useful in predicting job satisfaction, success in professional relationships, and even preference for different user interfaces [
3].
Previous research on user interfaces and personality has found more receptiveness and confidence in users when the interfaces take personality into account. When personality is predicted from the social media profile of users, applications can use it to personalize presentations and messages [
3].
Researchers have recognized that every person has a personality that usually remains consistent over time. Consequently, personality assessment can be used as an important measure. Various psychological models of personality have been proposed, such as the Five-factor model [
4], the psychoticism, extraversion, and neuroticism (PEN) model [
5], the Myers–Briggs type inventory [
4], and the dominance, influence, steadiness, and compliance (DISC) model [
6].
Typically, these models propose direct methods such as questionnaires to recognize personality. Conversely, linguistic analysis can be used to detect personality [
3,
7]. Linguistic analysis can produce useful patterns for establishing relationships between writing characteristics and personality. Researchers in natural language processing have proposed several methods of linguistic analysis to recognize personality, and machine learning has been one of the most investigated approaches.
Machine learning techniques are useful in the recognition of personality since they provide mechanisms to automatize processes that are based on a set of examples. Several proposals for personality recognition based on machine learning can be found in the literature [
8,
9]. Machine learning algorithms use computational methods to learn directly from data without relying on a predetermined equation as a model. The algorithms adaptively improve their performance as the number of instances available for learning increases [
10].
Several efforts in personality prediction from the linguistic analysis approach have been carried out. However, they have focused mostly on the English language and are based on the five-factor model. This model (also called big five model) has been used as a standard for applications that need personality modeling [
7].
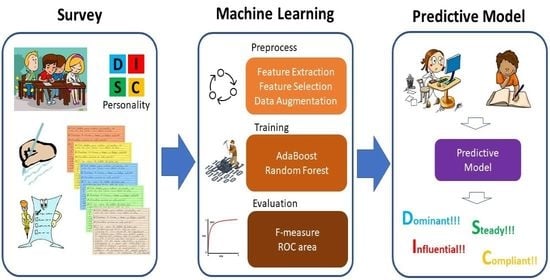
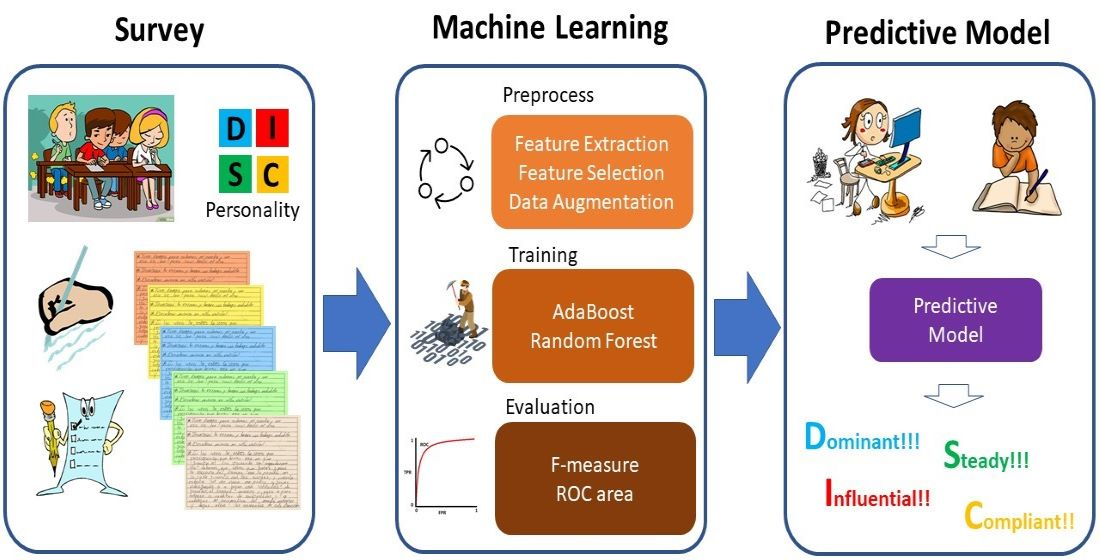
To contribute to the advancement and understanding of the relationship between personality and language, we have developed a predictive model for personality recognition based on the DISC personality model and a machine learning approach. We performed a personality survey with 120 participants. The participants were asked to complete a demographic form, fill in the DISC test, and handwrite a text on a general topic that they selected.
The model for personality prediction is based on a supervised machine learning approach for multiclass classification. We evaluated six of the most known classifiers: naive Bayes [
11], sequential minimal optimization (SMO) [
12], k-Nearest neighbors (kNN) [
13], AdaBoost [
14], J48 [
15], and random forest [
16]. We conducted preprocess tasks as feature extraction, feature selection and data augmentation to have nine versions of the dataset. We found AdaBoost [
14] and random forest [
16] had the best performance.
Figure 1 presents the overview of our approach.
This paper presents the construction of the predictive model for personality recognition.
Section 1 presents related work and background.
Section 2 describes the protocol for the personality survey.
Section 3 presents the machine learning approach for building the predictive model.
Section 4 presents the results of this research. Finally,
Section 5 discusses the results and outlines future work.
1.1. Related Work
Srinarong and Mongkolnavin [
17] developed a model based on machine learning techniques to recognize the personality of the customers of a call center. The model allows the call center to give them an appropriate response. This study is based on the MPI (Maudsley personality inventory) personality model. Audio files of conversational voice were collected from 92 voluntary participants who were instructed to make conversation in the simulated context. Logistic regression, LinearSVC, random forest, and artificial neural networks were used in the modeling process.
Automatic personality recognition based on Twitter in Bahasa Indonesia was proposed by Adi et al. [
18]. Tweets were manually annotated by experts in psychology using the big five model. In this study, stacking, gradient boosting, and stochastic gradient descent were evaluated.
A multi-label personality detection model based on neural networks, which combines emotional and semantic features was proposed by Ren et al. [
19]. This model relies on bidirectional encoder representation from transformers (BERT) to generate sentence-level embedding for text semantic extraction. A sentiment dictionary is used for text sentiment analysis to consider sentiment information. The performance of the model was evaluated on two public personality datasets for MBTI and big five.
A model for personality prediction from text posts of social network users was developed based on a hierarchical deep neural network by Xue et al. [
20]. The model predicts the big five personality by means of traditional regression algorithms and the combination of statistical linguistic features with deep semantic features from the text postings. This approach has achieved the lowest average prediction error of all of the approaches.
A model aiming to assist in recruiting and selecting appropriate personnel by knowing the personality of customers has also been developed by Sher et al. [
21]. The XGBoost classifier is used to predict the personality from input text based on the MBTI model. A publicly available benchmark dataset from Kaggle was used in the experiments.
1.2. The DISC Model of Personality
DISC stands for Dominance, Influence, Steadiness, and Compliance. They are the four dimensions of personality proposed by the model that represent the basic behavioral styles. The Dominance and Influence dimensions denote receptiveness and assertiveness. The Steadiness and Compliance dimensions denote control and openness. Personality falls within these four dimensions [
6,
22].
When a DISC profile shows a high Dominance factor, it is describing someone with an independent attitude and a motivation to succeed on their own terms. Dominant people have the willpower to work under pressure, and they are always ready to take on responsibility [
6,
22].
When Influence stands out as a major factor, it describes someone with a positive attitude to other people, and the confidence to demonstrate that attitude. People of this kind are comfortable in social situations and interact with others in an open and expressive way [
6,
22].
Steadiness is related to the natural pace of people and their reactions to change. This factor describes a reticent and careful person. Steady people usually respond to events rather than taking pro-active steps themselves. Steady people are consistent and reliable in their approach. Indeed, they prefer to operate in situations following established patterns and avoid unplanned developments. Therefore, people with high Steadiness tend to be quite resistant to change and will need time to adapt to new situations [
6,
22].
The Compliance dimension is related to organization, accuracy, and attitudes towards authority. An individual showing high Compliance is concerned with detail and practicality. The key characteristic of this dimension falls in attitudes towards authority. Compliant people are rule oriented. They are also interested in accuracy, structure, and understanding the ways things work [
6,
22].
The DISC personality test consists of 28 groups of four adjectives. To assess personality, individuals must choose the adjective that identifies them the most and the adjective that identifies them the least. Some examples of the adjective groups of the DISC test are shown in
Table 1.
The DISC model has been used widely in several fields such as education, health, industry, and management. For instance, Milne et al. [
23] conducted a study to identify the behavior styles of physiotherapy students and to determine if there is a relationship between students’ unique behavior patterns and their clinical placement grades. On the other hand, DISC personality has been considered to be a predictor for the improvement of manageability; Chigova et al. [
24] conducted a study to identify impact factors that improve the efficiency of structured interaction in enterprises and organizations.
2. Personality Survey to Gather Data
To obtain the ground-truth data, a personality survey was conducted. The objective of the survey was to gather data to relate writing characteristics and behavior with personality. These relationships are useful for constructing a text classification model. The proposed model for personality prediction is intended to be applied in the selection process of candidates for postgraduate programs. Therefore, the study focused on knowing the personality of undergraduate and graduate students. One hundred and twenty students participated in the survey (49 women and 71 men). The participants ranged in age between 20 and 30 years old.
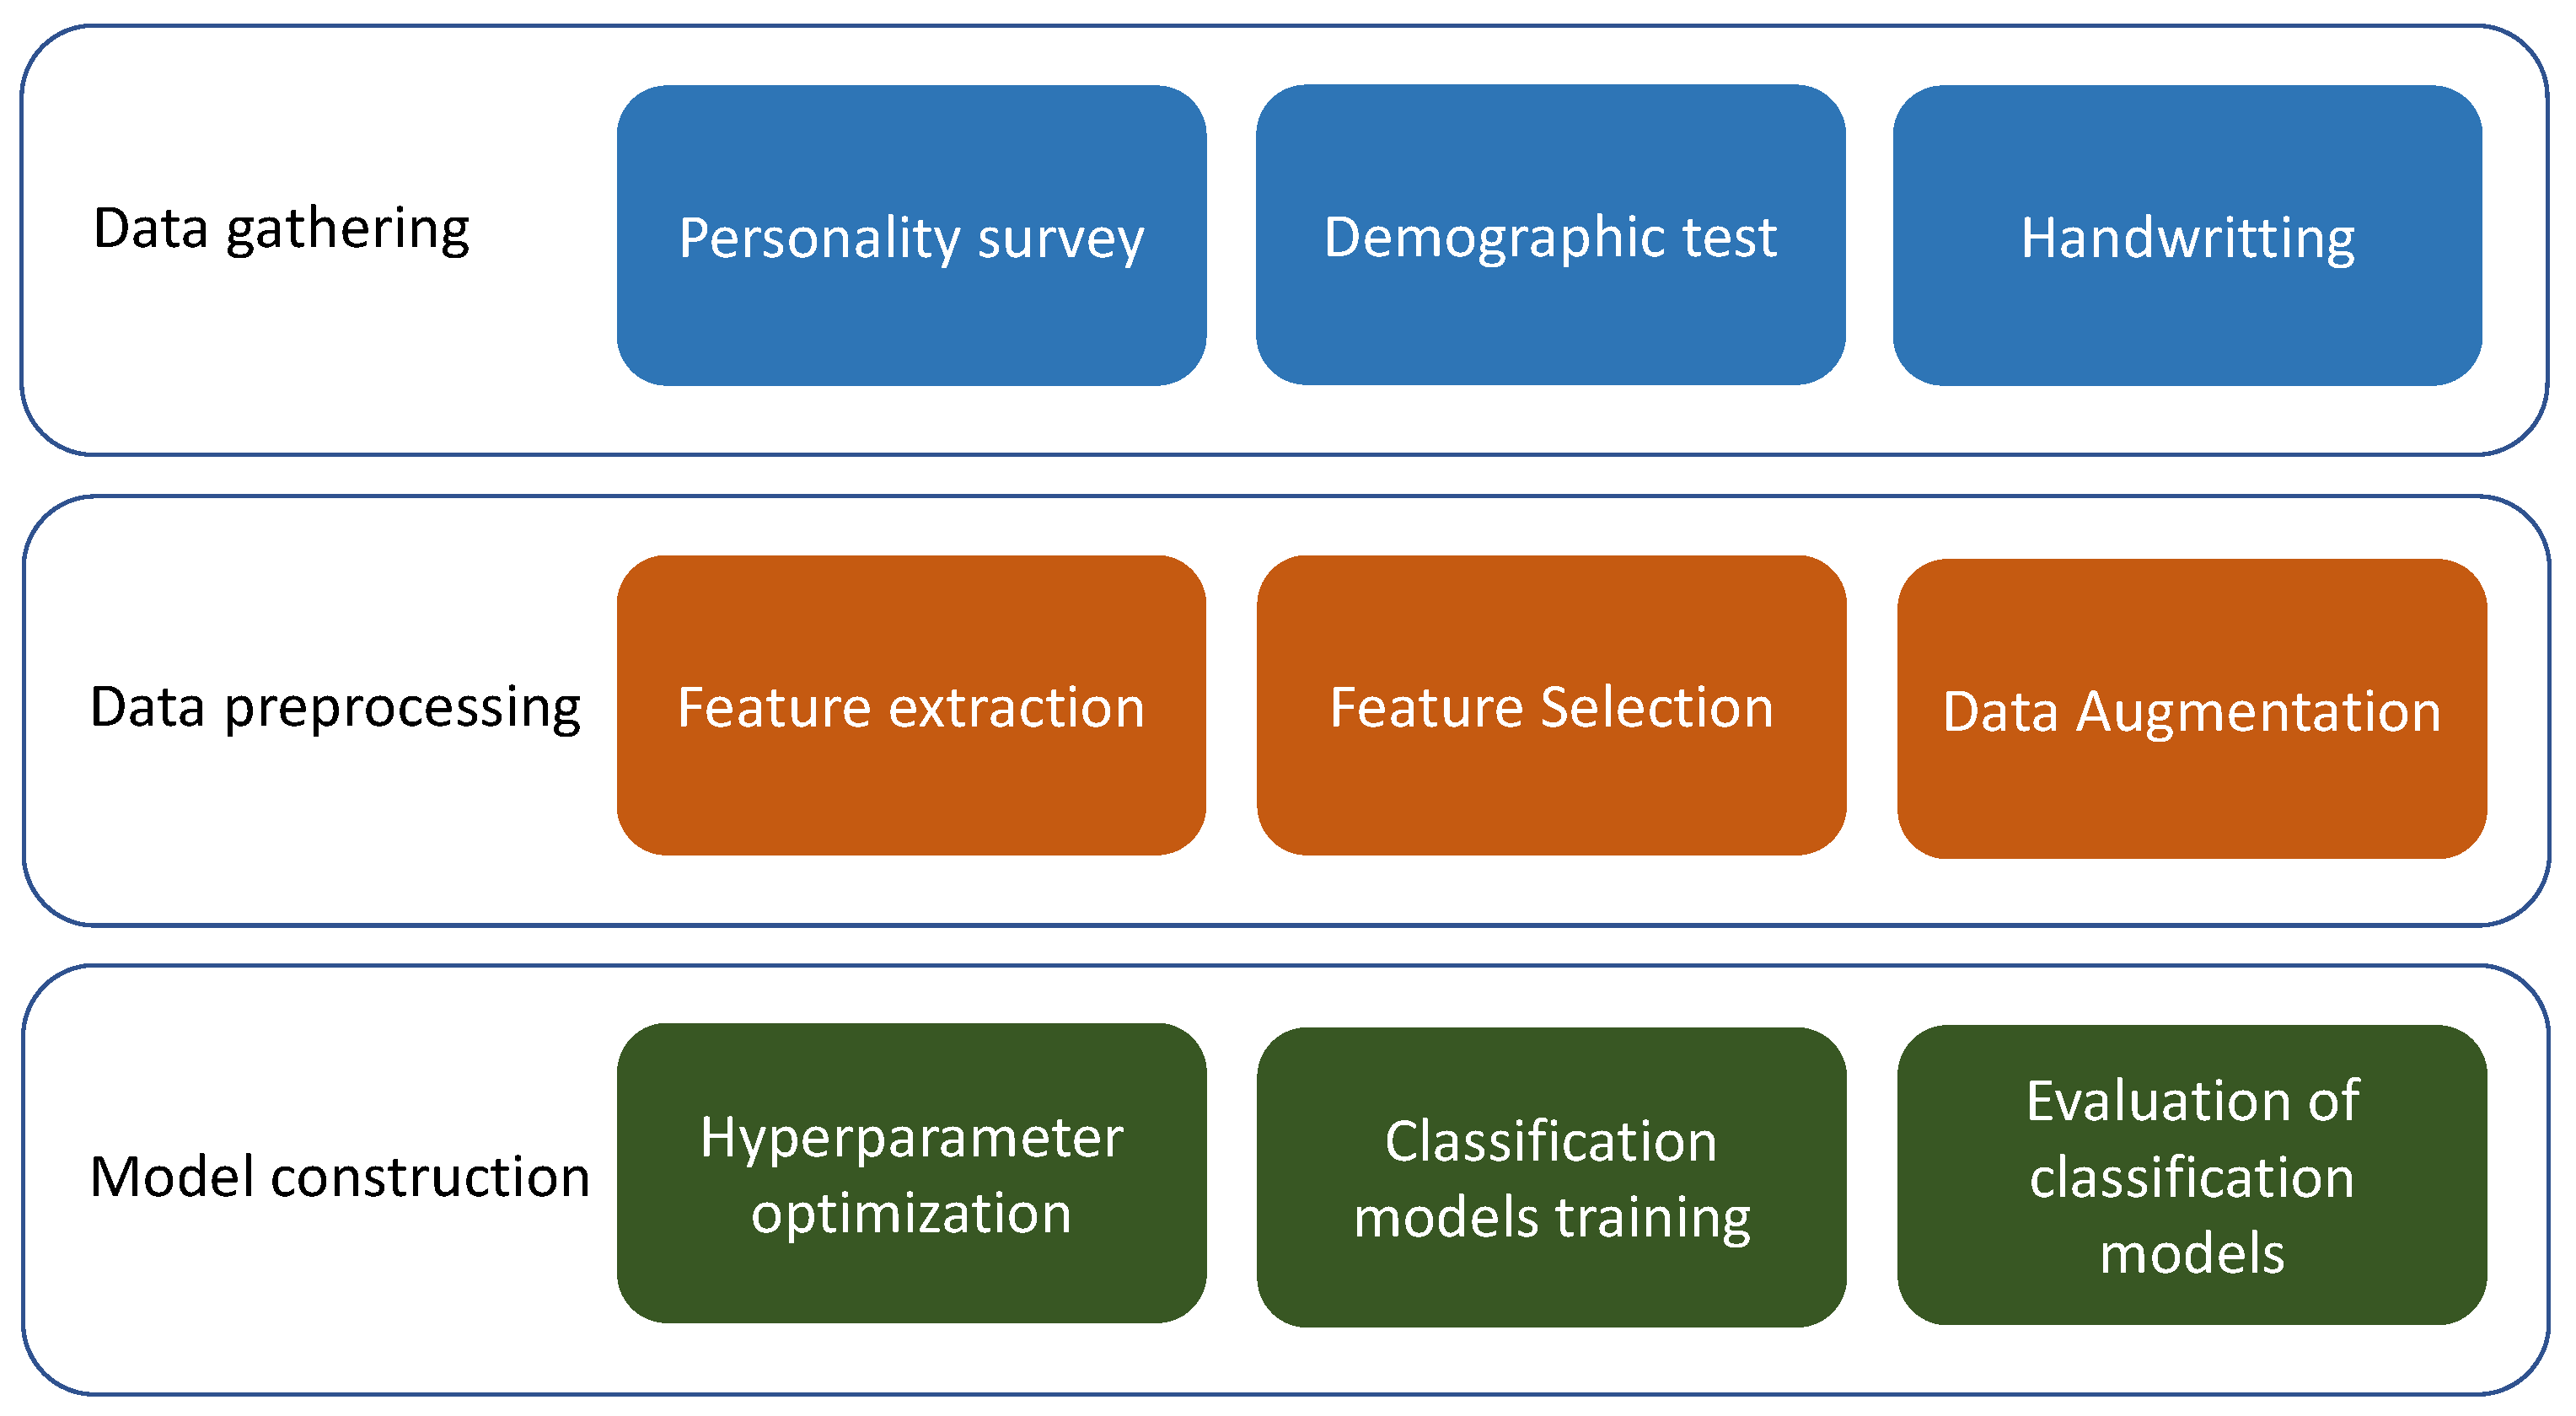
The survey consisted of three parts: (i) a general information questionnaire; (ii) the DISC personality test; and (iii) handwritten paragraphs. Each participant was contacted individually and was told about the objectives and the procedure of the survey. If they agreed to participate, the three parts of the survey were explained in detail. Additional help was provided if the participants required it, but most of the participants did not need help or explanations during the survey. The participants took between 20 and 30 min to complete the survey. The entire survey was in Spanish.
The first part asked the participants for personal data: age range, gender, schooling, occupation, marital status, preferred social networks, and number of online friends. In the second part, the participants filled in the personality test [
5,
6]. To complete the DISC personality test, the participants had to do self-inspection and to conclude to what extent the adjectives in the test represented them, as explained in
Section 1.2. In the third part of the survey, the participants handwrote some paragraphs on any topic. Suggested topics were provided. These included goals, hobbies, what they did the day before, and so on.
The study showed that Facebook and Twitter are the preferred social networks of the participants, with 105 participants and 15 participants, respectively. The average number of friends of the participants on the social networks was 531 people.
Table 2 shows the answers and the results of the personality test for four participants in the survey.
The results of the personality survey are shown in
Table 3. The most frequent personality dimension was Steadiness (62 people), the second most common dimension was Influence (26 people), the next factor was Compliance (18 people), and the least common factor was Dominance (14 people).
It is noteworthy that the DISC personality model was selected since it is a clean model that only requires a short time for training and assessing answers. The results can be obtained relatively easily, and the model can provide adequate information regardless of whether the people conducting the survey are knowledgeable in psychology [
22].
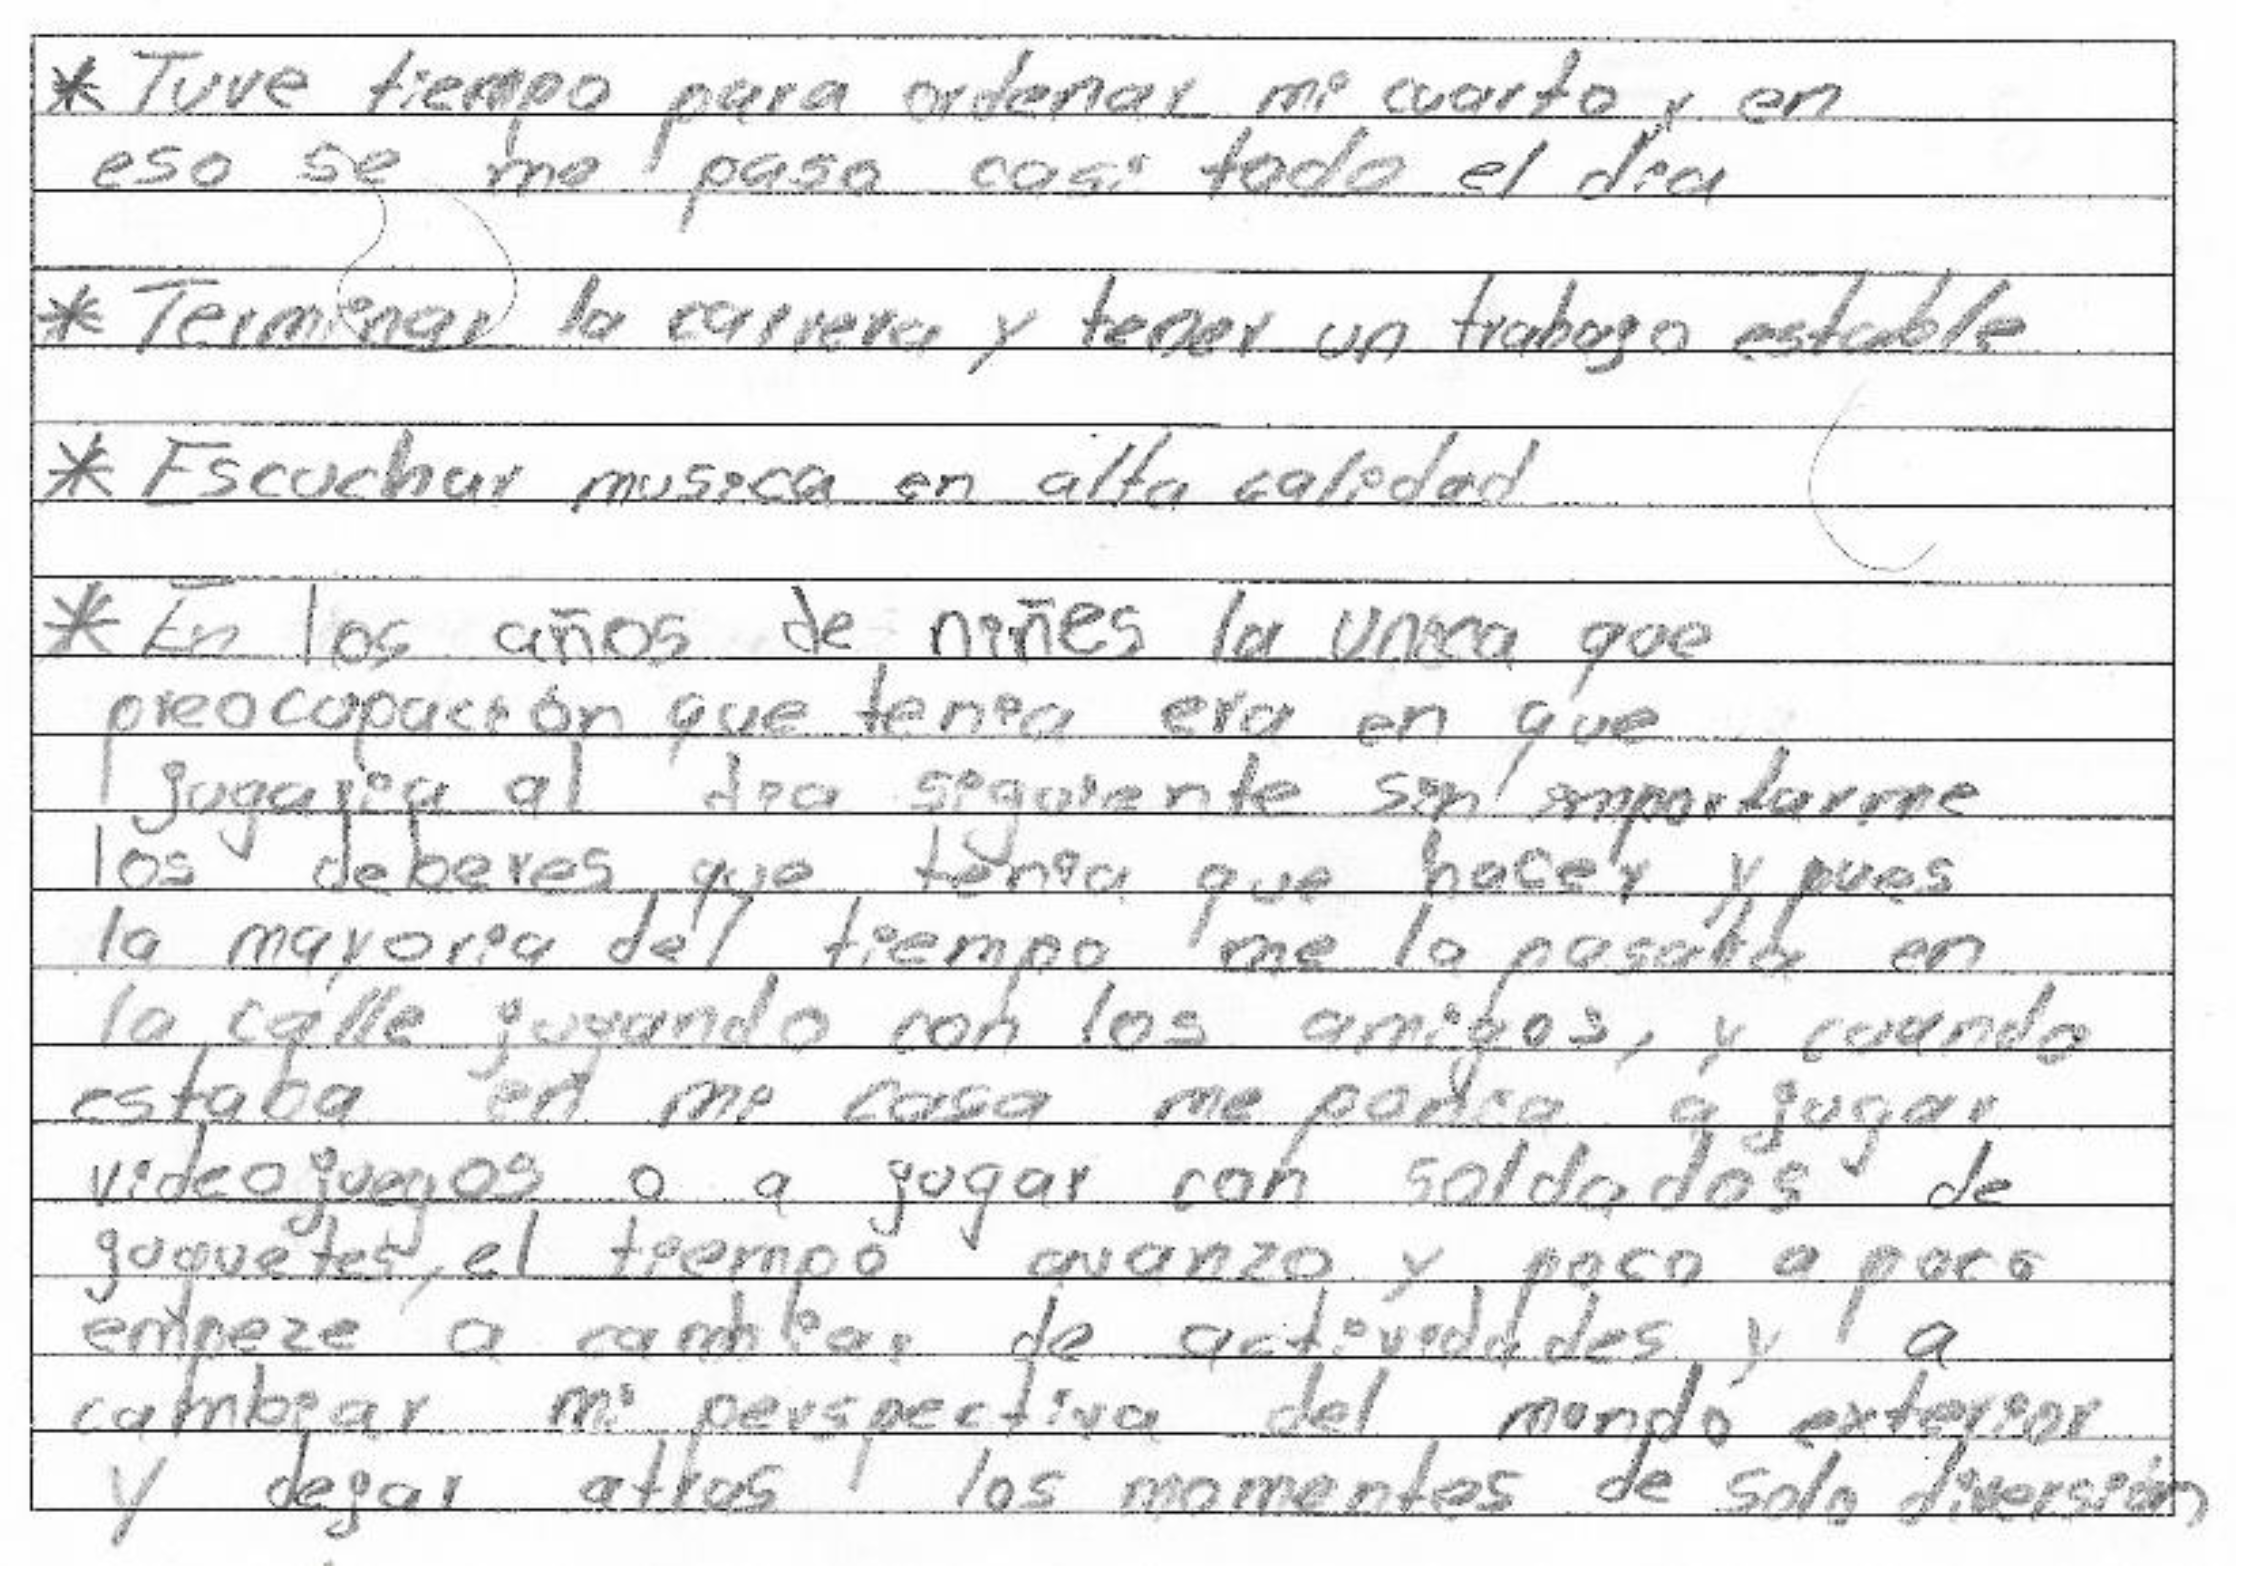
Besides personality and demographic data, a set of 120 handwritten texts by participants was obtained. It was observed that most of the participants chose to write about one of the suggested topics. Just a few decided to write on another topic. It was also observed that the participants used words related to their studies and their desire to be successful and achieve their goals. This could be due to the age and level of studies of the participants.
Table 4 presents a sample of a paragraph in Spanish text gathered in the study. The translation of the text in English for purposes of clarity. The complete study and analysis were in the Spanish language.
Figure 2 shows the original handwritten text.
To conduct the analysis, the handwriting was transcribed to electronic texts. On average, the texts had 90 words and a lexical diversity of 0.19. To measure lexical diversity, the type–token ratio (TTR) measure was used. This measure is expressed as the number of different words in a document divided by the total number of words in that document [
25].
The text processing includes eliminating stop-words since, as is well known, they do not provide relevant information to the analysis because they are common words. There is not a unanimously accepted comprehensive list of stop-words since these words can depend on the context and specific application. However, there is agreement on most words that are considered stop-words. A proposed list of Spanish stop-words was used [
26]. This list contains articles, pronouns, adverbs, prepositions, and verbs.
We used AntConc, which is a corpus analysis toolkit for concordance and text analysis which allows the extraction of data such as word frequencies, collocations, concordances, and so on [
27]. We eliminated stop-words, computed the number of words with and without stop-words, and the number of different words.
Every word was lemmatized, i.e., it was converted to its root. The FreeLing software suite was used for this process. FreeLing is an open-source software suite for natural language processing. This library provides a wide range of analyzers for several languages. It offers natural language application developers text processing and language annotation facilities [
28].
With this data, we built an annotated linguistic corpus for Spanish, which was useful for the construction of the predictive model for personality recognition.
3. Supervised Learning Model to Classify Texts
Machine learning is defined as the field of study that gives computers the ability to learn without being explicitly programmed. These algorithms use computational methods to learn from data without relying on a predetermined equation as a model. The algorithms adaptively improve their performance as the number of instances available for learning increases [
10].
The model for personality prediction is based on a supervised machine learning approach for multiclass classification. We evaluated six of the most well-known classifiers: naive Bayes [
11], sequential minimal optimization [
12], k-nearest neighbors [
13], AdaBoost [
14], J48 [
15], and random forest [
16].
The construction of the model included a pre-processing data step, since there is often noisy, inconsistent, missing, irrelevant, or imbalanced data. Some of the causes are large databases, multiple and heterogeneous sources of data, and data collected for other objectives other than different to data mining. Techniques for data pre-processing increase the performance of data mining algorithms [
10]. Therefore, we applied techniques such as feature extraction, feature selection, and data augmentation. For most of the processes of data mining, we used the Waikato environment for knowledge analysis, WEKA, which is a full implementation of most of the machine learning algorithms [
10]. For data augmentation, we used the scikit-learn library in Python programming language.
3.1. Feature Extraction
The text classification problem is challenging since machine learning algorithms prefer well-defined inputs and outputs instead of raw text. Therefore, the text must be converted into an understandable representation. This process is called feature extraction or feature encoding [
29]. We used the bag-of-words (BoW) model of text. BoW is a way of extracting features from text for modeling. This model is only concerned with whether known words occur in the document. The intuition is that documents are similar if they have similar content [
29]. Every verb and adjective in the text were converted to a nominal feature with two possible values:
Yes (the word occurs in the text) and
No (the word does not occur in the text).
3.2. Feature Selection
The dataset is composed of a total of 546 features (540 features representing verbs and adjectives in the text documents, and 6 features representing the demographic data) and a personality label.
Commonly, raw data contains a combination of features, some of which are irrelevant since they do not provide information to the prediction process. The feature selection process takes a subgroup of related features to be included in the training of a learning model. Feature selection techniques are useful because they simplify models and reduce training time. Feature selection aims to establish redundant or irrelevant features which can be eliminated without losing information [
10]. We applied two feature selection methods in order to have several versions of the dataset.
We used the correlation feature selection method with a Ranker search. This method evaluates the worth of a feature by measuring the Pearson’s correlation between it and the class [
30]. This method generated a ranked list of the 546 features.
We also used the Info Gain feature selection method with the Ranker search. This method evaluates the worth of a feature via the information gain with respect to the class. Information gain is computed by the contribution of the feature in decreasing overall entropy [
31]. The Info Gain method produced a ranked list of the 546 features.
Additionally, for feature subset selection, we experimented with Wrappers and several classifiers (e.g., AdaBoost and random forest). The Wrappers method evaluates sets of features by means of a learning scheme [
32]. However, few features were selected by the Wrappers method; at most, 35 features were selected. Therefore, there was a significant loss of information and the performance of the machine learning decreased.
Cross validation is used to estimate the accuracy of the learning scheme for a set of features. Based on the results of the feature selection process, we built eight datasets from the original dataset. The datasets are detailed below.
3.3. Data Augmentation
From the personality survey, we obtained a dataset with 120 instances where classes are not equally represented (See
Table 3). Imbalanced classes could lead to a bias toward the majority class during the model training [
33]. To deal with this issue, we resampled the dataset by means of the synthetic minority oversampling technique, SMOTE [
33]. SMOTE generates synthetic instances to over-sample the minority class, and it can also under-sample the majority class if necessary. The original dataset was transformed using SMOTE, and the new class distribution is summarized in
Table 5. After applying SMOTE, we obtained a dataset with 248 records.
3.4. Datasets
We built eight different datasets base on the results of the feature selection process. In the original dataset there are 546 features, 540 of which represent verbs and adjectives, and six of which represent demographic data.
Table 6 describes the nine datasets (including the original dataset). It shows the number of features in each dataset and presents the features representing demographic data.
To add features to the datasets, we experimented with several characteristics of the text such as TD-IF, lexical diversity, number of words from each word type. However, we do not observe improvement in the learning models. We need to conduct further experiments and undertake processes such as principal components analysis in order to obtain new features that provide relevant information to the model. Consequently, these features were not included in the datasets.
3.5. Hyperparameter Optimization
Some machine learning algorithms have parameters that can be tuned to optimize their behavior. They are called hyperparameters to distinguish them from basic parameters such as the coefficients in linear regression models. An example is the parameter
k that determines the number of neighbors considered in a
k-nearest neighbor classifier. Usually, best performance on a test set is achieved by adjusting the value of this hyperparameter to suit the characteristics of the data [
10].
In the literature, there are some methods to tune hyperparameters such as grid search, random search, and Bayesian optimization, among others [
34]. However, there is not a direct way to know how a change in a hyperparameter value will reduce the loss of the model, therefore we must do experimentation.
We conducted an empirical process of hyperparameters based on trial and error. Since our dataset is small, the change of many hyperparameters did not have impact. Mainly our objective with hyperparameters optimization was to have a configuration that allows to have a reliable classification with the nine versions of our small dataset, since some configurations could not evaluate the performance of the learning model because there were few samples.
Table 7 presents the hyperparameters configuration for our experiments.
4. Results
After we preprocessed the data and built the datasets, we proceeded to the evaluation of several classifier algorithms to build the predictive model of personality.
In machine learning, classification refers to a predictive modeling problem where a class label is predicted for a given example of input data. A classifier algorithm finds relationships between unknown objects and a set of correctly labeled objects in order to classify the unknown objects [
35]. There is an extensive range of classifier algorithms to be used based on the nature of data.
Based on an analysis of recent work on machine learning proposals, the nature of the problem, and the data available, we decided to evaluate six of the most well-known classifiers: naive Bayes [
11], sequential minimal optimization (support vector machines) [
12], k-nearest neighbors [
13], AdaBoost [
14], J48 [
15], and random forest [
16]. A stratified ten times ten-fold cross-validation technique was used in the training and testing of the model, which is the standard when there is limited data [
10].
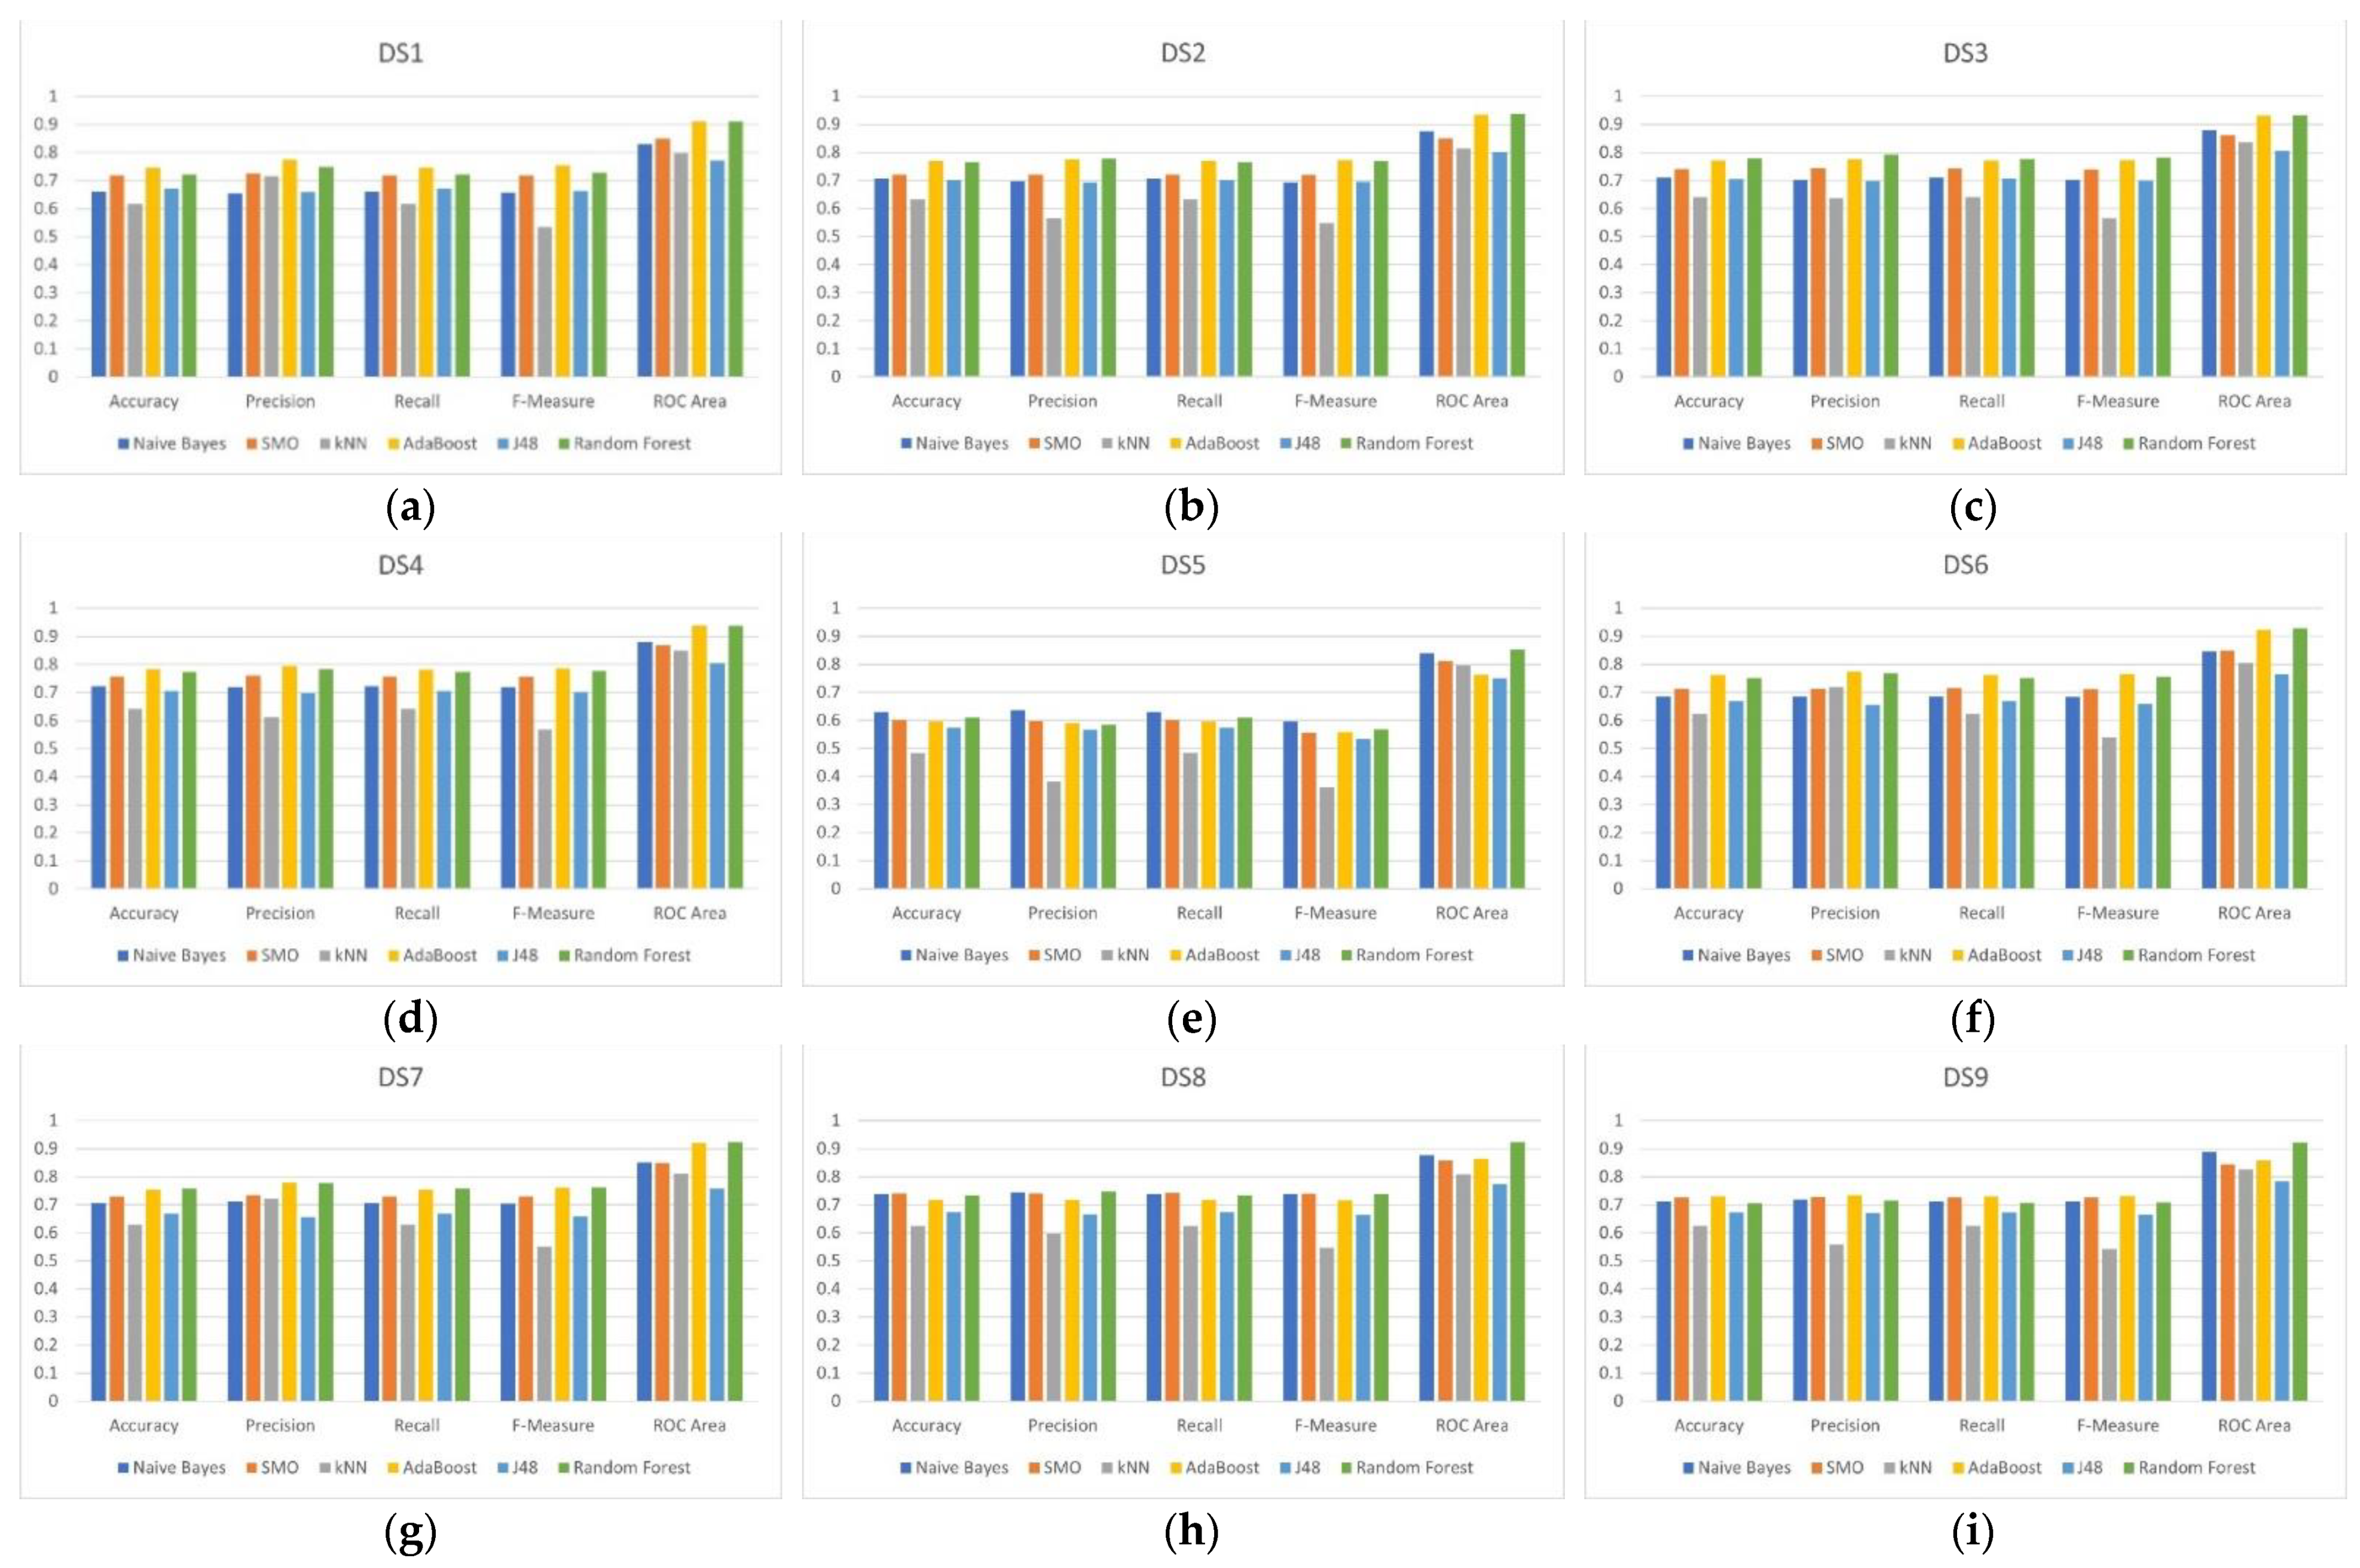
We compared the statistical measures obtained by each one of the classifier algorithms to select the best predictive model. We evaluated the classifier algorithms within the nine datasets for the statistics measures: accuracy, precision, recall, F-measure, and receiver operating characteristic (ROC) area.
Specifically, we focus on F-measure and ROC area. We are interested in F-measure because we want to have a balance between precision and recall. Precision is the fraction of relevant instances among the retrieved instances, while recall is the fraction of relevant instances that have been retrieved over the total amount of relevant instances [
36]. The ROC curve is used for the visual comparison of classification models, which shows the tradeoff between the true positive rate and the false positive rate. The area under the ROC curve is a measure of the accuracy of the model. When a model is closer to the diagonal, it is less accurate, and the model with perfect accuracy will have an area of 1.0 [
36].
Figure 3 presents the results of the six classifiers within the nine datasets for the five measures.
Table 8 depicts the best classifier for each dataset according to F-measure. The best classifier for each dataset according to ROC area is presented in
Table 9.
Table 10 presents the ten classifiers that have the best performance based on F-measure.
Table 11 presents the ten classifiers that have the best performance according to ROC area.
Table 8 and
Table 9 show that AdaBoost and random forest are the classifiers with the best performance for most datasets according to F-measure and ROC area. Naive Bayes (DS5) and SMO (DS8) have good performance according to F-measure. The algorithms J48 and kNN have low performance with most datasets.
As can be observed in
Table 8,
Table 9 and
Table 10, the best classifier is AdaBoost (F-Measure = 0.786 and ROC area = 0.939 for DS4 (276 features selected by Pearson correlation).
Table 12 shows the measures for this classifier. The average ROC area of 0.939 indicates that the model separates the four classes very well.
Table 12 also shows that measures for Steadiness are low. This phenomenon was observed for every classifier; therefore, this class is the hardest class to predict.
DS4 was the dataset that provided the best performance to the classifiers.
Table 10 and
Table 11 shows that the datasets built from correlation feature selection (DS2, DS3 and DS4) provided better performance than info gain feature selection (DS6 y DS7).
Table 13 presents the confusion matrix for AdaBoost with DS4. This confirms the measures in
Table 12. There are many true positives and true negatives (diagonal) and a few false positives and false negatives (outside the diagonal).
Error Analysis
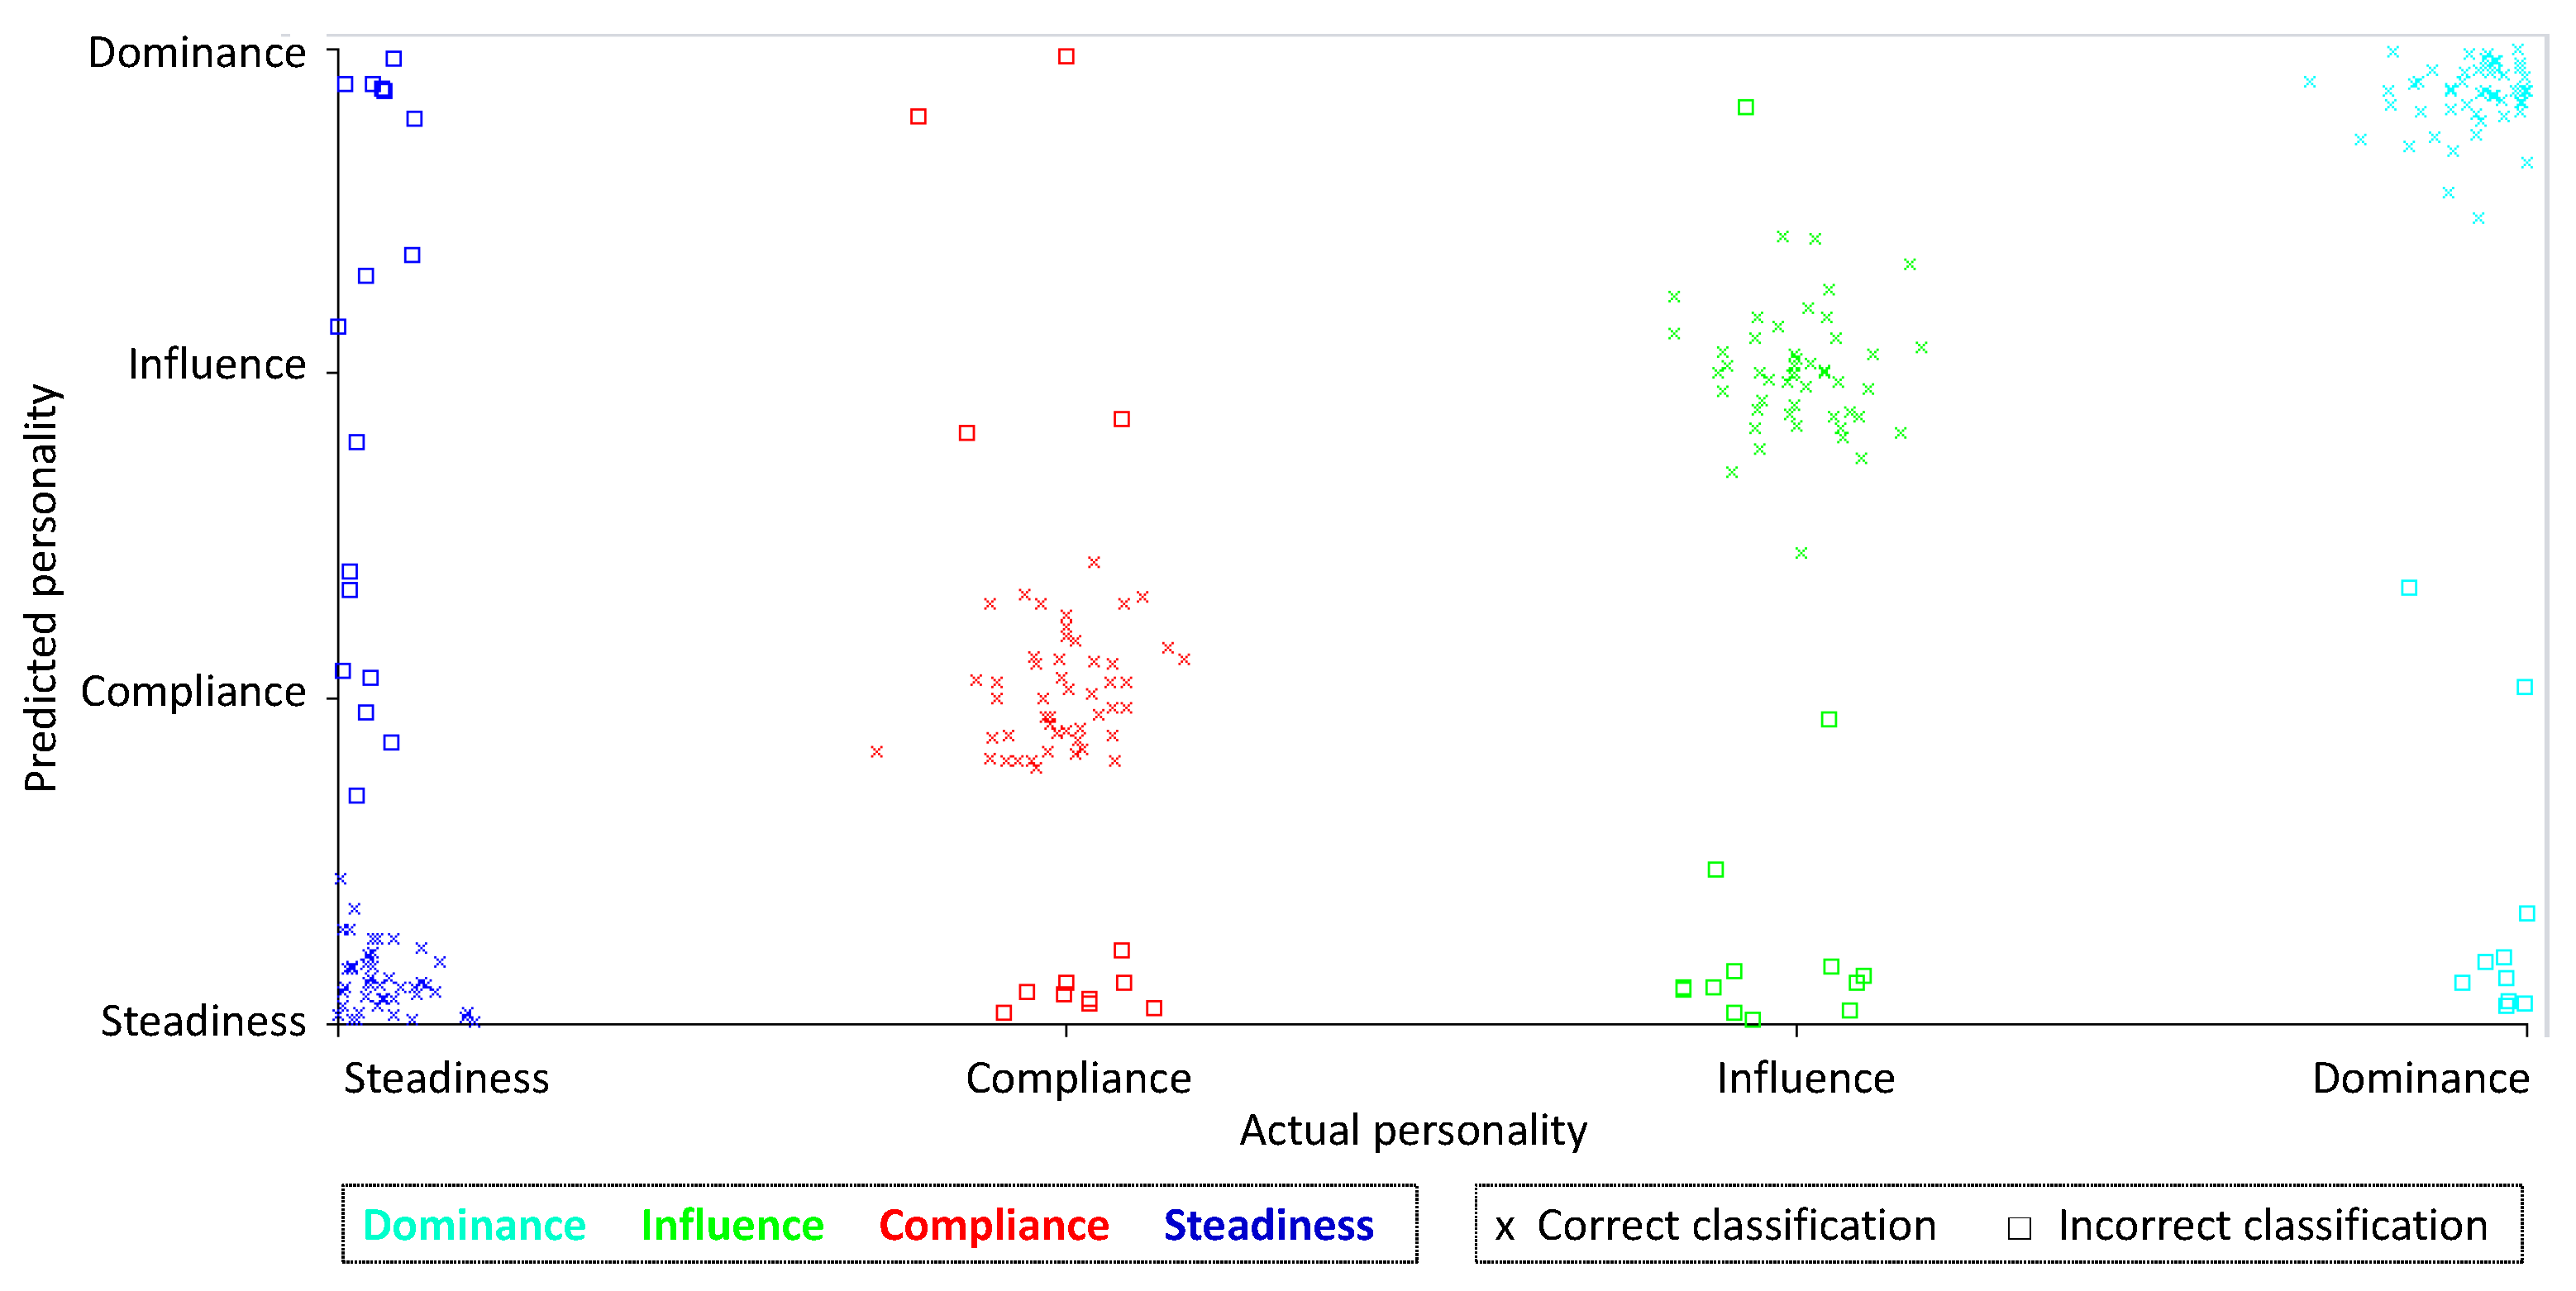
We conducted an error analysis of AdaBoost with DS4 (the classifier with the best performance) to identify which personality the model misclassified. We found that the model has trouble in classify the Steadiness personality.
Table 14 shows the misclassifications. Most of the errors are related to
Steadiness personality. The model classified 17 actual Steadiness instances incorrectly and misclassified 29 instances as Steadiness.
Figure 4 shows correct and incorrect classifications for each class and compares the actual personality versus the predicted personality. This shows that the other three personality has more errors with Steadiness personality.
Figure 5 compares the prediction margin versus the predicted personality. The prediction margin is defined as the difference between the probability predicted for the actual class and the highest probability predicted for the other classes. We can see that Steadiness personality has a prediction margin very low while the other three personality has many instances with a prediction margin of 1.0.
We analyzed some misclassified instances individually. We found that the most common words in Steadiness instances are also common words in other personality instances, therefore when these words are present, the model fails. We also found that
Steadiness instances has a narrow set of words while the other personalities have a wider range of words, therefore when the instance has just few words and are common word for most of the personalities, the model fails and classify it as Steadiness.
Table 15 shows some misclassified instances compared with the actual personality.
5. Discussion
In this paper, a predictive model for personality recognition through text analysis has been proposed. The model was built based on a personality survey. The model relies on a machine learning approach. An annotated linguistic corpus for Spanish was built using the data gathered in the survey. Nine datasets were built using this corpus to train the classification model. Several machine learning algorithms were evaluated. AdaBoost obtained the best performance.
The AdaBoost learning model has a good performance in identifying three of the four classes; as mentioned before, the model has trouble to identify Steadiness. We have reached some conclusions about this weakness of the model. Much research has been conducted on adults who are fully developed, but with adolescents and teenagers, there is still a lot that is unknown; and it is recognized that the personality does not change but it is getting settled as individual grow up. Our population are young adults, they are leaving youth group, therefore they have not developed their personality completely. These results are consistent with the results of another personality test we conducted based on big five model; we found in 58 participants within the same age group (23.2 years old in average) that the 80% are in the middle of the Stability dimension (Neuroticism in big five model), they do not have low Stability neither high Stability [
37]. Additionally, we have a population sample with 71 men and 49 women; it is also recognized that younger girls often experience a dip in emotional stability but increase as they near adulthood. For these reasons, we need to conduct a study to know if our benchmark is appropriate for identifying the four classes.
Even though the results are satisfactory, further research is required. At this point, this predictive model is not a replacement for the DISC model for personality analysis. It is important to emphasize that the study was conducted with a very specific group of participants (young people, mostly students) which biases the results. The population sample was also very small.
The DISC model has been extensively used in professional settings, industry, and business organizations. Even DISC is a popular model, this model has not been studied as much as similar models, such as big five and MBTI, and therefore there are less controlled research and relatively little scientific experimentation to support it. Additionally, DISC model is focused on behavior to establish the personality, but there are another deeper thought patterns and characteristics. This makes it less applicable in emotional situations.
In the other hand, data mining is an experimental science, whose results depend on the quality and quantity of the data and the nature of the problem. As a result of the new studies, we will have a bigger and different benchmark, therefore we must set up new experiments to have concluding findings. Additionally, machine learning is a huge field, therefore, there are many techniques that could be useful, and they were not focused on this research.
There are companies which offers predictive analytics for decision makers and technologies to optimize processes through intelligent applications. Such is the case of SOTA solutions (
http://sota-solutions.de/wordpress_en/accessed on 6 March 2022), a company that develops big data solutions for producing, the energy, and the services industries. Their products are the results of many years of work on machine learning, statistics, mathematics, and software developing, therefore, they have very good performance. The core of these technologies is the same of our approach, machine learning and data mining. The difference strives in the application domain.
Even though the results are encouraging, there are several points in the research agenda of personality analysis. For example, the DISC model includes 15 patterns that are related to the four dimensions of personality. As future work, we will conduct another survey to obtain more data to recognize personality patterns in addition to the personality dimensions. This will help to provide a more precise prediction. The corpus can also be enriched using other metrics for the texts. For example, it could integrate collocations, use Point Mutual Information, and n-grams in order to obtain the information of associated words. In particular, we want to explore the CollGram technique, which assigns to bigrams in a text two association scores computed on the basis of a large reference corpus to determine the strength of the collocation [
38]. This analysis will allow us to deepen into the relationship between writing patterns and personality. CollGram has been used successfully to detect depression in annotated corpus [
39]. Our corpus was small; therefore, it would be interesting to compare the performance. However, we are planning to gather more texts in a further study.
The demographic data have not been thoroughly analyzed in the construction of the predictive model and some experimentation is needed to determine its relationship to personality and writing behavior. A future line of research line is to analyze the handwriting.
Additionally, during the results analysis, it was observed that most of the participants chose to write about the suggested topics. Most of the participants used words related to their studies and their desire to be successful. This could be due to the age of the participants. More experimentation is needed with participants of other ages in order to determine if this behavior is more related to the age of the participants or their personality.
In summary, this research provides some insights into the analysis of personality, which will help in the planning of the next steps in the investigation of the relationship between personality and writing characteristics.


