Article

Performance of a Mid-Size Net-Zero Energy Solar House

by
Hessam Taherian
1,* and
Robert W. Peters
2
1
School of Science, Engineering, and Technology, Pennsylvania State University (Penn State), Harrisburg, PA 17057, USA
2
Department of Civil, Construction, and Environmental Engineering, The University of Alabama at Birmingham, Birmingham, AL 35294, USA
*
Author to whom correspondence should be addressed.
Appl. Sci. 2022, 12(6), 3005; https://doi.org/10.3390/app12063005
Submission received: 5 January 2022 / Revised: 14 February 2022 / Accepted: 11 March 2022 / Published: 15 March 2022

Abstract

:
The University of Alabama at Birmingham (UAB) was one of 16 collegiate teams from around the world that participated in the U.S. Department of Energy Solar Decathlon 2017 competition. An interdisciplinary team of students from across the university was engaged in a 2-year long process to design and build a house that is powered completely by solar power. The house was equipped to run all the typical appliances of an average modern house at similar levels on a conventional power grid. The net-zero house was built and tested on the UAB campus. Considering Birmingham’s weather, a safe room was built to ensure the safety of occupants during events of extreme weather, such as a tornado. A ductless HVAC unit consisting of an inverter-type 3-speed outdoor unit supplied refrigerant to four high-wall indoor units providing the primary source of space conditioning. To achieve a model of efficiency and cost effectiveness, the house incorporated a heavily insulated envelope and precise glazing protection. The roof, floor framing and walls had R-30 batt and foam insulation. With a design informed by southern vernacular language, the building is oriented to maximize solar access and to use roof planes for shading the majority of the year. Peak power generation of the panels was recorded at 9.6 kW. The home has a centralized energy management system that can provide access to energy consumption data and allow control of lighting, appliances, and plug loads remotely. Energy modeling showed that the annual electricity consumption for heating and cooling with variation in wall types were 8470 to 11,661 kWh. For the month of October, it was calculated varying from 683 to 763 kWh, with varying air changes per hour from 0 to 1.5.

1. Introduction

The Solar Decathlon is an annual competition set out by the U.S. Department of Energy in order to showcase student efforts in designing and building net-zero solar powered houses [1]. In 2017, sixteen teams from different colleges and universities participated in the U.S. Solar Decathlon, which took place in Denver, Colorado. Interdisciplinary teams from both graduate and undergraduate levels designed, built, and transported their house to Denver for the competition. There, teams competed in ten contests which included different aspects considered when building a house.
With the current state of the climate, homeowners have become more conscious of their lifestyle and their purchases. This includes homes which have been relatively slow in their development due to their longevity. Buildings are responsible for between 25–40% of greenhouse gas emissions (GHG) globally, and even more prevalently in the United States [2]. Within those buildings, Heating, Ventilation, and Air Conditioning (HVAC) systems are the greatest contributor of energy consumption. About 50% of total annual building consumption have been attributed to this aspect alone [3]. This number will only increase due to population density and climate change. In fact, homeowners around the world have been using more energy each year despite growing concern. Global residential consumption of electricity has increased approximately 3.4% each year since 1990 [4]. Electricity consumption is predicted to increase by up to 50% in 2050 [5]. The goal of the Solar Decathlon is to not only hopefully eradicate these problems in the future, but also to create comfortable and more energy efficient homes.
Buildings account for the largest savings potential in terms of cost and reduction of GHG emissions [6]. Furthermore, the construction industry is responsible for more than 40% of carbon emissions in Europe alone [7]. By tackling issues with energy demand and construction, the environmental impact of structures can be reduced and longevity can be increased. Team Alabama’s Surviv(AL) House takes all this into account, along with adding features to make it an attractive prospect for both builders and residents. In this paper, the Surviv(AL) House’s specifications are discussed and performance analyzed.

2. Previous Research Studies on Net-Zero Energy Buildings

Several research studies have been conducted addressing the feasibility of net-zero energy buildings. These studies are briefly described below.
Arumägi and Kalamees [8] conducted detailed analyses for net-zero energy buildings in Estonia. By the end of 2018, all new public buildings and all new buildings by the end of 2020 are required to be nearly zero energy buildings (NZEB). NZEB are defined as buildings with a very good energy performance along with having nearly zero (or a very low amount of) energy need covered by energy from nonrenewable resources. A NZEB typically involves an energy grid-connected building with a very high energy performance. It uses on-site produced electricity under suitable conditions and uses delivered energy the rest of the time. Well-insulated buildings, effective building service systems, and local electricity production are needed for NZEBs. Research questions addressed in the study of Arumägi and Kalamees [8] were: Is it theoretically possible to achieve a NZEB without on-site electricity production using photovoltaic (PV) panels, and is it possible to achieve a NZEB level if PV panels with a nominal power of 100 kW are installed? They addressed the building energy performance expressed as annual primary energy usage and presented as an energy performance value expressed in kWh/m2 per year The authors looked at the building’s total weighted specific energy use for detached houses, multi-apartment buildings, office buildings, public buildings, schools and other educational buildings, and kindergarten and day care centers. The energy calculations considered the heating systems involving energy use for space heating, heating of ventilation air, and heating of domestic hot water. Simulations were performed to estimate the indoor comfort and energy use of the building. Their results indicated it is possible to achieve NZEB levels in buildings in Estonia through careful design of the building’s energy performance.
Belpoliti [9] performed a comparative analysis of simulated and monitored energy performance of a prototype house in Dubai, United Arab Emirates (UAE). The UAE Vision 2021 addresses environmental sustainability aimed at reducing greenhouse gas emissions. The author noted that the building sector is among the largest energy consumers globally, accounting for nearly 40% of the overall share in western countries and nearly 70% in the UAE. The research investigation’s objective was to assess the energy calculation assumptions and validate the suitability of the prediction of the design simulation. The simulations were performed using the DesignBuilder/EnergyPlus 8.0 software. The monitored results were validated by a third-party organization. Belpoliti’s study considered architectural design of the project, geometric features and orientation, construction design for energy efficiency, different shading devices and their location, HVAC systems, and passive design to enhance natural ventilation and cooling. The study demonstrated the efficiency and utility of using energy simulations for developing NZEBs.
A design concept developed by Chanto et al. [10] was investigated, reporting the monitoring results for a Solar Decathlon house that participated in the Solar Decathlon Europe 2019 competition. Their house was designed as a lightweight rooftop house that can be placed on top of a new row house in Bangkok, Thailand. The additional rooftop house increases the living space on an existing building, plus it ensures the existing building is more viable, comfortable, and eco-friendly. Their house was monitored for its energy performance during the 10 days of the Solar Decathlon competition (15 July through 25 July 2019). Analysis of those results indicated the house was net positive with 171.81 kWh which was the highest value of all the competitors. The energy consumption was only 37.65 kWh. The HVAC system with solar thermal collector, air source heat pump, and waste heat recovery saved electrical energy for water heating. Their design house consumed 14 times less energy due to its high thermal insulation, the heat recovery system, and the solar thermal system. This design house won a second place in the Comfort conditions contest in the Solar Decathlon.
A NZEB test facility was constructed at the National Institute of Standards and Technology (NIST) in order to demonstrate that a house similar in size, and amenities to those in the surrounding communities could serve as a NZEB while serving the needs of a four-member family [11]. The living area was 252 m2 (2712 ft2). The house incorporated various renewable energy and energy efficient technologies, such as air-to-air heat pump systems, solar photovoltaics, and a heat recovery ventilator. Their study addressed exterior above-grade walls, basement walls/floor, roof structure, electrical distribution system, air-distribution systems, air-to-air heat pump system, photovoltaic system, solar hot water system, heat pump water heating system, plumbing system, ventilation system, etc. The energy performance of the house was monitored over a one-year period that began on 1 July 2013. During the seven-month period when air conditioning was required, the sensible to total load ratio varied from 0.58 to 0.78. The photovoltaic and thermal solar systems were significantly impacted by snow cover. During the study period, the house generated 13,523 kWh of electricity using the 10.2 kW solar photovoltaic system. The house consumed 13,039 kWh energy while meeting the electrical and comfort needs of a four-member family, resulting in a net energy export of 484 kWh. The solar photovoltaic system converted 16.8% of the incident solar radiation into useful electrical energy. The solar thermal hot water system provided 54% of the energy to meet the domestic hot water load.

3. House Description

Team Alabama designed and built a house with 1000 ft2 of gross floor area. The house has 2 bedrooms, a Jack-and-Jill bathroom, and modern appliances. With the aim of absorbing the most significant part of the solar radiation, the house is oriented with the long axis going east-west and most windows facing north or south. To achieve a cost-effective house, a heavily insulated envelope was applied, and large window areas were shaded. The house is shown in Figure 1.
The building is oriented to maximize solar access and to utilize roof planes for effective shading throughout the year. The large northern porch is covered with a transparent canopy designed for inclement weather. It also allows light to wrap around corners and penetrate in the early morning and late evening, activating the living spaces. Thick double-stud walls, a well-insulated, high-albedo roof, and an insulated crawlspace create an efficient envelope that protects residents from brutal heat intrusion and leakage of valuable cooling. The sleeping zone absorbs daytime heat on the southern exposure and the daytime living zone benefits from a consistent northern light for most of the day.
Other features include a wet wall, simplified and concentrated in the middle of the plan. This makes for an interesting condition wherein the shower is utilized, and access can be controlled by either of the two bedrooms. The wall separating the two main modules is a wood-stud double-wall which made for easy assembly and wet connections. A central kitchen allows for communication between the living and dining spaces. A safe closet is structured for durability to withstand extreme weather, even further than the house itself to ensure its residents safety. This is achieved with an opening through the floor of the house that lets the safe closet be anchored securely to the ground.

3.1. Structural Design

Team Alabama’s Surviv(AL) House followed both International Residential Code and the 2017 Solar Decathlon Building Code for design and construction. The construction and transportation of the solar house proved to be one of the main challenges for the team. To minimize issues, the house structure was created in two modules that connected with a wall. The roof was then constructed in 4 modules. The Structural Team developed the foundation, walls, and trusses to meet the ASCE/SEI 7–10 Minimum Design Loads and Associated Criteria.
The subfloor used engineered I-Joists, which are lighter than dimensional lumber and are sustainably sourced. Exterior walls consisted of 2″ × 6″ plates with staggered 2″ × 4″ studs and blown closed-cell insulation for an R-30 envelope. The open ceiling in the living space combined with clerestory windows for increased daylighting and an expansive feel. The composite and wood frame “strong room” extended below the level of the subfloor to allow for permanent footings when the house reached its final location.

3.2. The Competition

Teams were challenged for their abilities in design, operation, cost-effectiveness, attractiveness, and energy efficiency in their solar-powered homes. Teams are judged based on 10 contests worth 100 points each. The house is then graded on a scale of 1000 points possible. The contests are separated in two different major parts: Juried Contests and Measured Contests. Six of the contests are Juried Contests: Architecture, Market Potential, Engineering, Communications, Innovation, and Water. Four of the contests are Measured Contests: Health and Comfort, Appliances, Home Life, and Energy. Measured Contests are assessed through defined criteria; however, Juried Contests are based on judges’ evaluations.

3.3. Contests

Each measured contest was worth 100 points. Solar Decathlon officials installed sensors in the house to measure temperature, humidity, CO2 levels, and light intensity. Instantaneous power and total energy generated by the photovoltaic (PV) panels were measured by another data acquisition system, and data were collected at a central location.

3.3.1. Health and Comfort

This contest included four sub-categories: temperature, humidity, indoor air quality, and air tightness. To measure these different areas, several sensors were placed in the house for the duration of the desired measuring period. Temperature should be maintained between 20 °C (68 °F) and 23 °C (74 °F) during the scored period to earn all points. Relative humidity should be maintained between 35% and 60% during the scored period. For the indoor air quality contest, the CO2 level should not exceed 1000 parts per million (ppm). Air tightness should be less than or equal to 0.05 CFM50/ft2.

3.3.2. Appliances

The Appliances Contest includes the choice and management of different appliances. This includes the refrigerator, freezer, clothes washer, clothes dryer (or drying method), cooking appliances, and hot water systems. For the refrigerator sub-contest, the interior temperature of the refrigerator should be between 34 °F (1.1 °C) and 40 °F (4.4 °C). For the freezer sub-contest, the interior temperature of the freezer should be between −20 °F (−28.9 °C) and 5 °F (−15 °C).

3.3.3. Home Life

The Home Life Contest includes several sub-contests: lighting, home electronics, and situations, such as a dinner party, game night, and commuting. Commuting is carried out by an electric car that must be charged by the generated PV power from the house and be driven 25 miles a day.

3.3.4. Energy

There were two areas of concern under the Energy Contest: Energy Production and Energy Value. For Energy Production, a team receives full points for producing at least as much energy as the house consumes, thus achieving a net energy consumption of zero during the competition [12]. The Energy Value sub-contest was designed to mimic the arrangement a consumer with a solar-powered house may have with a utility, including a net-metering agreement and time-of-use electricity rates. Each team began the competition with a $5.00 charge on their “account”. Through production of solar electricity, the teams had to turn the balance to positive to receive full points if at the end of the competition their account was at least $10.00 in the positive.

3.4. Juried Contests

In addition to the 4 measured contests, there were 6 juried contests. The juried contests were Architecture, Market Potential, Engineering, Communications, Innovation, and Water. A team of juries visited each of the houses, interviewed the teams, and graded the houses after detailed deliberations.

4. As-Built Features of the House

4.1. PV System

Team Alabama installed 30 Panasonic PV panels of the type N330 HIT (Panasonic Corporation of North America, 2018) [13]. Each panel provides 330 W of peak power at a rated 19.7 percent conversion efficiency. The total installed peak capacity is 9.9 kW. This kind of panels are excellent for a southern climate since they are specifically designed to provide high efficiency at high temperatures. The 30 PV panels are divided into two separate arrays of 15 panels. The two branches are connected to one SolarEdge SE7600 A-US inverter [14] rated at 97.5 percent efficiency. Inverters are used for the household AC electrical supply. Each panel is equipped with SolarEdge OP400-MV-MC2SM-2NA 400 W power optimizers [15]. The optimizers are basically maximum power point tracking (MPPT) units for each individual panel. More details of the PV panel can be found in the Table 1, on the following page.

4.2. HVAC

For environmental comfort, a Carrier ductless HVAC system (outdoor unit model 38MGRQ36D-3) [16] was used which consisted of an inverter-type 3-speed outdoor unit that supplies refrigerant to four high-wall indoor units. The indoor units were 2 × 9000 Btu/h (40MAQB09B-3) plus 2 × 12,000 Btu/h (40MAQB12B-3). The smaller indoor units were installed in the bedrooms, while the larger units were installed on the two end walls of the living module. The HVAC system can provide both cooling and heating for the house. There was no need for ductwork in the house. Additionally, an air dehumidification system was designed to reduce the air conditioning load at night, if necessary. The dehumidification system incorporated a liquid desiccant that regenerates using a solar thermal collector during the daytime. The HVAC characteristics are shown in Table 2.

4.3. Water Heater

A GeoSpring hybrid electric heat pump water heater [17] was the water heater used in the house. The heat pump water heater could run in several modes. It was equipped with two auxiliary heating elements of 4000 W (lower element) and 4500 W (upper element). The manufacturer has reported the energy factor to be 3.25, with a first hour rate of 69 gal (261 L). The heat pump is located in the mechanical room and outdoor air is directed into the unit. The water heater has wireless communication capabilities and integrates into the building energy management system. Table 3 summarizes the water heater’s technical specifications. The Energy Factor (dimensionless) for a water heater is defined as the ratio of the useful heat output from the water heater to the amount of energy input from the fuel. In the case of a hybrid heat pump water heater, the fuel is the electricity used to heat the water.

4.4. Energy Recovery Ventilator (ERV)

An energy recovery ventilator (Panasonic Intelli-Balance 100 ERV) was used for the energy recovery process of providing fresh air, improving air quality and reducing total HVAC equipment load [18]. The envelope of the house must have an infiltration rate ACH < 1.0 (ACH stands for Air Change per Hour), therefore using an ERV is necessary. The ERV operation was controlled by the CO2 level in the house as opposed to a timer-based operation.

4.5. Other Appliances

The other appliances used in the house include: refrigerator, washer and dryer, dish washer, oven, and microwave. Table 4 shows plug loads and some additional information for these appliances. The competition only allows electric appliances.

4.6. The Electric Vehicle

A Nissan Leaf was used to fulfill the car charging and commuting requirement of the competition. The PV system of the house successfully charged the car during daylight hours for the entire duration of the competition. The car was driven 25 miles on each day of the competition, and was 80% charged on the last day of the competition as was required for receiving all the points possible.

4.7. Modules and Installation

All operations in the house are controlled and monitored centrally through an LCD touch-sensitive panel with an option to use handheld wireless/data devices. The house and all its appliances are ready for the Internet of Things by incorporating a Home Energy Management system. Each indoor HVAC unit communicates with the central control unit. Additionally, current transducers (CT) were installed individually on the cable of the PV system, lighting, electric outlets (one CT for all), HVAC outdoor unit, water heater, dishwasher, washer/dryer combo, oven/stove, and the ERV system.

5. Energy Modeling and Discussion

5.1. Model Setup

OpenStudio (EnergyPlus) 8.0 software was used to model a residential solar home to test the effects of increasing the insulation value of external wall structures on the energy consumption and demand on the home’s HVAC unit. Varying the value of air infiltration in the home was also tested for its effects. The EnergyPlus 8.0 software was used to perform the energy calculations throughout a year-long period on the model using weather data files for both Birmingham, AL, the home’s final resting place, and Denver, CO, where the home was placed for the month of October 2017 to compete in the U.S. Department of Energy’s Solar Decathlon competition.
The home was drawn in Sketchup Make using the OpenStudio plug-in. The model was drawn based on the as-built drawings. The building’s visual representation in Sketchup was created using the outer dimensions of the house. The model was created having two thermal zones, one an unconditioned crawlspace area, 2 feet tall and the other conditioned area that has 2 bedrooms, 1 shared bathroom, a safe room, and a large open space which contains the living room, kitchen, and dining room. Energyplus does not perform calculations based on computational fluid dynamics and, therefore, the conditioned zone was modeled as one large space with no internal wall structures. Figure 2 shows the plan view of the house.
The electrical appliance loads matching appliances likely to be used in the actual house were created in the OpenStudio model and set up with schedules that, as accurately as possible, represent patterns in which a four-person household might use them. Schedules for heating and cooling were created using the 74 °F (23 °C) maximum and 68 °F (20 °C) minimum allowed temperatures for maximum points at the Solar Decathlon competition. A staggered double 2″ × 4″ exterior wall construction was modeled with 2″ × 6″ bottom and top plates to form the wall frame. Vertical exterior walls were modeled as having from outside-in: cement (Hardie) siding, with 1″ (R5) rigid foam board, 0.5″ plywood sheathing, respective wood stud structure filled with 1″ closed-cell sprayed foam, and two layers of batt insulation, 2″ and 3″, respectively, and ½″ plywood and gypsum board. The roof and the floor framing were handled in the same manner, but with 2″ × 8″ using 5.5″ rigid foam insulation on the outside and 1″ closed-cell-sprayed foam on the inside. Table 5 shows the layering of materials used for the different construction sets used to build the house.
The effects of air infiltration were tested using the model with a staggered double 2″ × 4″ wall structure and varying the air tightness values ranging from 0.05 CFM/ft2 to 0.15 CFM/ft2 with 0.05 CFM/ft2 increments.

5.2. Modeling Results

In Table 6, the recommended HVAC sizing is based on design day data which used 21 January and 21 July for heating and cooling values, respectively. The conditions on these days are considered to be indicative of the harsh conditions during these parts of the year. It can be seen that even the most insulated wall structure in Denver requires more heating capacity than the least insulated wall structure in Birmingham. Birmingham requires more cooling than Denver but with the single 2″ × 6″ wall structure, the cooling requirement is only 6.2% higher for Birmingham than Denver and the heating required in Denver is 24.6% greater than Birmingham. It can be seen that in Birmingham, cooling values are between 5% and 8% higher than those for heating, whereas in Denver cooling values are around 30% lower than heating.
In Table 7, the highest annual total peak load was seen in July for Birmingham and in June for Denver. October is listed in this table to estimate the demand the competition house might be expected to meet during the competition. The house has a smaller peak load in Denver, likely due to milder temperatures during the early part of fall.
In Table 8, the effect of the increased air infiltration can be seen. Heating the house is affected the most by increased infiltration. In Birmingham, the required heating capacity almost doubles when the infiltration rate increases from 0.3 to 1.5 ACH. In Denver, the same increase in infiltration requires approximately a 91% increase in HVAC capacity. For cooling, the increase in capacity is only 31% for Birmingham, and 27% for Denver.
In Table 9, the highest annual total peak load was seen in July. October is listed in this table to estimate the demand the competition house might be expected to meet during the competition. It can be seen that the house will have a smaller peak load in Denver during the competition, likely due to milder temperatures during the early part of fall. It can also be seen that in the model tested, wall construction has only a small effect on peak demand of the house. The greatest difference in performance of 4.0% is found in Denver in the month of July.
Table 10 shows that the total peak demand is influenced more by the amount of air infiltration than by the change in wall types. Both cities show an approximately 10% increase in peak demand during the hot month of July. Birmingham sees a larger effect during October than Denver does. This is likely due to the milder temperature in Denver during this time of the year while Birmingham is still typically in the cooling season.
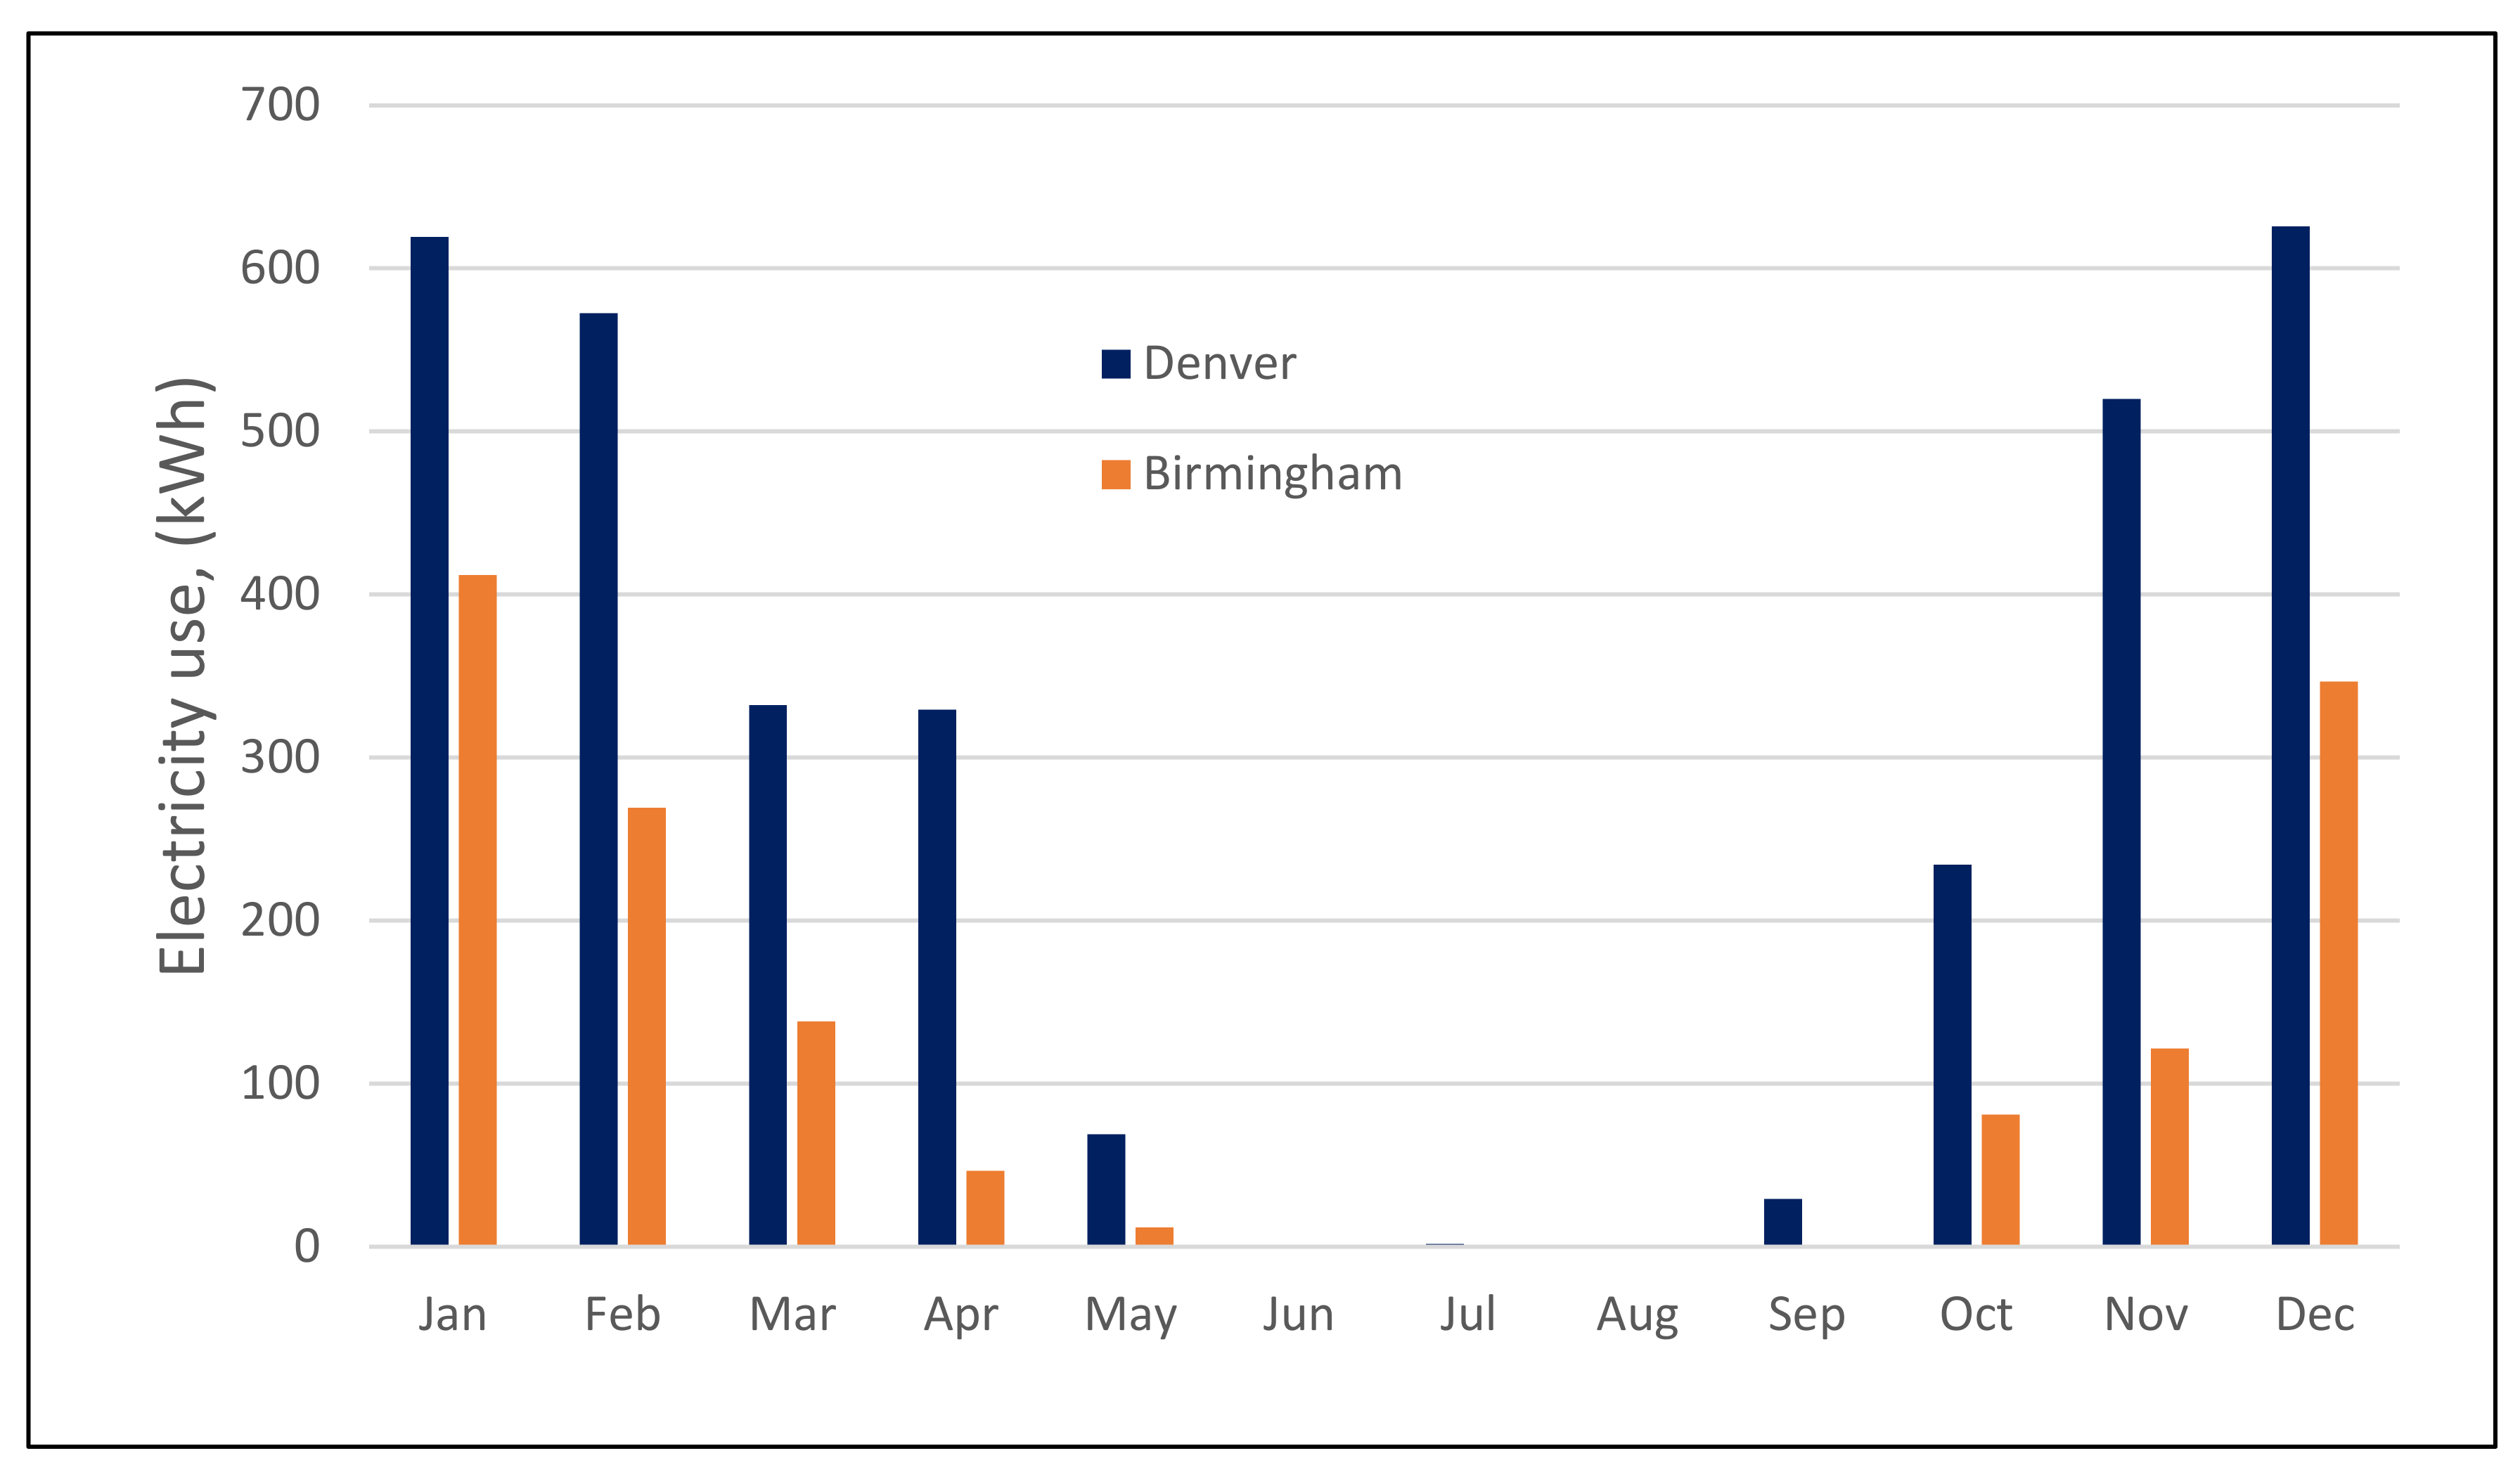
Figure 3 and Figure 4 show annual electricity consumption for heating and cooling for each month. Figure 3 shows that in Denver, electricity use for heating is considerably higher than that in Birmingham. The total electricity use for heating in Denver and Birmingham is 3335 and 1428 kWh, respectively. Heating electricity is 12% of total electricity use in Birmingham while it is 26% in Denver. This means that any effort to reduce heating electricity for a building located in Denver will have a larger impact on the total electricity bill of the house compared to that in Birmingham.
For cooling, as seen in Figure 4, Birmingham requires more electricity for most months. The results presented in Figure 3 and Figure 4 are in line with what was expected according to the weather condition of the two cities. The total electricity use for cooling in Denver and Birmingham is 2568 and 4155 kWh, respectively. In Birmingham, cooling constitutes 34% of total electricity use while that fraction is 20% in Denver. In contrast to heating, improving the building performance with respect to cooling load has a larger impact in the total electricity cost of the building in Birmingham.
Based on the results of the energy modeling performed on the as-built condition of the house, a 2-ton ductless heat pump system is sufficient to deliver heating and cooling needs of the building. The study revealed that, as expected, cooling is the dominant design factor in Birmingham while in Denver, the dominant design factor is heating. The annual cooling electricity in Birmingham is 62% more than that in Denver. Heating electricity required in Birmingham is 57% less than that in Denver. When both electricity use for cooling and heating is considered, the two cities require nearly the same energy in kWh per year.
Selecting insulation material for the house is a multi-faceted task. The ultimate goal is to keep the inside conditions at a comfortable range by limiting heat transfer through the house’s envelope, and also to minimize infiltration of unconditioned outside air to the house through gaps, cracks, and openings. In order to achieve these goals, conscientious decisions must be made. Health concerns are the most important factors, and most commercially available insulating materials have deficiencies in that area. Construction-phase issues includes skin- and eye-irritant chemical fumes, microfiber inhalation, and skin abrasion. Post-construction issues include flammability, off-gassing, end-of-life environmental issues, and also the same issues as those during construction-phase whenever repair and replace work is required. On the other hand, there is the issue of achieving the highest R-value that is possible in a compact space, and so hard choices have to be made. Usually, environmentally benign materials do not provide high R-values or lack other required features such as fireproofing. The exterior vertical walls of the house are built in a staggered double 2″ × 4″ stud manner with 2″ × 6″ plates on the top and bottom of the wall frame. This provides a cavity space for insulation equal to 5.5 in (14 cm). This cavity is filled with 1 in (2.5 cm) of closed-cell foam sprayed on the ZIP system® wall sheathing. A 2-in (5 cm) layer of fiberglass batt insulation is installed over the spray foam. An additional 3″ (7.6 cm) layer of fiberglass paper-faced batt insulation is in place. Then, in order to provide a rigid backing to prevent gypsum boards from cracking due to transportation-induced vibration, plywood sheets are installed to close the wall cavity. Gypsum board is installed on the plywood sheets. On the outside of the exterior sheathing, a 1-in (2.5 cm) slab of rigid foam insulation provides an additional R-5 insulation to the wall. Table 5 shows the thickness of each individual layer of the vertical exterior walls. Since the house is built in several modules for transportation, there are seams where the modules come in contact. All seams are sealed with weather-resistant tape.
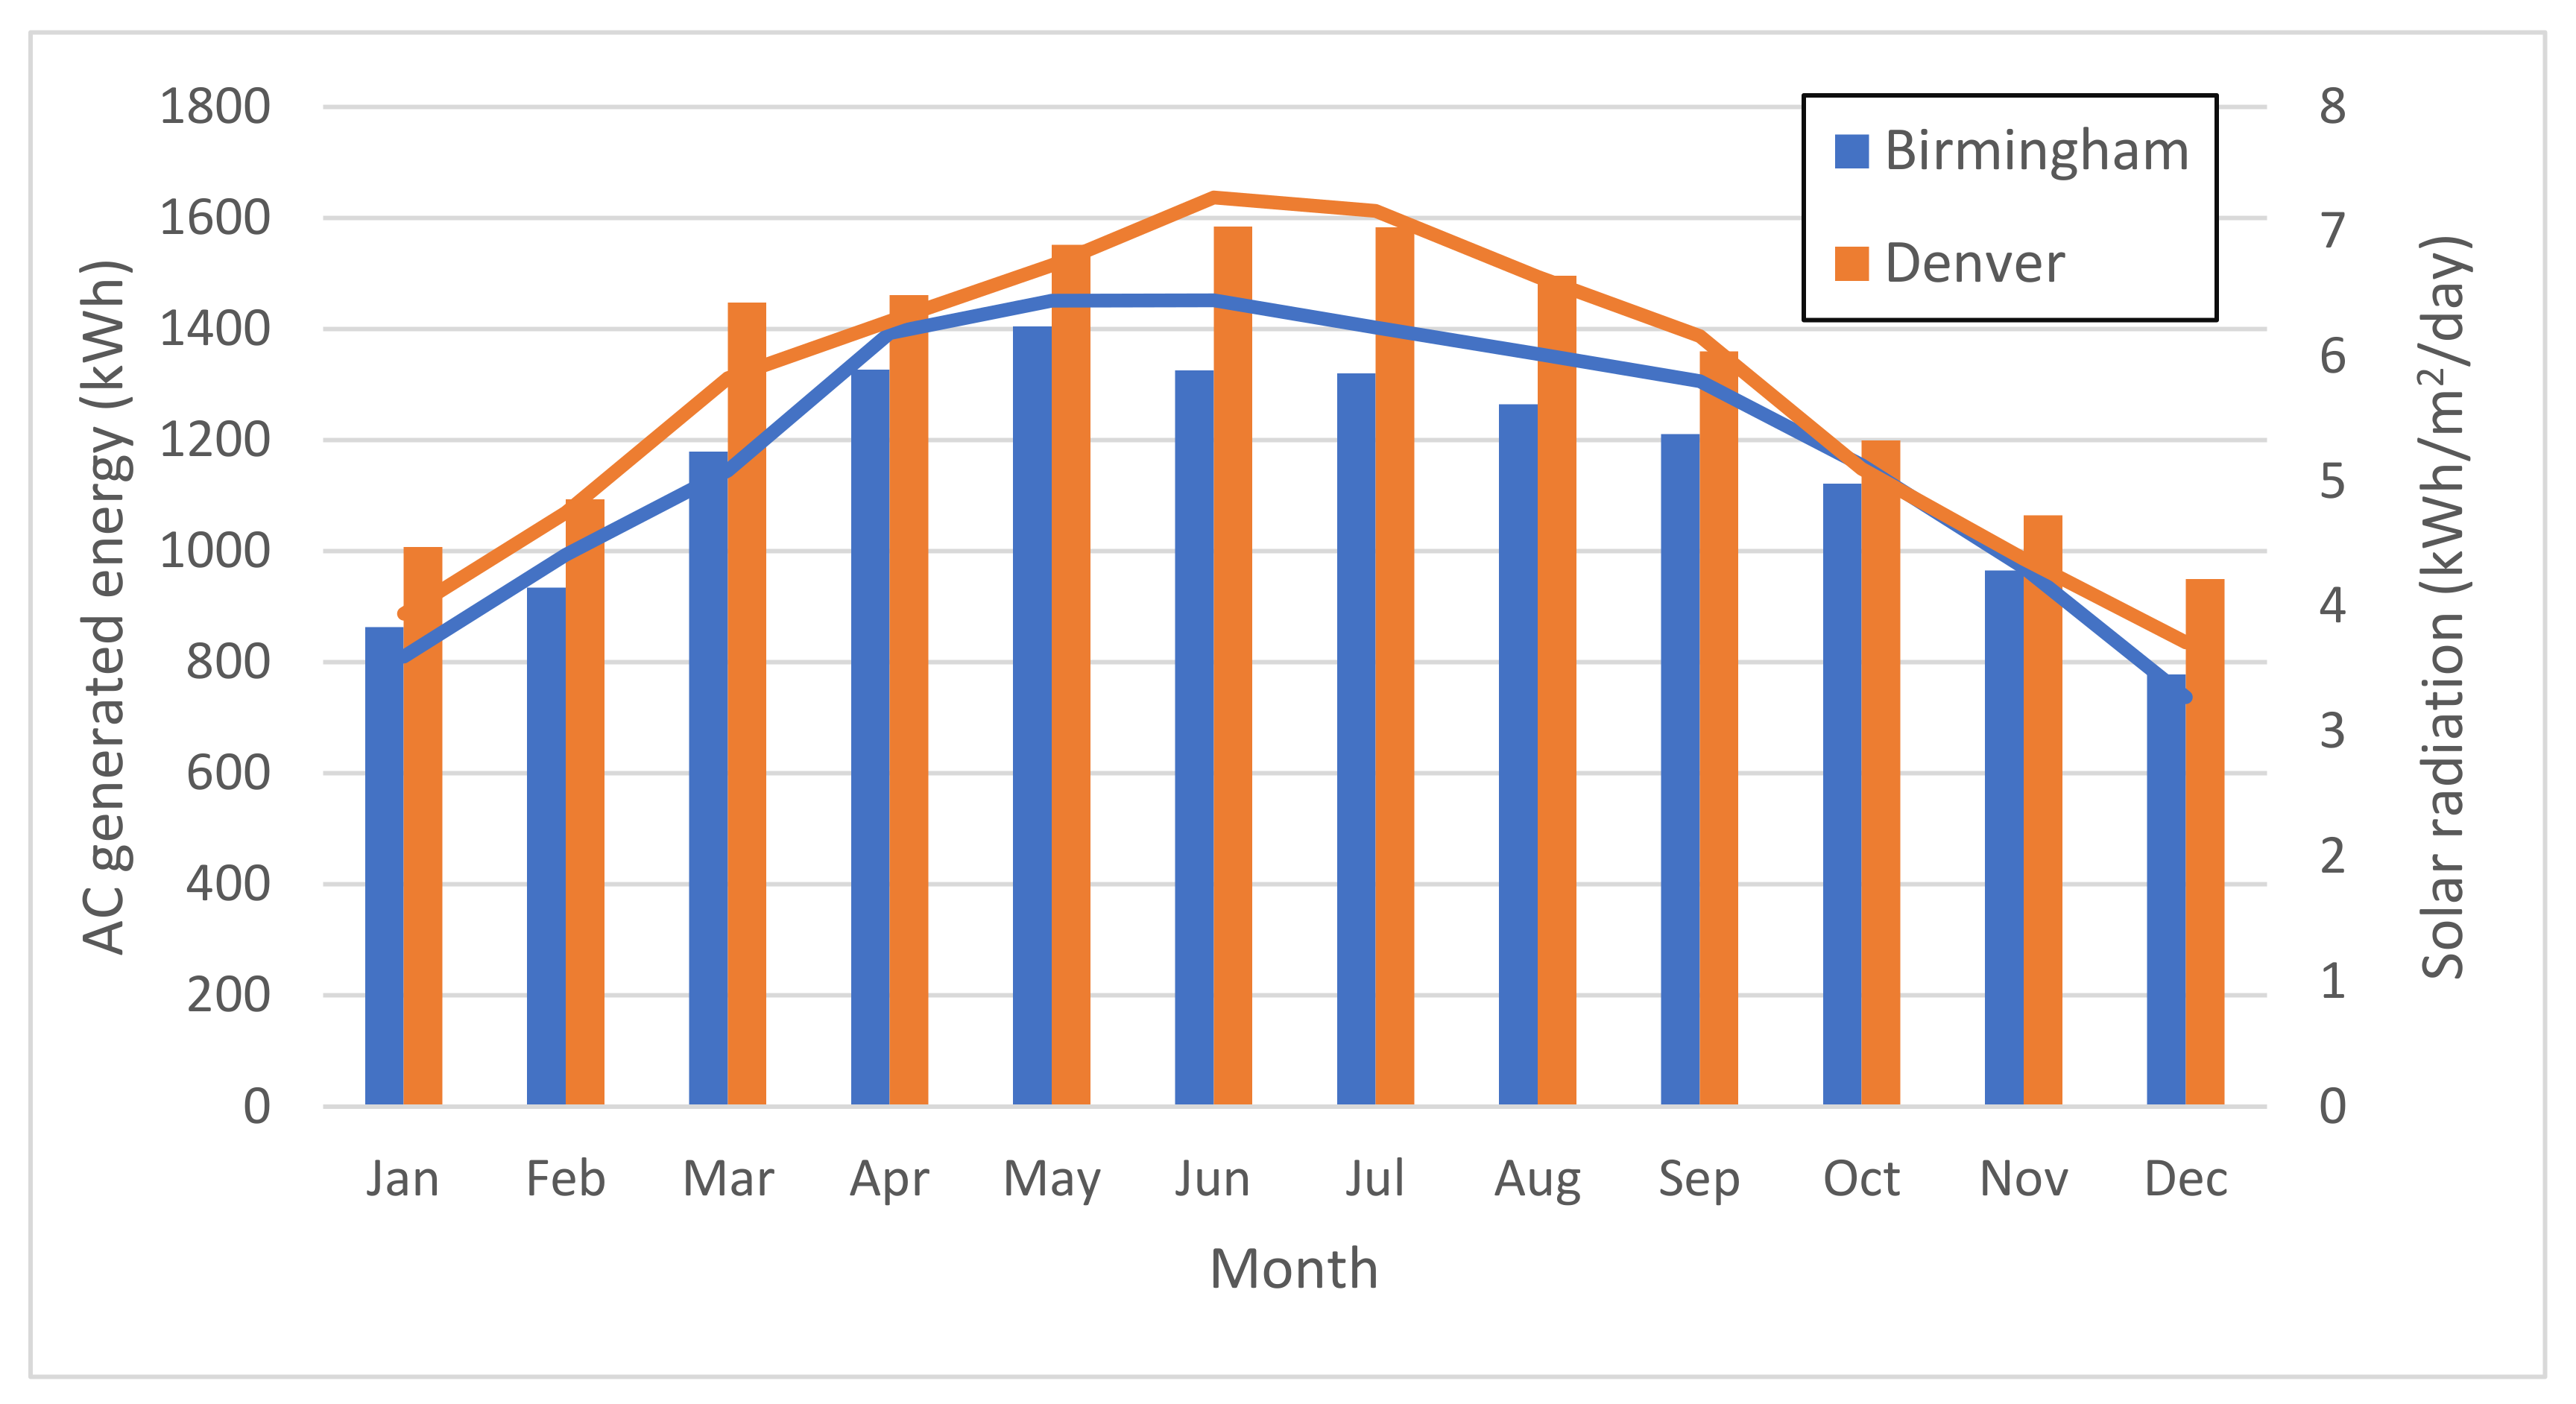
Monthly PV electricity generation by the installed system was simulated using the PVWatts calculator [19]. The roof tilt angle (19°) was used in the model as the PV panels were installed flat (parallel) on the roof. The nominal (peak) PV capacity of 9.9 kW was entered as the capacity of the system in the calculator. Figure 5 presents the results of the simulation.
It can be seen that at the given tilt angle, the PV system generates less energy in Birmingham as expected because the average solar radiation on a daily basis is smaller than that in Denver.

6. Actual Performance at the Site

The house was reassembled in the competition village located in Denver over a period of one week. Several sensors were installed throughout the house by the Solar Decathlon engineers to monitor the thermal comfort performance of the house. The PV power generation system was tied to the microgrid of the village. Net metering was established for the house to account for the balance of energy generated/used by the house. Figure 6 shows how well the HVAC system of the house was able to maintain the indoor temperature within an established narrow band, i.e., 68–74 °F. The lowest outdoor temperature was 28.1 °F, and the highest temperature was 79.4 °F. The figure shows that rapid temperature fluctuations caused temperature overshoot inside the house on two occasions.
The relative humidity (RH) performance of the house is depicted in Figure 7. Maintaining the RH inside the house was a tougher challenge considering the fact that there was no active humidification mechanism in the house. As Figure 7 shows, outdoor humidity reached values as low as 12% at times. This is evident from undershoots of humidity value inside the house on two occasions when there is a rapid drop in outdoor humidity in a period of roughly one hour. Dehumidification, however, was accomplished by condensation on the evaporator coils of the ductless air conditioning unit. It is worth mentioning that the team did not lose points if the overshoot or undershoot of either temperature and humidity happened during defined unoccupied hours.
The carbon dioxide level inside the house was mandated to be controlled under 1000 ppm at all occupied times. The main source of carbon dioxide in the house was the occupants, as there was very little cooking activity during the competition. Similar to the temperature and humidity limits, points were deducted from the teams only if overshoot occurred during occupied hours. The energy recovery ventilator (ERV) controlled by the CO2 sensor was the device that brought fresh air as required to control the CO2 level. Timed operation of the ERV was at one point considered due to ease of setting. However, CO2-controlled operation was decided to be more energy-efficient. Figure 8 shows that the ERV performed fairly well with only a few overshoots which could very well be during the time that the team was in the house performing tasks while not considered contest time.
Energy use of the house, in contrast to energy production of the house, was monitored during the competition and the results are presented in Figure 9 and Figure 10, respectively, in the form of power used and produced. Figure 9 shows that on average, the power use of the house is below 3 kW, while the maximum power demand is a little over 7 kW. The highest demand resulted from simultaneous cooking and air conditioning in the house. The PV system installed on the house had a 9.9-kWp capacity. Figure 10 shows that the system reached a peak power production of 7.3 kW. Negative values of power generation indicate that at that period, the rate of energy use by the house surpassed the rate of energy generation due to high demand falling on after-sunset hours.
Table 11 tabulates the results of generated PV electricity at the site in comparison to the cumulative energy generation predicted by the model. Figure 11 presents some of the data provided in Table 11, graphically. As can be seen on both Table 11 and Figure 11, on October 9 (in the vicinity of hour 6750 in Figure 10), the actual energy generated was nearly zero. Figure 12 depicts the daily generation of electricity and offers a better image of the effect of the snow fall, marked by the deep decline in the generated power. Figure 10 shows very good agreement between the modeled and measured PV energy generated. During the days on hours preceding the snow fall, the measured energy was on average 45% higher than the model prediction. In the hours after the snow fall, the model prediction exceeded the measured energy.
The performance of the PV system of the house along with its reduced energy use resulted in ranking 1st in energy generation among the competitors by ending at 74.4 net-positive kilowatt-hours. In terms of the value of the net energy used, the house ranked 3rd while maintaining a positive balance at the end of the competition.

7. Note on Cost Comparison

Due to the Solar Decathlon competition requirements, the house had to be built in modules, disassembled, transported over 8 states (Alabama to Colorado), reassembled in Denver, disassembled after the competition and transported back to Birmingham for permanent erection. The required modular construction plus many additional features, such as additional reinforcement of the roof modules for crane operations, special wiring and plumbing to facilitate modular construction (a dry module and a wet module), oversized heat pump (due to donation of the device), significantly added to the finished cost of the house. These were just a few of the special features that the team had to incorporate in the design and construction of the house. Therefore, a cost comparison will not fairly represent the affordability of net-zero energy houses. In general, a net-zero energy house of the same size will cost 10–20% more than traditional construction depending on the innovative features included in the construction.

8. Lessons Learned

  • The ductless heat pump air conditioning unit proved to be a successful choice because the strict temperature and humidity requirements for the house required quick switching from heating to cooling mode and vice versa.
  • Achieving low air infiltration rates is a very important task in net-zero energy buildings. Even a 1″-thick spray foam can be quite helpful in achieving this goal.
  • A 2″ × 6″ wall cavity is a better choice than a staggered double 2″ × 4″ cavity wall due to ease of construction and better insulation continuity.
  • A staggered double 2″ × 6″ wall is highly redundant and should not be considered.
  • Humidity control is challenging in the areas where very low outdoor humidity can occur.
  • Carbon dioxide control can be achieved with higher energy efficiency when performed based on carbon dioxide level as opposed to timed operation.

Author Contributions

H.T.: conceptualization, formal analysis, critical data analysis, methodology, resources, software, supervision, validation, article writing (original draft) and editing; R.W.P.: methodology, data analysis, resources, article writing (review and editing). All authors have read and agreed to the published version of the manuscript.

Funding

This research received no external funding.

Institutional Review Board Statement

No human or animal subjects were involved in this research.

Informed Consent Statement

Not applicable.

Data Availability Statement

Not applicable.

Acknowledgments

The authors would like to acknowledge the generous donation of supplies and services by the following companies/institutions and individuals: The UAB Facilities Division; UAB Sustainability (with special thanks to B. Ingram, and J. Price); Panasonic Corporation; Stewart Perry Company; Williams Blackstock Architects; Carrier Corporation; Loewen Windows; Beko Home Appliances: Southern Company; and L. Smith.

Conflicts of Interest

The authors declare no conflict of interest.

References

  1. U.S. Department of Energy, Solar Decathlon. Solar Decathlon Competition. 2017. Available online: https://www.solardecathlon.gov/2017/competition.html (accessed on 10 December 2021).
  2. United Nations Environment Programme. Buildings and Climate Change: Summary for Decision-Makers; United Nations Environment Programme, Sustainable Consumption and Production Branch: Paris, France, 2009. [Google Scholar]
  3. Chua, K.; Chou, S.; Yang, W.; Yan, J. Achieving Better Energy-Efficient Air Conditioning—A Review of Technologies and Strategies. Appl. Energy 2013, 104, 87–104. [Google Scholar] [CrossRef]
  4. Van Dam, S. Smart Enegy Management for Households. A+BE: Architecture and the Built Environment; TU Delft Publishers: Delft, The Netherlands, 2013; ISBN 9789461861795. [Google Scholar]
  5. Pilkington, B.; Roach, R.; Perkins, J. Relative Benefits of Technology and Occupant Behaviour in Moving towards a More Energy Efficient, Sustainable Housing Paradigm. Energy Policy 2011, 39, 4962–4970. [Google Scholar] [CrossRef]
  6. Sarbu, I.; Sebarchievici, C. General Review of Ground-Source Heat Pump Systems for Heating and Cooling of Buildings. Energy Build. 2014, 70, 441–454. [Google Scholar] [CrossRef]
  7. Eurostat. Shedding Light on Energy Use in Europe. 2020. Available online: https://ec.europa.eu/eurostat/cache/infographs/energy/ (accessed on 21 July 2021).
  8. Arumägi, E.; Kalamees, T. Design of the First Net-Zero Energy Buildings in Estonia. Sci. Technol. Built Environ. 2016, 22, 1039–1049. [Google Scholar] [CrossRef]
  9. Belpoliti, V. Comparative Analysis of Simulated and Monitored Energy Performance of a Prototype House: Lesson Learnt from the Project KNOW HOWse for Solar Decathlon Middle East 2018 in Dubai. J. Build. Eng. 2021, 41, 1027–1040. [Google Scholar] [CrossRef]
  10. Chanto, K.; Mahasuwanchai, P.; Eakintumas, W.; Lairat, C.; Thavorusettawat, N.; Tauthanawiwat, K.; Wongthavoruman, K.; Pulugern, T.; Chayavanich, N.; Wiputthanupoug, W.; et al. Solar Decathlon Europe 2019: The Resilient Nest of a Solar Powered and Solar Energy Efficiency Roofing House for Urban Density. Int. Conf. Sustain. Energy Green Technol. 2020, 463, 012033. [Google Scholar] [CrossRef] [Green Version]
  11. Fanney, A.H.; Payne, T.V.; Ullah, L.; Ng, M.; Boyd, F.; Omar, M.; Davis, H.; Skye, B.; Dougherty, B.; Polidoro, W.; et al. Net-Zero and Beyond: Design and Performance of NIST’s Net-Zero Energy Residential Test Facility. Energy Build. 2015, 101, 95–100. [Google Scholar] [CrossRef]
  12. U.S. Department of Energy. Solar Decathlon 2017—Energy Contest. 2017. Available online: https://www.solardecathlon.gov/2017/competition-contests-energy.html (accessed on 18 January 2022).
  13. Panasonic. N330 Photovoltaic Module HIT®. 2018. Available online: https://na.panasonic.com/us/energy-solutions/solar/solar-panels/n330-photovoltaic-module-hitr (accessed on 15 December 2021).
  14. SolarEdge. Solar Edge Single Phase Inverters. 2017. Available online: https://www.solaredge.com/us/products/pv-inverter/single-phase#/ (accessed on 21 January 2022).
  15. SolarEdge. Power Optimizer. 2020. Available online: https://www.solaredge.com/us/products/power-optimizers#/ (accessed on 21 January 2022).
  16. Carrier. Performance™ Multi-Zone Heat Pump with Basepan Heater 38MGR. 2022. Available online: https://www.carrier.com/residential/en/us/products/ductless-systems/38mgr/ (accessed on 15 December 2021).
  17. GE Appliances. GEH50DFEJSR. Available online: https://products.geappliances.com/appliance/gea-specs/GEH50DFEJSR (accessed on 2 July 2019).
  18. Panasonic Corporation of North America. Intelli-Balance™ 100 Balanced Air Solution, Cold Climate ERV, 50 to 100 CFM. 2022. Available online: https://na.panasonic.com/us/home-and-building-solutions/ventilation-indoor-air-quality/energy-recovery-ventilators/intelli-balancetm-100-balanced-air-solution-cold-climate-erv-50-100-cfm (accessed on 10 March 2022).
  19. NREL. PVWatts® Calculator. 2020. Available online: https://pvwatts.nrel.gov/ (accessed on 21 January 2022).
Figure 1. Photo of the exterior of the house as was assembled in Denver, CO. ((Left): view at night, (Right): after the unexpected snowfall).
Applsci 12 03005 g001
Figure 2. The plan view of the house.
Applsci 12 03005 g002
Figure 3. Annual electricity consumption for heating for the two cities.
Applsci 12 03005 g003
Figure 4. Annual electricity consumption for cooling for the two cities.
Applsci 12 03005 g004
Figure 5. Monthly simulated AC energy output of the PV system in Birmingham and Denver along with the corresponding magnitude of solar radiation. Bar plots show the generated power, and line plots show the solar radiation.
Applsci 12 03005 g005
Figure 6. The indoor temperature of the house vs. outdoor air temperature and the acceptable temperature band.
Applsci 12 03005 g006
Figure 7. Measured indoor relative humidity and outdoor humidity showing the acceptable band.
Applsci 12 03005 g007
Figure 8. Measured carbon dioxide concentration inside the house.
Applsci 12 03005 g008
Figure 9. Measured energy consumption by the house at the site.
Applsci 12 03005 g009
Figure 10. Measured PV energy generated by the PV system at the site.
Applsci 12 03005 g010
Figure 11. The cumulative PV electricity as modeled and generated.
Applsci 12 03005 g011
Figure 12. The daily generated energy by the PV panel system compared to the model results.
Applsci 12 03005 g012
Table 1. PV panel characteristics.
Max. power (Pmax), [W]330
Max. power voltage (Vmp), [V]58.0
Max power current (Imp), [A]5.70
Solar panel efficiency, [%]19.7
Table 2. HVAC characteristics.
Cooling Rated Capacity, (Btu/h)34,000
Heating Rated Capacity, (Btu/h)42,500
Air flow range (One for each bedroom), (CFM)206–412
Air flow range (One for dining area, one for living area), (CFM)265–471
Table 3. Water heater features.
Capacity 50 gal.
Operating Modes
Energy Factor by modeEfficiency2.78
Hybrid2.75
Electric0.89
1st Hour Rating (gal)Efficiency42.1
Hybrid67.5
Electric59.1
Table 4. Appliances specifications.
RefrigeratorRefrigerator Capacity15.4 cu. ft.
Freezer Capacity7.98 cu. ft.
Total Capacity23.3 cu. ft.
Annual Energy Consumption544 kWh
Washer and Dryer (all in one)Capacity2.3 cu. ft.
Annual Energy Consumption120 kWh
DishwasherAnnual Energy Consumption225 kWh
OvenBottom Heating Element Wattage1200 W
Upper Heating Element Wattage2200 W
MicrowaveOn high power level1200 W
Table 5. Construction materials used for the model.
Construction Materials
SurfaceLayer 1 (Outer Layer)Layer 2Layer 3Layer 4
Crawlspace wallAir wallN/AN/AN/A
Exterior wallHardie siding 5/8″Plywood 3/8″5″ fiber layer glass batt insulation½″ Plywood and gypsum board
Interior floor2″ × 8″ with 5″ foam insulationPlywood ¾″1/8″ polyurethane foam underlaymentLaminated flooring
RoofMetal roofPlywood ½″2″ × 6″ with 5.5″ rigid foam insulationPlywood
Table 6. Recommended HVAC unit sizing for differing wall structures.
Recommended HVAC Sizing
BirminghamDenver
ConstructionHeating ton, (kW)Cooling ton, (kW)Heating ton, (kW)Cooling ton, (kW)
Single 2″ × 4″1.20 (4.22)1.26 (4.41)1.60 (5.58)1.20 (4.20)
Single 2″ × 6″1.13 (3.98)1.21 (4.24)1.50 (5.25)1.14 (4.00)
Double 2″ × 4″1.10 (3.82)1.17 (4.09)1.43 (5.03)1.10 (3.85)
Double 2″ × 6″1.05 (3.68)1.13 (3.95)1.38 (4.83)1.06 (3.71)
Table 7. Total household peak demand for all wall types tested.
Total Peak Demand, (kW)
BirminghamDenver
JulyOctoberJuneOctober
9.328.749.848.54
Table 8. The influence of varying air infiltration on the recommended HVAC sizing.
Recommended HVAC Sizing
BirminghamDenver
ACHHeating ton, (kW)Cooling ton, (kW)Heating ton, (kW)Cooling ton, (kW)
00.73 (2.54)1.06 (3.71)1.00 (3.50)1.02 (3.57)
0.30.98 (3.41)1.15 (4.03)1.30 (4.56)1.09 (3.81)
0.61.22 (4.27)1.24 (4.34)1.60 (5.60)1.17 (4.10)
0.91.46 (5.13)1.33 (4.65)1.89 (6.64)1.24 (4.34)
1.21.71 (5.98)1.42 (4.97)2.19 (7.68)1.31 (4.59)
1.51.95 (6.84)1.51 (5.28)2.49 (8.72)1.39 (4.86)
Table 9. Total household peak demand by different wall constructions.
Total Peak Demand, (kW)
BirminghamDenver
Wall constructionJulyOctoberJulyOctober
Single 2″ × 4″9.829.499.848.83
Single 2″ × 6″9.689.369.698.82
Double 2″ × 4″9.589.289.588.84
Double 2″ × 6″9.469.399.458.81
Table 10. Total household peak demand for varying air infiltration rates.
Total Peak Demand, (kW)
BirminghamDenver
ACHJulyOctoberJulyOctober
09.298.869.358.75
0.39.529.209.558.86
0.69.769.459.758.87
0.99.999.689.958.82
1.210.229.9010.118.80
1.510.4610.1310.218.77
Table 11. Generated versus modeled PV electricity.
Energy Generated in kWh
ModeledMeasuredModeled
DateDay #Start HourBirmingham (Cumulative)Denver (Cumulative)Denver (Daily)Denver
(Cumulative)
5 October 2017278665928.4530.0630.0647.02
6 October 2017279667279.5851.3321.06718.59
7 October 2017280669697.4995.8744.55229.85
8 October 20172816720149.55143.1347.2678.35
9 October 20172826744187.97143.170.044127.31
10 October 20172836768236.84173.8430.67177.49
11 October 20172846792288.25205.5831.734225.60
12 October 20172856816331.43253.9348.352274.34
13 October 20172866840358.42288.6134.682315.49
Publisher’s Note: MDPI stays neutral with regard to jurisdictional claims in published maps and institutional affiliations.

