Article

Numerical Modeling of a Green Tide Migration Process with Multiple Artificial Structures in the Western Bohai Sea, China

1
College of Civil Engineering, Tongji University, Shanghai 200092, China
2
Key Laboratory of Science and Engineering for Marine Ecology and Environment, The First Institute of Oceanography, Ministry of Natural Resources of People’s Republic of China, Qingdao 266061, China
3
Laboratory of Marine Ecology and Environmental Science, Qingdao National Laboratory for Marine Science and Technology, Qingdao 266235, China
4
State Key Laboratory of Marine Geology, Tongji University, Shanghai 200092, China
*
Authors to whom correspondence should be addressed.
Appl. Sci. 2022, 12(6), 3017; https://doi.org/10.3390/app12063017
Submission received: 11 February 2022 / Revised: 11 March 2022 / Accepted: 14 March 2022 / Published: 16 March 2022
(This article belongs to the Section Marine Science and Engineering)

Abstract

:
Green tides have increasingly become a nuisance worldwide in recent years, and especially in China. Since 2015, green tides have started recurring in Jinmeng Bay, Qinhuangdao, western Bohai Sea of China, and have severely deteriorated the tourism environment there. In order to investigate the migration process of the green tides in Jinmeng Bay, a hydrodynamic model and a particle-tracking model were applied based on the latest green tide event in August 2021. The hydrodynamic model was applied with triple-level 2DH meshes with different refinements and scales, which provided the hydrodynamics to drive the green macroalgae into the particle-tracking model. From the model results, the semi-enclosed waters surrounded by multiple artificial structures are a low-energy hydrodynamic environment, which is not helpful for water exchange and thus the dispersal of nutrients. The green macroalgae are distributed substantially within the semi-enclosed waters, and few are transported out with low biomass. The effects of wind and artificial structures both increase the coverage of the green macroalgae trajectories; the effect of wind plays a more important role. A sensitivity analysis of the effect of wind showed that 6 m/s wind in ENE led to the maximum coverage of the green macroalgae trajectories in the cases of different magnitudes and directions of winds. This study can provide references for the pre-warning and mitigation of green tides in Jinmeng Bay and other similar places.

1. Introduction

Seaweed tides, including green tides and golden tides, have been a nuisance in recent decades, with their occurrence increasing worldwide; the resulting consequences include deteriorating tourism environments, hindering marine aquaculture, and disrupting fishing work [1,2]. If not cleaned up in time, seaweed biomass will rot into a putrid mass, and its oxygen-deficient interior can generate toxic hydrogen sulfide (H2S) [3], which can cause adverse impacts on coastal ecosystems. Two genera, Ulva and Sargassum, are primarily responsible for the cosmopolitan seaweed tide bloom. The former genus, Ulva, has a major causative role in green tides, and the latter genus, Sargassum, the source of the Sargasso Sea’s name, has a major causative role in golden tides. In terms of the vegetative body, the thallus thickness of Ulva can reach up to the level of one or two cells, and the shapes are diverse and can be sheet-like, tubular, or fern-shaped [4]. The thallus of Sargassum is leathery and tough, and Sargassum is made up of leafy appendages, branches, and round, berry-like structures, which are called pneumatocysts, that are filled with gas and help the plant’s body to float on the sea surface.
In the 1900s, the green tide issue emerged in Europe, and it occurred extensively in temperate and tropical coastal waters all over the world during the 1970s–2000s [3,5,6]. The golden tides induced by Sargassum mostly took place in the Sargasso Sea, Gulf of Mexico, and Caribbean Sea [1,7], while recently they have intruded into the west coastline of the northern and tropical Atlantic Ocean, and even further to the coasts of western Africa and northern Brazil in the southern Atlantic Ocean [1,8,9,10,11,12]. Despite the different vulnerable locations of these two ecological disasters due to the different characteristics of Ulva and Sargassum, it is surprising to find the concurrence of both seaweed tides in the Yellow Sea of China [13,14].
Before 2007, several gathering events of green macroalgae had occurred in China; however, these were small in scale. The large-scale green tides detected in 2007 appeared near the northern coastline of Jiangsu Province, but they did not draw much attention [15,16]. The next year, in 2008, an enormous green tide inundated the coastal waters of Qingdao, threatening the Olympic sailing regatta [17]. Since then, large-scale green tides have recurred annually from spring to summer in the Yellow Sea, with a maximum coverage area of 2100 km2 [2,3,15,17,18,19,20], and it has been recognized as the largest green tide in the world in terms of the distribution, the coverage, and the biomass of the green macroalgae [17,18]. It was found by remote sensing that the green tide was tracked back to the Subei Shoal in the southwestern Yellow Sea [15,17,21,22,23,24,25,26], and further field surveys indicated that the Ulva prolifera attached to the aquaculture rafts of Pyropia were scraped and discarded in situ, which was the primary source of the green tides in the Yellow Sea [18,20,27,28,29]. Some other green tides were reported in Qinhuangdao of Hebei Province, Yantai and Haiyang of Shandong Province, Xiamen of Fujian Province, Shantou and Zhanjiang of Guangdong Province, Haikou of Hainan Province, and Beihai of Guangxi Province, demonstrating that it is a nationwide ecological issue in China [2]. In particular, a local green tide happened in Jinmeng Bay, Qinhuangdao, in 2015, and was recurrent yearly thereafter every April to September [30,31]; the latest one, in August 2021, was studied in detail in this research.
When green tides occur, field surveys are the most direct measure of acquiring access to first-hand data in order to determine the cause of the disaster; however, they are expensive and time-consuming, and have a measuring point limitation unable to obtain the overall spatiotemporal variations of green tides in a study area [19]. Remote sensing is an effective means of monitoring the development of green tides, and scholars have used remote sensing to estimate the coverage and biomass of macroalgae blooms [32,33]. Nevertheless, remote sensing can be easily interfered with by bad weather conditions, such as clouds and fog over the sea [15]. Numerical simulation, e.g., with a Lagrangian particle-tracking model, is an economical and efficient tool to hindcast or predict the spatiotemporal variations in the locations and biomass of macroalgae. In the past decade, a number of numerical studies have been carried out to investigate the sources, trajectories, and destinations of the drifting macroalgae in the Yellow Sea [21,34,35,36,37,38,39], while no numerical modeling research has been implemented in the green macroalgae blooms in Jinmeng Bay, Qinhuangdao, which forms the major content of this paper.
Since field observations and measurements have been carried out in Jinmeng Bay, which are costly and time-consuming, a rapid pre-warning system based on numerical modeling is desirable for the disaster management of green tides. Compared with the Subei Shoal and the extensive Yellow Sea, Jinmeng Bay is a region of a relatively smaller scale in addition to a highly developed coast with multiple artificial structures, e.g., Lianhua Island, Hailuo Island, and submerged breakwaters [2,31]. These structures create low-energy semi-enclosed waters with a long water exchange time, which is unfavorable for the dispersion of nutrients or temperature, which have been proven to be the control factors of the intensity of the green tides in the Yellow Sea [20,27,40]; therefore, it is worth investigating the effect of these structures on the migration of the green macroalgae in Jinmeng Bay. Wind plays a vital role in the migration of macroalgae, not only driving the surface currents but also exerting a direct momentum on the macroalgae by friction which is defined as windage or leeway [35,41], and thus is another emphasis in this research. Different from the green tides in the Yellow Sea and the golden tides in the Atlantic Ocean, in which the macroalgae are floating on the sea surface, the green macroalgae in Jinmeng Bay were suspended throughout the water column. Therefore, the macroalgae particles in this model are cast randomly vertically and the depth-averaged currents are redistributed vertically using theoretical velocity profiles to move the particles. This paper is organized as follows: Section 2 introduces the background of the study area, the hydrodynamic model, the particle-tracking model, and the validation of these two models. Section 3 shows the model results of the hydrodynamics and the spatiotemporal distribution of the green tide that occurred in August 2021, in Jinmeng Bay. Section 4 discusses the influence of winds and artificial structures on green tide distribution, the sensitivity analysis of the effect of wind, and the future improvement of the models. Section 5 concludes the whole paper.

2. Materials and Methods
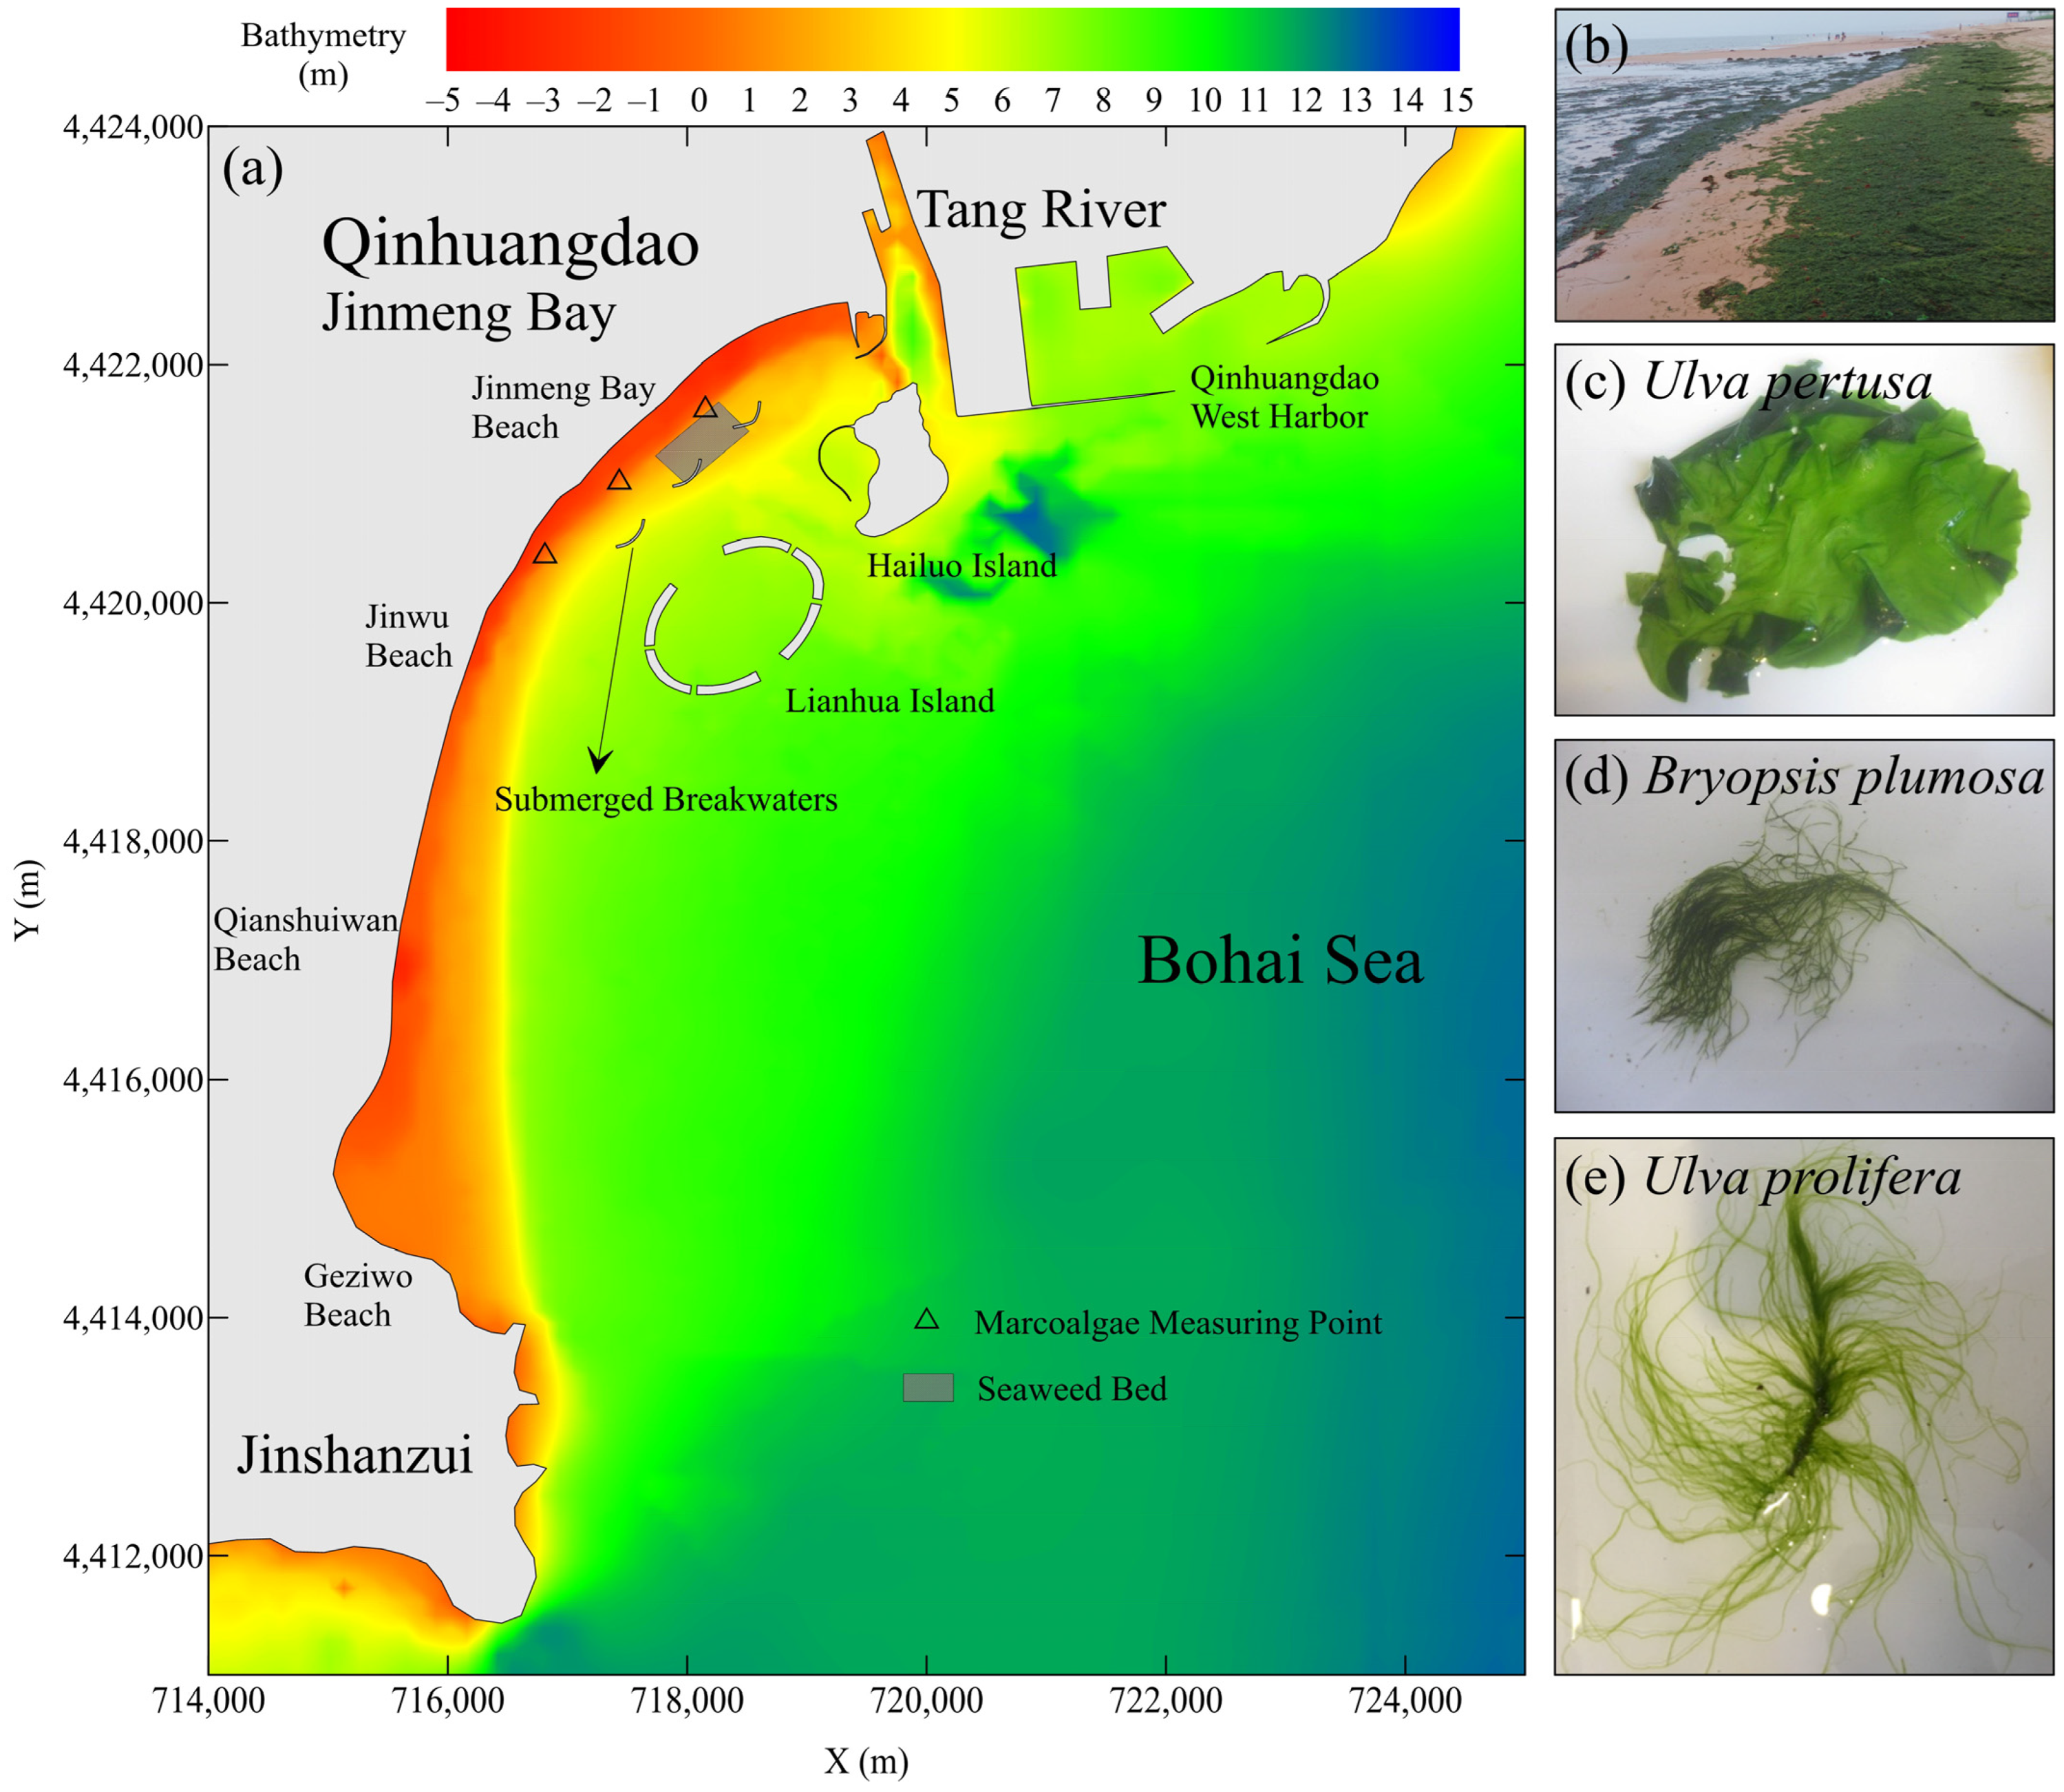
2.1. Study Area

Green tides have recurred annually from April to September since 2015 in Jinmeng Bay, Qinhuangdao, which is located on the west coast of the Bohai Sea; additionally, massive green macroalgae were stranded on the Jinmeng Bay beach, and they extended rapidly to the Tang River Estuary in the north and the nearby beaches in the south, i.e., Jinwu Beach, Qianshuiwan Beach, and Geziwo Beach (Figure 1a). Despite the less-affected coverage of green tides in Jinmeng Bay, i.e., approximately 3–4 orders lower than that of the Yellow Sea green tides [2], they also severely deteriorated the marine environment and affected local tourism. The macroalgae were confined within the photic area of the shallow intertidal and subtidal waters, which mainly did not extend beyond Jinmeng Bay, and they were distributed throughout the water column [30,31]; hence, they are distinct from the floating macroalgae in the Yellow Sea, which originated from the Subei Shoal and drifted offshore to the Yellow Sea, the East China Sea and Shandong Peninsula, and even to Jeju Island and the west coast of Korea [35,38]. By analyzing the molecular identification results and the morphological characteristics of the macroalgae in Jinmeng Bay, it is confirmed that Ulva pertusa, Bryopsis plumosa, and Ulva prolifera (Figure 1c–e) are the major species in the green tides, which can be divided into three evident development phases: phase I is from late April to mid-May, with low biomass of the dominant species, Ulva pertusa; phase II is from mid-May to mid-June, when the dominant species, Bryopsis plumosa, proliferates intensively; and phase III is from mid-June to September, with the dominant species being Ulva prolifera [30,31]. As shown in Figure 1a, there are multiple artificial structures in Jinmeng Bay, such as Lianhua Island, Hailuo Island, and three submerged breakwaters about 600 m offshore, which impede the water exchange between the semi-enclosed waters surrounded by these structures and the outer waters. As a result, nutrients are difficult to disperse, making the coastal waters eutrophic and suitable for the production of macroalgae. Furthermore, these structures provide an adhesion substrate for the micropropagules of macroalgae, and field surveys indicate that the naturally occurring seaweed bed (the rectangular shadow area in Figure 1a) is the primary original source of the green tides, which are independent from the Yellow Sea green tides [2,31]. As in previous years, a macroalgae bloom event occurred in August 2021 (Figure 1b), which is the height of the tourist season; thus, it hampered the development of local tourism. In this research, the green tide in August 2021 was selected as the case to investigate the migration pattern of the green macroalgae in Jinmeng Bay.

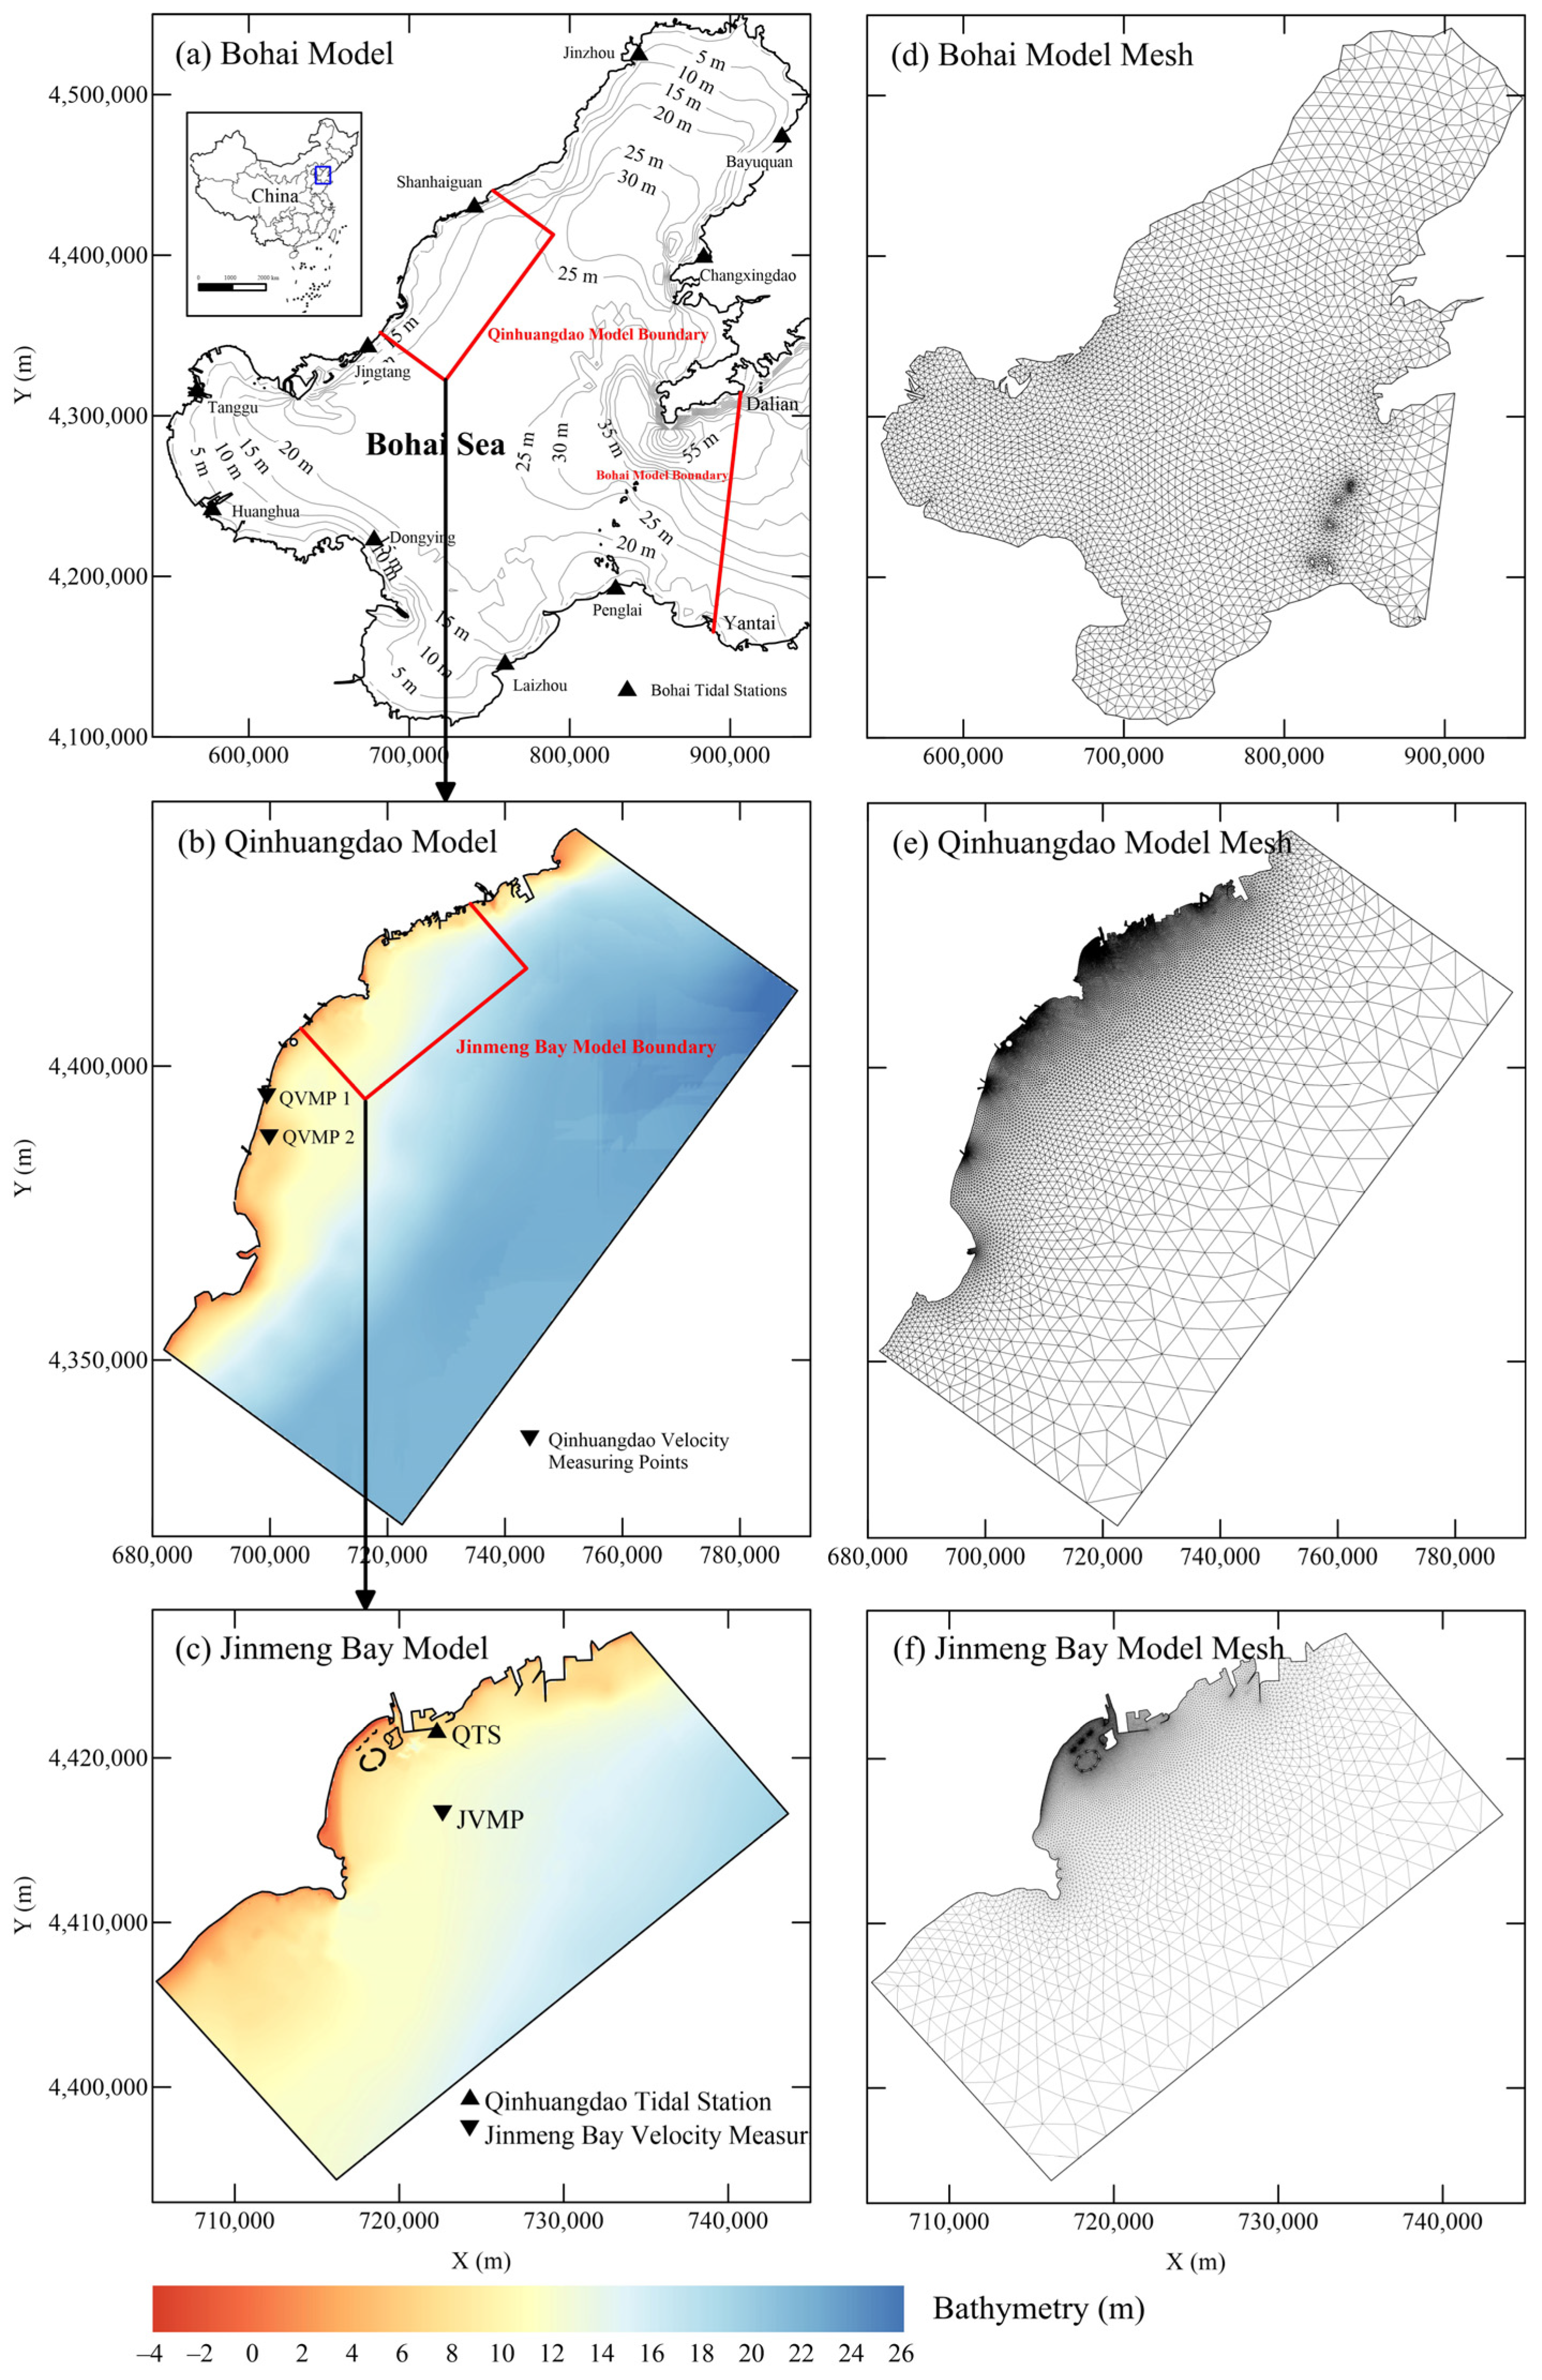
2.2. Hydrodynamic Model

The Lagrangian particle-tracking model used to simulate the migration process of green macroalgae is based on the currents calculated by a hydrodynamic model. The hydrodynamic model was established by applying the integrated numerical model package MIKE21, developed by the Danish Hydraulic Institute (DHI) [42], which is applicable to rivers, lakes, estuaries, bays, and coastal waters. Given that the coverage area of green tides is restricted to the shallow intertidal and subtidal zones, a 2DH model mesh is adequate to simulate the hydrodynamics of the study area, considering the balance of computational speed and model precision in Qinhuangdao [43,44]. The hydrodynamic control equations are based on the incompressible Navier–Stokes equations in view of the Boussinesq assumption and hydrostatic assumption. The computational mesh used in this research was an unstructured triangular mesh with the spatial discretization adopting the cell-centered finite volume method. The continuity and momentum equations are converted into the nonlinear shallow water equations by integrating them over depth, and the 2DH equations are shown as follows:
h t + h u x + h v y = h S
h u t + h u 2 x + h v u y = f v h g h η x h ρ 0 p a x g h 2 2 ρ 0 ρ x + τ s x ρ 0 τ b x ρ 0 F u + h u s S
h v t + h u v x + h v 2 y = f u h g h η y h ρ 0 p a y g h 2 2 ρ 0 ρ y + τ s y ρ 0 τ b y ρ 0 F v + h v s S
where t is the time; x and y are the Cartesian coordinates; u and v are the depth-averaged velocity components in the x and y directions; h is the sum of the still water depth, d , and the time-varying water level, η ; S is the discharge of the point sources; f is the Coriolis parameter related to the angular velocity of Earth’s rotation and the geographic latitude; g is the gravitational acceleration; ρ is the water density; ρ 0 is the reference water density; p a is the atmospheric pressure; τ s x and τ s y are the surface stresses induced by wind; τ b x and τ b y are the bottom stresses; F u and F v are the horizontal tress terms due to eddy viscosity; and u s as well as v s are the discharge velocities of the point sources.
The effect of wind is considered as one of the most important factors affecting the macroalgae drifting, which includes the wind-driven current and the direct frictional drag on the surface-floating macroalgae (defined as windage or leeway) [35,37,39,41]. The wind-driven current is calculated through τ s = ( τ s x , τ s y ) in the momentum Equations (2) and (3), which is given by:
τ s = ρ a c f | u w | u w
c f = { c a u w < w a c a + c b c a w b w a ( u w w a ) w a u w < w b c b u w w b
where ρ a is the air density; c f is the wind drag coefficient; u w is the wind vector 10 m above the sea surface and u w is the scalar form of u w ; c a , c b , w a , and w b are empirical factors and the default values for the empirical factors are specified as c a = 0.001255 , c b = 0.002425 , w a = 7 m/s, and w b = 25 m/s.
The hydrodynamic model included three parts with different scales, i.e., the Bohai model (large scale), Qinhuangdao model (medium scale), and Jinmeng Bay model (small scale), as shown in Figure 2. A triple-level scheme of meshes with different refinements and scales was used, considering the balance of modeling efficiency and accuracy. The Bohai, Qinhuangdao, and Jinmeng Bay models were discretized by 2DH triangular unstructured meshes with 6304 elements, 34,071 elements, and 25,503 elements, respectively, based on the Gauss–Kruger projection coordinates of the Beijing 54 Coordinate System with the central meridian of 117E. The Bohai model was forced by the time series of the tidal level in Dalian and Yantai (two ends of the red line boundary in Figure 2) from the tidal table of the National Marine Data and Information Service of China. The Qinhuangdao model was driven by the time series of the water level, and the current speed and direction extracted from the computational results of the Bohai model along three open boundaries. In the same way, the Jinmeng Bay model was driven by three open boundaries with the time series of the water level, and the current speed and direction from the Qinhuangdao model. The computational time step was set during an automatic adjustment range from 0.001 to 30 s to meet the Courant–Friedrich–Lewy (CFL) condition with a limited value of 0.8. The Manning number, which controls the bed friction (or bottom stresses), ranged from 70 to 90 in this model, based on the previous studies of our research team [44,45,46]. The 10 m height wind speed and direction used to calculate wind stress were derived from the ERA5 dataset of the European Centre for Medium-Range Weather Forecasts (ECMWF).

2.3. Particle-Tracking Model

The macroalgae migration process is simulated by a particle-tracking model based on the Lagrangian method, and the macroalgae are regarded as discrete particles. The resulting equation, accounting for currents and random dispersion, is written as:
X t + Δ t = X t + V ( X t , t ) Δ t + Δ X r
where X = ( x , y ) is the position of each particle at time t ; V is the current vector at the position of each particle at time t ; Δ X r is the horizontal random dispersion for particle motion; and Δ t is the calculation time step.
As mentioned before, the drifting velocity of floating macroalgae contains the current velocity calculated from the hydrodynamic model and the windage-induced velocity, which is expressed by the 10 m height wind speed multiplied by a windage coefficient. The equation of the drifting velocity of macroalgae is shown as follows:
V = v + ( κ V w )
where v is the current vector derived from the hydrodynamic model, κ is the windage coefficient, and V w is the 10 m height wind vector. The brackets denote that the second term of windage is included for surface-floating macroalgae and excluded for submerged macroalgae.
As opposed to the floating green macroalgae in the Yellow Sea, the macroalgae in Jinmeng Bay were spread throughout the water column. In this research, the calculation mesh of the 2DH model applied a single layer vertically, and therefore a theoretical velocity profile was applied for the vertical redistribution of the current velocity. The velocity profile took into consideration smooth flow and rough flow. Smooth flow included a sub-layer where viscosity controlled the momentum transport and a super-layer where turbulence controlled the same aspect; the sub-layer thickness ( δ ) was more than the bed roughness height ( z 0 ). However, for rough flow the viscous sub-layer was extremely thin and less than the bed roughness height, so only the super-layer velocity profile was taken into consideration. The velocity profile equations for smooth flow ( δ > z 0 ) are shown as follows:
| v | = { u * κ ln ( z z 0 ) , z δ u * 2 z ν , z < δ
where u * is the friction velocity; κ is the von Karman constant, and usually taken as 0.4; z is the vertical coordinate; and ν is the kinematic viscosity.
The velocity profile equations for rough flow ( δ < z 0 ) are shown as follows:
| v | = { u * κ ln ( z z 0 ) , z z 0 0 , z < z 0
Turbulence-induced dispersion is also included in the particle-tracking calculation by adding a horizontal random dispersion term, Δ X r , in Equation (6), and the expression of Δ X r is shown as follows:
Δ X r = a R 2 K r Δ t
where a is a horizontal unit vector with a random direction; R is a random number following standard normal distribution; and K r is the dispersion coefficient, which is specified as 2 m2/s in the model.
The particle-tracking model applies the same computational mesh as the hydrodynamic Jinmeng Bay model (Figure 2c). The current vectors used for the particle position calculation were from the results of the hydrodynamic model. The duration of the model computation was the whole month of August 2021, when the green tide investigated in this research happened, and the computational time step was specified as 60 s. The particles were cast randomly vertically, and the merged particles were driven by currents solely while the surface particles drifted under the combined action of currents and windage. The windage coefficient, κ , is a key parameter affecting the drift of floating matters, which has been investigated by many scholars [39,47,48,49,50,51] and is set as 3.2%, referring to [39].

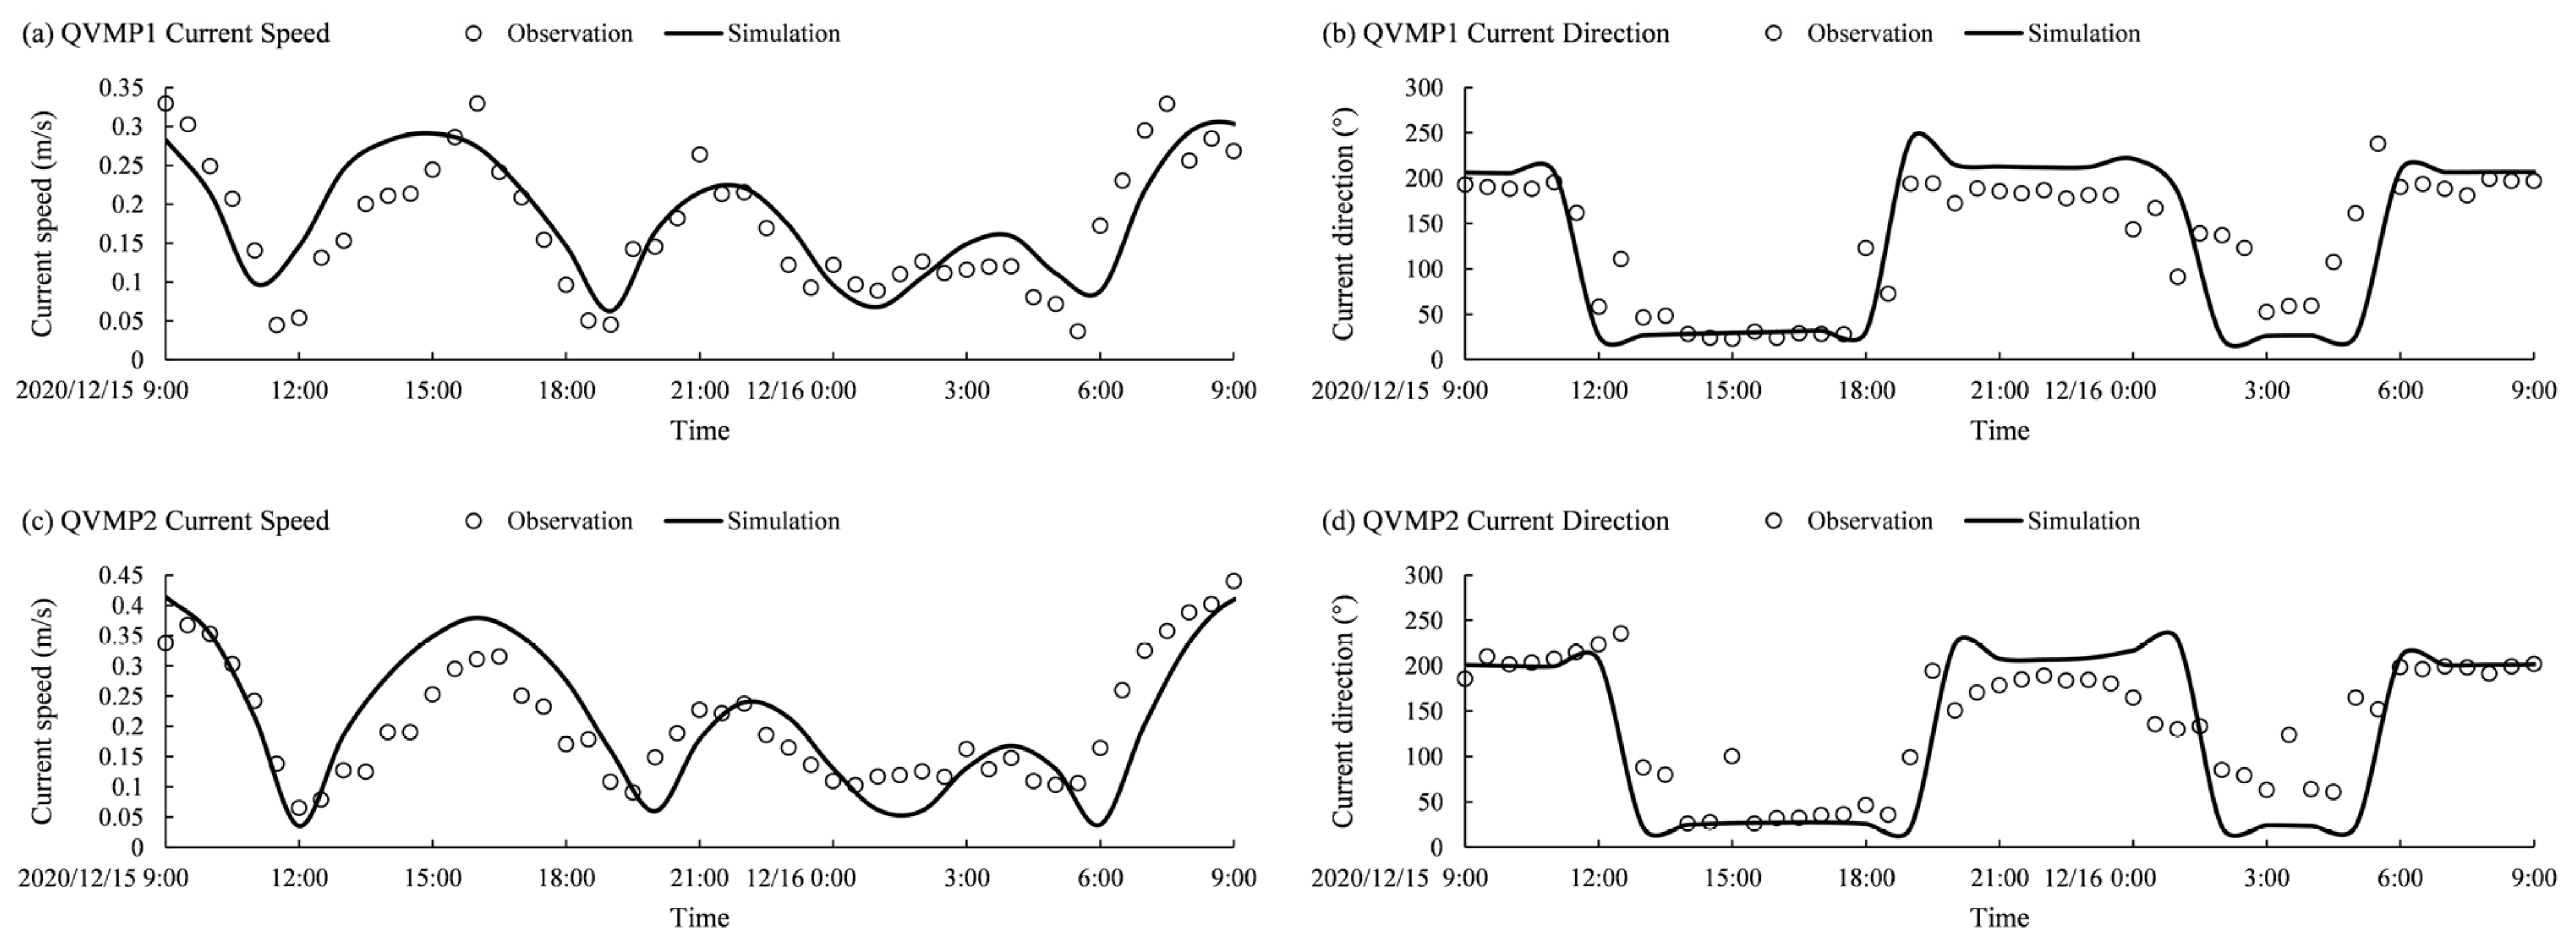
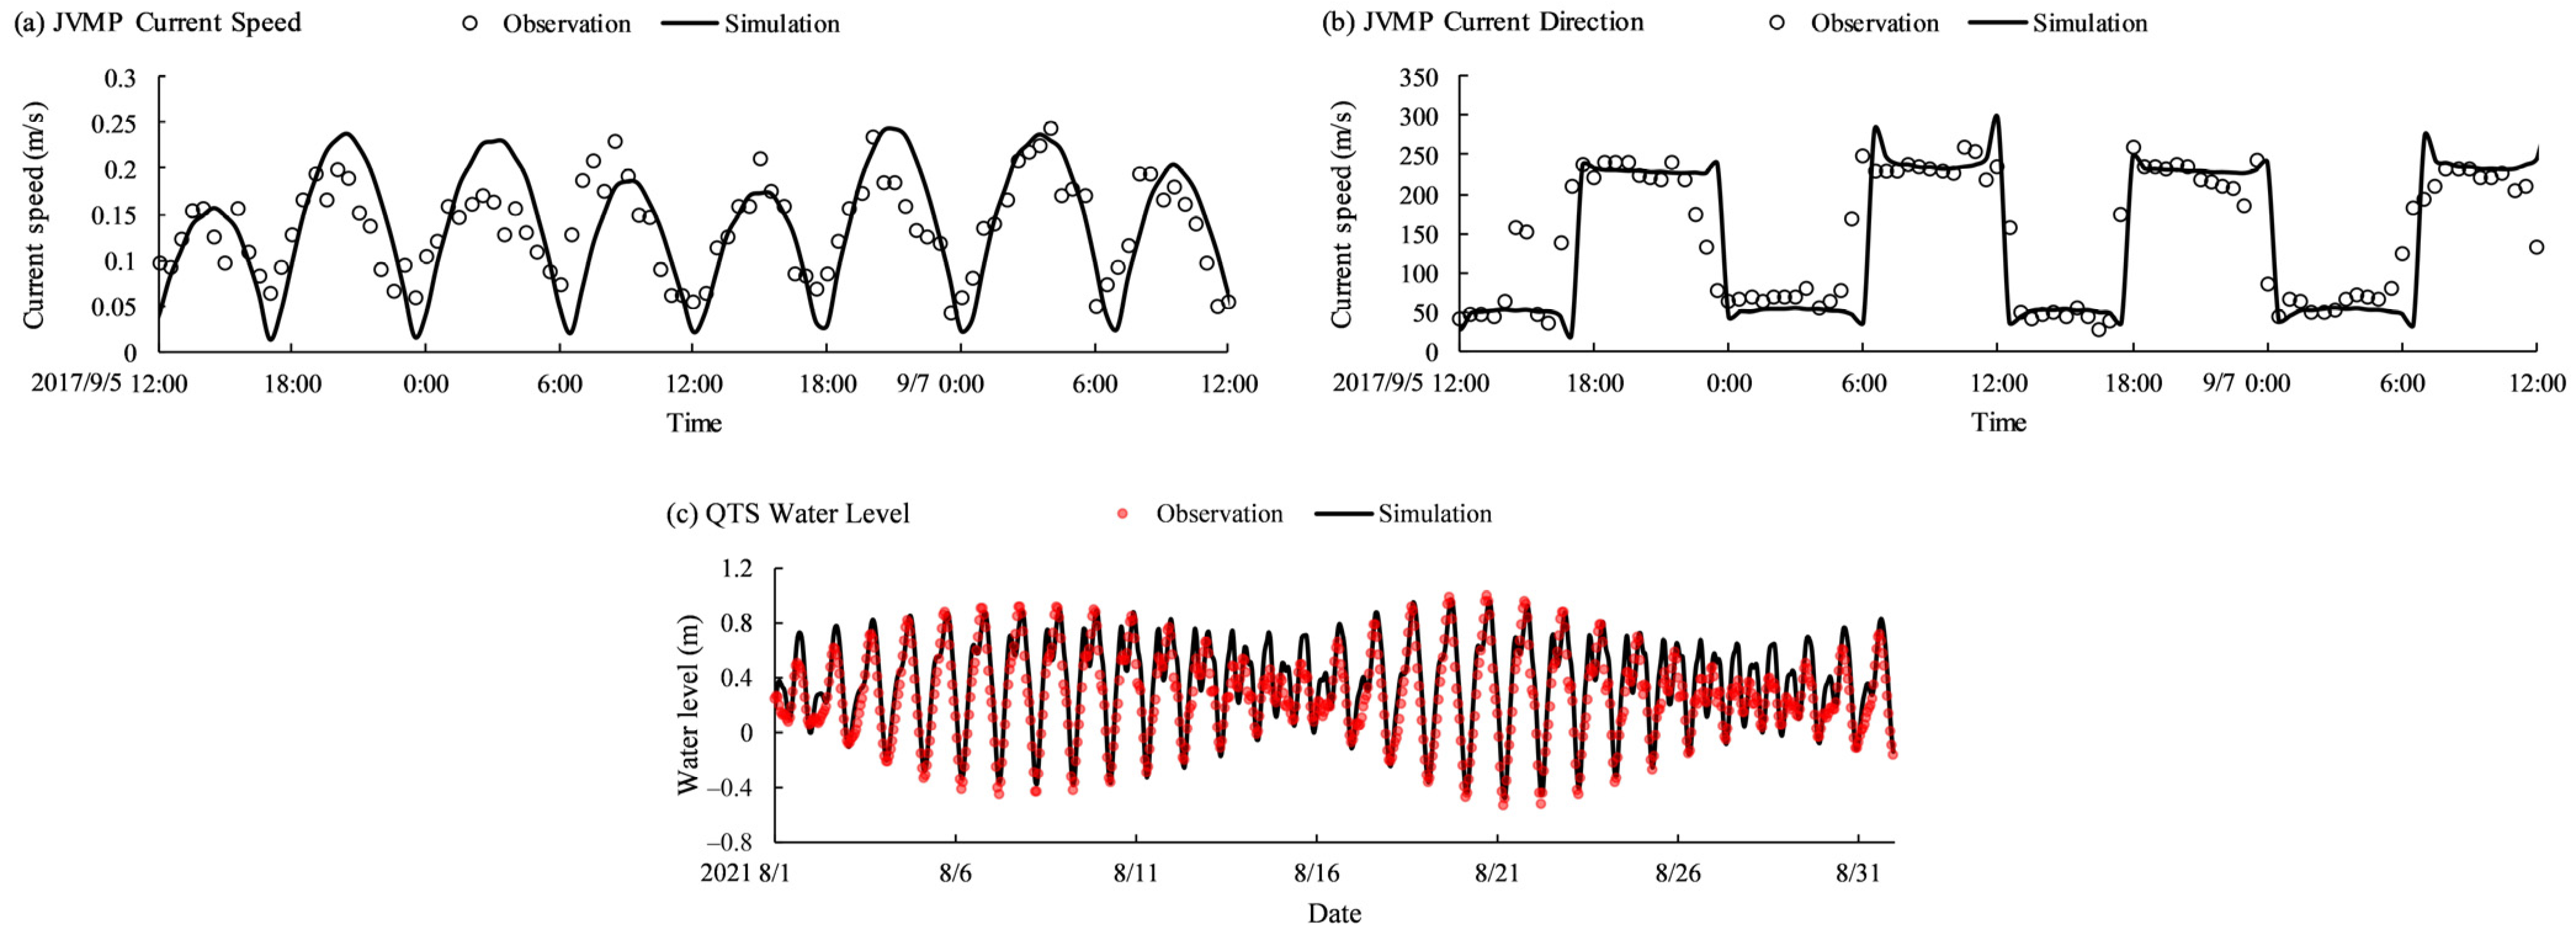
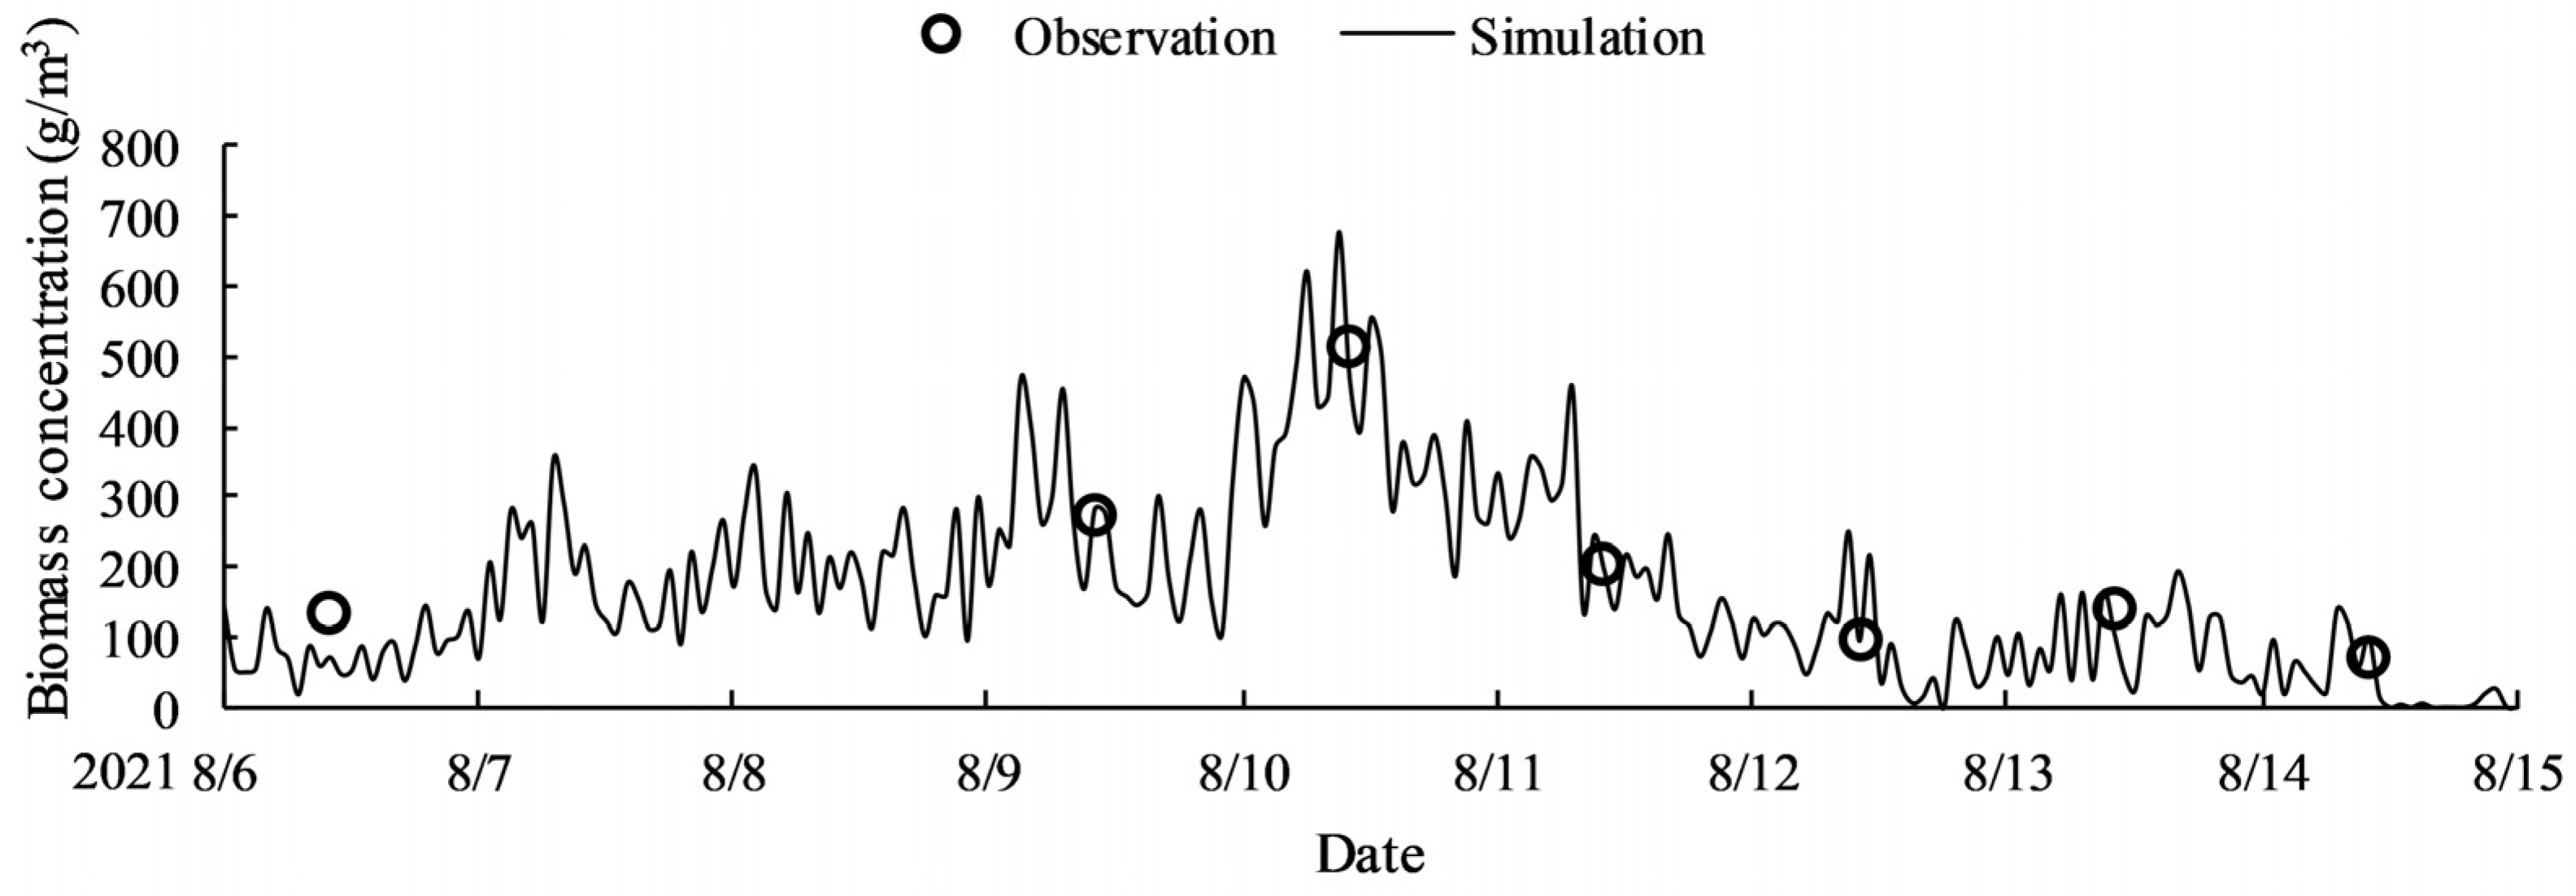
2.4. Model Validation

The hydrodynamic performance of the large, medium, and small models (i.e., Bohai, Qinhuangdao, and Jinmeng Bay models, respectively) was validated against the observed data, including the tidal amplitude and phase, and the time series of the water level, and current speed and direction. For the Bohai model, the tidal amplitude and phase of four major tidal constituents, M2, S2, K1, and O1, at 10 tidal stations around the Bohai Sea land boundary (Figure 2a) were evaluated by the method proposed by Foreman et al. (1993), which is shown as follows:
D i f f = ( a o cos g o a m cos g m ) 2 + ( a o sin g o a m sin g m ) 2
where a is the tidal amplitude and g is the tidal phase. Subscripts o and m represent the observed and modeled values, respectively. The calculated values of D i f f are listed in Table 1, in which the average values of D i f f for M2, S2, K1, and O1 are 8.03 cm, 1.75 cm, 2.60 cm, and 1.91 cm, respectively, and were reasonable compared with previous studies [46,52,53].
For the evaluation of the Qinhuangdao model, the time series of the observed current speed and direction from 9:00 15 December 2020, to 9:00 16 December 2020, at two measuring points, i.e., QVMP1 and QVMP2, were compared with the simulated values extracted from the model. The skill model was employed for quantifying the model’s performance [54]; the equation of skill is shown as follows:
s k i l l = 1 | X m X o | 2 ( | X m X o ¯ | + | X o X o ¯ | ) 2
where X is the given variable to be validated and the overbar denotes the average operator. The subscripts m and o denote the modeled and observed values. A skill value of 1, 0.65–1, 0.5–0.65, 0.2–0.5, and 0–0.2 indicates that the model performance is perfect, excellent, very good, good, and poor, respectively. As shown in Figure 3, the simulated current speed and direction at QVMP1 and QVMP2 fit well with the observed values. The skill values of the current speed and direction at QVMP1 are 0.88 and 0.90, respectively, and those at QVMP2 are 0.98 and 0.97, respectively, which indicate the excellent performance of the Qinhuangdao model.
As for the Jinmeng Bay model, the observed and simulated values for the current speed and direction from 12:00 5 September 2017, to 12:00 7 September 2017, at the measuring point JVMP, and the water level during August 2021, at the tidal station QTS were compared, as shown in Figure 4. The skill values of the current speed and direction at JVMP and the water level at QTS are 0.88, 0.90, and 0.94, respectively, which indicate the excellent hydrodynamic performance of the Jinmeng Bay model.
In order to evaluate the particle-tracking model in the Jinmeng Bay domain, which shares the same computational mesh with the hydrodynamic model of Jinmeng Bay, the recorded average biomass concentration at three measuring points (Figure 1a) was compared with the simulated values, as shown in Figure 5. The simulated biomass concentration was calculated as the macroalgae particles with biomass divided by each computational grid volume. The skill value of the macroalgae biomass concentration for the particle-tracking model was 0.98, representing excellent model performance. In general, the hydrodynamic model and the particle-tracking model in this research are reliable for the following investigations.

3. Results

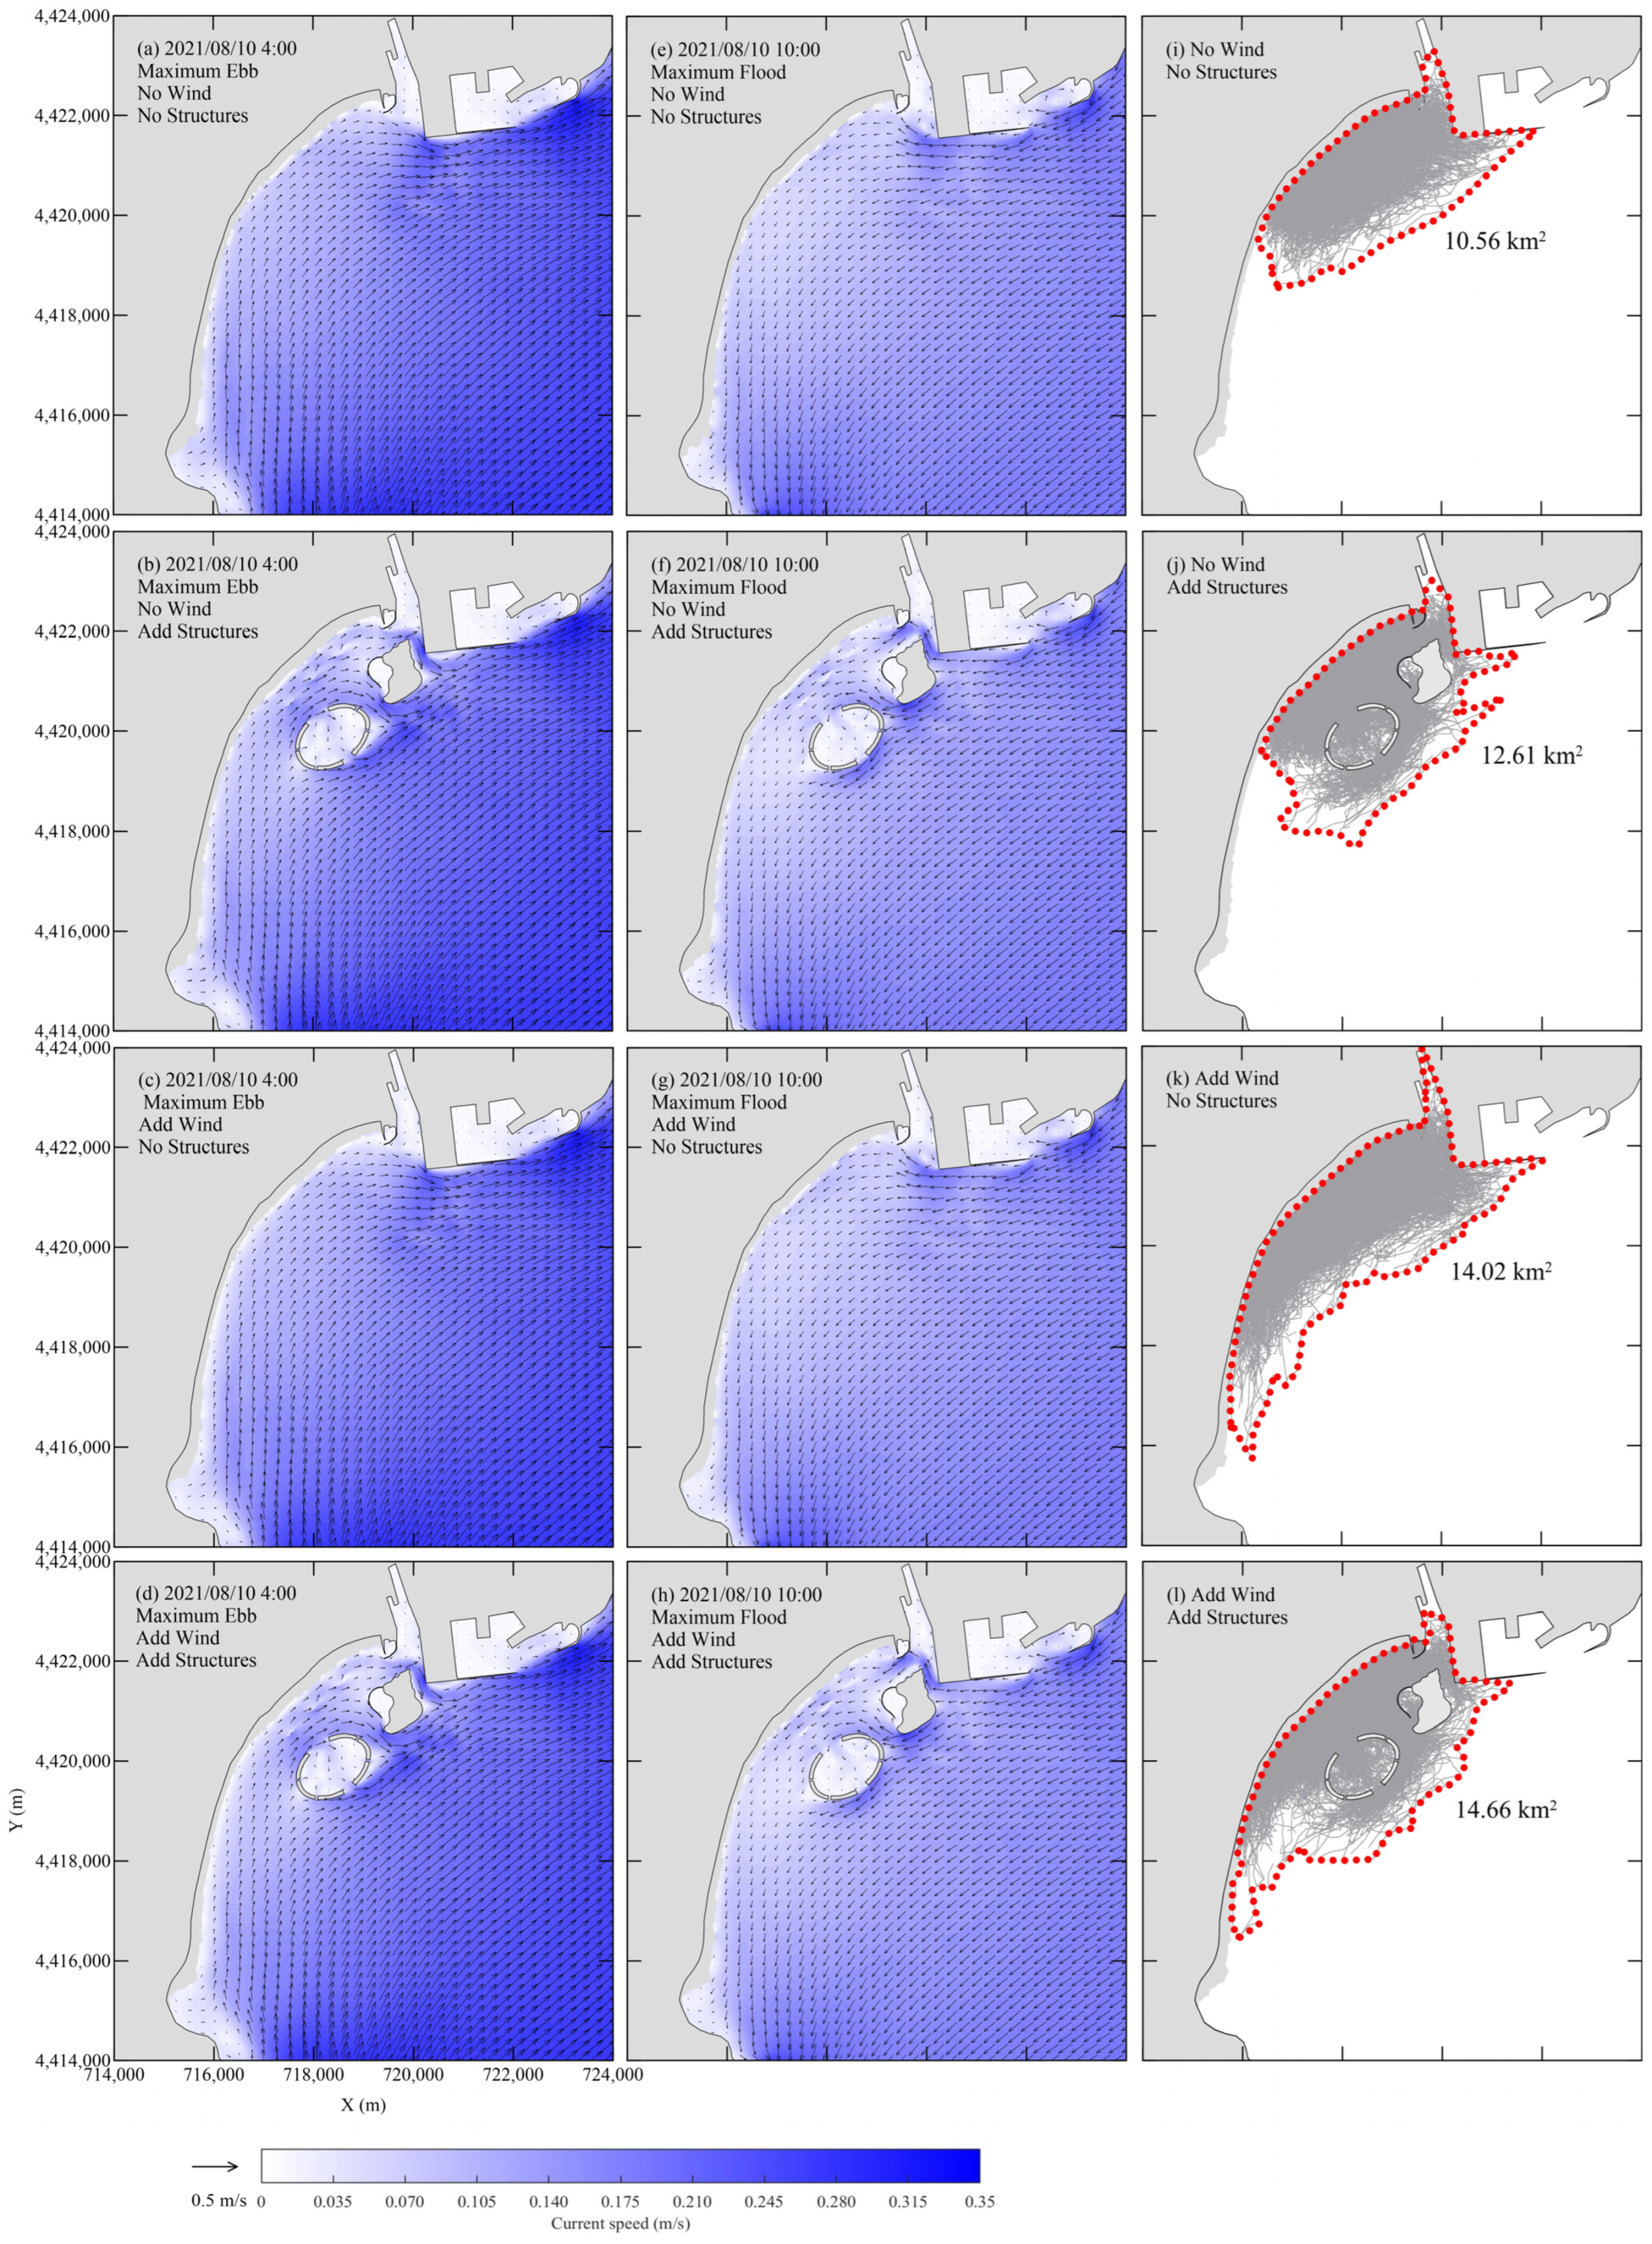
3.1. Hydrodynamic Characteristics

The hydrodynamic data from the well-established hydrodynamic model are essential for the particle-tracking modeling of the green macroalgae, because tidal currents are the fundamental driving force of the macroalgae drifting. In order to obtain a general sense of the Bohai Sea tidal environment, which provides the outer tidal energy for the detailed study area at Jinmeng Bay, four cotidal charts of M2, S2, K1, and O1 are provided by harmonic analysis, as shown in Figure 6. The semi-diurnal constituents of M2 and S2, and the diurnal constituents of K1 and O1, are the four primary constituents accounting for most of the tidal energy in the Bohai Sea, which is derived from the tidal waves in the Yellow Sea. As shown in Figure 6a, two anticlockwise amphidromes are formed under the Coriolis force of the Northern Hemisphere, with one amphidromic point near the coast of Qinhuangdao and another near the Yellow River estuary. According to the amplitude of different locations in the Bohai Sea, the descending order is listed as Liaodong Bay in the north, Bohai Bay in the west, Bohai Strait in the east, and Laizhou Bay in the south. Because M2 is the strongest tidal constituent, the two amphidromic points near the Qinhuangdao coast and the Yellow River estuary make these two areas low-energy zones in terms of hydrodynamics. In Figure 6c, only one amphidromic point appears in the Bohai Strait, which means that this location has the smallest amplitude, and for the other three locations the descending order is the same as M2, i.e., Liaodong Bay > Bohai Bay > Laizhou Bay. The cotidal charts of S2 and O1 present similar patterns to M2 and K1, respectively, with minor changes in amphidromic point locations, but with smaller amplitudes. The simulated cotidal charts of the Bohai Sea in this research correspond to results obtained by other scholars, and further prove that the hydrodynamic model is reliable for particle-tracking modeling [46,55,56,57,58]. It is concluded that the amphidromic point of M2 near the Qinhuangdao coast causes this to be an area with low tidal energy, which is not helpful for nutrient dispersion and the migration of green macroalgae.
In order to seize the hydrodynamic characteristics in more detail locally within the coastal waters of Jinmeng Bay, the current fields of a representative spring tidal cycle on 10 August 2021, for the moments of flood slack, maximum ebb, ebb slack, and maximum flood are presented in Figure 7. From the time series of the water level at the measuring point JVMP during August 2021 (Figure 7f), it demonstrates that the tides in the Jinmeng Bay area are of a regular diurnal type. From the time series of the current speed and direction at JVMP from 00:00 9 August 2021, to 00:00 11 August 2021, it demonstrates that the tidal currents in the Jinmeng Bay area are of a regular semi-diurnal type. The currents present a reciprocating pattern in the SW–NE direction substantially parallel to the isobath, the flood current is in the SW direction, and the ebb current is in the NE direction. At the moments of flood slack and ebb slack, the current speed is generally small in the study area, except for some patches near Lianhua Island and Hailuo Island. Even at the moments of maximum flood and ebb, the largest current speed is less than 0.3 m/s at the farthest point offshore. The nearshore area enclosed by artificial structures presents a lower current speed, but at the narrow channels on the northeast and southwest side of Hailuo Island enhanced currents appear due to the constraining effect of the channels. In general, the hydrodynamic environment in the Jinmeng Bay waters is low-energy, and, as it is additionally surrounded by multiple artificial structures, it is adverse for water exchange and thus the dispersion of nutrients.

3.2. Spatiotemporal Distribution of the Green Tide

As shown in Figure 5, the biomass concentration of the green macroalgae in Jinmeng Bay peaked on 10 August 2021, and therefore one tidal cycle on this day, which is the same as in Figure 7, from 01:00 10 August 2021, to 13:00 10 August 2021, is selected to display the spatiotemporal distribution of the green tide. Figure 8a–e show that the green macroalgae particles drift along with the currents, i.e., they move in the NE direction along with the ebb currents and in the SW direction along with the flood currents. During the tidal cycle period, the green macroalgae particles are distributed substantially within the semi-enclosed waters surrounded by the artificial structures. In Figure 8c–e, after the moment of ebb slack, a large number of green macroalgae particles are driven first by the enhanced ebb currents in the channel on the southwest side of Hailuo Island out of the semi-enclosed waters to the southeast, and then drift with the flood currents near the outer side of Lianhua Island to the southeast. Likewise, the enhanced currents in the channel on the northeast side of Hailuo Island also transport the macroalgae out of the semi-enclosed waters, but with fewer amounts than the southwest channel. The biomass concentration distributions of the green macroalgae from 01:00 10 August 2021, to 13:00 10 August 2021, are shown in Figure 8f–j, and they present similar patterns to the distributions of the green macroalgae particles, due to the computational method by which the particles with biomass are divided by the corresponding grid volume containing them. The spot-like patches of high biomass concentration appear near the coastline on Jinmeng Beach, which is consistent with the field observation. Although some green macroalgae particles appear within Lianhua Island and out of the semi-enclosed waters, the biomass concentration is negligible. Figure 8k shows the trajectories of the green macroalgae particles during August 2021, and it indicates that the green tide in August 2021 extended eastward to Qinhuangdao West Harbor and westward to Qianshuiwan Beach.

4. Discussion

4.1. Influence of Winds and Artificial Structures on Green Tide Distribution

The effects of winds and artificial structures are the two key factors for the migration of the green macroalgae, apart from the tidal currents in the coastal waters in Jinmeng Bay. In order to figure out the contributions of winds and structures to the green tide transport process, the current fields with or without winds and structures in addition to the trajectories of the macroalgae with or without winds and structures are shown in Figure 9. Comparing Figure 9a,e and Figure 9c,g, it is found that the effect of wind plays a minor role in changing the current fields. Comparing the current fields with structures and without structures (Figure 9a,b,e,f), it can be seen that the structures cause the current speed in some areas of the semi-enclosed waters to slow down, while they also enhance the current speed in some other locations, e.g., the channels on the northeast and southwest side of Hailuo Island in addition to the southeast sides of Hailuo Island and Lianhua Island. Comparing Figure 9i,j and Figure 9k,l, the coverage of the green macroalgae trajectories increases significantly: by 33% under the effect of wind in the conditions without structures, and by 16% in the conditions with structures. As mentioned before, the semi-enclosed waters surrounded by the artificial structures are a low-energy environment, which is seemingly not helpful for macroalgae transport. However, the coverage of the green macroalgae trajectories increases by 19% and 5%, respectively, affected by the setting of the structures (Figure 9i,j,k,l), which is smaller than the effect of wind. This may be due to the enhanced currents in the channels on the northeast and southwest sides of Hailuo Island, as well as those on the southeast sides of Hailuo Island and Lianhua Island, which transport the green macroalgae further out of the semi-enclosed waters. However, the biomass concentration out of the semi-enclosed waters is very low, as stated in Section 3.2, and the coverage under the ‘no structures’ condition extends further northeastward and southwestward. In general, it is concluded that the effect of wind is the major factor controlling the migration of the green tide distribution.

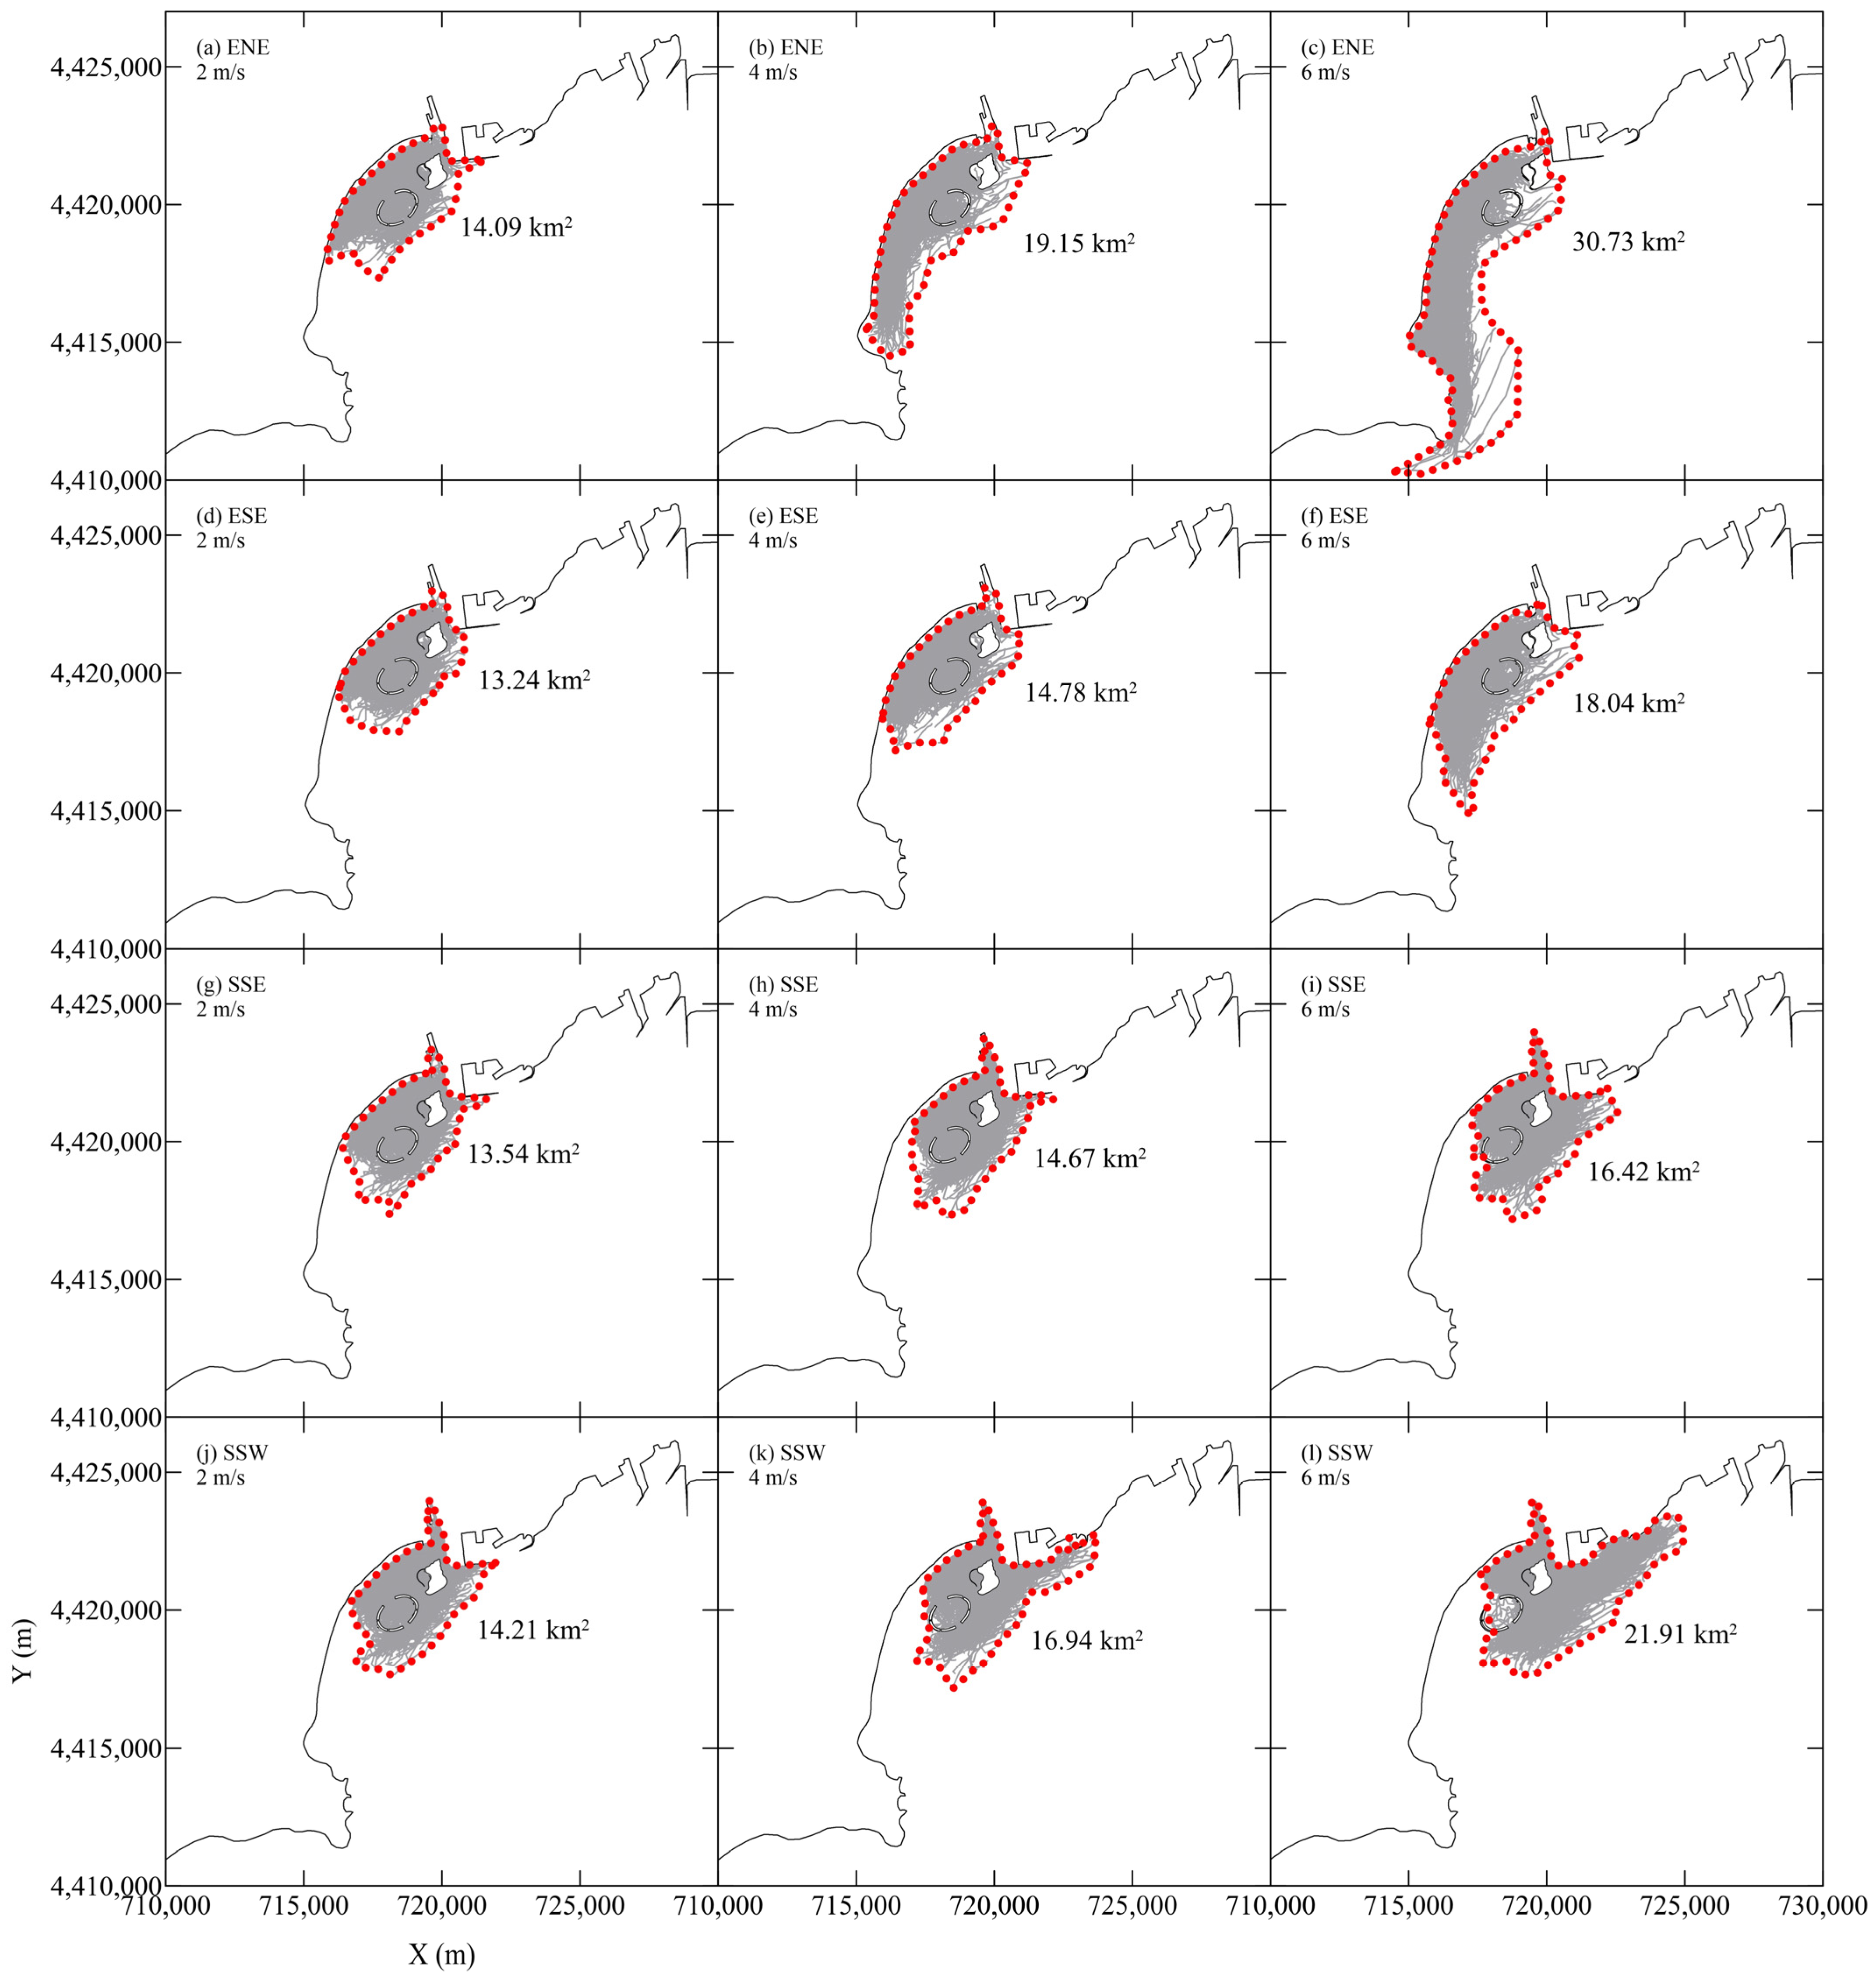
4.2. Sensitivity Analysis of Wind Effect on Green Tide Distribution

The effect of wind on the green tide distribution is composed of two components, one of which are the currents induced by winds and the other is the direct momentum transported from winds by friction (windage or leeway) [35,41]. In previous studies, windage was a crucial factor for the modeling of macroalgae migration, in which the algae were mostly floating on the sea surface [35,37,38,39,41,59]. In this research, the green macroalgae were suspended throughout the water column, which is distinct from the green tides in the Yellow Sea and the golden tides in the Atlantic Ocean. Therefore, the macroalgae particles are placed randomly vertically, and the depth-averaged currents are redistributed vertically using the theoretical velocity profile to move the particles. As concluded in Section 4.1, the effect of the wind is the major factor controlling the migration of the green tide distribution, and thus the sensitivity analysis of the effect of wind is carried out in this section to investigate the quantitative coverage of the green tide distribution under winds with different magnitudes and directions.
Figure 10 shows the wind rose based on the wind data during the third quarter of 2021 in Jinmeng Bay, when the green tide happened. The winds with a direction from ENE to SSW accounted for 60% of all the counted records, and those with a magnitude below 6 m/s accounted for 96% of all the counted records. Hence, the sensitivity analysis of the effect of wind was carried out for a one-month computation covering the whole green tide event, with wind magnitudes of 2 m/s, 4 m/s, and 6 m/s, respectively, and wind directions of ENE, ESE, SSE, and SSW, respectively; the results of the coverage of green macroalgae trajectories under the winds with different magnitudes and directions are shown in Figure 11. It can be seen that the coverage of green macroalgae trajectories under all wind directions (ENE, ESE, SSE, and SSW) increases with the augmentation of wind magnitude, and that the maximum coverage is 30.73 km2 under 6 m/s wind in ENE. When the wind direction varies clockwise from ENE to SSW, the coverage of green macroalgae trajectories increases first and then decreases under all wind magnitude (2 m/s, 4 m/s, and 6 m/s), and the alongshore extent under 6 m/s wind in ENE is the largest, passing over the Jinshanzui headland.

4.3. Model Improvements Expected in the Future

This research is the preliminary modeling of the green tide that happened in Jinmeng Bay to determine its migration characteristics and the influencing factors; the physicochemical variables affecting the germination, reproduction, and extinction of the green macroalgae are not taken into consideration. It has been proven by many previous studies that the eutrophication of waters results in green tides due to the massive amount of nutrients derived from the discharge of effluent, agriculture, and aquaculture [2,15,18,60,61]. In fact, in addition to nutrients, some other pressure variables, such as temperature, irradiance, salinity, oxygen, density of sea water, distribution of chlorophyll, and so on, influence the characteristics of green tides in terms of their spatiotemporal distribution, habitats, and origins, as shown by the cruise surveys and cultivation experiments carried out by other scholars [19,40,62,63,64,65,66]. Hence, a comprehensive coupled model involving a hydrodynamic model and an ecological model (including a water quality model and a growth model for green macroalgae) should be established to simulate the physical–chemical–biological processes in green tides. Such coupled models have been developed and applied successfully by several researchers; however, they are suitable for single floating macroalgae types, such as Ulva prolifera [38,39] and Sargassum [59], and, therefore, a new coupled model with a growth model designed for the three dominant species (Ulva pertusa, Bryopsis plumosa, and Ulva prolifera) in Jinmeng Bay is expected to be developed in following studies, and it should also account for the vertical distribution of the green macroalgae in the water column. Additionally, a 3D computational mesh should be applied in the model to consider the vertical dispersion of macroalgae particles. In fact, the dispersion of the macroalgae is mostly induced by turbulence, which is expressed by a simplified equation (Equation (10)) in this research for the purpose of a rapid pre-warning of green tides in Jinmeng Bay. For more accurate modeling of the dispersion of macroalgae, an adequate turbulence model with a high-order numerical scheme [67] is expected to supplement the hydrodynamic model. It is known that the density difference can cause the formation of density currents, which is due to a property of the fluid (e.g., temperature or salinity) or by the sediment in suspension [68]. The excess of biomass in the water column can also change the water density, and thus induces density currents which should be considered in the improvement of the model in future work.

5. Conclusions

Green tides have been a cosmopolitan issue in recent decades that deteriorate the ecological environment and have caused tremendous economic loss. In this study, the migration process of a green tide event that happened in August 2021, in Jinmeng Bay, Qinhuangdao, China, was investigated using a particle-tracking model based on a hydrodynamic model. The hydrodynamic model applies three meshes with different refinements and scales for the domains of Bohai, Qinhuangdao, and Jinmeng Bay, respectively, and provides the results of currents for the particle-tracking model. The performance of these two models fits well with the field observation data, and thus is reliable for the hydrodynamic modeling and particle-tracking modeling of the green macroalgae in Jinmeng Bay.
From the hydrodynamic results of the model, it is concluded that amphidromic point M2 near the coastal waters of Jinmeng Bay causes this to be an area with low tidal energy, and the current field in the study area indicates that the semi-enclosed waters surrounded by multiple artificial structures are a low-energy hydrodynamic environment, which is not helpful for water exchange, and thus the dispersion of nutrients. From the results of the spatiotemporal distribution of the green tide, the macroalgae are distributed substantially within the semi-enclosed waters, and few are transported out with low biomass concentration due to the enhanced currents in the channels on the southwest and northeast sides of Hailuo Island. The effect of wind and the existence of artificial structures both increase the coverage of the green macroalgae trajectories, and the effect of wind plays the more important role. It is worth noting that, despite the increased coverage caused by artificial structures, the biomass concentration out of the semi-enclosed waters is very low, and the low-energy area within the semi-enclosed waters provides a favorable environment for nutrient deposition and macroalgae growth. The sensitivity analysis of the effect of wind concluded that the coverage of the green macroalgae trajectories reaches a maximum of 30.73 km2 under winds of 6 m/s in ENE. Lastly, the expected improvements of the model were discussed, considering the involvement of water quality and growth mechanisms of the green macroalgae. This research can provide useful reference information for the early warning and mitigation measures of green tides in Jinmeng Bay, in addition to other places suffering from green tides.

Author Contributions

Conceptualization, X.H. and C.K.; methodology, X.H. and C.K.; software, X.H., R.Q. and D.W.; validation, X.H., R.Q. and D.W.; investigation, Y.L. and W.S.; data curation, Y.L. and W.S.; writing—original draft preparation, X.H. and C.K.; writing—review and editing, C.K.; supervision, C.K.; funding acquisition, Y.L. All authors have read and agreed to the published version of the manuscript.

Funding

This research was funded by the National Key Research and Development Project of China, under contract no. 2019YFC1407902, and the National Natural Science Foundation of China, under contract no. 41976159.

Institutional Review Board Statement

Not applicable.

Informed Consent Statement

Not applicable.

Acknowledgments

We are sincerely grateful to the Eighth Geological Brigade of the Hebei Geological Prospecting Bureau for supporting the fieldwork and measured data for the model validation, and three anonymous reviewers who provide constructive comments and suggestions to improve the quality of this manuscript.

Conflicts of Interest

The authors declare no conflict of interest.

References

  1. Smetacek, V.; Zingone, A. Green and golden seaweed tides on the rise. Nature 2013, 504, 84–88. [Google Scholar] [CrossRef] [PubMed] [Green Version]
  2. Xiao, J.; Wang, Z.L.; Liu, D.Y.; Fu, M.Z.; Yuan, C.; Yan, T. Harmful macroalgal blooms (HMBs) in China’s coastal water: Green and golden tides. Harmful Algae 2021, 107, 102061. [Google Scholar] [CrossRef] [PubMed]
  3. Ye, N.H.; Zhang, X.W.; Mao, Y.Z.; Liang, C.W.; Xu, D.; Zou, J.; Zhuang, Z.M.; Wang, Q.Y. ‘Green tides’ are overwhelming the coastline of our blue planet: Taking the world’s largest example. Ecol. Res. 2011, 26, 477–485. [Google Scholar] [CrossRef]
  4. Blomster, J.; Back, S.; Fewer, D.P.; Kiirikki, M.; Lehvo, A.; Maggs, C.A.; Stanhope, M.J. Novel morphology in Enteromorpha (Ulvophyceae) forming green tides. Am. J. Bot. 2002, 89, 1756–1763. [Google Scholar] [CrossRef] [PubMed]
  5. Teichberg, M.; Fox, S.E.; Olsen, Y.S.; Valiela, I.; Martinetto, P.; Iribarne, O.; Muto, E.Y.; Petti, M.A.V.; Corbisier, T.N.; Soto-Jimenez, M.; et al. Eutrophication and macroalgal blooms in temperate and tropical coastal waters: Nutrient enrichment experiments with Ulva spp. Glob. Chang. Biol. 2010, 16, 2624–2637. [Google Scholar] [CrossRef] [Green Version]
  6. Valiela, I.; McClelland, J.; Hauxwell, J.; Behr, P.J.; Hersh, D.; Foreman, K. Macroalgal blooms in shallow estuaries: Controls and ecophysiological and ecosystem consequences. Limnol. Oceanogr. 1997, 42, 1105–1118. [Google Scholar] [CrossRef] [Green Version]
  7. Amaral-Zettler, L.A.; Dragone, N.B.; Schell, J.; Slikas, B.; Murphy, L.G.; Morrall, C.E.; Zettler, E.R. Comparative mitochondrial and chloroplast genomics of a genetically distinct form of Sargassum contributing to recent “Golden Tides” in the Western Atlantic. Ecol. Evol. 2017, 7, 516–525. [Google Scholar] [CrossRef]
  8. Gower, J.; Young, E.; King, S. Satellite images suggest a new Sargassum source region in 2011. Remote Sens. Lett. 2013, 4, 764–773. [Google Scholar] [CrossRef]
  9. Gower, J.F.R.; King, S.A. Distribution of floating Sargassum in the Gulf of Mexico and the Atlantic Ocean mapped using MERIS. Int. J. Remote Sens. 2011, 32, 1917–1929. [Google Scholar] [CrossRef]
  10. Johns, E.M.; Lumpkin, R.; Putman, N.F.; Smith, R.H.; Muller-Karger, F.E.; Rueda-Roa, D.T.; Hu, C.; Wang, M.; Brooks, M.T.; Gramer, L.J.; et al. The establishment of a pelagic Sargassum population in the tropical Atlantic: Biological consequences of a basin-scale long distance dispersal event (vol 182, 102269, 2020). Prog. Oceanogr. 2020, 182, 102269. [Google Scholar] [CrossRef]
  11. Sissini, M.N.; Barbosa de Barros Barreto, M.B.; Menezes Szechy, M.T.; de Lucena, M.B.; Oliveira, M.C.; Gower, J.; Liu, G.; Bastos, E.d.O.; Milstein, D.; Gusmao, F.; et al. The floating Sargassum (Phaeophyceae) of the South Atlantic OceanLikely scenarios. Phycologia 2017, 56, 321–328. [Google Scholar] [CrossRef]
  12. Wang, M.; Hu, C. Predicting Sargassum blooms in the Caribbean Sea from MODIS observations. Geophys. Res. Lett. 2017, 44, 3265–3273. [Google Scholar] [CrossRef]
  13. Xiao, J.; Fan, S.; Wang, Z.; Fu, M.; Song, H.; Wang, X.; Yuan, C.; Pang, M.; Miao, X.; Zhang, X. Decadal characteristics of the floating Ulva and Sargassum in the Subei Shoal, Yellow Sea. Acta Oceanol. Sin. 2020, 39, 1–10. [Google Scholar] [CrossRef]
  14. Xiao, J.; Wang, Z.; Song, H.; Fan, S.; Yuan, C.; Fu, M.; Miao, X.; Zhang, X.; Su, R.; Hu, C. An anomalous bi-macroalgal bloom caused by Ulva and Sargassum seaweeds during spring to summer of 2017 in the western Yellow Sea, China. Harmful Algae 2020, 93, 101760. [Google Scholar] [CrossRef] [PubMed]
  15. Keesing, J.K.; Liu, D.; Fearns, P.; Garcia, R. Inter- and intra-annual patterns of Ulva prolifera green tides in the Yellow Sea during 2007-2009, their origin and relationship to the expansion of coastal seaweed aquaculture in China. Mar. Pollut. Bull. 2011, 62, 1169–1182. [Google Scholar] [CrossRef]
  16. Qi, L.; Hu, C.; Xing, Q.; Shang, S. Long-term trend of Ulva prolifera blooms in the western Yellow Sea. Harmful Algae 2016, 58, 35–44. [Google Scholar] [CrossRef]
  17. Liu, D.; Keesing, J.K.; Xing, Q.; Shi, P. World’s largest macroalgal bloom caused by expansion of seaweed aquaculture in China. Mar. Pollut. Bull. 2009, 58, 888–895. [Google Scholar] [CrossRef]
  18. Liu, D.; Keesing, J.K.; He, P.; Wang, Z.; Shi, Y.; Wang, Y. The world’s largest macroalgal bloom in the Yellow Sea, China: Formation and implications. Estuar. Coast. Shelf Sci. 2013, 129, 2–10. [Google Scholar] [CrossRef]
  19. Liu, X.; Li, Y.; Wang, Z.; Zhang, Q.; Cai, X. Cruise observation of Ulva prolifera bloom in the southern Yellow Sea, China. Estuar Coast Shelf S 2015, 163, 17–22. [Google Scholar] [CrossRef]
  20. Liu, X.; Wang, Z.; Zhang, X. A review of the green tides in the Yellow Sea, China. Mar. Environ. Res. 2016, 119, 189–196. [Google Scholar] [CrossRef]
  21. Bao, M.; Guan, W.; Yang, Y.; Cao, Z.; Chen, Q. Drifting trajectories of green algae in the western Yellow Sea during the spring and summer of 2012. Estuar. Coast. Shelf Sci. 2015, 163, 9–16. [Google Scholar] [CrossRef]
  22. Ciappa, A.; Pietranera, L.; Coletta, A.; Jiang, X. Surface transport detected by pairs of COSMO-SkyMed ScanSAR images in the Qingdao region (Yellow Sea) during a macro-algal bloom in July 2008. J Mar. Syst. 2010, 80, 135–142. [Google Scholar] [CrossRef]
  23. Garcia, R.A.; Fearns, P.; Keesing, J.K.; Liu, D. Quantification of floating macroalgae blooms using the scaled algae index. J. Geophys. Res. Ocean. 2013, 118, 26–42. [Google Scholar] [CrossRef] [Green Version]
  24. Hu, C. A novel ocean color index to detect floating algae in the global oceans. Remote Sens. Environ. 2009, 113, 2118–2129. [Google Scholar] [CrossRef]
  25. Hu, C.; Li, D.; Chen, C.; Ge, J.; Muller-Karger, F.E.; Liu, J.; Yu, F.; He, M.-X. On the recurrent Ulva prolifera blooms in the Yellow Sea and East China Sea. J. Geophys. Res. Ocean. 2010, 115, C05017. [Google Scholar] [CrossRef] [Green Version]
  26. Zhang, J.; Zhao, P.; Huo, Y.; Yu, K.; He, P. The fast expansion of Pyropia aquaculture in “Sansha” regions should be mainly responsible for the Ulva blooms in Yellow Sea. Estuar. Coast. Shelf Sci. 2017, 189, 58–65. [Google Scholar] [CrossRef]
  27. Wang, Z.; Xiao, J.; Fan, S.; Li, Y.; Liu, X.; Liu, D. Who made the world’s largest green tide in China?-an integrated study on the initiation and early development of the green tide in Yellow Sea. Limnol. Oceanogr. 2015, 60, 1105–1117. [Google Scholar] [CrossRef]
  28. Zhang, J.; Huo, Y.; Wu, H.; Yu, K.; Kim, J.K.; Yarish, C.; Qin, Y.; Liu, C.; Xu, R.; He, P. The origin of the Ulva macroalgal blooms in the Yellow Sea in 2013. Mar. Pollut. Bull. 2014, 89, 276–283. [Google Scholar] [CrossRef]
  29. Zhou, M.-J.; Liu, D.-Y.; Anderson, D.M.; Valiela, I. Introduction to the Special Issue on green tides in the Yellow Sea. Estuar. Coast. Shelf Sci. 2015, 163, 3–8. [Google Scholar] [CrossRef] [Green Version]
  30. Song, W.; Han, H.; Wang, Z.; Li, Y. Molecular identification of the macroalgae that cause green tides in the Bohai Sea, China. Aquat. Bot. 2019, 156, 38–46. [Google Scholar] [CrossRef]
  31. Song, W.; Wang, Z.; Li, Y.; Han, H.; Zhang, X. Tracking the original source of the green tides in the Bohai Sea, China. Estuar. Coast. Shelf Sci. 2019, 219, 354–362. [Google Scholar] [CrossRef]
  32. Hu, L.; Zeng, K.; Hu, C.; He, M.-X. On the remote estimation of Ulva prolifera areal coverage and biomass. Remote Sens. Environ. 2019, 223, 194–207. [Google Scholar] [CrossRef]
  33. Wang, M.; Hu, C. Mapping and quantifying Sargassum distribution and coverage in the Central West Atlantic using MODIS observations. Remote Sens. Environ. 2016, 183, 350–367. [Google Scholar] [CrossRef]
  34. Lee, J.H.; Pang, I.-C.; Moon, I.-J.; Ryu, J.-H. On physical factors that controlled the massive green tide occurrence along the southern coast of the Shandong Peninsula in 2008: A numerical study using a particle-tracking experiment. J. Geophys. Res. Ocean. 2011, 116, C12036. [Google Scholar] [CrossRef] [Green Version]
  35. Son, Y.B.; Choi, B.-J.; Kim, Y.H.; Park, Y.-G. Tracing floating green algae blooms in the Yellow Sea and the East China Sea using GOCI satellite data and Lagrangian transport simulations. Remote Sens. Environ. 2015, 156, 21–33. [Google Scholar] [CrossRef]
  36. Xu, Q.; Zhang, H.; Cheng, Y.; Zhang, S.; Zhang, W. Monitoring and Tracking the Green Tide in the Yellow Sea With Satellite Imagery and Trajectory Model. IEEE J. Sel. Top. Appl. Earth Obs. Remote Sens. 2016, 9, 5172–5181. [Google Scholar] [CrossRef]
  37. Kwon, K.; Choi, B.-J.; Kim, K.Y.; Kim, K. Tracing the trajectory of pelagic Sargassum using satellite monitoring and Lagrangian transport simulations in the East China Sea and Yellow Sea. Algae 2019, 34, 315–326. [Google Scholar] [CrossRef] [Green Version]
  38. Sun, K.; Sun, J.; Liu, Q.; Lian, Z.; Ren, J.S.; Bai, T.; Wang, Y.; Wei, Z. A numerical study of the Ulva prolifera biomass during the green tides in ChinaToward a cleaner Porphyra mariculture. Mar. Pollut. Bull. 2020, 161. [Google Scholar] [CrossRef]
  39. Zhou, F.; Ge, J.; Liu, D.; Ding, P.; Chen, C.; Wei, X. The Lagrangian-based floating macroalgal growth and drift model (FMGDM v1.0): Application to the Yellow Sea green tide. Geosci. Model Dev. 2021, 14, 6049–6070. [Google Scholar] [CrossRef]
  40. Wei, Q.; Wang, B.; Yao, Q.; Fu, M.; Sun, J.; Xu, B.; Yu, Z. Hydro-biogeochemical processes and their implications for Ulva prolifera blooms and expansion in the world’s largest green tide occurrence region (Yellow Sea, China). Sci. Total Environ. 2018, 645, 257–266. [Google Scholar] [CrossRef]
  41. Putman, N.F.; Goni, G.J.; Gramer, L.J.; Hu, C.; Johns, E.M.; Trinanes, J.; Wang, M. Simulating transport pathways of pelagic Sargassum from the Equatorial Atlantic into the Caribbean Sea. Prog. Oceanogr. 2018, 165, 205–214. [Google Scholar] [CrossRef]
  42. Group, D. Mike 21 & Mike 3 FLOW MODEL FM: Hydrodynamic and Transport Module Scientific Documentation; Danish Hydraulic Institute: Hørsholm, Denmark, 2014. [Google Scholar]
  43. Dong, Z.; Kuang, C.; Gu, J.; Zou, Q.; Zhang, J.; Liu, H.; Zhu, L. Total maximum allocated load of chemical oxygen demand near Qinhuangdao in Bohai Sea: Model and field observations. Water 2020, 12, 1141. [Google Scholar] [CrossRef]
  44. Kuang, C.; Dong, Z.; Gu, J.; Su, T.-C.; Zhan, H.; Zhao, W. Quantifying the influence factors on water exchange capacity in a shallow coastal lagoon. J. Hydro-Environ. Res. 2020, 31, 26–40. [Google Scholar] [CrossRef]
  45. Kuang, C.; Mao, X.; Liu, P.; Deng, L.; Gu, J.; Ma, Z.; Du, D.; Yang, J.; Liu, F.; Song, H. Influence of wind force on a silt-muddy coast: Huanghua Harbor coast, China. J. Waterw. Port Coast. Ocean Eng. 2015, 141, 05015001. [Google Scholar] [CrossRef]
  46. Kuang, C.; Song, H.; Gu, J.; Zou, Q.; Liang, H.; Sun, X.; Ma, Z. Responses of tidal modification and nonlinearity to large-scale sequential harbor constructions in the northeastern China. Cont. Shelf Res. 2019, 182, 57–72. [Google Scholar] [CrossRef]
  47. Dagestad, K.-F.; Rohrs, J. Prediction of ocean surface trajectories using satellite derived vs. modeled ocean currents. Remote Sens. Environ. 2019, 223, 130–142. [Google Scholar] [CrossRef]
  48. Whiting, J.M.; Wang, T.; Yang, Z.; Huesemann, M.H.; Wolfram, P.J.; Mumford, T.F.; Righi, D. Simulating the Trajectory and Biomass Growth of Free-Floating Macroalgal Cultivation Platforms along the U.S. West Coast. J. Mar. Sci. Eng. 2020, 8, 938. [Google Scholar] [CrossRef]
  49. Maximenko, N.; Hafner, J.; Kamachi, M.; MacFadyen, A. Numerical simulations of debris drift from the Great Japan Tsunami of 2011 and their verification with observational reports. Mar. Pollut. Bull. 2018, 132, 5–25. [Google Scholar] [CrossRef] [PubMed]
  50. Jones, C.E.; Dagestad, K.-F.; Breivik, O.; Holt, B.; Roehrs, J.; Christensen, K.H.; Espeseth, M.; Brekke, C.; Skrunes, S. Measurement and modeling of oil slick transport. J. Geophys. Res. Ocean. 2016, 121, 7759–7775. [Google Scholar] [CrossRef]
  51. Abascal, A.J.; Castanedo, S.; Mendez, F.J.; Medina, R.; Losada, I.J. Calibration of a Lagrangian Transport Model Using Drifting Buoys Deployed during the Prestige Oil Spill. J. Coast. Res. 2009, 25, 80–90. [Google Scholar] [CrossRef]
  52. Wu, H.; Zhu, J.; Shen, J.; Wang, H. Tidal modulation on the Changjiang River plume in summer. J. Geophys. Res. Ocean. 2011, 116, C08017. [Google Scholar] [CrossRef] [Green Version]
  53. Guo, W.; Wang, X.H.; Ding, P.; Ge, J.; Song, D. A system shift in tidal choking due to the construction of Yangshan Harbour, Shanghai, China. Estuar. Coast. Shelf Sci. 2018, 206, 49–60. [Google Scholar] [CrossRef]
  54. Willmott, C.J. On the validation of models. Phys. Geogr. 1981, 2, 184–194. [Google Scholar] [CrossRef]
  55. Pelling, H.E.; Uehara, K.; Green, J.A.M. The impact of rapid coastline changes and sea level rise on the tides in the Bohai Sea, China. J. Geophys. Res. Ocean. 2013, 118, 3462–3472. [Google Scholar] [CrossRef] [Green Version]
  56. Fang, G.H.; Wang, Y.G.; Wei, Z.X.; Choi, B.H.; Wang, X.Y.; Wang, J. Empirical cotidal charts of the Bohai, Yellow, and East China Seas from 10 years of TOPEX/Poseidon altimetry. J. Geophys. Res. Ocean. 2004, 109, C11006. [Google Scholar] [CrossRef]
  57. Song, D.; Wang, X.H.; Zhu, X.; Bao, X. Modeling studies of the far-field effects of tidal flat reclamation on tidal dynamics in the East China Seas. Estuar. Coast. Shelf Sci. 2013, 133, 147–160. [Google Scholar] [CrossRef]
  58. Zhu, L.; Hu, R.; Zhu, H.; Jiang, S.; Xu, Y.; Wang, N. Modeling studies of tidal dynamics and the associated responses to coastline changes in the Bohai Sea, China. Ocean Dyn. 2018, 68, 1625–1648. [Google Scholar] [CrossRef]
  59. Brooks, M.T.; Coles, V.J.; Hood, R.R.; Gower, J.F.R. Factors controlling the seasonal distribution of pelagic Sargassum. Mar. Ecol. Prog. Ser. 2018, 599, 1–18. [Google Scholar] [CrossRef] [Green Version]
  60. Shi, X.; Qi, M.; Tang, H.; Han, X. Spatial and temporal nutrient variations in the Yellow Sea and their effects on Ulva prolifera blooms. Estuar. Coast. Shelf Sci. 2015, 163, 36–43. [Google Scholar] [CrossRef]
  61. Zhou, Y.; Tan, L.; Pang, Q.; Li, F.; Wang, J. Influence of nutrients pollution on the growth and organic matter output of Ulva prolifera in the southern Yellow Sea, China. Mar. Pollut. Bull. 2015, 95, 107–114. [Google Scholar] [CrossRef]
  62. Huo, Y.; Zhang, J.; Chen, L.; Hu, M.; Yu, K.; Chen, Q.; He, Q.; He, P. Green algae blooms caused by Ulva prolifera in the southern Yellow Sea: Identification of the original bloom location and evaluation of biological processes occurring during the early northward floating period. Limnol. Oceanogr. 2013, 58, 2206–2218. [Google Scholar] [CrossRef]
  63. Li, H.-M.; Zhang, C.-S.; Han, X.-R.; Shi, X.-Y. Changes in concentrations of oxygen, dissolved nitrogen, phosphate, and silicate in the southern Yellow Sea, 1980–2012: Sources and seaward gradients. Estuar. Coast. Shelf Sci. 2015, 163, 44–55. [Google Scholar] [CrossRef]
  64. Sun, X.; Wu, M.; Xing, Q.; Song, X.; Zhao, D.; Han, Q.; Zhang, G. Spatio-temporal patterns of Ulva prolifera blooms and the corresponding influence on chlorophyll-a concentration in the Southern Yellow Sea, China. Sci. Total Environ. 2018, 640, 807–820. [Google Scholar] [CrossRef] [PubMed]
  65. Zhang, Q.-C.; Yu, R.-C.; Chen, Z.-F.; Qiu, L.-M.; Wang, Y.-F.; Kong, F.-Z.; Geng, H.-X.; Zhao, Y.; Jiang, P.; Yan, T.; et al. Genetic evidence in tracking the origin of Ulva prolifera blooms in the Yellow Sea, China. Harmful Algae 2018, 78, 86–94. [Google Scholar] [CrossRef]
  66. Kim, J.-H.; Kang, E.J.; Park, M.G.; Lee, B.-G.; Kim, K.Y. Effects of temperature and irradiance on photosynthesis and growth of a green-tide-forming species (Ulva linza) in the Yellow Sea. J. Appl. Phycol. 2011, 23, 421–432. [Google Scholar] [CrossRef]
  67. Navas-Montilla, A.; Juez, C.; Franca, M.J.; Murillo, J. Depth-averaged unsteady RANS simulation of resonant shallow flows in lateral cavities using augmented WENO-ADER schemes. J. Comput. Phys. 2019, 395, 511–536. [Google Scholar] [CrossRef]
  68. Zordan, J.; Juez, C.; Schleiss, A.J.; Franca, M.J. Entrainment, transport and deposition of sediment by saline gravity currents. Adv. Water Resour. 2018, 115, 17–32. [Google Scholar] [CrossRef]
Figure 1. (a) Map of Jinmeng Bay, Qinhuangdao, with bathymetry. Hollow triangles are macroalgae measuring points, and the rectangular shadow area is the seaweed bed, which is the original source of the green tides; (b) Beached green macroalgae; (c) Ulva pertusa; (d) Bryopsis plumose; (e) Ulva prolifera.
Applsci 12 03017 g001
Figure 2. Computational domains with bathymetry and meshes of the (a,d) Bohai model; (b,e) Qinhuangdao model; and (c,f) Jinmeng Bay model. Red lines represent the open boundaries of the three models.
Applsci 12 03017 g002
Figure 3. Comparison between the observed and simulated current speed and direction from 9:00 15 December 2020, to 9:00 16 December 2020, at measuring points QVMP1 and QVMP2 for the Qinhuangdao model.
Applsci 12 03017 g003
Figure 4. Comparison between the observed and simulated values for the current speed and direction at measuring point JVMP from 12:00 5 September 2017, to 12:00 7 September 2017, and the water level at tidal station QTS during August 2021, for the Jinmeng Bay model.
Applsci 12 03017 g004
Figure 5. Comparison between the observed and simulated biomass concentration of green macroalgae for the particle-tracking model in the Jinmeng Bay domain.
Applsci 12 03017 g005
Figure 6. Cotidal charts of (a) M2; (b) S2; (c) K1; and (d) O1 in the Bohai Sea. The black lines represent the phase lag, and the color-filled contour maps represent the amplitude of the four tidal constituents.
Applsci 12 03017 g006
Figure 7. Current fields of a representative spring tidal cycle from 01:00 10 August 2021, to 13:00 10 August 2021, for the moments of (a,e) Flood slack; (b) Maximum ebb; (c) Ebb slack; and (d) Maximum flood; (f) Time series of the water level at JVMP for a spring–neap tidal cycle during August 2021. The blue shadow area represents the duration from 00:00 9 August 2021, to 00:00 11 August 2021. (g) Time series of the current speed and direction at JVMP from 00:00 9 August 2021 to 00:00 11 August 2021. The black triangles and squares represent the moments corresponding to (ae).
Applsci 12 03017 g007
Figure 8. (ae) Simulated distributions of the green macroalgae particles with colored elevations from 01:00 10 August 2021, to 13:00 10 August 2021; (fj) Biomass concentration of the green macroalgae from 01:00 10 August 2021, to 13:00 10 August 2021; (k) Trajectories of the green macroalgae particles during the tide event in August 2021.
Applsci 12 03017 g008
Figure 9. (ah) Current fields with or without winds and structures in the moments of maximum ebb and flood; (il) Trajectories of green macroalgae with or without winds and structures. The areas surrounded by dotted red lines represent the coverage of the green macroalgae trajectories.
Applsci 12 03017 g009
Figure 10. Wind rose derived from the analysis of wind data during the third quarter of 2021.
Applsci 12 03017 g010
Figure 11. Trajectories of green macroalgae under the wind magnitudes of (a,d,g,j) 2 m/s, (b,e,h,k) 4 m/s, and (c,f,i,l) 6 m/s with the wind directions of ENE, ESE, SSE, and SSW, respectively. The areas surrounded by dotted red lines represent the coverage of the green macroalgae trajectories.
Applsci 12 03017 g011
Table 1. Evaluation of the Bohai model based on the Diff values of four major tidal constituents, M2, S2, K1, and O1, at 10 tidal stations around the Bohai Sea land boundary.
Tidal StationDiff of Tidal Constituents (cm)
M2S2K1O1
Dongying0.840.252.170.73
Huanghua10.382.722.432.10
Tanggu9.103.283.512.13
Jingtang10.022.193.471.27
Shanhaiguan2.900.351.980.95
Jinzhou9.370.722.223.46
Bayuquan17.162.493.884.49
Changxingdao13.802.093.071.02
Laizhou2.441.082.232.05
Penglai4.282.351.030.93
Average8.031.752.601.91
Publisher’s Note: MDPI stays neutral with regard to jurisdictional claims in published maps and institutional affiliations.

