Article

Real-Time Measurement of Photodissociation with a Static Modulated Fourier Transform Spectrometer

1
Department of Aeronautic Electricity, Hanseo University, Seosan 31962, Korea
2
Satellite Research Directorate, Korea Aerospace Research Institute, Daejeon 34133, Korea
*
Author to whom correspondence should be addressed.
Appl. Sci. 2022, 12(6), 3021; https://doi.org/10.3390/app12063021
Submission received: 17 February 2022 / Revised: 12 March 2022 / Accepted: 14 March 2022 / Published: 16 March 2022

Abstract

:
A static modulated Fourier transform spectrometer composed of a modified Sagnac interferometer was implemented for real-time remote sensing of the spectral property changes in a solid dye. In the spectrum obtained from the implemented spectrometer, the relationship between spectral resolution and dependent factors was discussed to prevent aliasing. As a target material, a solid-state dye of rhodamine-6G was fabricated in the laboratory. When an intense pumping laser light was irradiated to a solid dye, with increasing irradiating time, photodissociation occurred due to the accumulated heat and the fluorescence intensity decreased rapidly. The fast change in the fluorescence spectrum of the solid dye due to photodissociation could be measured and analyzed in real time using a static modulated Fourier transform spectrometer implemented in the laboratory. As the pumping light source, a diode laser of 1 W output power at 530 nm, in which pulse width modulation was possible, was used. When the solid-state dye sample was irradiated with a 10 Hz pulse repetition rate and 2.5 ms pulse duration for 900 s, the fluorescence intensity decreased by 44%, the fluorescence peak wavelength shifted from 590 to 586 nm, and the maximum temperature of the irradiated portion rose up to 45 °C. Under the same conditions, when the pulse duration was increased by 4 times to 10 ms, the fluorescence intensity decreased by 65%, the fluorescence peak wavelength shifted from 590 to 580 nm, and the maximum temperature of the irradiated portion rose up to 76 °C. The spectrometer proposed in this study was effective in measuring and analyzing the spectral properties of rapidly changing materials in real time.

1. Introduction

Recently, environmental monitoring of greenhouse gases has become an important part of addressing global warming. Most monitoring technologies can provide spectroscopic information acquired under limited conditions. However, sometimes, the real-time remote sensing spectroscopic technology with short measurement times and mechanical robustness is needed but are not easily obtained because there has not been any appropriate spectrometer applied in the field.
When spectral information need to be obtained in a wide measurement band, from visible to far infrared, Fourier transform spectroscopy can provide a potent solution. Although a dispersion optical system using a diffraction grating can obtain spectral information in a relatively wide band, it has the drawback of smaller diffraction angles in longer wavelength regions. In addition, without any additional optical system, it is difficult to obtain an intense incident light compared with that of a Fourier transform spectrometer [1]. On the other hand, the Fourier transform spectrometer can have a high spectral resolution in the fingerprint region because the spectral resolution improves as the wavelength increases [2], and it is possible to obtain spectral information from a much wider wavelength band in a relatively short time than that of a grating optical system [3]. However, since a moving mirror is supposed to be operated for measurement, conventional Fourier transform spectroscopy should be performed in a strict laboratory environment without vibrations [2]. There have been reports of static modulated Fourier transform spectrometers designed to not have moving parts in the structure [1,2,3,4,5,6,7,8,9]. Though most reports have suggested various structures with the conveniences of mechanical stability and short measurement times, it has also been pointed out that they are not practical because of their very low spectral resolution compared with that of conventional dynamic modulated Fourier transform spectrometers [1,2,3,4,5,6,7,8,9]. The optical path difference in a static modulated Fourier transform spectrometer usually depends on structural design factors such as wedge angle, thickness, and a refraction index of optical components. However, recently, various studies that can greatly improve spectral resolutions have been reported [10,11,12,13,14,15]. They are based on increases in the maximum optical path difference so that a sensor-shifting technique and additional optical components, such as stepped mirrors and a phase retarder, are employed. Since these are based on hardware changes, the spectrometers become more complex. In addition, some research is much interesting because it shortens the measurement time dramatically. In those reports, including our previous publication [13], it is possible to obtain spectral information very quickly, which leads to the fast changing spectral information of a target material.
In this study, we report the photodissociation process of solid dye samples that were fabricated in our laboratory with a static modulated Fourier transform spectrometer that can remotely and rapidly measure changing spectral signals in real time, which cannot be achieved with existing spectroscopic systems.

2. Methods

2.1. A Static Modulated Fourier Transform Spectrometer Composed of a Modified Sagnac Interferometer

In this paper, a static modulation Fourier transform spectrometer was implemented, based on a modified Sagnac interferometer to perform a real-time measurement. The interferometer consisted of two plane mirrors and one beam splitter, as shown in Figure 1. The beamsplitter was tilted 45° from the optical axis, and the two mirrors were each tilted 22.5° from the optical axis. Unlike a conventional dynamic modulated Fourier transform spectrometer that measures the interferogram as a temporal function, the static modulated Fourier transform spectrometer, as used in this study, measured the interferogram as a spatial function. The interferogram, composed of spatially distributed optical signal along the optical path difference, was measured by a one-dimensional detector array.
In order to obtain an interferogram, the pumping light was irradiated to the sample and then the fluorescence light from the sample was measured by the interferometer. The fluorescence light incident to the interferometer was split into two beams at the beam splitter. Those two beams travelled different optical paths, returning to the beam splitter. If the two mirrors were located the equal distances from the beam splitter, the optical path lengths of the two beams should be same, and no interferogram was observed at the focal plane. When the mirror M2 was displaced by a from the symmetrical position, IP was indicated in a dotted line and the optical path difference between two split beams generated an interferogram at the focal plane in the overlapped sector of two beams, where a one-dimensional detector was placed. The distance between the two beams l was determined by the position of M2 in Equation (1).
l = 2 a
where l is the distance between two beams and a is the mirror displacement from the initial symmetrical position IP.
At the focal plane, the interferogram appeared in the form of the interference between two beams. In the modified Sagnac interferometer, the optical path difference between two beams was equal to that at the focal plane in the case of the double slit. The interferogram occurred in the overlapped sector and was measured by a one-dimensional detector array. Since the spectral resolution of the interferometer was defined as the reciprocal of the maximum optical path difference, it can be expressed as Equation (2).
δ Sagnac = 1 Δ = f l · N · y min ,
where δ Sagnac is the spectral resolution, Δ is an optical path difference, f is the focal length of the lens, y min is the width of the single pixel, and N is the number of pixels of the detector.
In order to obtain a better spectral resolution in the static modulated Fourier transform spectroscopy, a longer maximum optical path difference is required. Since the sampling frequency of the spectrometer is inversely proportional to the optical path difference, the sampling frequency decreases as the maximum optical path difference increases. Since the incorrect data sampling of the optical signal appears as aliasing in the spectrum, the spectral resolution of the spectrometer without aliasing is defined as Equation (3).
N · δ Sagnac 2 ν ¯ max ,
where ν ¯ max is the maximum wavenumber of the measured optical signal.
According to Nyquist sampling theory in Equation (3), the sampling frequency in the static modulated Fourier transform spectrometer is at least twice the wavenumber of the measured optical signal. When the wavenumber band of the optical signal to be measured is wide, only the sampling frequency for the largest wavenumber needs to be considered.

2.2. Experimental Setup

Rhodamine-6G (Rh-6G), the solid dye, was fabricated in the laboratory to investigate the fast decaying fluorescence due to photodissociation when it was irradiated by the intense absorbing photon energy. In a polymerized solid dye, the sufficient pumping photon energy can affect the bond energy between solid dye and nanomaterials, and it can be measured using the proper inspection method that is proposed in this study. As the host material, 20 mL of methacrylate (MMA) having high transmittance in the absorption and fluorescence wavelength band of the dye was prepared. Since Rh-6G has low solubility in MMA, it was first dissolved in methanol of 3 mL for 2 mM molarity and then mixed with MMA. Rh-6G was prepared at a molar concentration of 2 mM. In order to induce the polymerization reaction, 1, 1′ Azobis (crychlohexa-necarbonitrile) was used as a directing agent, and 1 wt% of MMA was appropriate. Molecular sieves of 40 mg were inserted into the solution in the form of granules with diameters and pores of 1.6 mm and 0.4 nm, respectively.
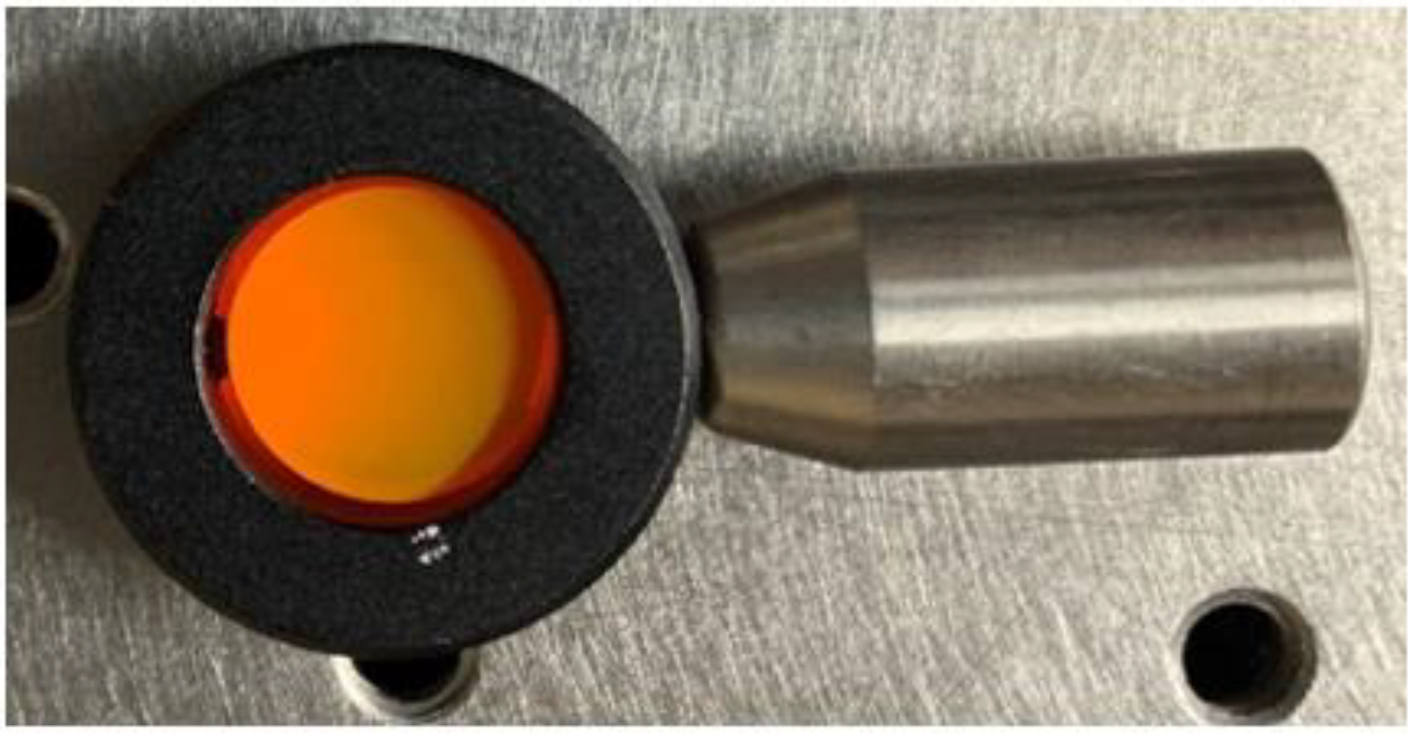
The polymerization was initiated at high temperature for active chemical reaction. It is very crucial to keep the temperature of the solution constant during the polymerization process. A mold containing the dye solution was put into a 100 mL water bath and heated until it retained the ambient temperature. In the initial state, the temperature of the water bath was adjusted to 90 °C until the dye solution became viscous. This procedure took about 2 h. Then, the temperature of the water bath was lowered to 70 °C and maintained for 5 h. In the initial state, several pores were formed in the solution but all disappeared after 5 h. In order to harden the solid dye sample, the temperature of the water bath was raised to 80 °C and maintained for 5 h. Figure 2 shows the produced solid dye sample. The thickness and the diameter of the sample were 3.3 and 13.5 mm, respectively. Its surfaces were cut and polished to the optical level.
A diode laser of 1 W output at 530 nm was used as a pumping light source to excite the solid dye. In order to analyze the photodissociation of the solid dye, the pulse width of the pumping laser was adjusted to 2.5, 5, and 10 ms with pulse width modulation. The pulse repetition rate of the diode laser was fixed to 10 Hz. Evaluating the optical properties of the solid dye, we used a static modulated Fourier transform spectrometer based on a modified Sagnac interferometer. In order to transmit the fluorescence from the solid dye to the interferometer, a flat-convex lens with focal length and diameter of 100 mm and 2 inches was used. Two mirrors in the interferometer are square and 2 inches wide. The surfaces of the mirrors were coated with silver. The beamsplitter was coated to have a transmittance of 50% from 488 to 694 nm. The beamsplitter was tilted 45° from the optical axis, and the two mirrors were each tilted 22.5° from the optical axis. The displacement of M2 was 1 mm. To collect the light passing through the interferometer to the detector, a planar lens with a focal length of 100 mm and a diameter of 2 inches was used. The measurement wavelength range of the one-dimensional array detector was 200 to 1100 nm, and the effective number of pixels was 2048. The width of a single pixel in the detector was 14 μm. By combining a thermal imaging camera with 320 and 240 pixels in the horizontal and vertical directions with a spectrometer, the temperature change in the solid dye along with the change in the spectral signal were obtained simultaneously. Figure 3 shows the spectrometer in this study.

3. Results and Discussions

Photodissociation of the polymerized solid dye can be caused by the pumping light of a diode laser. The pumping light with sufficient photon energy can affect the chemical bonds of the polymerized solid dye [16,17,18], and the effectiveness of absorbed photon depends on the absorption spectrum of polymerized solid dye. Since the pumping light at 530 nm, which was the absorption peak of the Rh-6G polymerized solid dye, was used, the photodissociation proceeded rapidly. Furthermore, the low thermal conductivity of the polymerized solid dye accelerates the heat accumulation by absorbing the pumping light. Photodissociation appeared as a result of the fluorescence decreasing as the pumping power was absorbed. Since the Fourier transform spectrometer has a high signal-to-noise ratio, it is possible to measure the spectrum even if the fluorescence intensity of the solid dye was lowered by photodissociation. Figure 4 shows the interferogram for the fluorescence of the solid dye with respect to the pulse width change of the pumping laser. Figure 4a is an interferogram obtained when the laser with a pulse width of 2.5 ms was irradiated to the dye, and the strongest intensity of fluorescence was obtained, resulting in a highly visible interference pattern. In this case, the signal-to-noise ratio of the interferogram was calculated to be 15.4. Figure 4b is the interferogram after irradiating the dye with a laser of 2.5 ms pulse width for 15 min. In that case, the signal-to-noise ratio was measured to be 12.6. Figure 4c is the interferogram after adjusting the laser pulse width to 5 ms and irradiating the solid dye for 15 min. The signal-to-noise ratio is 10.9. Figure 4d is the interferogram after irradiating the solid dye after adjusting the laser pulse width to 10 ms, and the signal-to-noise ratio was calculated as 5.5. The signal-to-noise ratio becomes worse along with increasing pulse width. In the comparison of Figure 4d to Figure 4a, the pulse width widened by 4 times and the signal to noise ratio deteriorated by 74%. The fluorescence-related interference pattern gradually deteriorated as the signal-to-noise ratio became worse.
Figure 5 demonstrates the investigation on the spectral change of fluorescence from the solid dye along with the pulse width of the laser irradiated. Figure 5a shows the Fourier-transformed fluorescence spectrum when the solid dye was irradiated by 2.5 ms pulse width of the laser. It could be seen that the fluorescence decreased due to photodissociation over time. The fluorescence peak wavelength was measured 590 nm at 60 s. When the solid dye was irradiated with the laser for 900 s, the peak wavelength was shifted to 586 nm. Figure 5b is the Fourier-transformed fluorescence spectrum when the pulse width of the laser was adjusted to 5 ms. It could be seen that the decrease in fluorescence over time is larger than in the case of Figure 5a. The peak wavelength was measured to be 590 nm after 60 s irradiation. When the laser irradiation time was extended to 900 s, the peak wavelength shifted to 586 nm. Figure 5c shows the fluorescence spectrum obtained when the pulse width of the laser was 10 ms. It could be seen that the fluorescence decreased the most rapidly. The fluorescence peak wavelength was measured 590 nm. After it was irradiated for 900 s, the peak wavelength was shifted to 580 nm. Figure 5d shows the relative intensity of the fluorescence spectrum with respect to the pulse width of the pumping laser. The fluorescence intensity of the solid dye after 60 s irradiation was assumed to be 1 for comparison. When the pulse width was 2.5 ms, the fluorescence intensity after 900 s irradiation was reduced by 44% of the initial one. When the pulse width was 5 ms, the fluorescence intensity decreased by 53% after 900 s irradiation from the initial. When the pulse width was 10 ms, it decreased by 65% of the initial when it was irradiated for 900 s. It was confirmed that the photodissociation of the solid dye induced the fluorescence decrease and that the peak wavelength shift toward the shorter wavelength.
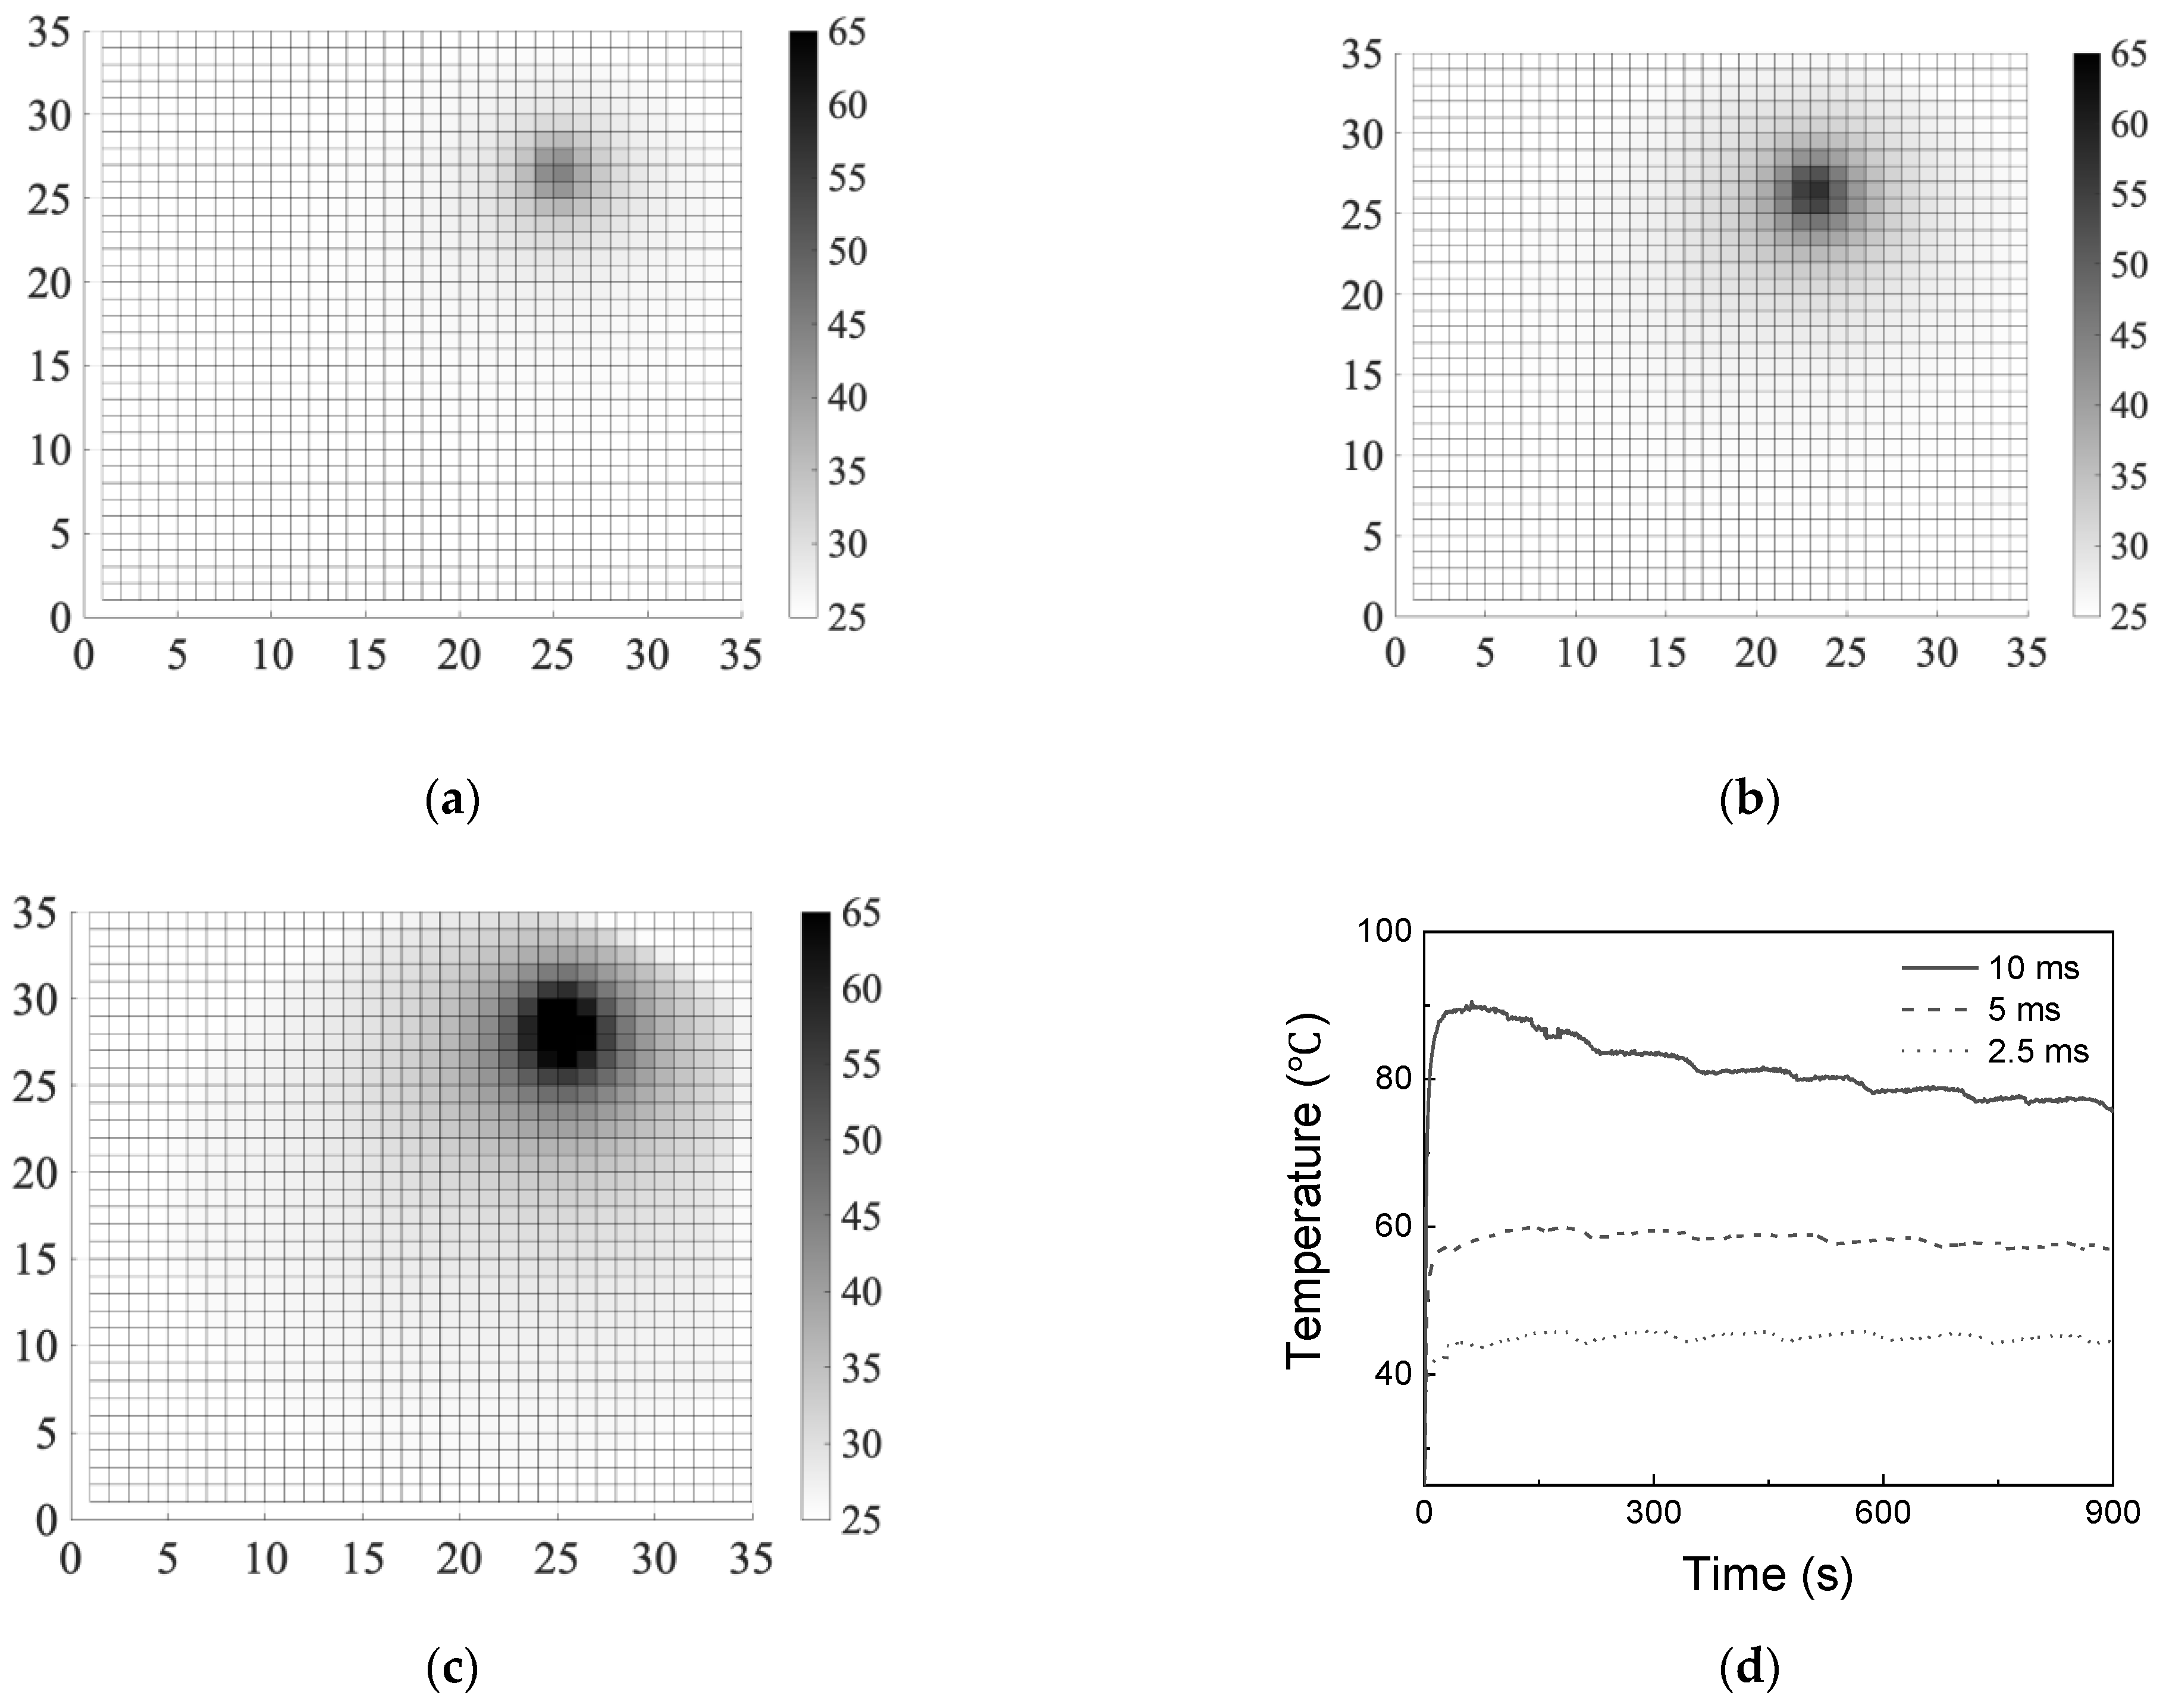
Figure 6 shows the temperature change on the surface of the solid dye after the pumping laser was irradiated for 900 s. The temperature of the solid dye before irradiation was adjusted to about 25 °C. Figure 6a shows the measured temperature of the solid dye surface when the pulse width of the laser irradiated to the solid dye was 2.5 ms. The highest temperature at the laser-irradiated area was measured as 45 °C. Figure 6b shows the measured temperature when the width of the laser pulse was 5 ms. The highest temperature at the laser-irradiated area was 57 °C. Figure 6c shows the measured temperature when the width of the laser pulse was 10 ms. The highest temperature at the laser-irradiated area was 76 °C. Figure 6d shows the tracking of the maximum temperature of the irradiated area over time. The time required to reach the steady state was about 600 s. With the pulse repetition fixed to 10 Hz, as the laser pulse width irradiated to the solid dye increased, and the decrease in fluorescence from the solid dye became steeper. In addition, after a certain duration of irradiation, the peak temperature on the surface of the solid pigment was found to be higher as the pulse width of the pumping laser became longer. When the pulse width of the laser was 10 ms, the maximum temperature of the solid dye reached 89 °C. Since the host material of the solid dye, MMA, has low thermal conductivity, it is difficult for the accumulated heat to be dissipated, and the fluorescence intensity decrease due to photodissociation proceeds rapidly.

4. Conclusions

When the polymerized solid dye was irradiated with a laser, the fluorescence intensity rapidly became worse due to photodissociation. It was difficult to measure in real time and remotely with a conventional spectrometer. In this paper, we demonstrated real-time remote sensing with a static modulated Fourier transform spectrometer based on the modified Sagnac interferometer for the purpose of chasing the rapidly changing spectral information. The relationships between the optical path difference, the spectral resolution, the number of sampling data, and the measured wavenumber band were taken into account to prevent aliasing. The data sampling frequency was inversely proportional to the optical path difference. Since a long optical path difference is required to obtain high resolution, there is a problem in that the data sampling frequency decreases. Therefore, the spectral resolution was adjusted so that the data sampling frequency was twice the maximum wavenumber in the measured wavenumber band.
The solid dye was fabricated in the laboratory, and the fluorescence decreased due to photodissociation and was immediately observed when an interferogram measurement was Fourier transformed into a fluorescence spectrum. It was also observed that the real-time changes in temperature contribute to the fluorescence decrease in the solid dye.
When the pumping laser was irradiated to the solid dye, the fluorescence decrease was observed for up to 900 s. In turn, the greatest decrease in fluorescence was 65%, and the shift in the fluorescence peak wavelength was observed from 590 to 580 nm. The results of this study proved that real-time remote observations are possible using a static modulation Fourier transform spectroscopy. For this study, it is expected to be applied in the investigation and measurement of various fields, even in circumstances where the spectral information of inaccessible objects changed rapidly.

Author Contributions

Conceptualization, W.K.J.; methodology, W.K.J. and S.L.; validation, W.K.J., J.Y.C., H.K. and S.L.; formal analysis, J.Y.C.; investigation, W.K.J., J.Y.C., H.K. and S.L.; writing—original draft preparation, W.K.J. and J.Y.C.; writing—review and editing, W.K.J., J.Y.C., S.L. and H.K.; supervision, W.K.J.; project administration, W.K.J. and J.Y.C.; funding acquisition, W.K.J. and J.Y.C. All authors have read and agreed to the published version of the manuscript.

Funding

This research was supported by Basic Science Research Program through the National Research Foundation of Korea (NRF) funded by the Ministry of Education (NRF-2020R1A6A3A01099403; NRF-2021R1I1A3052065).

Institutional Review Board Statement

Not applicable.

Informed Consent Statement

Not applicable.

Data Availability Statement

Not applicable.

Acknowledgments

We thank the anonymous referees for their useful suggestions.

Conflicts of Interest

The authors declare no conflict of interest.

References

  1. Lin, X.; Zhou, F.; Li, H.; Zhao, H. Static Fourier-transform spectrometer based on Wollaston prism. Optik 2014, 125, 3482–3484. [Google Scholar] [CrossRef]
  2. He, J.; Zhang, Q. Design and analysis of a modified Sagnac interferometer for upper atmospheric wind measurement. Optik 2013, 124, 2658–2660. [Google Scholar] [CrossRef]
  3. Bai, C.; Li, J.; Xu, Y.; Yuan, H.; Liu, J. Compact birefringent interferometer for Fourier transform hyperspectral imaging. Opt. Express 2018, 26, 1703–1725. [Google Scholar] [CrossRef] [PubMed]
  4. Furukawa, H. Real-time multi-channel Fourier transform spectroscopy and its application to non-invasive blood fat measurement. Sens. Bio-Sens. Res. 2016, 8, 55–58. [Google Scholar] [CrossRef] [Green Version]
  5. Zhang, C.; Yan, X.; Zhao, B. A novel model for obtaining interferogram and spectrum based on the temporarily and spatially mixed modulated polarization interference imaging spectrometer. Opt. Commun. 2008, 281, 2050–2056. [Google Scholar] [CrossRef]
  6. Kudenov, M.W.; Jungwirth, M.E.L.; Dereniak, E.L.; Gerhart, G.R. White light Sagnac interferometer for snapshot linear polarimetric imaging. Opt. Express 2009, 17, 22520–22534. [Google Scholar] [CrossRef] [PubMed]
  7. Cai, Q.; Xianli, B.; Huang, M.; Han, W.; Pei, L.; Bu, M. Prototype development and field measurements of high etendue spatial heterodyne imaging spectrometer. Opt. Commun. 2018, 410, 403–409. [Google Scholar] [CrossRef]
  8. Liu, Q.; Bai, C.; Liu, J.; He, J.; Li, J. Fourier transform imaging spectropolarimeter using ferroelectric liquid crystals and Wollaston interferometer. Opt. Express 2017, 25, 19904–19922. [Google Scholar] [CrossRef] [PubMed]
  9. Schardt, M.; Murr, P.J.; Rauscher, M.S.; Tremmel, A.J.; Wiesent, B.R.; Koch, A.W. Static Fourier transform infrared spectrometer. Opt. Express 2016, 24, 7767–7776. [Google Scholar] [CrossRef] [PubMed]
  10. Li, J.; Wu, H.; Qi, C. Compact static birefringent spectral range enhanced Fourier transform imaging spectrometer. Opt. Commun. 2018, 426, 182–186. [Google Scholar] [CrossRef]
  11. Watanabe, A.; Furukawa, H. High-resolution and high-throughput multichannel Fourier transform spectrometer with two-dimensional interferogram warping compensation. Opt. Commun. 2018, 413, 8–13. [Google Scholar] [CrossRef]
  12. Li, J.; Qu, C.; Wu, H.; Qi, C. Spectral resolution enhanced static Fourier transform spectrometer based on birefringent retarder array. Opt. Express 2019, 27, 15505–15517. [Google Scholar] [CrossRef]
  13. Cho, J.Y.; Lee, S.H.; Jang, W.K. Improvement of spectral resolution by signal padding method in the spatially modulated Fourier transform spectrometer based on a Sagnac interferometer. Appl. Opt. 2019, 58, 6755–6761. [Google Scholar] [CrossRef] [PubMed]
  14. Köhler, M.H.; Schardt, M.; Müller, M.; Kienle, P.; Wang, K.; Dong, X.; Giebeler, C.; Wiesent, B.R.; Jakobi, M.; Koch, A.W. Static Fourier transform mid-infrared spectrometer with increased spectral resolution using a stepped mirror. OSA Contin. 2020, 3, 2134–2142. [Google Scholar] [CrossRef]
  15. Frassetto, F.; Cocola, L.; Zuppella, P.; Deppo, V.D.; Poletto, L. High sensitivity static Fourier transform spectrometer. Opt. Express 2021, 29, 15906–15917. [Google Scholar] [CrossRef] [PubMed]
  16. Chiu, Y.-H.; Chang, T.-F.; Chen, C.-Y.; Sone, M.; Hsu, Y.-J. Mechanistic Insights into Photodegradation of Organic Dyes Using Heterostructure Photocatalysts. Catalysts 2019, 9, 430. [Google Scholar] [CrossRef] [Green Version]
  17. Sassin, N.A.; Everhart, S.C.; Dangi, B.B.; Ervin, K.M.; Cline, J.I. Fluorescence and Photodissociation of Rhodamine 575 Cations in a Quadrupole Ion Trap. J. Am. Soc. Mass Spectrom. 2009, 20, 96–104. [Google Scholar] [CrossRef] [PubMed] [Green Version]
  18. Jang, W.K. Preparation of Polymethyl methalcrylate Rhodamine 6 G and Its Optical Property. Asian J. Chem. 2013, 25, 5631–5632. [Google Scholar] [CrossRef]
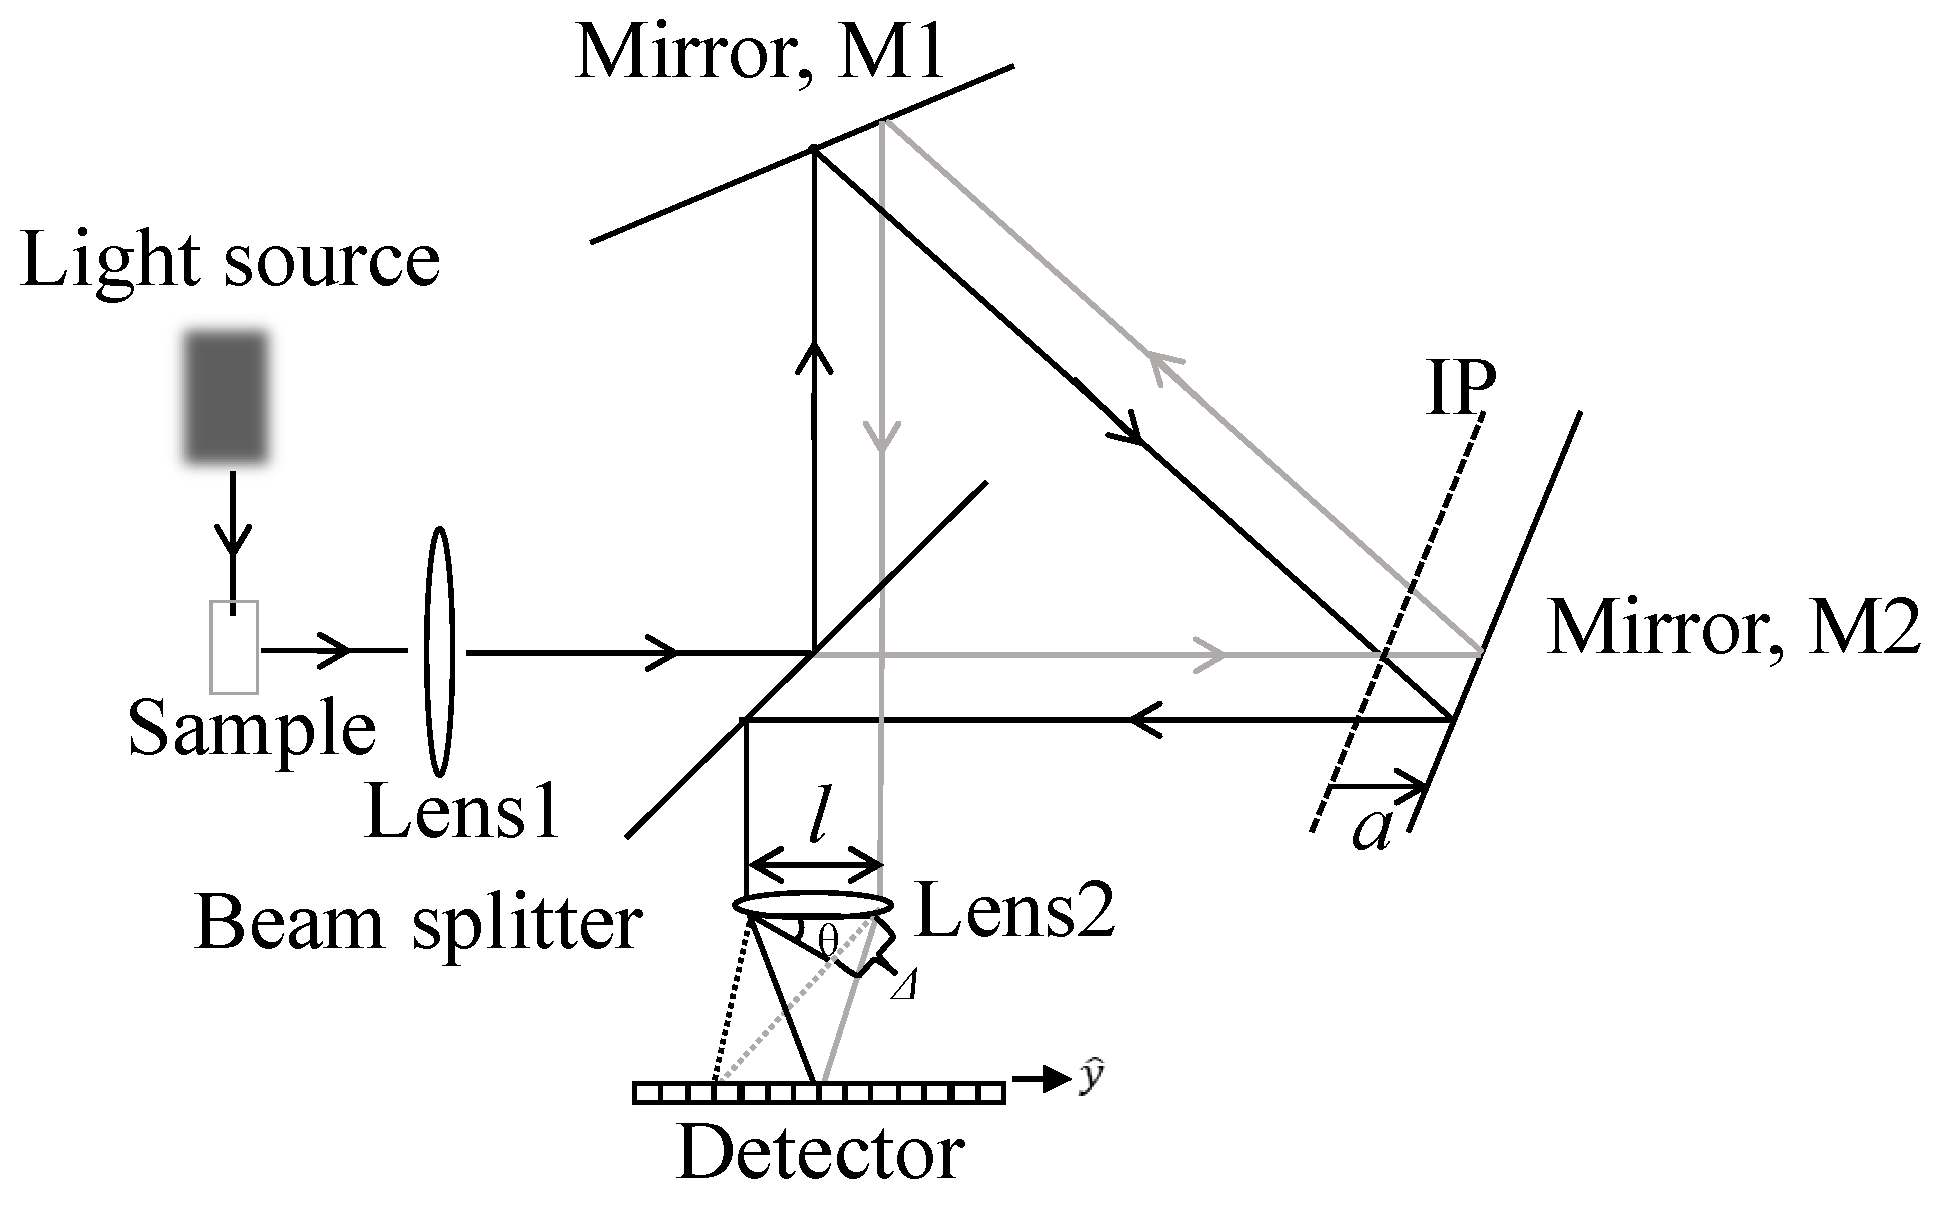
Figure 1. A static modulated Fourier transform spectrometer composed of a modified Sagnac interferometer.
Applsci 12 03021 g001
Figure 2. A synthesized solid-state dye.
Applsci 12 03021 g002
Figure 3. The experimental setup used to investigate the spectral and thermal properties.
Applsci 12 03021 g003
Figure 4. The interferograms with the pulse width of the pumping laser. (a) The initial interferogram when the solid-state dye is irradiated by 2.5 ms pulse width of the laser. (b) The interferogram when the solid dye is irradiated for 900 s by 2.5 ms pulse width of the laser. (c) The interferogram when the solid dye is irradiated for 900 s by 5 ms pulse width of the laser. (d) The interferogram when the solid dye is irradiated for 900 s by 10 ms pulse width of the laser.
Applsci 12 03021 g004aApplsci 12 03021 g004b
Figure 5. The change in the fluorescence spectra along with the irradiation time when the pulse width was adjusted to (a) 2.5 ms, (b) 5 ms, and (c) 10 ms. (d) The relative fluorescence changes with irradiation time.
Applsci 12 03021 g005
Figure 6. The temperature gradient of the surface of the solid dye. The irradiated pumping laser pulse was adjusted to (a) 2.5 ms, (b) 5 ms, and (c) 10 ms for 900 s. (d) The variation in the highest temperature of the irradiated surface of the solid dye.
Applsci 12 03021 g006
Publisher’s Note: MDPI stays neutral with regard to jurisdictional claims in published maps and institutional affiliations.