Article

CT Scanning of Structural Characteristics of Glacial Till in Moxi River Basin, Sichuan Province

1
Chinese Academy of Geological Sciences, Beijing 100037, China
2
Chengdu Center of China Geological Survey, Chengdu 610081, China
3
School of Civil Engineering, Chongqing University, Chongqing 400045, China
4
State Key Laboratory of Hydraulic and Mountain River Engineering, Sichuan University, Chengdu 610065, China
*
Author to whom correspondence should be addressed.
Appl. Sci. 2022, 12(6), 3040; https://doi.org/10.3390/app12063040
Submission received: 6 January 2022 / Revised: 9 March 2022 / Accepted: 14 March 2022 / Published: 16 March 2022
(This article belongs to the Special Issue Big Data in Geoscience: Advances and Applications)

Abstract

:
Glacial till is a special soil in alpine mountainous areas, which often induces geohazards such as debris flows and landslides due to the influence of special geological environmental conditions in alpine mountainous areas. The change in the structure of glacial till is the main cause of geohazards. Glacial till structure is one of the important factors affecting the mechanical properties of soil. It can explain the mechanical phenomena of soil engineering and establish the quantitative relationship between soil structure and macro–mechanical properties. However, there are few systematic research results on its structure. For this reason, the intact glacial till in the Moxi River Basin, South of Kangding City, Tibetan Autonomous Prefecture of Garzê, Sichuan Province was taken as the research object, and the meso-structure and micro-structure of intact glacial till were studied using CT scanning and scanning electron microscopy (SEM). The meso-structure and micro-structure images of the interior of intact glacial till were obtained and the porosity, particle shape, directivity and structural unit were analyzed. The results show that: (1) the average porosity of longitudinal and transverse sections of intact glacial till are 24.92% and 24.35%, respectively, and the difference is not significant; (2) the average circularity of the particles in the longitudinal and transverse sections is 0.836 and 0.802, respectively, and the average aspect ratio is 2.5 and 3.7, respectively. The shape of the particles in the longitudinal section is more circular than in the transverse section, and the orientation of the particles in the transverse sectional direction is more obvious; (3) the main mineral components of the glacial till sample are mica, feldspar and quartz. In the process of transportation and deposition, the mineral particles undergo different degrees of grinding, crushing and dissolution. The particles are mainly formed by calcareous cementation, and the cementation is dense. The structure is mainly a skeleton structure composed of fine particles that are wrapped or filled. These findings provide the scientific basis for highway-, railway- and hydro-power-station construction and disaster prevention and mitigation in the alpine mountainous area.

1. Introduction

Glacial till is a special kind of soil that is directly deposited by detritus in the melting process of Quaternary glacier. It shows poor sorting, wide distribution of grain size and complex structure. In China, glacial till is widely distributed in high-altitude areas such as the Tianshan Mountains, Qinghai-Tibet Plateau and other mid–high latitude mountainous areas. Its thickness can reach hundreds of meters and its scale can be hundreds of millions of cubic meters [1,2]. Due to the special climate of alpine mountainous areas, freeze–thaw cycles often occur, resulting in changes in the structure of glacial till, a reduction in strength, and the induction of engineering and geological disasters [3]. It poses a serious threat to people’s lives and to property and engineering construction. However, there are few systematic research results on its structure.
Glacial till’s formation is due to glacial movement and has not been significantly modified by other external forces. Generally, it does not have beddings. The gravel in the soil has poor roundness, and is mostly prismatic and sub-prismatic [1]. Studies have shown that the lithology, mineral composition and content of glacial till are mainly related to the nature of the bedrock in the source area, while the distribution characteristics of the particle size are mainly related to the type of glacier, transport and deposition methods [4]. In view of the structural characteristics of glacial till, many studies have taken the particle size parameter, particle size frequency curve, particle size accumulation curve, and particle size scatter diagram as an important basis basis for dividing glacial till from other mixed accumulation soils [5]. The meso-structure of glacial till refers to the cementation and state of cementation, relative position, contact state, size and shape of the pores between the particles of soil and rock clasts. The meso-structure of glacial till plays a decisive role in its physical and mechanical properties and strength, which can also reflect the macroscopic movement of glaciers. The mesoscopic characteristics of glacial till can not only indicate the macroscopic movement process of glaciers, but also determine the physical and mechanical properties of the soil [6,7]. The cementation between soil particles and the state of cementation are the controlling factors of the strength of glacial till, while the pore structure has a significant impact on the engineering characteristics of glacial till [7,8]. The texture, especially the content of sand, can transform the pores of glacial till under the conditions of freeze–thaw, water content and stress difference; this results in a change in pore structure, causing the problems of expansion, softening and instability of the glacial till, which have a certain impact on engineering construction [9,10]. The micro-structure of the particle arrangement of the glacial till and the orientation of the particles also have a great influence on its mechanical properties. The orientation and the degree of fragmentation of the particles increase with the increase in pressure, which leads to a decrease in the strength of the glacial till [11].
In recent years, with the construction of major national projects such as the Sichuan–Tibet railway and highway, engineering geological problems caused by glacial till have become increasingly prominent. At present, the engineering and geological characteristics of the glacial till still remain insufficiently investigated. On the one hand, this is due to the complexity of glacial till formation; on the other hand, it is limited by research methods [5]. The study of the mechanical properties of glacial till is the key to studying the engineering and geological properties of glacial till, including meso-structure characteristics and fabrics; indoor and in situ mechanical tests and mechanical models; and numerical simulation of deformation and failure [12]. Among them, the study of meso-structure and micro-structure and fabric are the basis of the subsequent two aspects of research, especially the modeling basis of numerical simulation [13]. Therefore, the quantitative description of meso-structure and micro-structure characteristics plays an important role in the study of the engineering characteristics of glacial till [14,15]. Research results in recent years have shown that the application of CT scanning technology and SEM technology for quantitative research on the meso-structure and micro-structure characteristics of glacial till have been favored by the majority of investigations [16,17]. For this reason, the intact glacial till in the Moxi River Basin in the south of Kangding City, Tibetan Autonomous Prefecture of Garzê, Sichuan Province is taken as the research object, and its meso-structure and micro-structure characteristics are quantitatively studied using CT scanning technology and SEM. The research results can a more scientific basis for highway, railway and hydro-power station construction and disaster prevention and mitigation in the alpine mountainous area.

2. Study Area

The Moxi River Basin is located in the south of the Tibetan Autonomous Prefecture of Garzê, Kangding City, Sichuan Province, which is the first-level tributary of the right bank of the Dadu River, with a drainage area of 904 km2 (Figure 1). The basin is in the topographic transition zone between the first-step terrace and the second-step terrace and at the junction of the Sichuan. The terrain is low in the middle and southeast, and high in the north, east and west sides. The west side of Moxi is alpine, while the east side is mostly sub-alpine. The highest elevation in the basin is 7556 m, the lowest is 976 m, and the difference is 6580 m.
Geological disasters such as collapses, landslides and debris flows are widely developed in the basin, among which glacial debris flow is the most harmful type [5]. According to statistics, there are 51 large-scale (main ditch length > 4 km) debris flow ditches, while there are 17 glacial debris flow ditches. The glacier is active on the eastern slope of the Gongga mountain and part of the northern slope of the basin, with a glacier area of 145.34 km2 and 26 glaciers. The loose material reserves in the basin amount to 4.08 × 10⁹ m3, of which the moraine reserves are 2.19 × 10¹⁰ m3. Sufficient water and sediments provide favorable conditions for the formation of debris flow. For this reason, it is typical and representative to choose the glacial till in this basin to carry out experimental research.

3. Soil Samples and Methods

3.1. Soil Samples

Field investigation of glacial till in the Moxi River Basin, and previous studies, revealed that the glacial till in the Moxi Bains is mainly composed of Holocene Gongga. They are basically distributed along the ditch in an irregular strip shape, which is mainly distributed in the Hailuogou, Yanzigou, Nanmenguangou and Yajiageng reach (Figure 2). In general, the samples are prone to sampling failure due to the mixed soil and rock and poor cementation between particles, but there is still the possibility of sampling when the cementation between particles is good. Based on the field investigations, it was found that the glacial till in the Yajiageng reach has excellent cementation properties, and it is possible to obtain intact glacial till. For this reason, this area was selected as the sampling site. The intact glacial till samples taken in the field were sealed with plastic wrap and tape to maintain moisture and prevent disturbance during transportation. The soil samples were processed indoors and sectioned into irregular pieces (Figure 3), and the processed soil samples were screened for a second time to eliminate the soil samples with defects and large visual differences.
Glacial till in the Moxi River Basin is gravel soil with lithic fragments of mainly diorite and a small amount of granite [18]. The particles in the glacial till are poorly sorted, and the coarse and fine components are mixed and stacked in a disorderly manner, without stratification; moreover, they are locally sandwiched with lenticular sandy gravel enrichment zones, clumpy weathered zones, and suspended large blocks stone. The particles in the soil have poor roundness, compact structure, and excellent cementation. Macroscopically, the glacial till is matrix-supported (Figure 3). Combined with the conventional geotechnical tests on intact glacial till in the study area, the particle size distribution was obtained (Figure 4 and Figure 5). It can be seen from Figure 4 that the particle size distribution range of the soil samples is wide and exhibits bimodal characteristics. As can be seen from Figure 5, 55% of the soil particles are greater than 60 mm, 19% of the soil particles <2 mm, the coefficient of nonuniformity is 389.7, and the coefficient of curvature is 17.1, indicating that the soil samples are poorly sorted.

3.2. Methods

3.2.1. CT Scanning Technology

CT scanning technology is a kind of technology that uses Y-ray, X-ray beams, ultrasound and sensitive detectors to perform multiple cross-sectional scans of objects. The purpose of the CT scanning process is to emit X-ray through the emission source to scan a certain layer of the material; this is received by the detector and converted into visible light, converted into electrical signals, converted into numbers by a digitizer, and finally, imported into a computer for processing. The formation of CT images divides the scanned slices into several rectangular parallelepipeds (Voxel) of the same volume through computer. It then obtains the X-ray attenuation coefficient from each voxel, arranges them into a digital matrix, applies a digital converter to convert the numbers in the matrix into black, white and gray squares (pixels), and finally, the pixels are arranged in a matrix to form CT Scanning images. Thus, the essence of a CT image is a reconstructed image of the substance [19,20,21]. The process of CT scan image processing is shown in Figure 6.
Due to the advantage of CT scanning technology not damaging the sample during the scanning process, the CT scanning machine used in this paper was GE Phoenix v|tome| × m300. The scanning form was area array scanning (Figure 7), which is different from layer-by-layer line array scanning. The maximum range of the measurement object was 400 mm × 400 mm [22,23]. The main technical parameters are shown in Table 1.
In order to avoid the distribution of the test, three soil samples were selected for CT scanning at the same sampling point and the images with large differences were eliminated; then, one of the typical soil samples was selected. In order to reflect the meso-structural characteristics of the intact glacial till, CT scanning of the irregular glacial till samples was first performed to obtain the meso-structure images of the original glacial till. At the same time, three-dimensional reconstruction was performed to restore the original appearance of the glacial till (Figure 8). The image processing system of the CT machine was used to intercept the standard cylinder with a diameter of 20 mm and height of 30 mm for analysis (Figure 9). At the same time, the coordinate system was established during the scanning process. The direction parallel to the transverse section of the sample was the Z axis direction. The directions parallel to the longitudinal-section were the X and Y axis directions. The sections parallel to the X, Y, and Z axis directions were the X section, Y section, Z section, respectively.
In order to analyze the meso-structure characteristics of the glacial till samples, transverse-section images at different heights of 0 mm, 7.5 mm, 15 mm, 22.5 mm, and 30 mm were selected in sequence; they were recorded as 1–5 and the corresponding rendered. The image was recorded as 1#–5# (Figure 10). The sectional images were selected at different angles of 0°, 45°, 90°, and 135° for the longitudinal section, which were recorded as 6–9, and the corresponding rendered image was recorded as 6#–9# (Figure 10). At the same time, in order to facilitate the extraction and statistical analysis of image information, the images were rendered with the supporting software of the CT machine, in which the yellow part is the pore and the gray part is the particle.

3.2.2. SEM

SEM is an observation method between a transmission electron microscope and an optical microscope. It is widely used in rock- and soil-mass micro-structure analysis [24]. Because of its advantages of large depth of view, wide field of vision and good three-dimensional imaging effect, it can be combined with other analytical instruments to achieve micro-morphology analysis and micro-area composition analysis.
The working principle of SEM is that the electron beam is emitted by the electron gun, which is converged by a magnetic lens system, under the action of the accelerating voltage, to form an electron beam with a diameter of 5 nm. The electron beam is focused on the surface of the sample. Under the action of the deflection coil between the second condenser and the objective lens, the electron beam scans the sample in a raster shape, and simultaneously detects the electrons and photons scattered from the surface of the sample after the incident electrons interact with the research object to obtain the surface morphology and composition analysis of the corresponding materials [25]. The energy of the secondary electrons scattered from the surface of the material is generally less than 50 eV, and most of their energy is about 2 to 3 eV. Because of the low energy of the secondary electrons, only the secondary electrons generated on the surface of the sample can escape from the surface, and the escape depth is only a few nanometers. These signal electrons are collected by the detector and converted into photons, then amplified by the electrical signal amplifier, and finally, imaged on the display system [26]. The special feature of the working principle of the scanning electron microscope is that the image signal from the secondary electron is used as the time-image signal to dynamically form a three-dimensional image from one point to another. The essence of the scanning electron microscope is to use a focused, narrow, high-energy electron beam to scan the sample. Through the interaction between the beam and the substance, various physical information is excitated, and the information is collected, magnified, and re-imaged to achieve the purpose of characterizing the microscopic morphology of the substance.

4. Results

4.1. Meso-Structure Characteristics of Intact Glacial Till

4.1.1. Analysis of Test Results

According to the CT scanning images obtained in the experiment (Figure 10), the features of the meso-structure of the intact glacial till are as follows: (1) Particles are poorly sorted with filling in between. There are pores of different sizes inside and the shape is irregular; (2) there is no obvious orientational arrangement of coarse particles in the soil sample, and most of the gravel particles are sharp and angular; (3) the gravel particles mostly contact the fine particles in the form of point contact.

4.1.2. Porosity

The pores of the soil are used as seepage channel. The size, shape and connectivity of the pores directly affect the permeability of the soil which, in turn, affects the physical and mechanical properties and engineering characteristics of the soil. For this reason, the CT data analysis software VG STUDIO MAX was used to calculate the surface porosity and volume porosity of the soil samples. VG STUDIO MAX software can realize the three-dimensional visualization of the pores in the soil samples and adjust the transparency, so that the spatial distribution of the pores in the soil samples can be visualized. The overall pore space distribution of the glacial till sample is shown in Figure 11. The red part in the figure is the pore. In addition, according to five gradients of 0–0.49 mm, 0.50–0.99 mm, 1.00–1.49 mm, 1.50–1.99 mm and >2 mm, the pore size ratio of each section and the probability density of voids were counted. The spatial distribution is shown in Figure 12, and the statistical results are shown in Figure 13, Figure 14 and Figure 15.
The average porosity of the transverse section is 24.35%, the average porosity of the longitudinal section is 24.92%, and the difference in porosity between the transverse and longitudinal sections is small (Figure 13). By calculating the volume porosity of the soil sample, it is found that the volume porosity of the soil sample is 24.09%, which is basically the same as the surface porosity of the soil sample. As the pore diameter increases, the proportion of pores (<2 mm) in the soil sample remains basically unchanged (Figure 14), whereas when the pore diameter is greater than 2 mm, the pore proportion increases sharply. Figure 15 shows that as the pore diameter increases, the probability density gradually increases. Combining Figure 14 and Figure 15, it can be observed that the soil samples are dominated by large pores with diameters greater than 2 mm. The large pores are evolved from medium and small pores. The author believes that because the glacial till is generally located at high altitudes and high latitudes—affected by the special climate of the alpine mountainous area—seasonal and day–night cycles of freezing and thawing will occur. In the cyclic freezing and thawing process, when the temperature decreases, the liquid water in the soil becomes solid ice. The ice crystals grow and expand in volume, squeezing the surrounding soil particles and causing the soil particles to shift or even deform and break, and the soil texture changes. The shape of the pore is also changed, and the medium and small pores merge to form large pores which, in turn, leads to an increase in the content of large pores in the soil.

4.1.3. Particle Shape

The particle shape, as one of its meso-structure characteristics, has a certain impact on the macroscopic mechanical properties of glacial till. Roundness and aspect ratio are commonly used in engineering to quantitatively analyze the shape of particles. The equation for particle roundness and aspect ratio is as follows [27]:
φ = l r l = 4 π S l = 3.545 S l
In Equation (1): φ—particle circularity; lr—circumference length equal to particle area; l—particle circumference; S—particle area.
According to Equation (1), the circularity of a circle is 1, the circularity of a square is 0.886, the circularity of a rectangle with an aspect ratio of 3 is 0.767, the circularity of a rectangle with an aspect ratio of 10 is 0.51, and the circularity of an equilateral triangle is 0.777.
α = L W = L 2 S
In Equation (2): α—particle aspect ratio; L—particle maximum chord length; W—the short side length of a rectangle with the same area as the particle and the long side L.
According to Equations (1) and (2), the X-section, Y-section and Z-section CT scanning pictures of the glacial till sample are selected for statistical analysis. The statistical results are shown in Figure 16 and Table 2.
Figure 16 and Table 2 show that the average circularity of the particles in the longitudinal and transverse sectional directions of the glacial till sample is 0.836 and 0.802, and the average aspect ratio is 2.5 and 3.7, respectively. It can be seen that the shape of the particles in the glacial till sample is generally an irregular rectangular shape with a side-to-length ratio of 2 to 4; however, there are differences in the shapes of the particles in the longitudinal section and the transverse section, and they are closer to round in the longitudinal section direction.

4.1.4. Particle Orientation

The orientation of glacial till particles not only affects its engineering properties, but also reflects its stress history. At present, the statistical methods of particle orientation in soil mainly include the orientation rose diagram, average orientation direction and principal orientation angle [28,29,30]. The paper uses the directional rose diagram method to count the particle direction of the glacial till samples in the X, Y and Z sections.
In the process of particle orientation statistics, the CT scanning image is first subjected to “despeckle” processing, which is to remove the independent small area blocks generated by the SEM image after the binarization process. Generally speaking, these blocks are composed of only a few or a dozen pixels (depending on the resolution of the scanned image), and they do not represent the actual particle shape, so these parts of the blocks should be excluded from the statistical analysis; then, the CT scanning image is binarized by Matlab software. Finally, a coordinate system is established in Matlab, and the 0° directions of the X, Y, and Z sections are specified as the positive directions of the Y, X, and Z axes. Due to the symmetry of the particle direction, we take 15° as the interval, divide 0°–180° into 12 intervals, and count the number of particles in each interval. The results of the particle direction statistics of the X, Y, and Z sections are shown in Figure 17.
The particle’s long axis direction distribution in the X and Y longitudinal section directions in the glacial till sample is similar, the distribution is uniform and there is no obvious preferred orientation (Figure 17). The orientation of the particle long axis direction in the Z-section direction is more obvious. However, the distribution of the particle’s long axis direction in the longitudinal and transverse directions is different.

4.2. Micro-Structure Characteristics of Intact Glacial Till

The micro-structure of the soil not only reflects the material source of the soil, but also determines its physical and mechanical properties and engineering characteristics [31]. Therefore, through SEM experiments on the cementitious intact glacial till in the study area, SEM images of the glacial till with different resolutions were obtained (Figure 18).
The rocks enclosed in the glacial till are mainly mica, quartz, shist and a small amount of marble (Figure 18). As a mineral with relatively weak strength, mica is prone to brittle fracture during transportation. The relatively broken mica in the sample indicate that it was transported over a long distance, crushed and abraded. Quartz particles display obvious erosional features and show various shapes, such as round and angular. The boundary of the particles is clear, indicating that the abrasion of the quartz particles during the transportation process leads to different degrees of crushing and rounding. The surface of round quartz particles has V-shaped percussion cracks, obvious linear grooves and dissolution characteristics (Figure 18c), indicating that quartz particles have the characteristics of surface pre-weathering, and have undergone long-distance glacier melt-water transportation and rounding before deposition. It can be seen from Figure 18a,b that the fine particle components are mainly silty clay adhered to the surface of coarse particles in the form of flakes, or filled in the pores in the form of dispersion. The cement between coarse particles is mainly calcareous cementation at the base, which is mainly due to the collision of marble during transportation; this causes the development of marble cracks and increasing contact with carbon dioxide, carbide and water in the atmosphere, leading to weathering and dissolution and the formation of calcareous cements. The coarse particles have different shapes, and are interlocking and densely cemented. They show mainly line–surface concave–convex contact, and the skeleton structure formed by the inclusion or filling of fine particles is stable. It has high shear strength, and is not dissolvable. This characteristic of glacial till indicates its potential resistance to damage caused by the action of cyclic freezing and thawing in the alpine mountainous area [32].

5. Discussion

Meso-structure and micro-structure play a decisive role in the physical and mechanical properties of rock and soil mass [33]. Therefore, it is of great significance to study the fine structure of rock and soil mass. However, for the acquisition of information on the meso- and micro-structure of intact glacial till, it is necessary to ensure that the intact structure of the soil sample is not damaged [34]. Because the soil and stone in the glacial till are mixed and the content of powder and clay is low, the cementation between the soil and stone is fragile and easy to break up; this makes it prone to sampling failure. As a result, there are few reports on intact glacial till so far. Therefore, the success of obtaining an intact glacial till sample is the key to analyzing the meso-structure and micro-structure of intact glacial till. The intact glacial till samples selected in this paper have excellent cementation properties, which provides the possibility for successful sample preparation.
Advanced technology is the key to obtaining the meso-structure and micro-structure of intact glacial till. In recent years, with the development of computer technology and numerical calculation methods, a variety of methods have emerged in the field of analysis and research on the meso-structure and micro-structure of rock and soil [35,36,37], such as SEM techniques, statistical methods, fractal theory, and CT scanning methods. The CT scanning technology and scanning electron microscope technology used in the study of the meso-structure and micro-structure characteristics of intact glacial till are the most advanced methods for studying the structure of rock and soil mass. When statistical methods such as Monte Carlo, the stochastic method and Flac3D are used to simulate the meso-structure and micro-structure of rock and soil mass in 3D, their internal structure is extremely complex, because most rock and soil mass materials are composed of a certain size of high-strength rock block and relatively low-strength soil filling and corresponding pores. However, the three-dimensional meso-structures of rock and soil mass generated by these methods are all random simulations, which cannot truly reflect the real three-dimensional structure of rock and soil mass materials [38,39,40]. When the method of fractal theory is used to study and analyze the internal meso-structure and micro-structure, the rock and soil mass must be kept in their original state, and representative parts must be selected to reflect the structure during the sample preparation process; then, fractal theory should be used to perform fine measurement and digital representation of the internal structure of the loess, and further solve the structural parameters [41]. SEM technology is used to study the micro-structure of rock and soil mass. The sample preparation is simple. As long as the block or powder samples are slightly processed or not processed, they can be directly placed in the scanning electron microscope for observation, which is closer to the natural state of the material. The magnification has a wide range and high resolution, and can be continuously adjusted. Different fields of view can be selected for observation according to the researcher’s needs. At the same time, under high magnification, high-brightness and clear images that are difficult to achieve by general transmission electron microscopes can be achieved. The sample can be observed with a large depth of field, a large field of view, and as a three-dimensional image [42]. It is possible to directly observe the rough surface with large undulations and the uneven metal fracture of the sample, so that people have the feeling of being in the microscopic world [42]. Because of the above advantages of SEM technology, it is favored by many scholars in the analysis of rock and soil micro-structure. With the introduction of CT, compared with other technologies, CT technology has the advantages of real-time and non-destructive detection that can perform non-invasive scanning of the internal structure of objects. It is one of the most direct and accurate methods of characterizing the micro-structure of rock and soil mass, and it can carry out real three-dimensional reconstruction of rock and soil mass materials. Because the high-precision CT scanning technology has been unanimously recognized by experts and scholars, it has been extended to the geotechnical engineering community in recent years [43,44,45,46]. The research of CT scanning technology in soil is mainly concentrated on special soils such as loess, expansive soil, frozen soil, and coarse-grained soil. Among them, there is very little research on frozen soil, and the research direction mainly focuses on the evolution of soil micro-structure. The combination of triaxial shear test and CT scanning technology tracks the dynamic change characteristics of the soil structure under the action of force, which has played a good role in understanding the three-dimensional physical characteristics of the soil. Most of the research results relate to the use of intuitive CT images and the size and distribution of CT numbers to analyze and evaluate the micro-structure of the soil and its deformation and mechanical mechanisms [47].
Freezing and thawing is an important research topic in the field of frozen soil engineering. In recent years, there has been much research on soil freezing and thawing, and fruitful research results have been obtained. The existing results have basically ascertained the influence characteristics of freezing and thawing on soil porosity, permeability, particle size gradation, mineral composition and soil strength. Moreover, they have revealed the variation laws of soil strength, shape and particle size with the increase in cyclic freezing and thawing times. The periodic freezing and thawing process makes the structure of the soil undergo a strong change. During the cyclic freezing and thawing process, the water inside the soil migrates and redistributes, the pores and particle sizes change, the particles are rearranged, and the bonding force between the soil particles is destroyed, resulting in weakening of the soil structure. In addition, freezing and thawing have a two-way effect on the density of soil. The density of loose soil increases and the void ratio decreases, while the density of compact soil decreases and the void ratio increases [48]. These structural changes are changes in the physical and mechanical properties of the soil, which seriously reduce the physical and mechanical properties and durability of the soil [49]. The changes in the engineering geological properties of these soils will directly affect the stability of the foundation and superstructures. For example, a series of disasters such as subsidence, structural fracture, and foundation uplift will occur. Therefore, the impact of cyclic freezing and thawing on the engineering geological properties of soil has attracted more and more attention [50]. Glacial till is a special soil in alpine mountainous areas. Under the influence of the special climate in alpine mountainous areas, seasonal or day–night cycles of freezing and thawing are prone to occur. What is the correlation between the destruction process and mechanism of the meso-structure and micro-structure of glacial till before and after cyclic freezing and thawing? What are the critical hydraulic parameters required for the initiation of debris flow? These are important topics that have not yet been researched in depth, and need to be studied urgently. The research results can provide a basis for disaster prevention and mitigation and major project construction in alpine mountainous areas.

6. Conclusions

This paper uses CT scanning technology and SEM technology to study the meso-structure and micro-structure of the intact glacial till in the Moxi River Basin. Meso-structure and micro-structure images of the interior of intact glacial till are obtained and the porosity, particle shape, directivity and structural units are analyzed. The main conclusions are shown below:
(1)
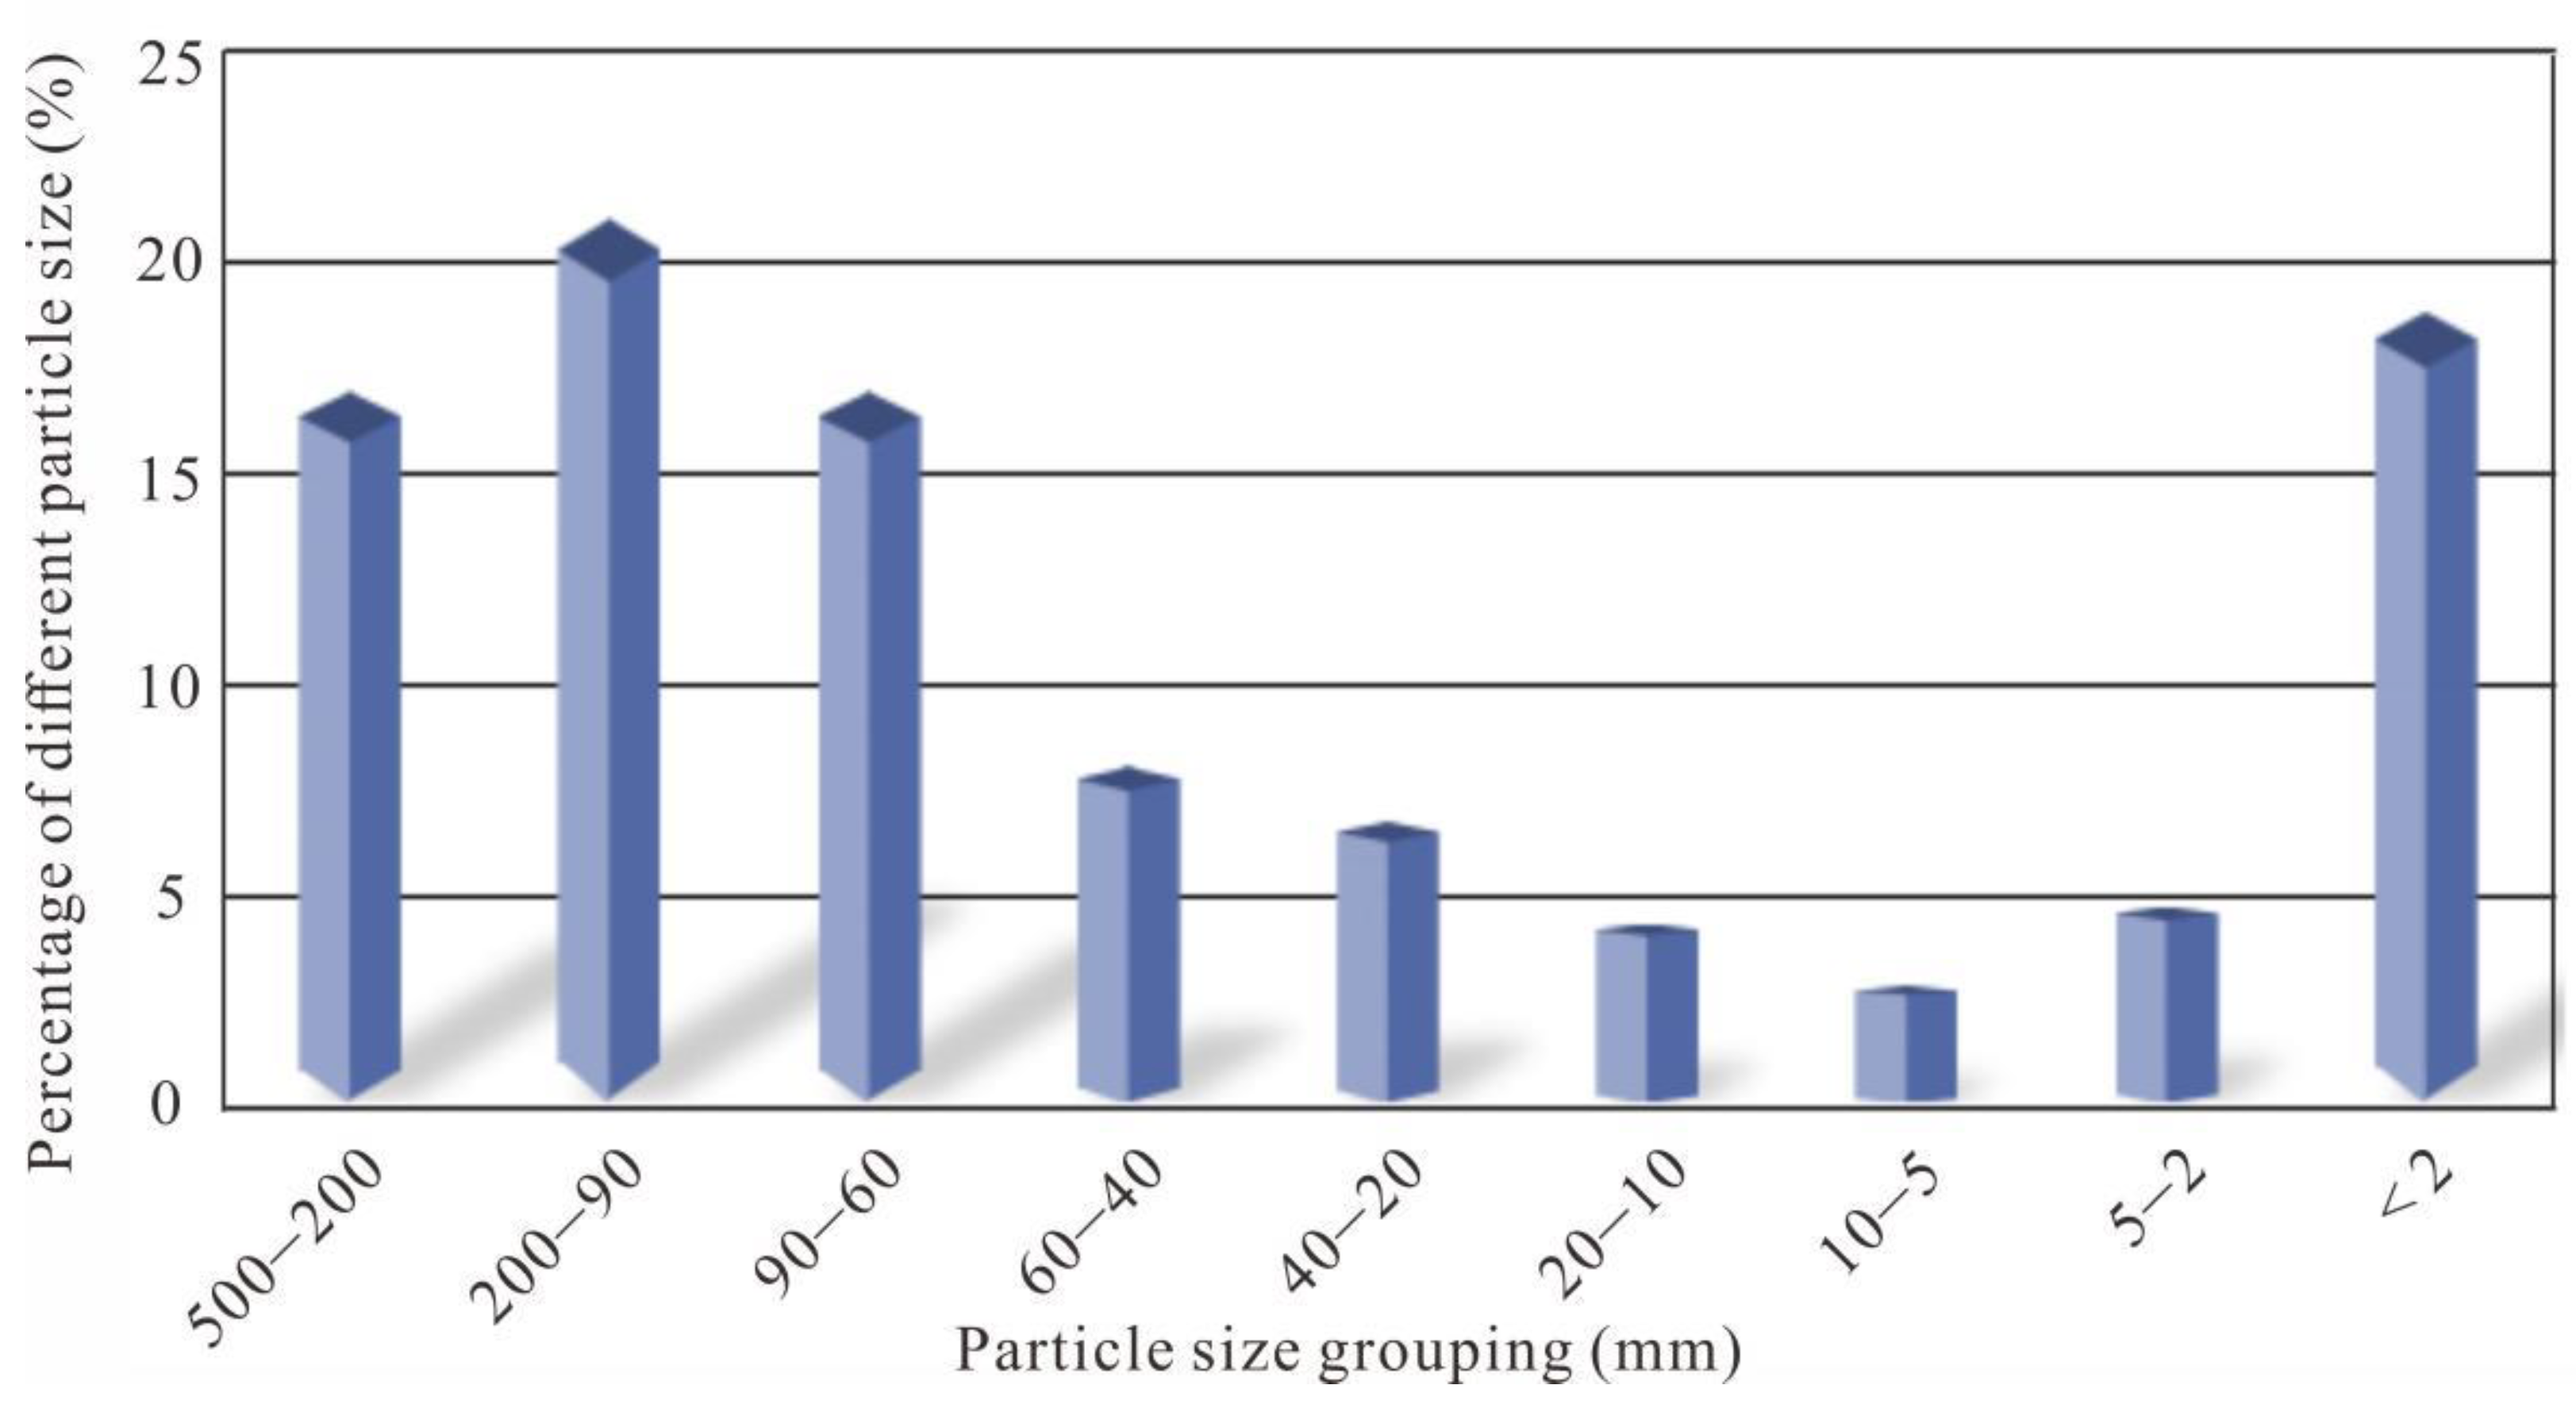
The intact glacial till in the Moxi River Basin has a wide range of particle size distribution and exhibits bimodal characteristics, mainly composed of huge particles such as boulders, followed by fine particles such as clay.
(2)
The bulk porosity of the intact glacial till is 24.09%, the average porosity of the longitudinal and horizontal sections is 24.92% and 24.35%, respectively, and the difference between the bulk and surface porosity is small.
(3)
The average circularity of the particles in the longitudinal and transverse sections is 0.836 and 0.802 and the average aspect ratios are 2.5 and 3.7, respectively. The shape of the particles in the longitudinal section is more circular than that in the transverse sections. The orientation of the particles in the transverse section direction is more obvious.
(4)
The main mineral components of the glacial till sample are mica, feldspar and quartz. In the process of transportation and deposition, the mineral particles have undergone different degrees of grinding, crushing and dissolution. The particles show mainly calcareous cementation, and the cementation is dense. The structure is mainly a skeleton structure composed of fine particles that are wrapped or filled. This structural feature of glacial till determines its good mechanical properties, and that it is not prone to damage, even under the conditions of cyclic freezing and thawing in the alpine mountainous area.

Author Contributions

Conceptualization, Y.Z. and Y.T.; methodology, Y.Z.; software, Y.Z. and L.W.; validation, Y.T. and L.W.; formal analysis, Y.Z. and J.L.; resources, Y.T.; data curation, Y.Z. and J.L.; writing—original draft preparation, Y.Z.; writing—review and editing, Y.T. and L.W.; project administration, Y.T.; funding acquisition, Y.T. All authors have read and agreed to the published version of the manuscript.

Funding

This research was funded by the National Natural Science Foundation of China (41772324), the State Key Laboratory of Hydraulics and Mountain River Engineering, and the China Postdoctoral Science Foundation funded project (2021M700608). Geological Survey Project of China Geological Survey (DD20221746).

Institutional Review Board Statement

Not applicable.

Informed Consent Statement

Not applicable.

Data Availability Statement

Not applicable.

Conflicts of Interest

The authors declare no conflict of interest.

References

  1. Lv, S.; Wang, N.; Hu, M.J.; Shen, J.H. Current status, problems and future trends of the research on engineering properties of moraine soil. J. Eng. Geol. 2011, 19, 307–312. (In Chinese) [Google Scholar]
  2. Sherpa, M.T.; Najar, I.N.; Das, S.; Thakur, N. Exploration of Microbial Diversity of Himalayan Glacier Moraine Soil Using 16S Amplicon Sequencing and Phospholipid Fatty Acid Analysis Approaches. Curr. Microbiol. 2021, 78, 78–85. [Google Scholar] [CrossRef] [PubMed]
  3. Barnes, M.; McLeod, C.L.; Chappell, C.; Faraci, O.; Gibson, B.; Krekeler, M.P.S. Characterizing the geogenic background of the Midwest: A detailed mineralogical and geochemical investigation of a glacial till in southwestern Ohio. Environ. Earth Sci. 2020, 79, 1–22. [Google Scholar] [CrossRef]
  4. Yun, T.; Jeong, Y.; Kim, K.; Min, K. Evaluation of rock anisotropy using 3D X-ray computed tomography. Eng. Geol. 2013, 163, 11–19. [Google Scholar] [CrossRef]
  5. Tie, Y. Source Converge Process and Hazards of Moraine-supply Debris Flow under the Condition of Freezing and Thawing. J. Catastr. 2012, 27, 12–16. (In Chinese) [Google Scholar]
  6. Boulton, G. Boulder shapes and grain-size distribution of debris as indicators of transport paths through a glacial and till genesis. Sedimentology 2010, 25, 773–799. [Google Scholar] [CrossRef]
  7. Tomar, A.; Sharma, T.; Singh, S. Strength properties and durability of clay soil treated with mixture of nano silica and Polypropylene fiber. Mater. Today Proc. 2020, 26, 3449–3457. [Google Scholar] [CrossRef]
  8. Cheng, Q.; Guo, X.F.; Yang, Y.H. Experimental Study of Shear Creep Characteristic of Moraine Soil in Dadu River Bridge in Luding. Adv. Eng. Sci. 2019, 51, 26–35. (In Chinese) [Google Scholar]
  9. Richard, R.P.; Kane, E.S.; Bronson, D.R.; Kolka, R.K. Long-Term Ecosystem Nutrient Pool Status for Aspen Forest Harvest Simulations on Glacial Till and Sandy Out wash Soils. Forests 2021, 12, 1556. [Google Scholar] [CrossRef]
  10. Ding, G.; Jiao, J.; Zhang, D. Modelling study on the impact of deep building foundations on the groundwater system. Hydrol. Process 2008, 22, 1857–1865. [Google Scholar] [CrossRef]
  11. Guo, L.; Yang, Y.; Zhao, Y. Reducing topsoil depth decreases the yield and nutrient uptake of maize and soybean grown in a glacial till. Land Degrad. Dev. 2021, 32, 2849–2860. [Google Scholar] [CrossRef]
  12. Xu, D.; Wang, B.; Jia, L.; Cao, Z. Cellular automation model for glacial soil simulation. Met. Mine 2007, 23, 60–62. (In Chinese) [Google Scholar]
  13. Luo, F.; He, J.; Zhu, Z.; Liu, E.; Zhang, Y. Study on deformation characteristics and nonlinear constitutive model of frozen moraine soil in cold region. J. Disaster Prev. Mitig. Eng. 2018, 38, 801–808. (In Chinese) [Google Scholar]
  14. Hinton, M.J.; Schiff, S.L.; English, M.C. Physical properties governing groundwater flow in a glacial till catchment. J. Hydrol. 1993, 142, 229–249. [Google Scholar] [CrossRef]
  15. Osborn, B.J.; Williams, D.G. Lodgepole pine tree-ring growth, Δ13C and the inverse texture effect across a soil chronosequence in glacial till. Plant Soil 2019, 443, 387–399. [Google Scholar] [CrossRef]
  16. Lebourg, T.; Riss, J. Pirard, E. Influence of morphological characteristics of heterogeneous moraine formations on their mechanical behaviour using image and statistical analysis. Eng. Geol. 2004, 73, 37–50. [Google Scholar] [CrossRef]
  17. Kauer, K.; Astover, A.; Viiralt, R. Evolution of soil organic carbon in a carbonaceous glacial till as an effect of crop and fertility management over 50 years in a field experiment. Agric. Ecosyst. Environ. 2019, 283, 106562. [Google Scholar] [CrossRef]
  18. Jiang, J.T.; Tie, Y.B.; Wang, S. Study on the forming mechanism of moraine-supplied debris flow—Take xiaohezi valley in the east slope of gongga mountain as an example. J. Geol. Hazards Environ. Preserv. 2016, 27, 21–25. (In Chinese) [Google Scholar]
  19. Chang, M.; Xiao, Y.S.; Chen, Z.Q. An industrial CT system for monitoring a running aero-engine. Nucl. Sci. Technol. 2014, 25, 60202. [Google Scholar]
  20. Zhou, R.; Zhou, Y. Study of solid-conversion gaseous detector based on GEM for high energy X-ray industrial CT. J. X-ray Sci. Technol. 2014, 22, 299–307. [Google Scholar] [CrossRef]
  21. Gong, W.L.; Wu, X.D.; Zhang, Z.X.; Zhao, H.Y. Study on microscopic damage features of coal-rock based on CT scanning. Coal Sci. Technol. 2018, 46, 117–125. (In Chinese) [Google Scholar]
  22. Cnudde, V.; Boone, M.N. High-resolution X-ray computed tomography in geosciences: A review of the current technology and applications. Earth Sci. Rev. 2013, 123, 1–17. [Google Scholar] [CrossRef] [Green Version]
  23. Whiting, B.R.; Massoumzadeh, P.; Earl, O.A. Properties of preprocessed sinogram data in x-ray computed tomography. Med. Phys. 2006, 33, 3290–3303. [Google Scholar] [CrossRef] [PubMed]
  24. Gan, Y.X.; Yang, F.; Wu, J.; Yu, Y. Application of scanning electron microscopy in rock-mineral analysis. J. Electron. Microsc. 2019, 38, 284–293. (In Chinese) [Google Scholar]
  25. Johnson, R.H.; Hall, S.M.; Tigar, A.D. Using Fission-Track Radiography Coupled with Scanning Electron Microscopy for Efficient Identification of Solid-Phase Uranium Mineralogy at a Former Uranium Pilot Mill (Grand Junction, Colorado). Geosciences 2021, 11, 294. [Google Scholar] [CrossRef]
  26. Wei, X.L.; Zhang, Y.X.; Zhang, S.; Zhang, J.C. A Study on the Morphology of Natural Microfractures in Marine and Continental Transitional Shale Based on Scanning Electron Microscopy Image. Micron 2021, 148, 103105. [Google Scholar] [CrossRef] [PubMed]
  27. Gao, G.R. Modern Soil Science; Southeast University Press: Nanjing, China, 1990. [Google Scholar]
  28. Peng, R.D.; Yang, Y.C.; Ju, Y.; Yang, Y.M. Computation of fractal dimension of rock pores based on gray CT images. Chin. Sci. Bull. 2011, 56, 3346–3357. [Google Scholar] [CrossRef] [Green Version]
  29. Blunt, M.; Bijeljic, B.; Dong, H.; Gharbia, O.; Iglauerc, S.; Mostaghimia, P.; Palusznya, A.; Pentlandal, C. Pore-scale imaging and modelling. Adv. Water Resour. 2013, 51, 197–216. [Google Scholar] [CrossRef] [Green Version]
  30. Dong, H.; Blunt, M.J. Pore-network extraction from micro-computerized-tomography images. Phys. Rev. E 2009, 80, 036307. [Google Scholar] [CrossRef] [Green Version]
  31. Pramanik, S.; Wettlaufer, J.S. Confinement-Induced Control of Similarity Solutions in Premelting Dynamics and Other Thin Film Problems. SIAM J. Appl. Math. 2019, 79, 938–958. [Google Scholar] [CrossRef] [Green Version]
  32. Hori, M.; Morihiro, H. Micromechanical analysis on deterioration due to freezing and thawing inporous brittle materials. Int. J. Eng. Sci. 1998, 36, 511–522. [Google Scholar] [CrossRef]
  33. Wang, L.; Yin, Y.; Huang, B.; Dai, Z. Damage evolution and stability analysis of the Jianchuandong Dangerous Rock Mass in the Three Gorges Reservoir Area. Eng. Geol. 2020, 265, 105439. [Google Scholar] [CrossRef]
  34. Nova, R.; Castellanza, R.; Tamagnini, C. A constitutive model for bonded geomaterials subject to mechanical and/or chemical degradation. Int. J. Numer. Anal. Met. 2003, 27, 705–732. [Google Scholar] [CrossRef]
  35. Zhang, K.; Wang, L.; Zhang, W.; Zhang, Z.; Zhou, H. Formation and Failure Mechanism of the Xinfangzi Landslide in Chongqing City (China). Appl. Sci. 2021, 11, 8963. [Google Scholar] [CrossRef]
  36. Yin, Y.; Wang, L.; Zhang, W.; Zhang, Z.; Dai, Z. Research on the collapse process of a thick-layer dangerous rock on the reservoir bank. B Eng. Geol. Environ. 2022, 81, 109. [Google Scholar] [CrossRef]
  37. Xiao, T.; Yu, L.; Tian, W.; Zhou, C.; Wang, L. Reducing local correlations among causal factor classifications as a strategy to improve landslide susceptibility mapping. Front. Earth Sci. 2021, 9, 781674. [Google Scholar] [CrossRef]
  38. Wang, L.; Wu, J.; Zhang, W.; Wang, L.; Cui, W. Efficient Seismic Stability Analysis of Embankment Slopes Subjected to Water Level Changes Using Gradient Boosting Algorithms. Front. Earth Sci. 2021, 9, 807317. [Google Scholar] [CrossRef]
  39. Li, C.S.; Zhang, D.; Wang, H.X. 3D mesh generation for soil-rock mixture based on CT scanning. Rock Soil Mech. 2014, 35, 2731–2736. (In Chinese) [Google Scholar]
  40. Miller, B.W.; Moore, J.W.; Barrett, H.H. 3D printing in X-ray and Gamma-Ray Imaging: A novel method for fabricating high-density imaging apertures. Nucl. Instrum. Meth. Phys. Res. 2011, 659, 262–268. [Google Scholar] [CrossRef] [Green Version]
  41. Wang, L.; Zhang, Z.; Huang, B.; Hu, M.; Zhang, C. Triggering mechanism and possible evolution process of the ancient Qingshi landslide in the Three Gorges Reservoir. Geomatics, Nat. Hazards Risk. 2021, 12, 3160–3174. [Google Scholar] [CrossRef]
  42. Yu, L.Z.; Lu, J. The fundamental principles and applications of scanning electron microscopy. Exp. Sci. Technol. 2019, 17, 85–93. (In Chinese) [Google Scholar]
  43. Cheng, Q.; Yang, Y.; Du, Y. Failure mechanism and kinematics of the Tonghua landslide based on multidisciplinary pre-and post-failure data. Landslides 2021, 18, 3857–3874. [Google Scholar] [CrossRef]
  44. Li, W.H.; Lu, S.F.; Xue, H.T.; Zhang, P.F.; Hu, Y. Microscopic pore structure in shale reservoir in the argillaceous dolomite from the Jianghan Basin. Fuel 2016, 181, 1041–1049. [Google Scholar] [CrossRef]
  45. Kleman, J.; Hättestrand, M.; Borgström, I.; Preusser, F.; Fabel, D. The Idre marginal moraine—An anchorpoint for Middle and Late Weichselian ice sheet chronology. Quat. Sci. Adv. 2020, 2, 100010. [Google Scholar] [CrossRef]
  46. Sachs, E.; Cima, M.; Cornie, J. Three-dimensional printing: Rapid tooling and prototypes directly from a CAD model. CIRP Ann. 1990, 39, 201–204. [Google Scholar] [CrossRef]
  47. Ross, D.J.K.; Bustin, R.M. The importance of shale composition and pore structure upon gas storage potential of shale gas reservoirs. Mar. Pet. Geol. 2009, 26, 916–927. [Google Scholar] [CrossRef]
  48. Konrad, J.M. Physical processes during freeze-thaw cycles in clayey silts. Cold Reg. Sci. Technol. 1989, 16, 291–303. [Google Scholar] [CrossRef]
  49. Ma, J. The Impact of Soft Clay Sensitivity on the Mechanical Properties. Soil Eng. Found. 2015, 29, 62–65. (In Chinese) [Google Scholar]
  50. Wang, L.; Zhang, Y.; Guo, J.; Ou, Q.; Liu, S.; Wang, L. Study on the catastrophic evolution of Tianshan Road slope under the freeze-thaw cycles. Geofluids 2021, 2021, 61288. [Google Scholar] [CrossRef]
Figure 1. Traffic location map of the study area.
Applsci 12 03040 g001
Figure 2. Geological map of the study area and location map of sampling points.
Applsci 12 03040 g002
Figure 3. Intact glacial till sample. (a) Field sampling point of glacial till. (b) Cylindrical gacial till sample.
Applsci 12 03040 g003
Figure 4. Different particle size distribution of glacial till samples.
Applsci 12 03040 g004
Figure 5. Gradation curve of intact glacial till samples.
Applsci 12 03040 g005
Figure 6. Processing flow of CT scan image.
Applsci 12 03040 g006
Figure 7. Schematic diagram of CT scanning. (a) Schematic diagram of CT scanning principle. (b) Schematic diagram of the CT scanning process.
Applsci 12 03040 g007
Figure 8. CT scanning of irregular soil sample. (a) 3D model of irregular sample. (b) X-section. (c) Y-section. (d) Z-section.
Applsci 12 03040 g008
Figure 9. CT scanning of standard cylinder. (a) 3D model of standard cylinder. (b) X-section. (c) Y-section. (d) Z-section.
Applsci 12 03040 g009
Figure 10. Transverse sectional and longitudinal sectional CT scanning before and after rendering.
Applsci 12 03040 g010
Figure 11. The spatial distribution of pores in the sample. (a) Pores distribution of original sample. (b) Pores distribution of sample after particles removal.
Applsci 12 03040 g011
Figure 12. Distribution map of pore gradient with different diameters. (a) Distribution map of pore gradient in the range of 0.01–0.49 mm. (b) Distribution map of pore gradient in the range of 0.5–0.99 mm. (c) Distribution map of pore gradient in the range of 1–1.49 mm. (d) Distribution map of pore gradient in the range of 1.5–1.99 mm. (e) Distribution map of pore gradient more than 2 mm.
Applsci 12 03040 g012
Figure 13. Porosity of each section.
Applsci 12 03040 g013
Figure 14. Pore size ratio of each section.
Applsci 12 03040 g014
Figure 15. The relationship between pore diameter and probability density.
Applsci 12 03040 g015
Figure 16. Particle shape statistics of glacial till samples: (a) X-section circularity statistics; (b) X-section aspect ratio statistics; (c) Y-section circularity statistics; (d) Y-section aspect ratio statistics; (e) Z-section circularity statistics; (f) Z-section aspect ratio statistics.
Applsci 12 03040 g016
Figure 17. The histogram of the grained rose in the CT scan of glacial till. (a) X–section particles long axis direction. (b) Y–section particles long axis direction. (c) Z–section particles long axis direction.
Applsci 12 03040 g017
Figure 18. Enlarged scanned images at different magnifications. (a) Enlarged the scanned image by 100 times. (b) Enlarged the scanned image by 200 times. (c) Enlarged the scanned image by 400 times. (d) Enlarged the scanned image by 1000 times.
Applsci 12 03040 g018
Table 1. Physical parameters of soil in cyclic freeze–thaw test.
ItemsRay Source (kv/w)Number of DetectorsScanning MethodScanning Time (min)Area Array Detector Size (mm)Scanning Speed (Frame/s)
Technical index300/5002048 × 2048Area array70400 × 4007.5
Table 2. Particle shape statistics of glacial till samples.
SectionIndexMaximumMinimumAverage Value
XCircularity0.9460.5310.826
Aspect ratio8.0861.8132.470
YCircularity0.9890.2980.845
Aspect ratio6.6991.3622.617
ZCircularity0.9210.6060.802
Aspect ratio6.6761.0573.700
Publisher’s Note: MDPI stays neutral with regard to jurisdictional claims in published maps and institutional affiliations.

