Article

Global Flood Disaster Research Graph Analysis Based on Literature Mining

1
State Key Laboratory of Resources and Environmental Information System, Institute of Geographic Sciences and Natural Resources Research, Chinese Academy of Sciences, Beijing 100101, China
2
College of Resources and Environment, University of Chinese Academy of Sciences, Beijing 100049, China
3
China-Pakistan Joint Research Centre on Earth Sciences, Islamabad 45320, Pakistan
4
Jiangsu Centre for Collaborative Innovation in Geographical Information Resource Development and Application, Nanjing 210023, China
*
Author to whom correspondence should be addressed.
Appl. Sci. 2022, 12(6), 3066; https://doi.org/10.3390/app12063066
Submission received: 3 March 2022 / Revised: 12 March 2022 / Accepted: 15 March 2022 / Published: 17 March 2022
(This article belongs to the Section Earth Sciences)

Abstract

:
Floods are the most frequent and highest-impact among the natural disasters caused by global climate change. A large number of flood disaster knowledge were buried in the scientific literature. This study mines research trends and hotspots on flood disasters and identifies their quantitative and spatial distribution features using natural language process technology. The abstracts of 14,076 studies related to flood disasters from 1990 to 2020 were used for text mining. The study used logistic regression to classify themes, adopted the dictionary matching method to analyze flood disaster subcategories, analyzed the spatial distribution characteristics of research institutions, and used Stanford named entity recognition to identify hot research areas. Finally, the disaster information was integrated and visualized as a knowledge graph. The main findings are as follows. (1) The research hotspots are concentrated on flood disaster risks and prediction. Rainfall, coastal floods, and flash floods are the most-studied flood disaster sub-categories. (2) There are some connections and differences between the physical occurrence and research frequency of flood disasters. Occurrence frequency and research frequency of flood disasters are correlated. However, the spatial distribution at the global and intercontinental scales is geographically imbalanced. (3) The study’s flood disaster knowledge graph contains 39,679 nodes and 64,908 edges, reflecting the literature distribution and field information on the research themes. Future research will extract more disaster information from the full texts of the studies to enrich the flood disaster knowledge graph and obtain more knowledge on flood disaster risk and reduction.

1. Introduction

Flood disasters are one of the 10 natural hazards [1] threatening human survival, featuring a wide influence range, strong paroxysm, frequent occurrence, and great harm. The Human Cost of Disasters 2000–2019 report claims that global natural hazards increased significantly in the first 20 years of the 21st century, noting that the increase in climate-related disasters has been especially “shocking” [2]. Flood disasters have increased from 1389 in the last 20 years to 3254, and storm disasters have increased from 1457 to 2034 [3]. The 2019 Global Natural Disaster Assessment Report showed that the annual average frequency of major global natural hazards from 1989 to 2019 was about 320, showing an initially increasing then decreasing trend. Flood and storm disasters are the most frequent, accounting for more than 60% of cases [4]. The 2020 Global Natural Disaster Assessment Report pointed out that flood disasters were the major natural hazards affecting the world in 2020 [5].
A large amount of flood disaster knowledge was buried in scientific literature. The scientific knowledge graph is a method used to quickly mine knowledge from literature for understanding global flood disaster research dynamics. It can analyze a body of literature in batches and identify research hotspots and frontiers. The scientific knowledge graph based on bibliometrics is superior to the traditional expert overview due to its simple, fast, and batch processing capabilities. Wang et al. used CiteSpace to conduct descriptive statistics and bibliometric analysis of 488 studies on comprehensive disaster risks amid climate change from 2008 to 2020 [6]. Shen et al. used CiteSpace and Gephi to generate national collaboration networks and discipline collaboration networks based on the literature related to natural hazards from 1900 to 2015 [7]. Wang et al. used statistical methods, such as co-word analysis, cluster analysis, and multi-scale analysis based on bibliometrics to identify the research status of flash flood disasters from 1996 to 2015 [8]. Cheng et al. used Bibexcel, VOSviewer and CiteSpace to conduct a bibliometric analysis of flood disaster risk research trends from 1990 to 2014 [9]. Han et al. used the SATI to find the main research hotspots of urban waterlogging using high-frequency keywords and journal sources from 2000 to 2015 [10]. Tan et al. examined the literature on the direct economic loss due to urban rainstorms and flood disasters from 1960 to 2019 and quantitatively described the annual evolution, journal distribution, main scholars, their cooperation network characteristics, and their research focuses using CiteSpace and VOSviewer [11]. Zeng et al. used Citespace tools to analyze the literature on flood disaster risk in the Web of Science core database from 1999 to 2018 and identified the number of articles, distribution characteristics, and distribution of research hotspots [12].
However, the bibliometric method relying on CiteSpace analyzes only the information about the literature, such as keyword co-occurrence, institutional cooperation networks, author cooperation network and so on. In-depth mining of article content is difficult [13]. By contrast, semantic knowledge graphs can provide new research ideas. Du et al. used flood emergency tasks at various emergency stages as keywords to search for relevant Chinese studies and identified model methods from abstracts to construct a semantic knowledge graph of flood disasters [14]. Song et al. adopted various text-mining approaches, such as TF-IDF and LDA, to identify the evolution of disasters and responses through research articles [15]. Zheng et al. explored the disaster literature using a data mining tool to find the relationships among typhoon disasters and build a disaster network [16]. Abburu et al. pointed out the problems of heterogeneous structure, massive documents, semantic gaps, and lack of domain knowledge regarding disasters, and proposed a method of extracting and integrating information from semi-structured texts related to disasters by using natural language processing [17]. Most of the research on natural hazards knowledge graphs is either disaster problem-oriented [18,19,20,21] or user-oriented [22,23,24,25,26]. Moreover, the main data used in these studies are disaster scene data, basic geographic data, or disaster news information. Few studies have examined semantic knowledge graphs of natural hazards based on massive literature data. Through missing these important resources, a clear gap is seen regarding how to use text mining to retrieve specific disaster knowledge and obtain more understanding about the relationship between disaster research and physical natural hazard events.
The aim of this paper is to analyze flood disaster research trends and hotspots and identify their quantitative and spatial distribution features supported by literature mining. This study retrieved the hidden knowledge about floods theme classification and subcategory, hotspot research area, research institutions, and their spatial distribution features using abstracts of the massive flood disaster-related literature, and consequently, a semantic knowledge graph about floods was constructed.

2. Materials and Methods

2.1. Data Acquisition

The research data were derived from the Disaster Risk Reduction Knowledge Service (DRRKS, http://drr.ikcest.org/, accessed on 1 March 2022), which was launched in 2016 by UNESCO with a disaster prevention and reduction mission and relies on the International Engineering Science and Technology Knowledge Center (IKCEST) of the Chinese Academy of Engineering, a UNESCO Category II Center. It is a knowledge service designed to provide resources for disaster data to facilitate knowledge discovery [27,28]. The DRR scholar module of the DRRKS contains various English-language studies related to natural hazards, which are derived from the Web of Science (WOS) database, the world’s largest comprehensive academic platform. This study used “flood” as the keyword to obtain search results for flood disaster-related studies appearing from 1990 to 2020.
Python web crawler technology was used to analyze and crawl the literature metadata in the search result list to obtain the URL of each document detail page. Each page was then analyzed to capture the title, authors, journal, address (the author’s affiliated institution), publication year, literature type, keywords, abstract, DOI, research field, link, and other fields. The abstract was the main data used in this study. Through screening, 14,076 pieces of literature metadata related to flood disasters were obtained and stored in the SQLite database (https://www.sqlite.org/index.html, accessed on 1 March 2022).
This study explored the distribution law of flood disaster research hotspot areas. It obtained 5551 global flood disaster events occurring from 1900 to 2020 from the EM-DAT database. The flood disaster frequency in each country was calculated and normalized. EM-DAT is an emergency management database maintained by the Centre for Research on the Epidemiology of Disasters (CRED). It records disasters that cause 10 or more deaths, or 100 or more affected individuals, or that trigger a national emergency, or a call for international assistance.

2.2. Research Methods and Data Processing

Figure 1 shows the technical roadmap of the study. The study first performed literature data acquisition via web crawlers from DRRKS. Then, a logistic model was trained to classify the literature themes. On this basis, literature screening was conducted to obtain the main data of this study. For the screened abstracts, dictionary matching was used to analyze flood disaster subcategories, and Stanford named entity recognition (NER) was used to identify flood disaster research hot areas. For the screened research institutions, Spacy NER was used to analyze the distribution law of the authors’ research institutions. Finally, the crawled and extracted disaster information was integrated to construct a flood disaster knowledge graph.
(1). Literature theme classification
This study divided the literature into 10 themes based on the emergency tasks listed in China’s emergency plans and procedures for natural hazards relief: flood risk, flood monitoring, flood disaster prediction and early warning, flood mapping, flood frequency, influencing analysis, flood disaster management, flood related research, other research with flood as the background, and completely unrelated research. Approximately 20% of the more than 14,000 flood-related studies were randomly selected as sample data for manual labeling. Then, this group was divided into training and verification according to a ratio of 7:3 to train and verify the logistic classification model. Finally, a trained logistic regression model was used to classify the other data in batches.
(2). Analysis of flood disaster subcategories
The Hazard Definition & Classification Review released by the Integrated Research on Disaster Risk (IRDR) in 2020 divides flood disasters into 10 categories: coastal, estuarine, flash, fluvial, groundwater water, ice jam, ponding, snowmelt, surface water, and glacial lake outburst flood. On this basis, urban, storm surges, and rainfall were added to the list. Therefore, this study divided flood disasters into 13 subcategories. Based on the results of the literature theme classification, the flood disaster literature items were rescreened, and the “other research with flood as background” and “completely unrelated research” categories were removed. The abstracts of the 5181 selected articles were used as the corpus, and the dictionary matching method was used to identify the flood disaster literature subclass.
(3). Identification of flood disaster hotspot research areas
The hot research areas on flood disasters were identified from the abstracts using the Stanford NER tool and location analysis. The study used English word segmentation with the Stanford tokenizer, stop word filtering, part of speech tagging with the Stanford Postagger, and English NER with the Stanford NER Tagger. Then, the location entities were screened as disaster research areas to conduct location analysis using Xpath and the Geonames placename dictionary to identify the country corresponding to each location. Finally, statistical analyses were performed.
(4). Analysis of research institutions
The literature offers important information about the author’s institutions, including the organization name, city, zip code, and country. Therefore, this study used the Spacy NER to identify ORG (such as companies, organizations, or institutions) and GPE (such as country, city, or state) entities from the institutional information. The study used Geonames as a placename dictionary to match the GPE entity to identify the country to which the GPE belonged and employed crawls using Xpath. Finally, ArcGIS10.2 was used for map visualization to explore the spatial distribution characteristics of research institutions in the field of flood disasters.

3. Results

3.1. Thematic Classification of Flood Disaster Literature

Table 1 shows the quantitative statistics on the themes related to flood disasters. The number of “other studies in the context of floods” is relatively large, accounting for 47.68%, followed by “irrelevant studies,” accounting for 15.52%. However, since both themes are less relevant to flood disasters, they are excluded from subsequent studies. Among the remaining seven categories, except for “flood related research,” the proportions of the other categories are all less than 10%. The proportions of “flood disaster risk” and “flood disaster simulation early warning” are relatively high, while that of “impact analysis” is the smallest.

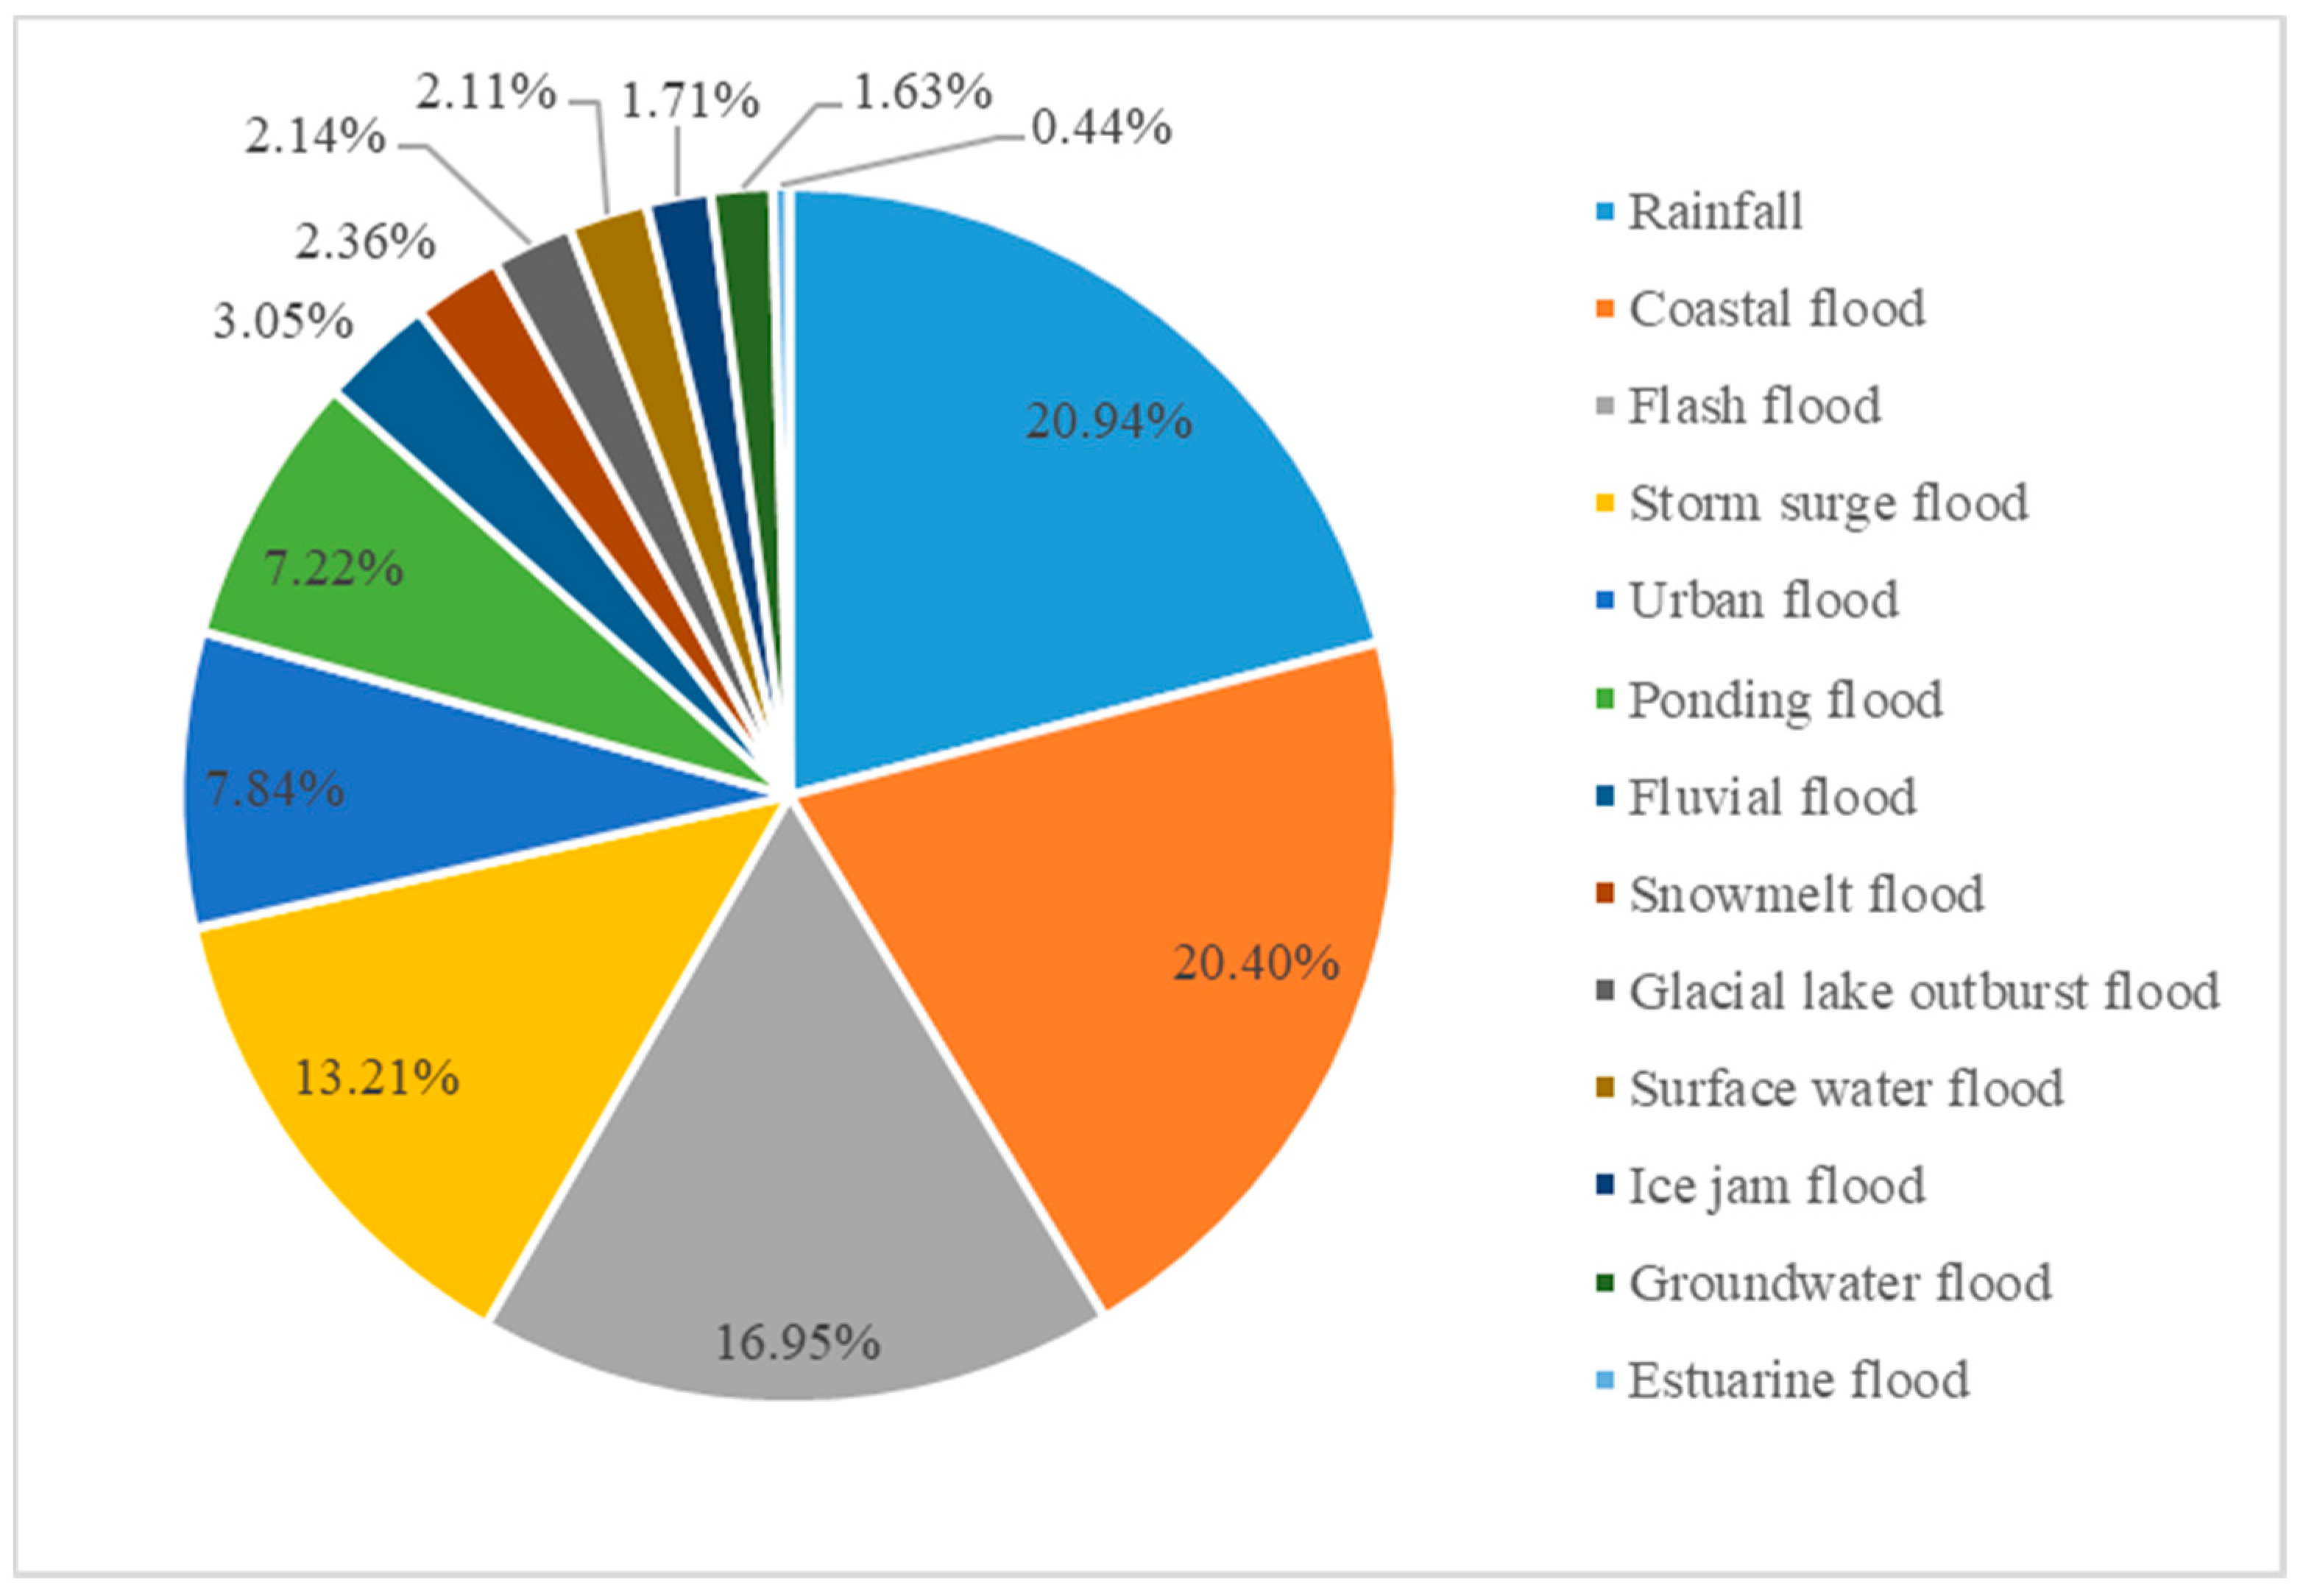
3.2. Analysis of Flood Disaster Subcategories

Using the dictionary matching method, the study found that 2755 articles contained flood disaster subcategories; the statistical results are shown in Figure 2. The number of rainfall and coastal floods was the largest, accounting for 41.34% of all flood disasters, followed by flash flood and storm surge flood, accounting for approximately one-third of the total. Seven flood disaster subcategories account for less than 10%, with values between 12 and 84. Among them, the number of estuarine floods was the lowest, accounting for 0.44%, and the number of fluvial floods was the highest, accounting for 3.05%, and the number of the other five subcategories was similar. Thus, research on flood disasters focuses on rainfall, coastal floods, and flash floods, which are also high-frequency disaster types.

3.3. Identification of Hot Flood Disaster Research Areas

Figure 3 illustrates the spatial distribution of the countries belonging to the flood disaster research hotspot group. A circle represents a country where a disaster occurred, and the size of the circle represents the occurrence frequency of floods in the country. Overall, hot areas for flood disaster research are distributed in Asia, Europe, North America, South America, Oceania, and Africa. The circles are densely distributed in Asia, Europe, America, and Africa. The circles in North America, Asia, and Europe are relatively large, while those in Africa and South America are relatively small, indicating that the frequency of flood disaster research areas in North America, Asia, and Europe is higher than in Africa and South America.
The top 20 countries in terms of frequency are indicated in blue numbers on the map. It can be seen that the top 20 high-frequency countries in the flood disaster research area are mainly distributed in Asia, Europe, North America, and Oceania. The frequency of occurrence is highest in the United States, reaching 1534, indicating that the flood disaster research area located in the United States is the hottest. China ranked second, and has the highest frequency of flood disaster research areas among Asian countries, with a frequency of 1160. India ranked third, has only 351 occurrences, much lower than the first two. In addition, there are 10 Asia countries among the top 20, and most hot areas are in Asia. Only six European countries are in the top 20, but the circle in this region is dense and slightly larger than that of Africa and South America. This indicates that this region is also the key prevention and control object for flood disasters. Australia has the highest frequency of occurrence In Oceania. No African nation is high-frequency, but the red circles are densely distributed throughout the region, indicating that, although flood disasters occur there, relatively little related flood disaster research has been conducted.
This study compared the occurrence frequency of flood disasters in each country from 1900 to 2020 in EM-DAT, as well as the frequency of the research area, taking the average value as the benchmark. Values exceeding the average were regarded as high, and those below it was regarded as low. Countries were divided into four types: high-frequency disasters and high-frequency studies (H-H type), high-frequency disasters but low-frequency studies (H-L type), low-frequency disasters but high-frequency studies (L-H type), and low-frequency disasters and low-frequency studies (L-L type). The spatial distributions are shown in Figure 4. The H-H types are concentrated in North America, Oceania, East Asia, North Asia, South Asia, Southeast Asia, and parts of southern and western Europe. Although Pakistan has a low level of economic development, it has attracted extensive attention from scholars because of the high frequency of natural hazards there. The frequency of flood disasters in Indonesia is much higher than the frequency of related studies. Therefore, although it is a hot research area, relatively few related studies have been conducted. The H-L types are concentrated in Africa, South America, and Southeast Asia. The relatively few L-H types are mainly located in Central Europe, which are mostly developed countries. The L-L types are concentrated in Africa, northern Europe, central Asia, and western Asia.

3.4. Analysis of Flood Disaster Research Institutions

The authors’ research institutions are in 130 countries, and the frequency distribution of each country is between 1 and 3139. The frequencies of the top 20 countries are shown in Figure 5. Most of the countries with high frequencies are in Europe, Asia, America, and Oceania. The highest frequency is in the United States, which appears 3139 times, far more than in other countries. Canada in North America and Brazil in South America also have high frequencies. Next is China, with a frequency of 1288, which is the highest frequency among Asian countries. The United Kingdom ranked third, has the highest frequency among European countries at 819. Half of the top 20 countries are European countries, with values ranging from 138 to 819, but none has a particularly prominent frequency. Australia has a relatively high frequency in Oceania. According to Munich Re, six of the 10 largest natural hazards in the world in 2020 occurred in the United States, while the severe flood disaster that occurred in China during the summer monsoon rainfall was Asia’s most severe natural hazard. Therefore, the impacts and losses caused by flood disasters have been sufficient to attract the attention of scholars in both China and the United States.

3.5. Construction of Flood Disaster Knowledge Graph

(1). Construction of data organization model
The study constructed a data model to reveal the data organization structure and integrated the extracted literature and flood disaster information. Figure 6 shows the flood disaster data organization model. Article_ID is a unique identifier that integrates the title, theme classification, flood disaster subcategory, research institution, author, keyword, discipline category, publication journal, publication year, full-text link, DOI, communication email, and other data for each article.
(2). Flood disaster knowledge graph construction
Using the study’s data organization model, the extracted flood disaster information and the crawled literature information were integrated in the form of triples, stored in the Neo4j native database, and visually displayed. The results are shown in Figure 7, which includes 39,679 nodes and 64,908 edges. Node labels include UID, theme, title, subcategory, institutions, keywords, doi, authors, link, journal, year published, and email. The relationship types include belong_to, subcalss_is, theme_is, etc. Nodes with different colors represent different categories of entities. The larger the node, the higher the level of the entity’s category. The red bubble indicates the root node of the flood disaster, the blue bubble represents the research theme, the orange bubbles represent the studies, and the other color bubbles represent the relevant information on each item in the literature. The left side of Figure 7 shows the overall distribution of 5181 flood disaster studies, which were divided into seven themes; the numbers of each theme were relatively evenly distributed. The right side of Figure 7 provides three literature items as an example, showing the details of each literature item in the flood disaster knowledge graph. The three articles can be connected with each other using “year” and “2019” as the same filed value. The knowledge graph can establish links between articles, and ultimately form an interconnected literature network.

4. Discussion

4.1. Research Hotspots of Flood Disasters

Theme classification and research institutions analysis shows that disaster risk and prediction research are the research hotspots in the field of flood disasters. The United States, China, and the United Kingdom are the main contributors to flood disaster research. Shen et al. concluded through bibliometric methods that the United States, China, and Italy were the three major contributors to natural disaster research and that prediction models, social vulnerability, and landslide inventory maps have been the main research hotspots in recent years [8]. Cheng et al. used keyword co-occurrence analysis to reveal that climate change, hydrology, and flood disaster risk management are the key research hotspots in this field [10]. Those earlier conclusions are consistent with the results of this study. Wang et al. concluded that the hotspots of flash flood disaster research focused on causes, impacts, and defense [9]. However, this study found less literature related to “impact analysis”, because its scope included various flood disaster categories in addition to flash flood disasters. In fact, an analysis of influencing factors is crucial for disaster risk assessment and simulation prediction for flood disaster risk reduction. It is necessary to grasp the influencing factors and include them in assessments and simulation prediction models to ensure that the results reflect reality as accurately as possible. Therefore, impact analysis is an important prerequisite for disaster risk assessment and simulation prediction, and research on impact analyses on flood disasters should be deepened.

4.2. Hot Areas of Flood Disaster Research

The Spearman correlation coefficient between the occurrence frequency and research frequency for flood disasters was only 0.679 at a 5% confidence level, indicating a positive correlation between the two but a weak one. High-frequency flood disasters and high-frequency research are concentrated in North America, Asia, and Oceania, while South America and Africa are low-frequency research areas. In terms of flood disaster occurrence frequency, the top 10 H-H type countries are China, India, Indonesia, the United States, the Philippines, Brazil, Pakistan, Bangladesh, Vietnam, and Iran. The top 10 H-L countries are Afghanistan, Colombia, Sri Lanka, Peru, Argentina, Haiti, Kenya, Ethiopia, Algeria, and Bolivia. The L-H type countries are Germany, Belgium, Austria, Poland, the Czech Republic, Portugal, Egypt, Jamaica, Switzerland, and the Netherlands. The top L-L types are Ghana, Mali, Cuba, Rwanda, Saudi Arabia, Burkina Faso, Nicaragua, Senegal, Zambia, and Benin.
There is an obvious geographical imbalance in flood disaster research. In global terms, high-frequency research is concentrated in East Asia, Oceania, Western Europe, North America, and Brazil. The regions with low frequency research are distributed in Latin America and the Caribbean, Africa, Eastern Europe, West Asia, Central Asia, and Southeast Asia. Although research in these areas is relatively “weak,” most of them are greatly affected by disasters. For example, on 12 January 2010, a strong earthquake of magnitude 7.3 occurred in Haiti in Latin America and the Caribbean region, which caused at least 223,000 deaths and affected nearly 1.5 million people [29,30]. On 14 July 2021, another 7.2 magnitude earthquake occurred in Haiti, which killed at least 2207 people and affected nearly 600,000 [31]. In Asia, the Orissa cyclone that occurred in eastern India in 1999 killed approximately 10,000 people in the coastal area of the Bay of Bengal [32], and Tropical Cyclone Amphan, which landed off the coast of West Bengal, India, on 20 May 2020, caused 102 deaths in India and Bangladesh and affected more than 13 million people [33]. In East Africa, the short and long rainy seasons in Kenya over the past two years were shorter than those in previous years. The consequent drought has caused severe water and food shortages, affecting approximately 2.1 million people [34].
In intercontinental terms, Figure 4 shows that the disaster occurrence and research in North America and Oceania are of the H-H type. South America is characterized by polarization. Brazil has attracted high-frequency disaster studies, but only a few studies have been conducted in other countries in the region. Asia is a mixture of four types with diverse distributions. Europe displays a gradient change in research frequency from high to low, from western Europe to middle and eastern Europe. Africa displays low frequency occurrence and low frequency research, but there are also internal differences among East Africa, Central Africa, and West Africa, which are distributed along a strip. Based on the above analysis, it is suggested to focus on regions with high-frequency disasters but low-frequency studies, such as Latin America and the Caribbean, Africa, Eastern Europe, and West Asia. These regions should increase investment in disaster prevention and reduction and pay more attention to policies.

4.3. Flood Disaster Knowledge Graph

This study integrated the crawled flood literature information and extracted information from the abstracts to construct a food disaster knowledge graph. It reflects the distribution of the literature on the research themes, the subcategories of flood disasters, field information, and the relationship between documents based on field values. Unlike the scientific knowledge graph based on CiteSpace [6,7,8], the visual display of the semantic knowledge graph for flood disaster can depict the overall distribution of literature data and identify the hot research topics. Based on the entity relationship connections, we can identify the relevant research distribution of each year, each disaster subcategory, and each journal. Unlike the traditional data integration method (i.e., document management database [35]), the knowledge graph is stored in the form of triples, and the entities are connected via relationships [36,37]. However, the current knowledge graph contains insufficient information and should be expanded in its coverage of the Chinese literature to mine more flood disaster information and enrich the flood disaster knowledge graph.
There are still some limitations in this study, such as data extraction from pictures and tables in the full text of the literature; multilingual literature mining. This paper only carried out text mining from English articles and will carry out research on literature in Arabic, Chinese, Russian, French and Spanish in the future.

5. Conclusions

To mine the trends and hotspots of flood disaster research and identify its quantitative and spatial distribution features, 14,076 studies related to flood disasters published from 1990 to 2020 were examined to conduct theme classifications and identify disaster subcategories, hot research areas, and research institutions with the help of natural language processing technology. The following conclusions were drawn. (1) Flood disaster risk and prediction research are research hotspots in the field of flood disasters. The United States, China, and the United Kingdom are the main contributors to flood disaster research. Rainfall, coastal floods, and flash floods are the top three flood disaster subcategories. (2) The hot areas of flood disaster research are distributed in Asia, Europe, America, South America, Oceania, and Africa. There are some connections and differences between the physical occurrence and research frequency of flood disasters. Occurrence frequency and research frequency of flood disasters are correlated in flood disaster research. However, the spatial distribution at the global and intercontinental scales is geographically imbalanced. The H-H type countries are mainly concentrated in North America and East Asia. The H-L type countries are mainly concentrated in Africa and South America. The L-H type countries are mainly distributed in Central Europe. The L-L type countries are distributed in Africa and Northern Europe. (3) The flood disaster knowledge graph contains 39,679 nodes and 64,908 edges, which reflect the distribution of studies on various research themes, the subcategories of flood disasters, field information, and the relationships between documents in terms of field values.

Author Contributions

Conceptualization, M.Z. and J.W.; Data curation, M.Z. and J.W.; Formal analysis, M.Z. and J.W.; Funding acquisition, J.W.; Investigation, M.Z.; Methodology, M.Z. and J.W.; Project administration, J.W.; Resources, M.Z. and J.W.; Software, M.Z.; Supervision, J.W.; Validation, M.Z. and J.W.; Visualization, M.Z.; Writing—original draft, M.Z.; Writing—review & editing, M.Z. and J.W. All authors have read and agreed to the published version of the manuscript.

Funding

This research was funded by the National Natural Science Foundation of China, grant number 42050105; the Chinese Academy of Sciences, grant number ZDRW-XH-2021-3; the Construction Project of the China Knowledge Center for Engineering Sciences and Technology, grant number CKCEST-2021-2-18.

Institutional Review Board Statement

Not applicable.

Informed Consent Statement

Not applicable.

Data Availability Statement

Not applicable.

Conflicts of Interest

The authors declare no conflict of interest.

References

  1. United Nations Office for Disaster Risk Reduction International Science Council. UNDRR-ISC Hazard Definition and Classification Review—Technical Report. 2020. Available online: https://www.preventionweb.net/publication/hazard-definition-and-classification-review (accessed on 1 March 2022).
  2. Maziar, Y.; Mohammad, M.; Martin, L.; David, S. A modelling framework to design an evacuation support system for healthcare infrastructures in response to major flood events. Prog. Disaster Sci. 2022, 13, 100218. [Google Scholar] [CrossRef]
  3. UNDRR. Human Cost of Disaster 2000–2019. 12 October 2020. Available online: https://www.undrr.org/publication/human-cost-disasters-2000-2019 (accessed on 26 August 2021).
  4. Ministry of Emergency Management of the People’s Republic of China. “2019 Global Natural Disaster Assessment Report” Released Last Year’s Global Natural Disasters Were Generally Lighter, and Chinese Disaster Losses Were among the Highest in the World. 8 May 2020. Available online: https://www.mem.gov.cn/xw/bndt/202005/t20200508_352281.shtml (accessed on 26 August 2021).
  5. Academy of Disaster Reduction and Emergency Management Ministry of Emergency Management & Ministry of Education. “Global Disaster Data Platform (Chinese Version)” on May 12 Line, the “2020 Global Natural Disaster Assessment Report (Abstract in Chinese)” Was Released Simultaneously. 12 May 2021. Available online: http://adrem.bnu.edu.cn/xwkx/231044.html (accessed on 26 August 2021).
  6. Wang, L.; Gong, Z.; Shi, L.; Hu, Z.; Shah, A.A. Knowledge mapping analysis of research progress and frontiers in integrated disaster risk management in a changing climate. Nat. Hazards 2021, 107, 2033–2052. [Google Scholar] [CrossRef]
  7. Shen, S.; Cheng, C.; Yang, J.; Yang, S. Visualized analysis of developing trends and hot topics in natural disaster research. PLoS ONE 2018, 13, e0191250. [Google Scholar] [CrossRef] [PubMed]
  8. Wang, H.; Zheng, S.; Cao, Y. Research review on the analysis of mountain torrents disaster situation based on the statistics of keywords. J. China Inst. Water Resour. Hydropower Res. 2017, 15, 29–36. [Google Scholar]
  9. Cheng, X.; Dai, M. Bibliometric analysis of the team and development of the research on the flood disaster risk situation. J. Anhui Norm. Univ. (Nat. Sci.) 2017, 40, 275–281. [Google Scholar]
  10. Han, H.; Jiang, R.; Xie, J.; Xiang, Y.; Wang, Y. Research progress of urban water-logging in China based on bibliometrics. J. Water Resour. Water Eng. 2017, 28, 134–138. [Google Scholar]
  11. Tan, L.; Yao, W.; Li, L. Direct economic loss assessment of urban storm flood disasters based on bibliometric analysis. J. Catastrophol. 2020, 35, 179–185. [Google Scholar]
  12. Zeng, J.; Wang, Q.; Guo, H. Knowledge map analysis and progress review of international research on flood disaster risk. J. Catastrophol. 2020, 35, 127–135. [Google Scholar]
  13. Cheng, Q.; Zhu, Y.; Song, J.; Zeng, H.; Wang, S.; Sun, K.; Zhang, J. Bert-Based Latent Semantic Analysis (Bert-LSA): A Case Study on Geospatial Data Technology and Application Trend Analysis. Appl. Sci. 2021, 11, 11897. [Google Scholar] [CrossRef]
  14. Du, Z.; Li, Y.; Zhang, Y. Knowledge graph construction method on natural disaster emergency. Geomat. Inf. Sci. Wuhan Univ. 2020, 45, 1344–1355. [Google Scholar]
  15. Song, K.; Kim, D.-H.; Shin, S.-J.; Moon, I.-C. Identifying the evolution of disasters and responses with network-text analysis. In Proceedings of the 2014 IEEE International Conference on Systems, Man, and Cybernetics (SMC), San Diego, CA, USA, 5–8 October 2014. [Google Scholar] [CrossRef]
  16. Zheng, L.; Wang, F.; Zheng, X. Complex network construction method to extract the nature disaster chain based on data mining. In Proceedings of the 2017 7th IEEE International Conference on Electronics Information and Emergency Communication (ICEIEC), Macau, China, 21–23 July 2017. [Google Scholar]
  17. Abburu, S.; Golla, S.B. Ontology and NLP support for building disaster knowledge base. In Proceedings of the 2017 2nd International Conference on Communication and Electronics Systems (ICCES), Coimbatore, India, 19–20 October 2018. [Google Scholar]
  18. Li, Z.; Xu, S.; Li, B.; Li, J.; Management, S.O. Information fusion technology of disaster scenario based on knowledge graph. J. North China Inst. Sci. Technol. 2019, 16, 1–5. [Google Scholar]
  19. Wang, H.; Zhang, F.; Xie, X.; Guo, M. DKN: Deep knowledge-aware network for news recommendation. In Proceedings of the 2018 World Wide Web Conference, Lyon, France, 23–27 April 2018; pp. 1835–1844. [Google Scholar]
  20. Purohit, H.; Kanagasabai, R.; Deshpande, N. Towards Next Generation Knowledge Graphs for Disaster Management. In Proceedings of the 2019 IEEE 13th International Conference on Semantic Computing (ICSC), Newport Beach, CA, USA, 30 January–1 February 2019. [Google Scholar]
  21. Zhu, Q.; Zeng, H.; Ding, Y. A review of major potential landslide hazards analysis. Acta Geod. Cartogr. Sin. 2016, 51, 396–403. [Google Scholar]
  22. Tao, K.; Zhao, Y.; Zhu, P. Knowledge graph construction for integrated disaster reduction. Geomat. Inf. Sci. Wuhan Univ. 2020, 45, 1296–1302. [Google Scholar]
  23. Li, W.; Zhu, J.; Zhang, Y.; Fu, L.; Cao, Y. An on-demand construction method of disaster scenes for multilevel users. Nat. Hazards J. Int. Soc. Prev. Mitig. Nat. Hazards 2020, 101, 409–428. [Google Scholar] [CrossRef]
  24. Zhang, Y.; Zhu, J.; Zhu, Q.; Xie, Y.; Li, W.; Fu, L.; Zhang, J.; Tan, J. The construction of personalized virtual landslide disaster environments based on knowledge graphs and deep neural networks. Int. J. Digit. Earth 2020, 13, 1637–1655. [Google Scholar] [CrossRef]
  25. Google. The GDELT Project. 11 November 2020. Available online: https://www.gdeltproject.org (accessed on 3 September 2021).
  26. Rudnik, C.; Ehrhart, T.; Ferret, O. Searching News Articles Using an Event Knowledge Graph Leveraged by Wikidata. In Proceedings of the Web Conference, San Francisco, CA, USA, 13–17 May 2019. [Google Scholar]
  27. Wang, J.; Bu, K.; Yang, F.; Yuan, Y.; Wei, H. Disaster risk reduction knowledge service: A paradigm shift from disaster data towards knowledge services. Pure Appl. Geo-Phys. 2019, 177, 135–148. [Google Scholar] [CrossRef]
  28. Wang, J.; Han, X.; Bu, K.; Zhang, M.; Wang, X.; Yuan, Y. Knowledge service system on disaster risk reduction and its application in social media analysis. J. Glob. Chang. Data Discov. 2020, 4, 25–32. [Google Scholar] [CrossRef]
  29. Margesson, R.; Taftmorales, M. Haiti Earthquake: Crisis and Response. Library of Congress. Congressional Research Service. 2010. Available online: https://digital.library.unt.edu/ark:/67531/metadc501690/m1/1/high_res_d/R41023_2010May06.pdf (accessed on 1 March 2022).
  30. Hough, S.E.; Altidor, J.R.; Anglade, D. 7.0 Haiti earthquake. Nat. Geosci. 2010, 3, 778–782. [Google Scholar] [CrossRef]
  31. YNET. Haiti Earthquake Death Toll Rises to 2207, Nearly 600,000 People are Directly Affected. 23 August 2021. Available online: https://t.ynet.cn/baijia/31314429.html (accessed on 23 November 2021).
  32. Ecns. Extremely Strong Cyclone “Ampan” Is Approaching the Coastal Areas of the Bay of Bengal, India and Bangladesh Plan to Arrange the Evacuation of 3 Million People. 20 May 2020. Available online: https://baijiahao.baidu.com/s?id=1667145514410868535&wfr=spider&for=pc (accessed on 23 November 2021).
  33. Sina. Extremely Strong Cyclone “Ampan” Has Killed 102 People and Is Expected to Cost India US$13 Billion. 23 May 2020. Available online: https://tech.sina.com.cn/roll/2020-05-23/doc-iirczymk3188609.shtml (accessed on 23 November 2021).
  34. Xinhua News Agency. Kenya’s Drought Continues, 2.1 Million People Face Famine. 23 November 2021. Available online: http://www.news.cn/world/2021-10/27/c_1128000644.htm (accessed on 23 November 2021).
  35. Qiu, L. A Smart Aggregation Method of Spatial-Temopral Data for Natural Disaster Emergency Tasks. Ph.D. Thesis, Wuhan University, Wuhan, China, 2017. [Google Scholar]
  36. Sowa, J.F. Principles of Semantic Network: Exploration in the Representation of Knowledge; Morgan Kaufmann: San Mateo, CA, USA, 1991; pp. 135–137. [Google Scholar]
  37. Qi, G.; Gao, H.; Wu, T. The research advances of knowledge graph. Technol. Intell. Eng. 2017, 3, 4–25. [Google Scholar]
Figure 1. Technology roadmap.
Applsci 12 03066 g001
Figure 2. Quantitative statistics on flood disaster subcategories.
Applsci 12 03066 g002
Figure 3. Spatial distribution of hot flood disaster research areas (only the top 20 countries are labeled).
Applsci 12 03066 g003
Figure 4. Spatial distribution of flood disaster occurrence and hot research areas.
Applsci 12 03066 g004
Figure 5. Spatial distribution of flood disaster research institutions (only the top 20 countries are labeled).
Applsci 12 03066 g005
Figure 6. Organization model of flood disaster literature data.
Applsci 12 03066 g006
Figure 7. Visualization of flood disaster knowledge graph.
Applsci 12 03066 g007
Table 1. Quantitative statistics on literature themes.
ThemeQuantityProportion
Flood frequency5423.85%
Influence analysis2982.12%
Disaster management4643.30%
Simulation and warning7995.68%
Flood risk10807.67%
Disaster monitoring4443.15%
Flood related research155411.04%
Other related research under the flood background671147.68%
Irrelevant research218415.52%
Total14,076100.00%
Publisher’s Note: MDPI stays neutral with regard to jurisdictional claims in published maps and institutional affiliations.

