Abstract
A suspended ceiling system (SCS) is one of the most fragile and non-structural elements during earthquakes. However, effective seismic protection technologies for enhancing the suspended ceiling system have not been developed other than the steel bracing system. An innovative passive vibration control system is proposed in this paper, which equipped a damper-employed pulley amplification mechanism into the indirect suspended ceiling system, named the pulley–damper ceiling system (PDCS). Theoretical formulation and the detailed information on the system were presented first. In addition, a new rotational damper composition consisting of a non-linear viscous damper was developed to follow the large wire-cable stroke. Six types of the full-scale ceiling specimens of a 15.6-square meter area with different configurations were constructed for the preliminary experiments to evaluate the seismic performance and feasibility of PDCS under simulated earthquake motions. The comparative results of the shake table test demonstrated that the application of PDCS is capable of controlling both displacement and acceleration of the ceiling panels. This study also presents the nonlinear time history analyses by modeling a wire-cable as an equivalent truss element to transmit the relative displacement of the ceiling system to the damper. The analytical model accurately simulated the dynamic behavior of PDCS.
1. Introduction
The experience of countless earthquake events accelerated the development of seismic protection technologies for main structural frames, such as base isolation structures and vibration control devices. These systems are widely applied in structural design in Japan, especially after the 1995 Kobe earthquake, and their effectiveness in reducing the shaking was verified during the 2011 Great East Japan Earthquake [1]. Meanwhile, only a little attention has been paid to the seismic performance of nonstructural elements and/or secondary structures, including, for example, suspended ceilings, exterior walls, fire extinguishing equipment (fire door and sprinkler), piping installation, and lighting equipment [2,3].
During the consideration of nonstructural elements, a suspended ceiling system (hereinafter referred to as SCS), which is one of the most commonly used in large indoor public spaces, is fragile to the shaking during earthquake events [4]. The vulnerability of SCS in past earthquakes has been extensively documented. For instance, in Japan, the ceiling falls in indoor sports facilities, including a gymnasium in school, shopping mall, and airports terminal, were previously reported in the 2003 Tokachi-Oki earthquake [5] and the 2016 Kumamoto earthquake [6]. Moreover, the damage to the SCS has been reported in various countries, namely, in the 1994 Northbridge earthquake in the United States [7], the 2010 Chile earthquake [8], the 2016 Gyeongju earthquake, and the 2017 Pohang earthquake in Korea [9]. In addition, the failure and collapse of ceiling panels would cause, not only blocking evacuation paths and impending continuous operation of the building, but also human damage. During the 2011 Great East Japan Earthquake, there were more than 75 casualties caused by the collapsing of approximately 2000 SCSs [10,11].
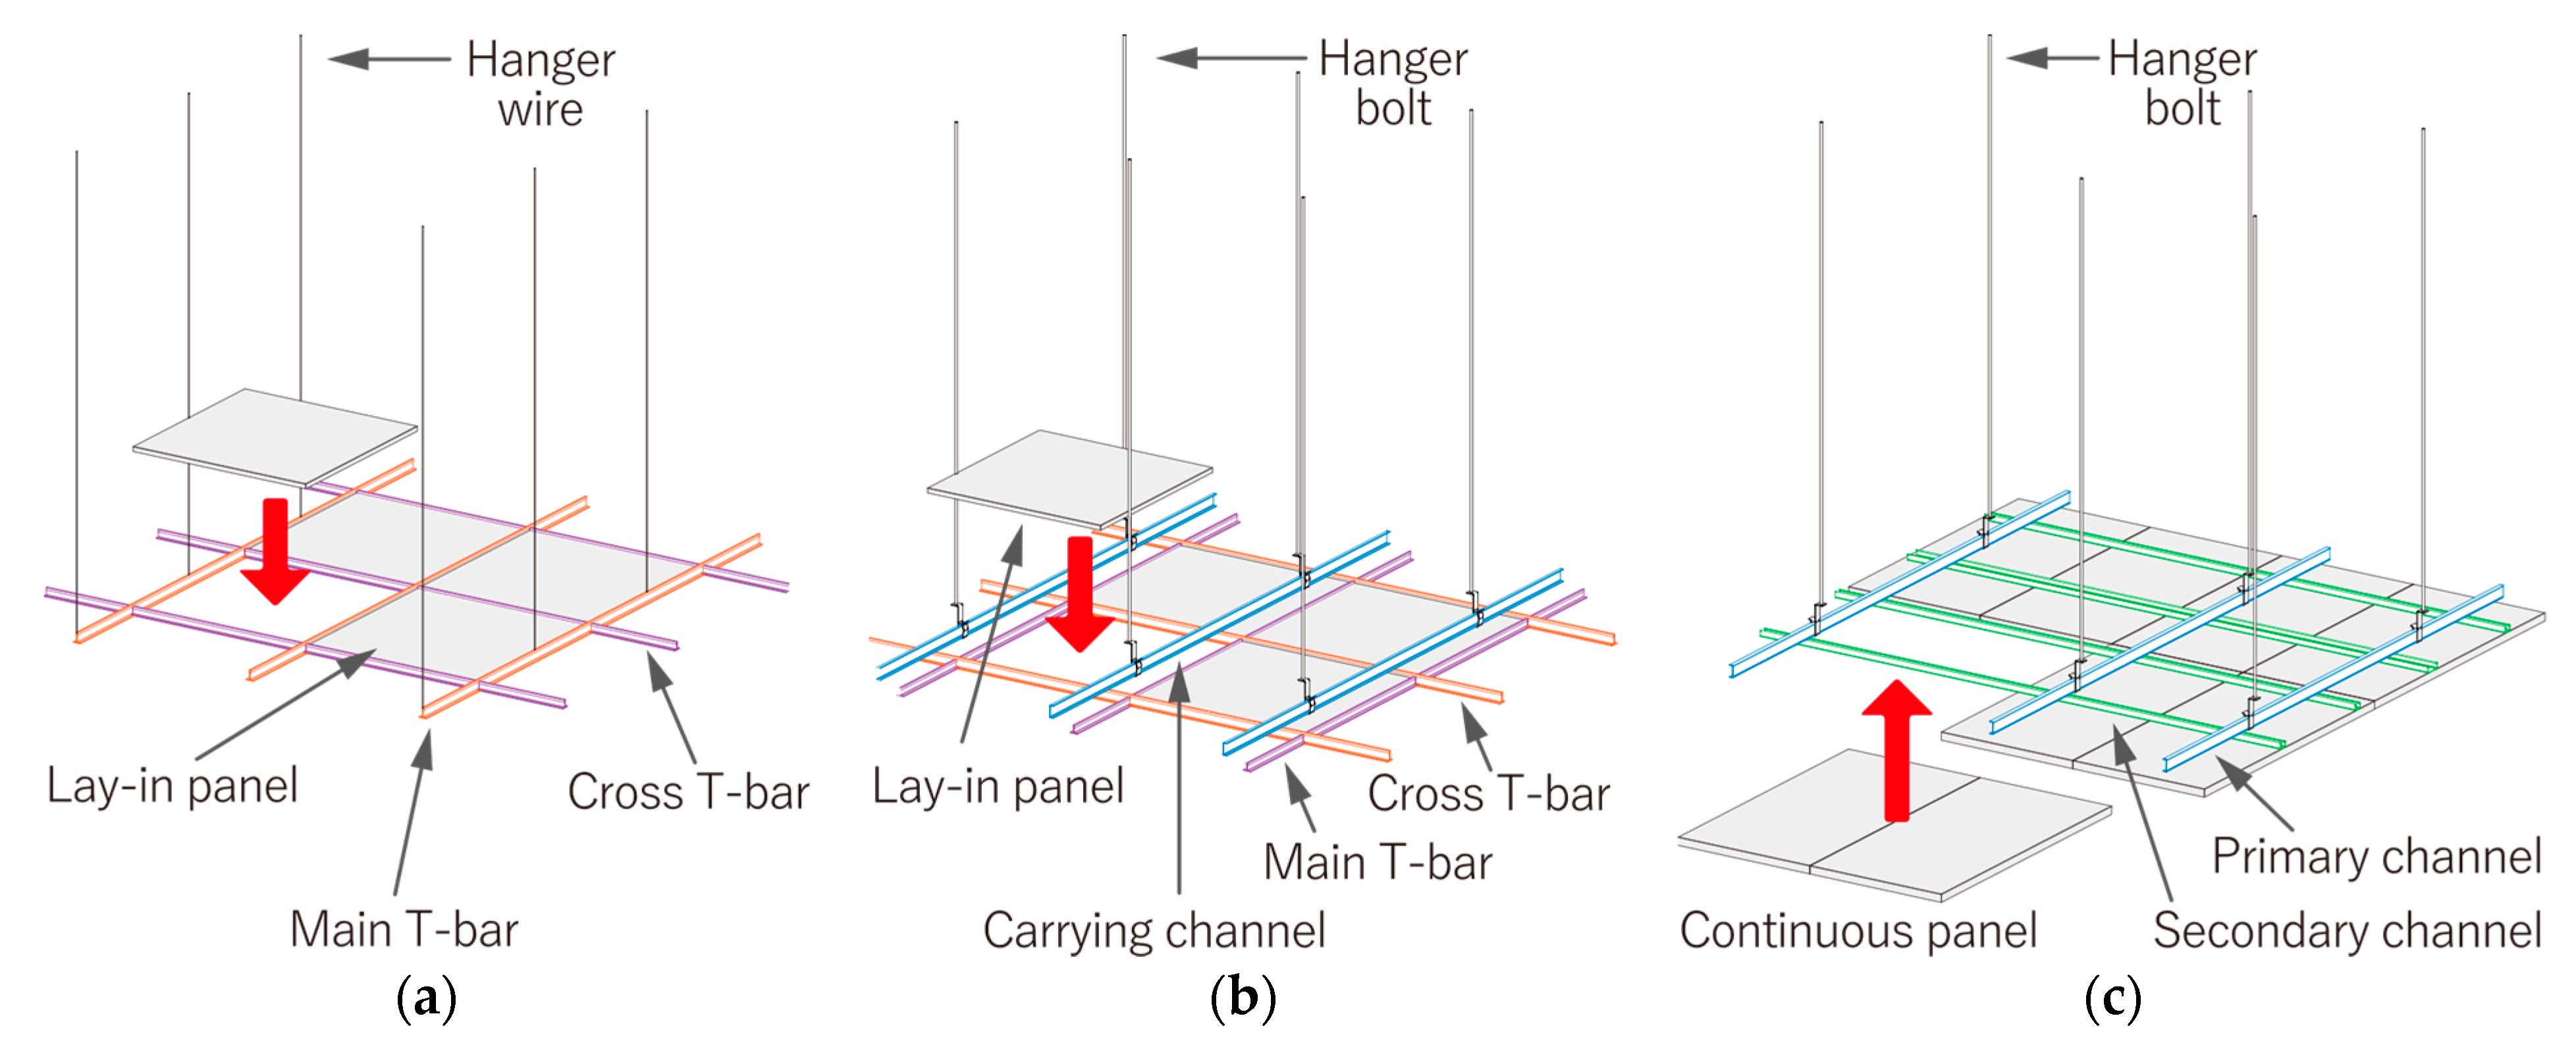
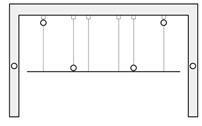
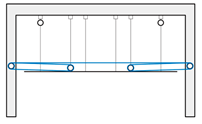
The SCS is composed mainly of hanger elements, carrying ceiling runners, and ceiling panels. Based on the structure of the ceiling runner, the SCS can be classified into two types [12]: the direct-hung suspended ceiling system (direct-SCS) and indirect-hung suspended ceiling system (indirect-SCS). Figure 1 shows the schematic diagram of the SCS. The key difference between them is the connection of the cross runner and hanger elements. In the direct-SCS (Figure 1a), the primary runners are directly suspended from wires attached to the structural system above, and cross joints are applied to the secondary runners to insert between the span of the primary runners. Meanwhile, the indirect-SCS (Figure 1b,c) uses hanger bolts to suspend primary runners from the above floor, and primary runners and secondary runners are connected using clips.
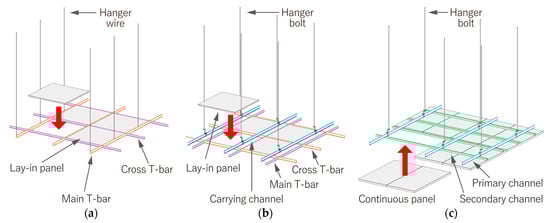
Figure 1.
Type of suspended ceiling systems: (a) Direct-hung suspended ceiling system; (b) indirect-hung suspended ceiling system with lay-in panel; (c) indirect-hung suspended ceiling system with continuous panel.
On the one hand, as the direct-SCS is widely used because of its convenience when changing the ceiling panels, relocating the attached air conditioner unit, and the lighting equipment in the practice, most of the previous studies focused on evaluating and understanding the seismic response of the direct-SCS by using a shake table for more than two decades. The main finding from those experiments was about the connection failure of the ceiling grid members due to the collision between ceiling panels and the surrounding structures, including walls. To overcome this issue and improve the seismic performance, several studies were performed on the hanger connection [12,13], the perimeter [14,15,16], retainer clip [17], and the cross joint [18,19]. In addition to these studies, few researchers proposed and investigated the feasibility of a pendulum-type ceiling system that does not use any rigid elements and is completely separated from the surrounding wall, with an aim to reduce ceiling damage in the earthquake [20,21]. Similarly, Fiorino [22] presented the application of flexible braces (lightweight steel) integrated into the SCS to absorb the input energy.
On the other hand, research on the indirect-SCS is recently becoming active. Based on their response behavior in the earthquake, the indirect-SCS can be divided into two types [23]: a continuous panel ceiling and a lay-in panel type (Figure 1). In the case of the lay-in panel SCS, the seismic performance decreases rapidly, owing to the lack of lateral stiffness when one panel falls, which is due to the unfastening of the ceiling runner. Therefore, the continuous panel SCS has been certified to perform low fragility because the larger area panels are fixed on the bottom surface of runners and the entire ceiling moves together [24]. The superiority of the continuous ceiling panel was also verified based on the seven types of direct and indirect SCSs using an array of two shaking tables [9].
In August 2013, a new technical bulletin of the suspended ceilings system “Determining a Safe Structural Method for Specific Ceilings and Specific Ceiling Structural Strengths” Notice No. 771 was established by the Ministry of Land, Infrastructure, Transport and Tourism (MLIT). According to this report, when the SCS is installed with more than 200 square meters with the end clearance and the mass per unit area is over 2 kg including the attached equipment, the required number of steel braces should be placed. The effect of damage reduction of the SCS with braces following the technical bulletin has been verified through a full-scale shaking table experiment of a school gym with approximately 550 square meters conducted at the E-Defense earthquake simulator in Japan [25]. However, Lee et al. [12] investigated the arrangement and the location of braces on the entire ceiling system through a shaking table test and indicated the necessity for consideration that the relative displacement occurs between the installed brace part and may cause the panel to fall out. Despite this, the separation distance of the braces for the installation is not explained in detail in the technical bulletin. Moreover, the installation of many braces greatly disturbs the facility design above the ceiling panel and decreases the advantage to adopt it. In addition, a rigid-brace-based ceiling design amplifies the acceleration from the above hanging structure and causes great influence on the interactions between SCS and other nonstructural elements [26,27,28]. Liangjie et al. [29] investigated the mechanism of the dynamic behavior between ceiling panels and suspended equipment, and revealed that the restriction by friction force between them is very limited and the air conditioner unit would collide even under a Level 1 earthquake. Furthermore, during a full-scale shaking table test of a five-story steel building using the E-Defense shake table, additional concern arose that the use of the bracing system increases the damage of SCS when subjected to the strong vertical excitation over about 1.0 G [30]. The rigid elements constrain the ceiling movement, so the acceleration difference between the fixed ceiling grid and the unfixed part makes the ceiling unstable and drop off.
In this study, an innovative passive control system employing pulley mechanisms into the SCS (hereinafter referred to as the pulley–damper ceiling system: PDCS) is proposed and the feasibility is evaluated through a full-scale shaking table test and simulation analysis. The proposed ceiling vibration control system is aimed to mitigate both the acceleration response and displacement response of the SCS and eliminate the possibilities of a ceiling system collapse even during a Level 2 earthquake. The concept of the pulley–damper system is to amplify the wire movement stretched between the SCS and surrounding structure as well as the force of the viscous damper device connected to the wire. Three types of full-scale ceiling system specimens: conventional-SC, braced-SCS, and damped-SCS, were designed for the shaking table tests.
2. Pulley–Damper Ceiling System
2.1. Mechanism of the System
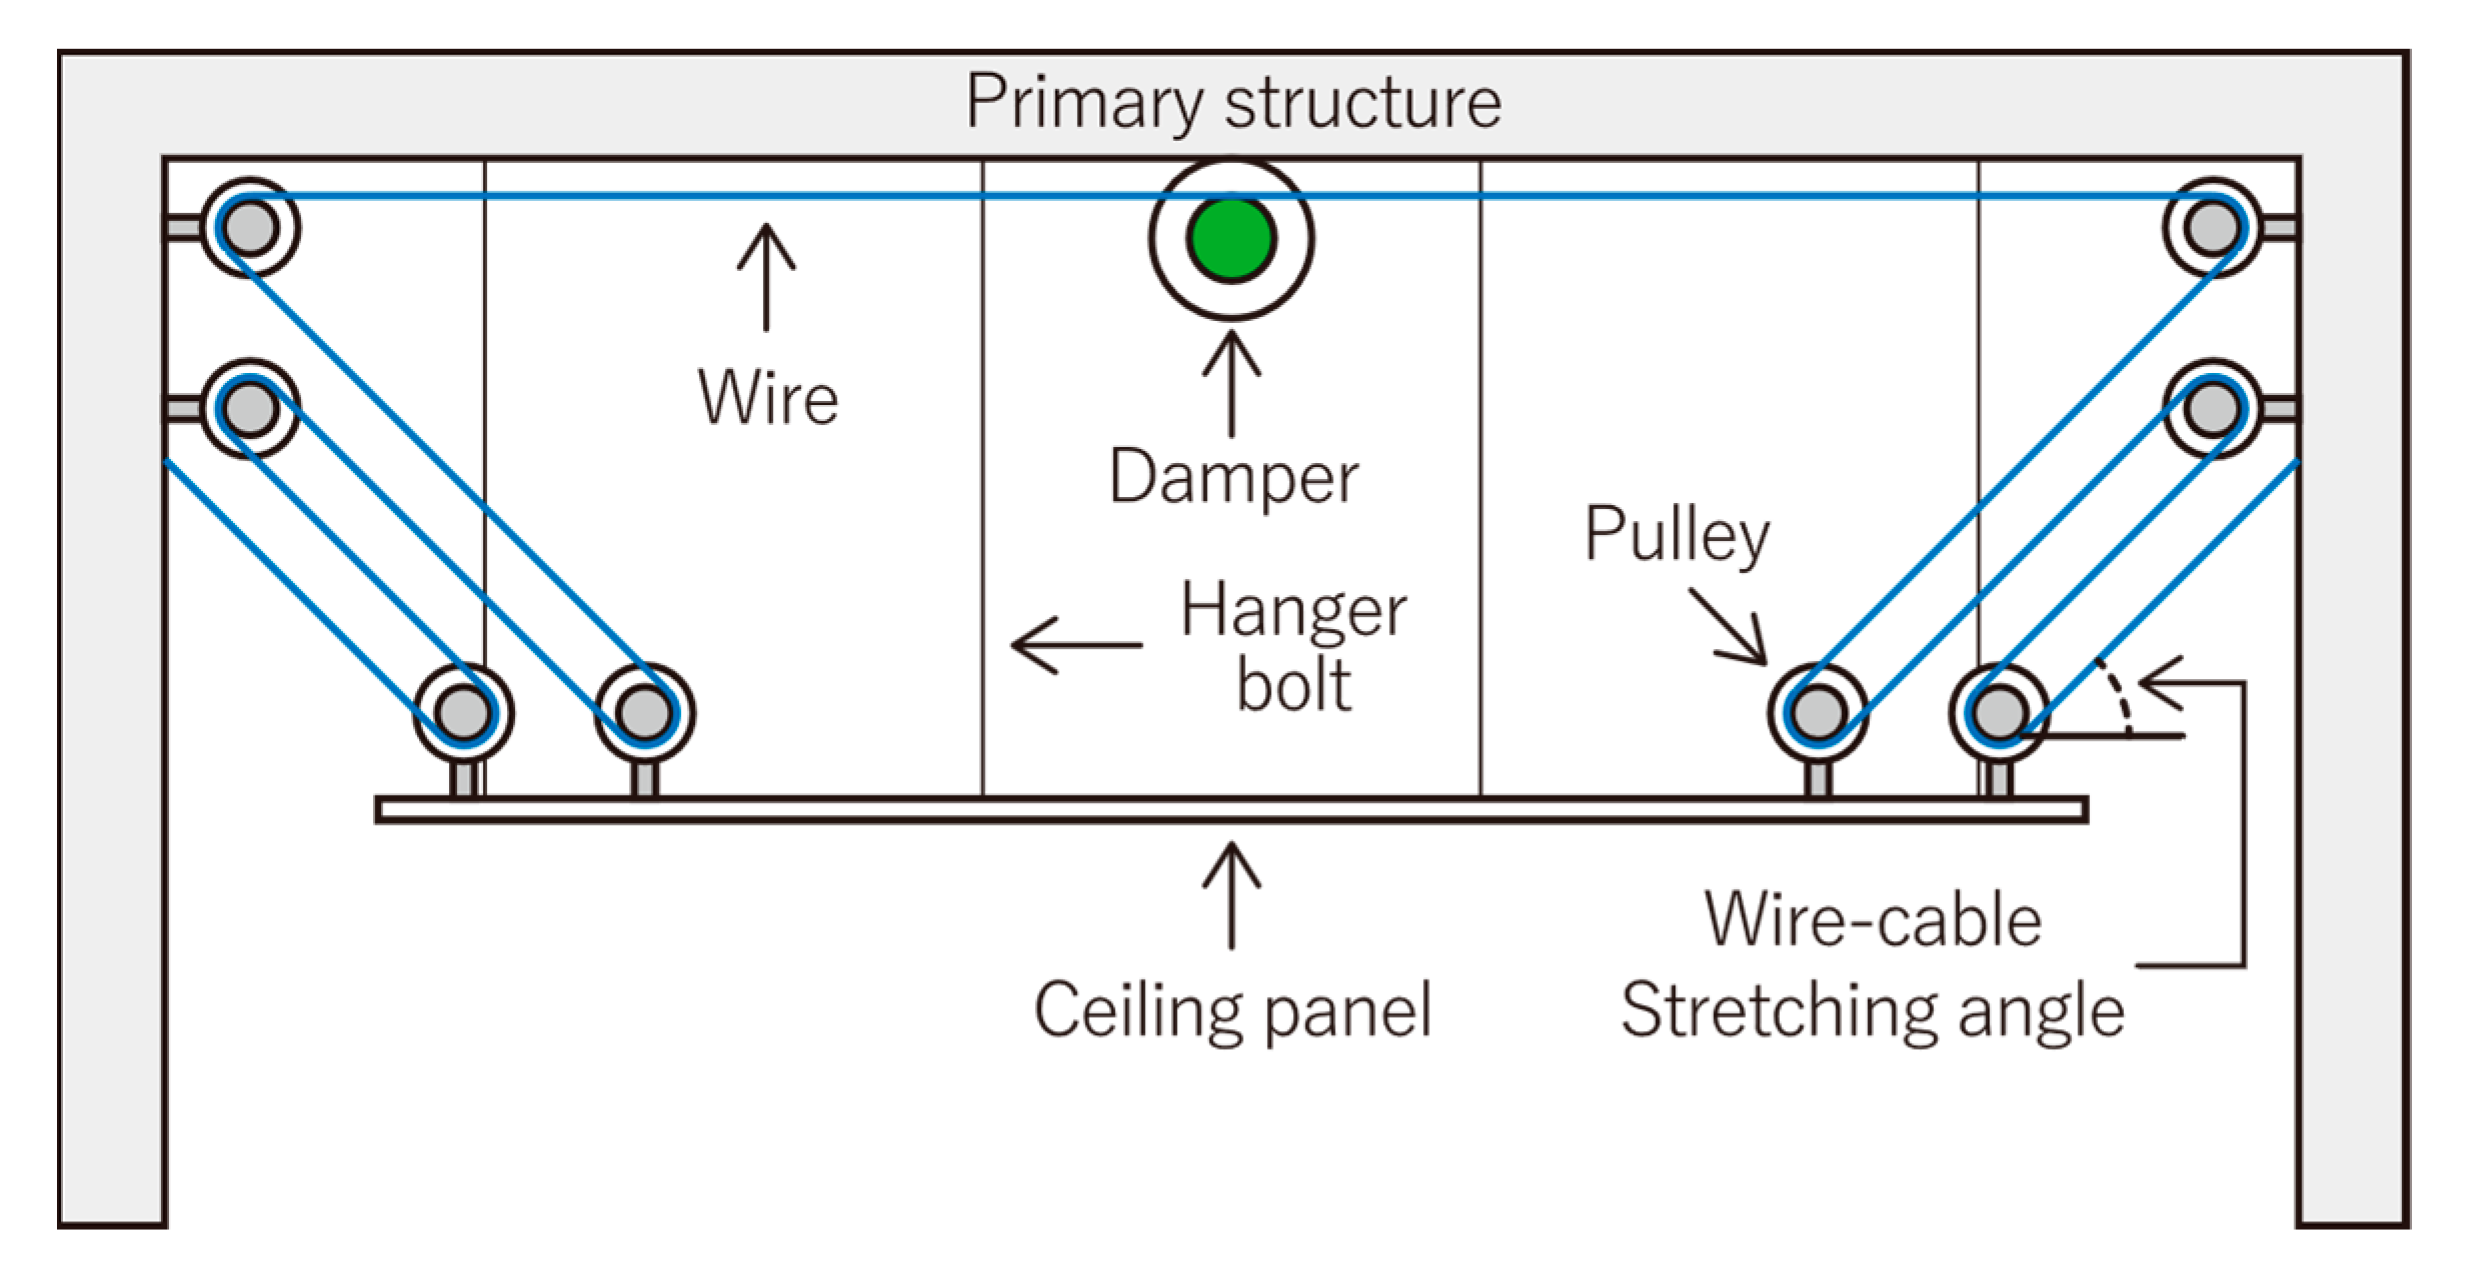
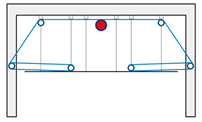
Figure 2 explains the fundamental concept of PDCS, which consists of pulley tackle mechanisms, one energy-dissipating device (damper), and the SCS. A wire is reciprocally stretched times with bilateral symmetry between Pulley (attached on the SCS) and Pulley (attached on the primary structure). Thus, according to the response displacement “” of the SCS, the amount of damper deformation should be enlarged to [31,32]. That is, the pulley tackle mechanism is employed in the proposed system to amplify the wire-cable movement and transmit it to significantly increase the energy absorption of the damper installed at the middle of the wire movement path.
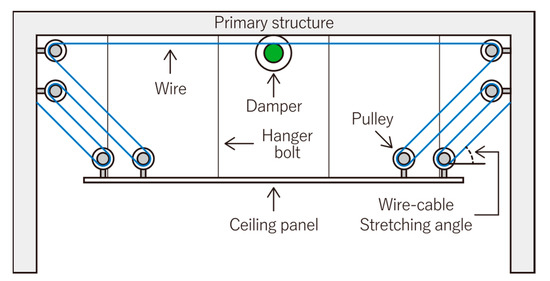
Figure 2.
Concept schematic for the proposed pulley–damper ceiling system (PDCS).
2.2. Derivation of the Constitutive Equation
Constitutive equations were established for the proposed pulley–damper system considering wire-cable deformation under the static condition. Hence, the friction force, thermal changes, and the wire mass are not included in the equation. Figure 3 illustrates a schematic diagram for the PDCS. A continuous wire-cable is reciprocated times between the movable pulley, , and the fixed pulley, , and similarly between the movable pulley, , and the fixed pulley, . When the SCS deformed displacement in the horizontal direction and force, and act on the wire-cable each side (use plus for tension); the force–deformation relationship of the wire-cable in the diagonal part and horizontal part can be expressed both in the left-hand side of Equation (1) and the right-hand side of Equation (2), as follows:
where and are the wire-cable length and deformation in the diagonal part, respectively; and are the wire-cable length and deformation in the horizontal part, respectively; is the Young’s module of wire-cable; is the cross-sectional area of wire-cable; is the axial stiffness of the wire-cable ().
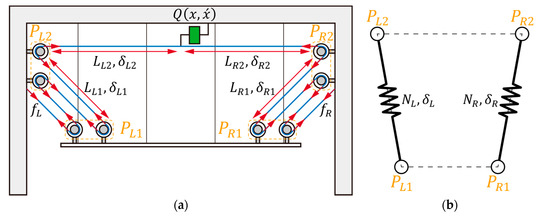
Figure 3.
(a) Configuration model; (b) equivalent truss model.
In this derivation, the wire-cable is modeled as equivalent truss-elements. Thus, the force–deformation relationship can be converted into the axial force, , and the deformation, , as follows for each side:
where
As the PDCS consists of one continuous wire, if one side gets shorter, the other side must grow longer. Thus, the following relation should hold:
In addition, the damper force can be obtained from the difference in the tensile force of both wire sides. Therefore, by substituting Equation (5) into Equation (6), the damper force and the displacement can be established as Equation (7):
Utilizing Equations (3a), (4a), and (7), the axial force of the truss elements can be finally written, as follows:
The deformation of the damper is given by:
Therefore, the simulation analysis can be implemented by the following procedures:
- Step 1: Calculate the damper displacement using truss force and displacement from Equation (9);
- Step 2: Determine the damper force ;
- Step 3: Update the truss axial forces using Equation (8).
3. Component Details of the Pulley–Damper System
3.1. Friction Test of the Pulley Sheaves
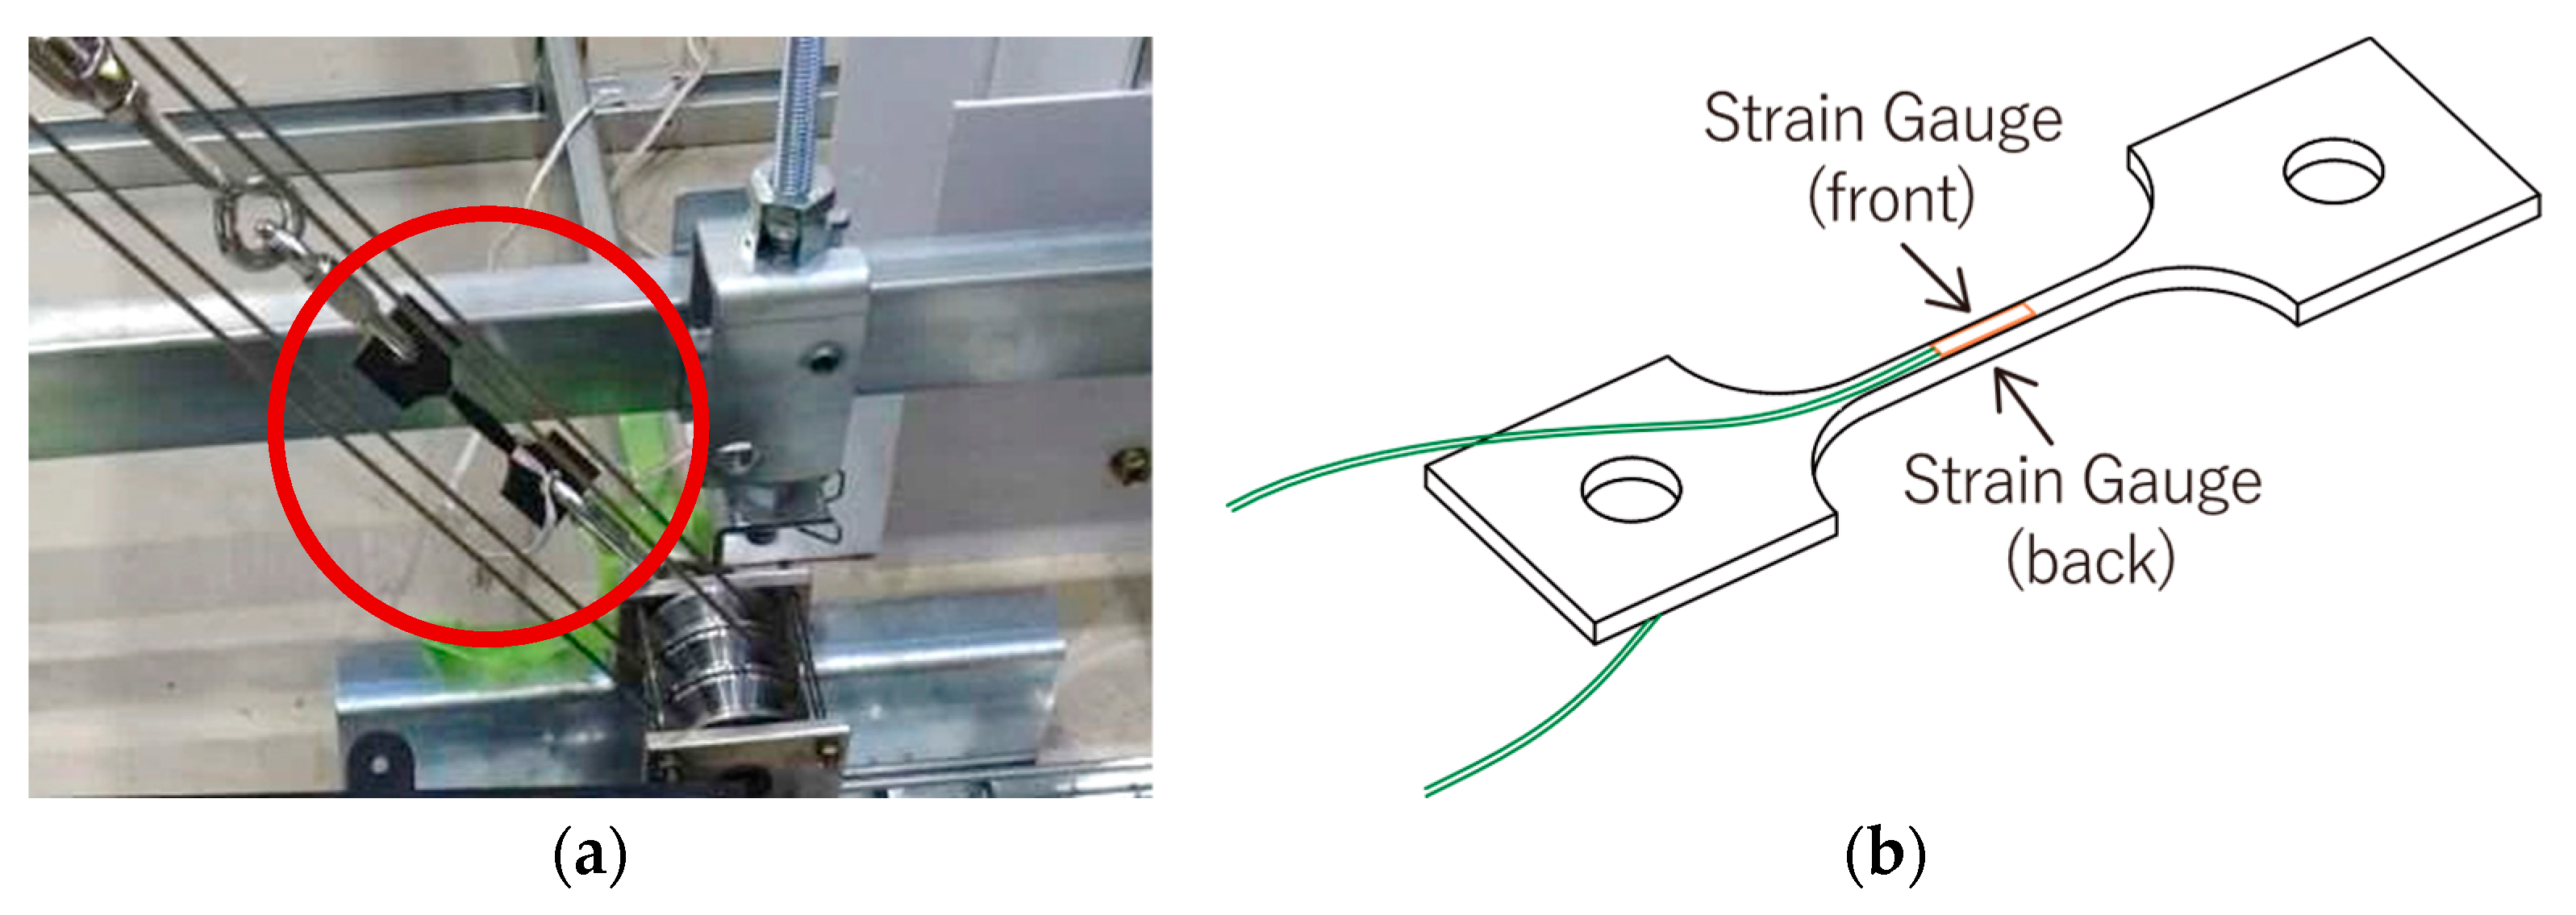
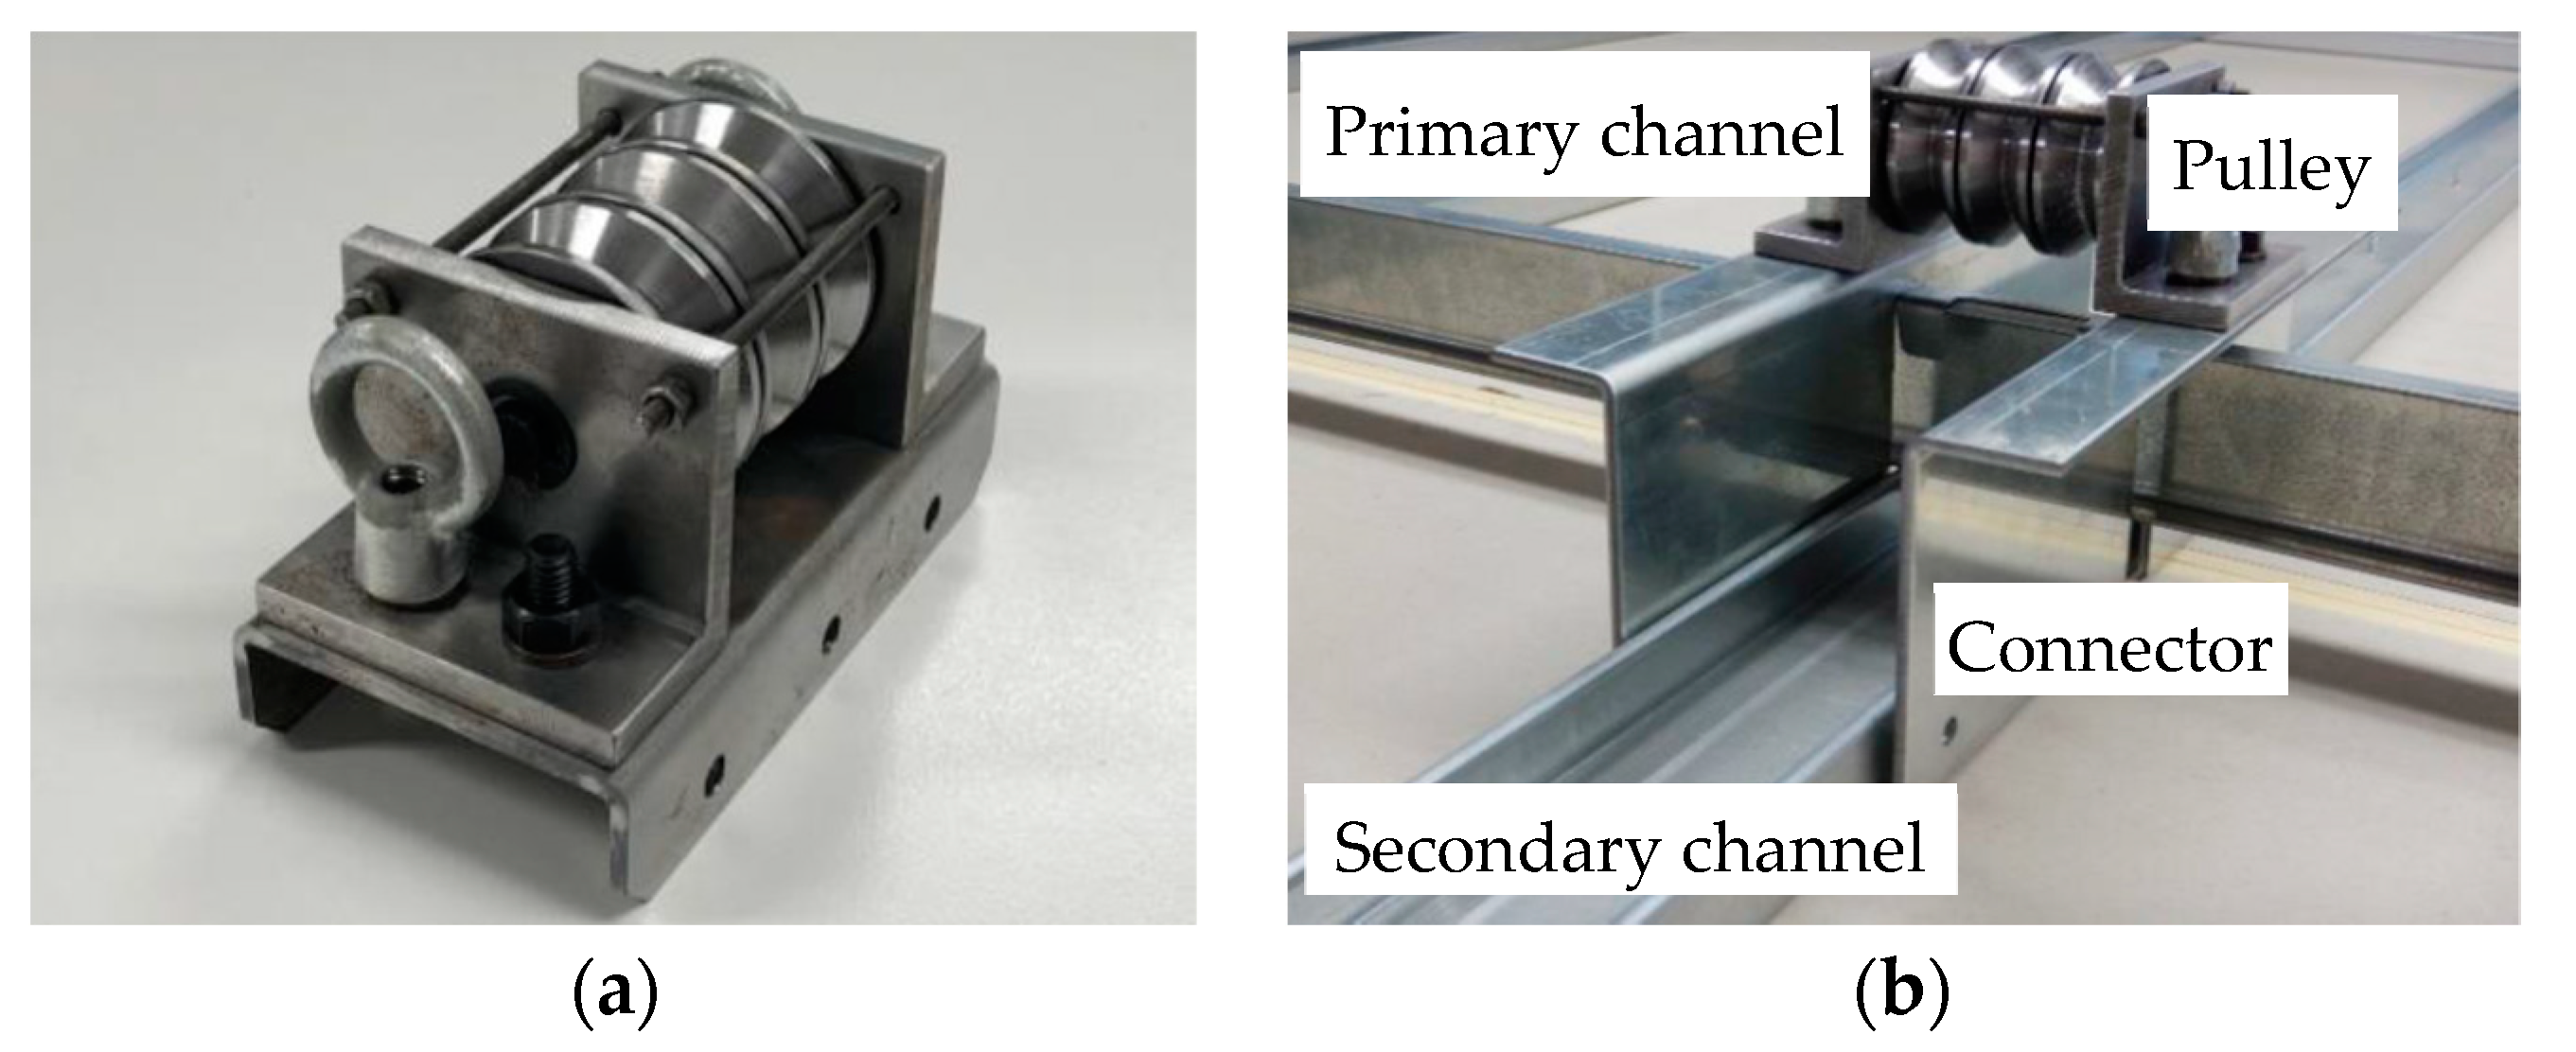
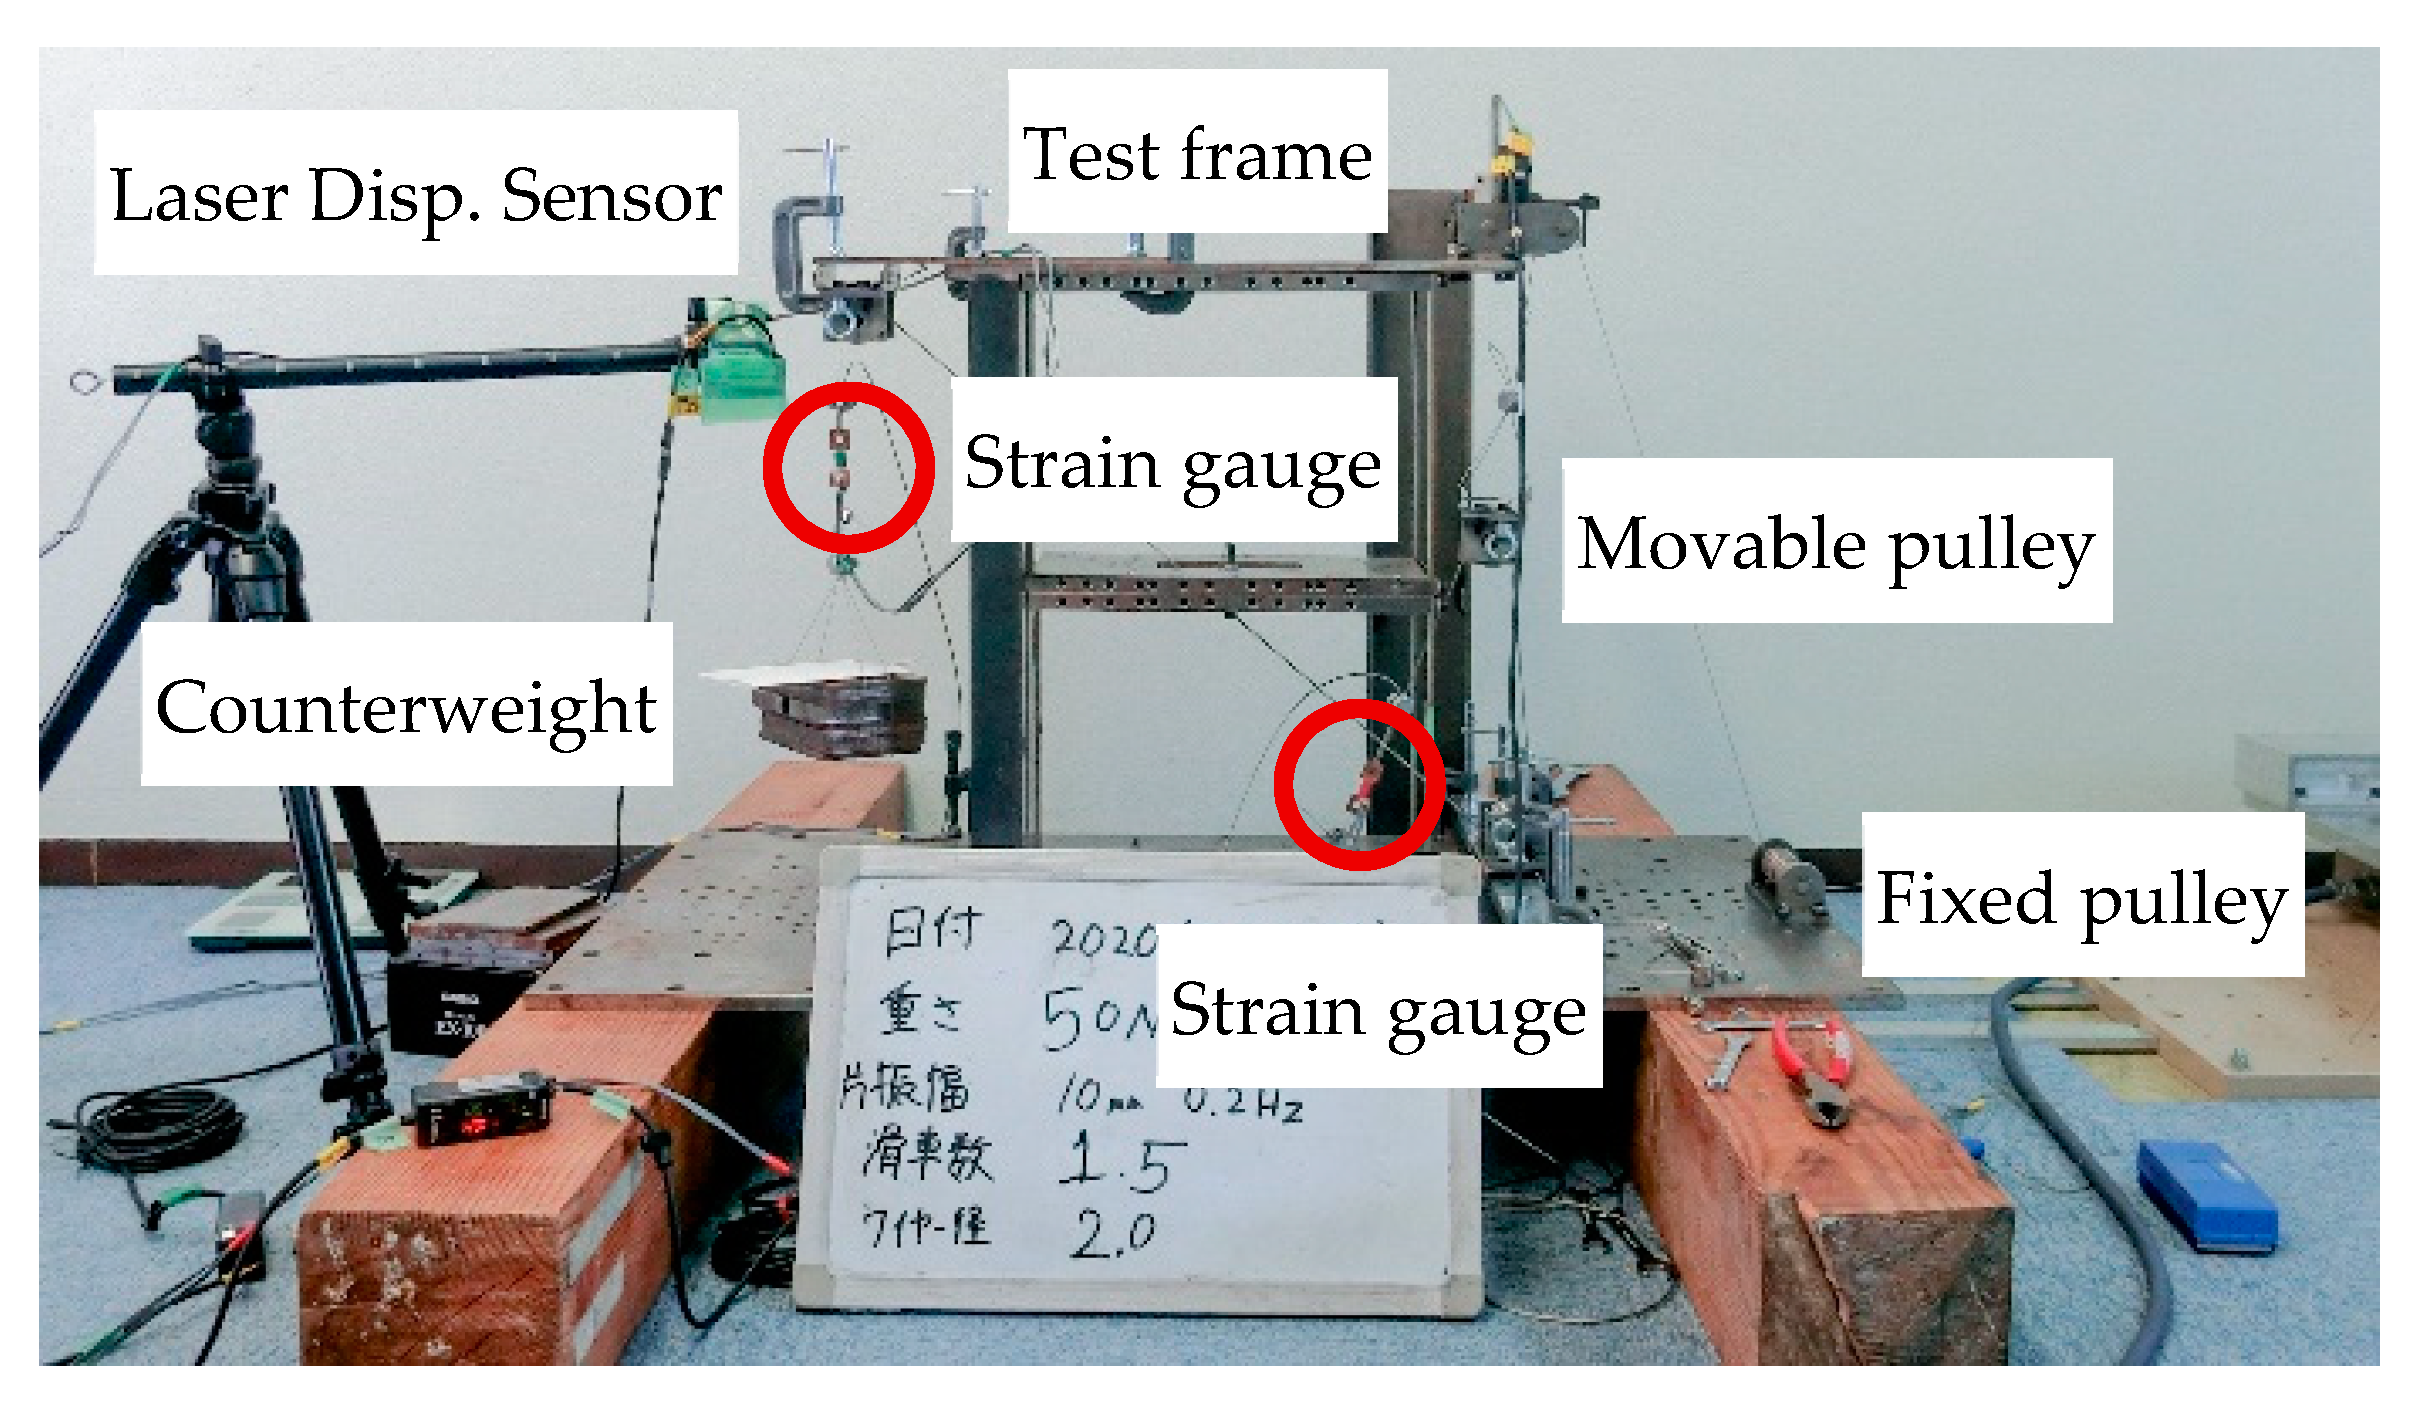
A friction test was conducted to evaluate the friction coefficient of pulley sheaves. A stainless wire-cable comprises 7 × 19 strands with 2.75 kN braking force, and 2.0 mm in nominal diameter was selected. The tensile force of the wire-cable during excitations was monitored through strain gauges placed on either side of a copper plate after the calibration in Figure 4. A triple pulley was used in this study as a deviator of wire-cable to smoothly transmit the ceiling displacement to the damper (Figure 5a). The pulley consists of three sets of a sheave of 30 mm in internal diameter, with a ball bearing inside.
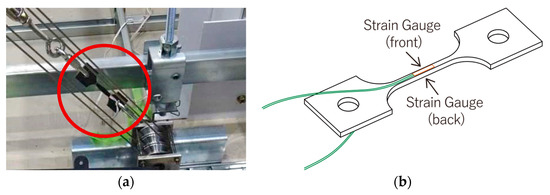
Figure 4.
(a) Installation of the tension measuring plate at the end of the wire in the specimen; (b) details of the tension measuring plate.

Figure 5.
(a) Overview of the pulley; (b) details of the fixture between pulley and ceiling runners.
The purpose of this test is to discover the friction coefficient per sheave to predict friction force in the following shake table test and simulate it in the following simulation analysis. In this study, the friction coefficient per sheave was estimated by dividing the mean friction force, , by the number of touched sheaves, and pre-tension force, , as follows:
Table 1 summarizes the three test cases for the friction test. The parameter in this friction test is the pre-tension force of the wire-cable and the number of wire-cable loops. Figure 6 shows the specimen view for the friction test. A steel test frame was prepared, and a movable pulley is hung from the top. The generated friction force when the movable pulley went up and down was calculated from the difference of the tensile force between the two strain gauges.

Table 1.
Information on the friction test.

Figure 6.
Test setup for characterizing friction behavior under sinusoidal wave excitation.
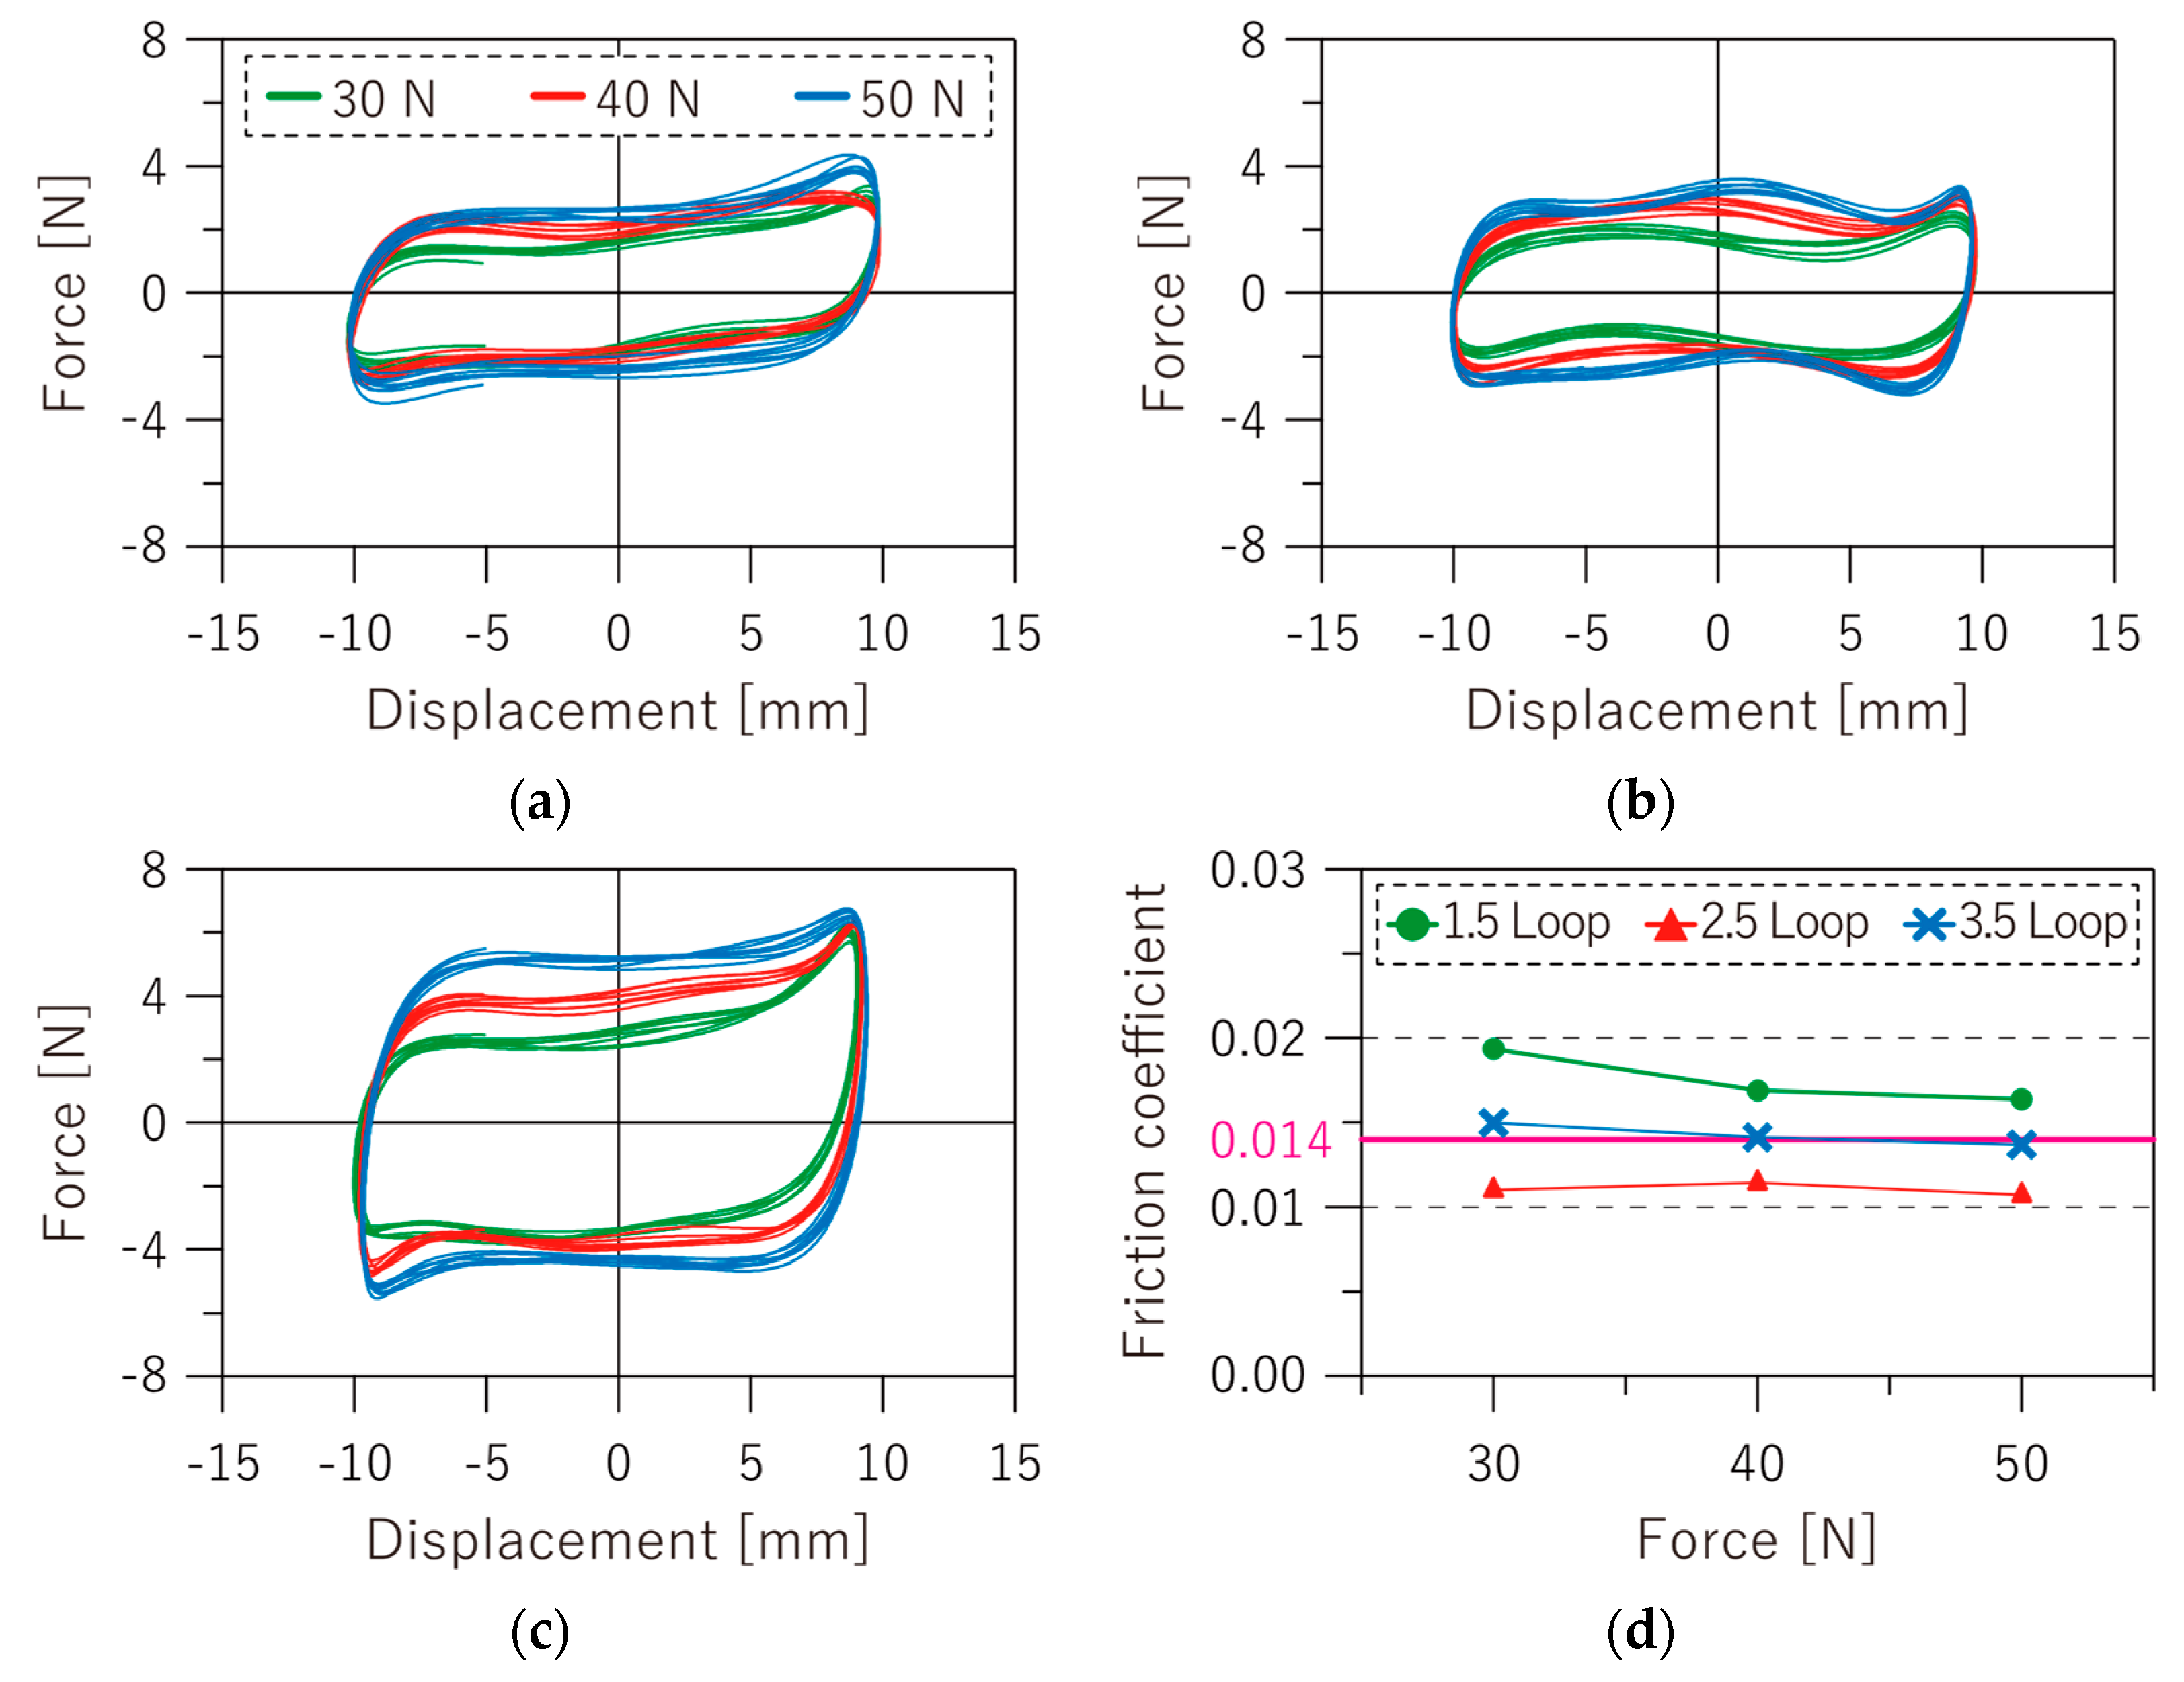
Figure 7a–c shows the force–displacement loop. The horizontal axis represents the movable pulley displacement, and the vertical axis represents the friction force, which comprises the overall activated sheaves. In all cases, if the number of loops stayed constant, the maximum friction force got larger as the initial tension increased. The friction coefficient was calculated from the displacement range as ±5 mm, using Equation (10). As Figure 7d shows the relation of the friction coefficient and the pre-tension force on the wire-cable, the coefficient stays constant and the results of the average friction coefficient in this test were 0.014.
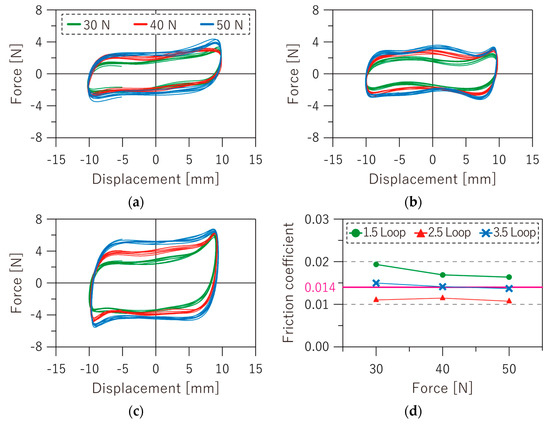
Figure 7.
Experimental results of the pulley-friction test: (a–c) Force–displacement relationship under different number of the wire-cable loop and (d) friction coefficient with the average value.
3.2. Dynamic Test of the Viscous Damper
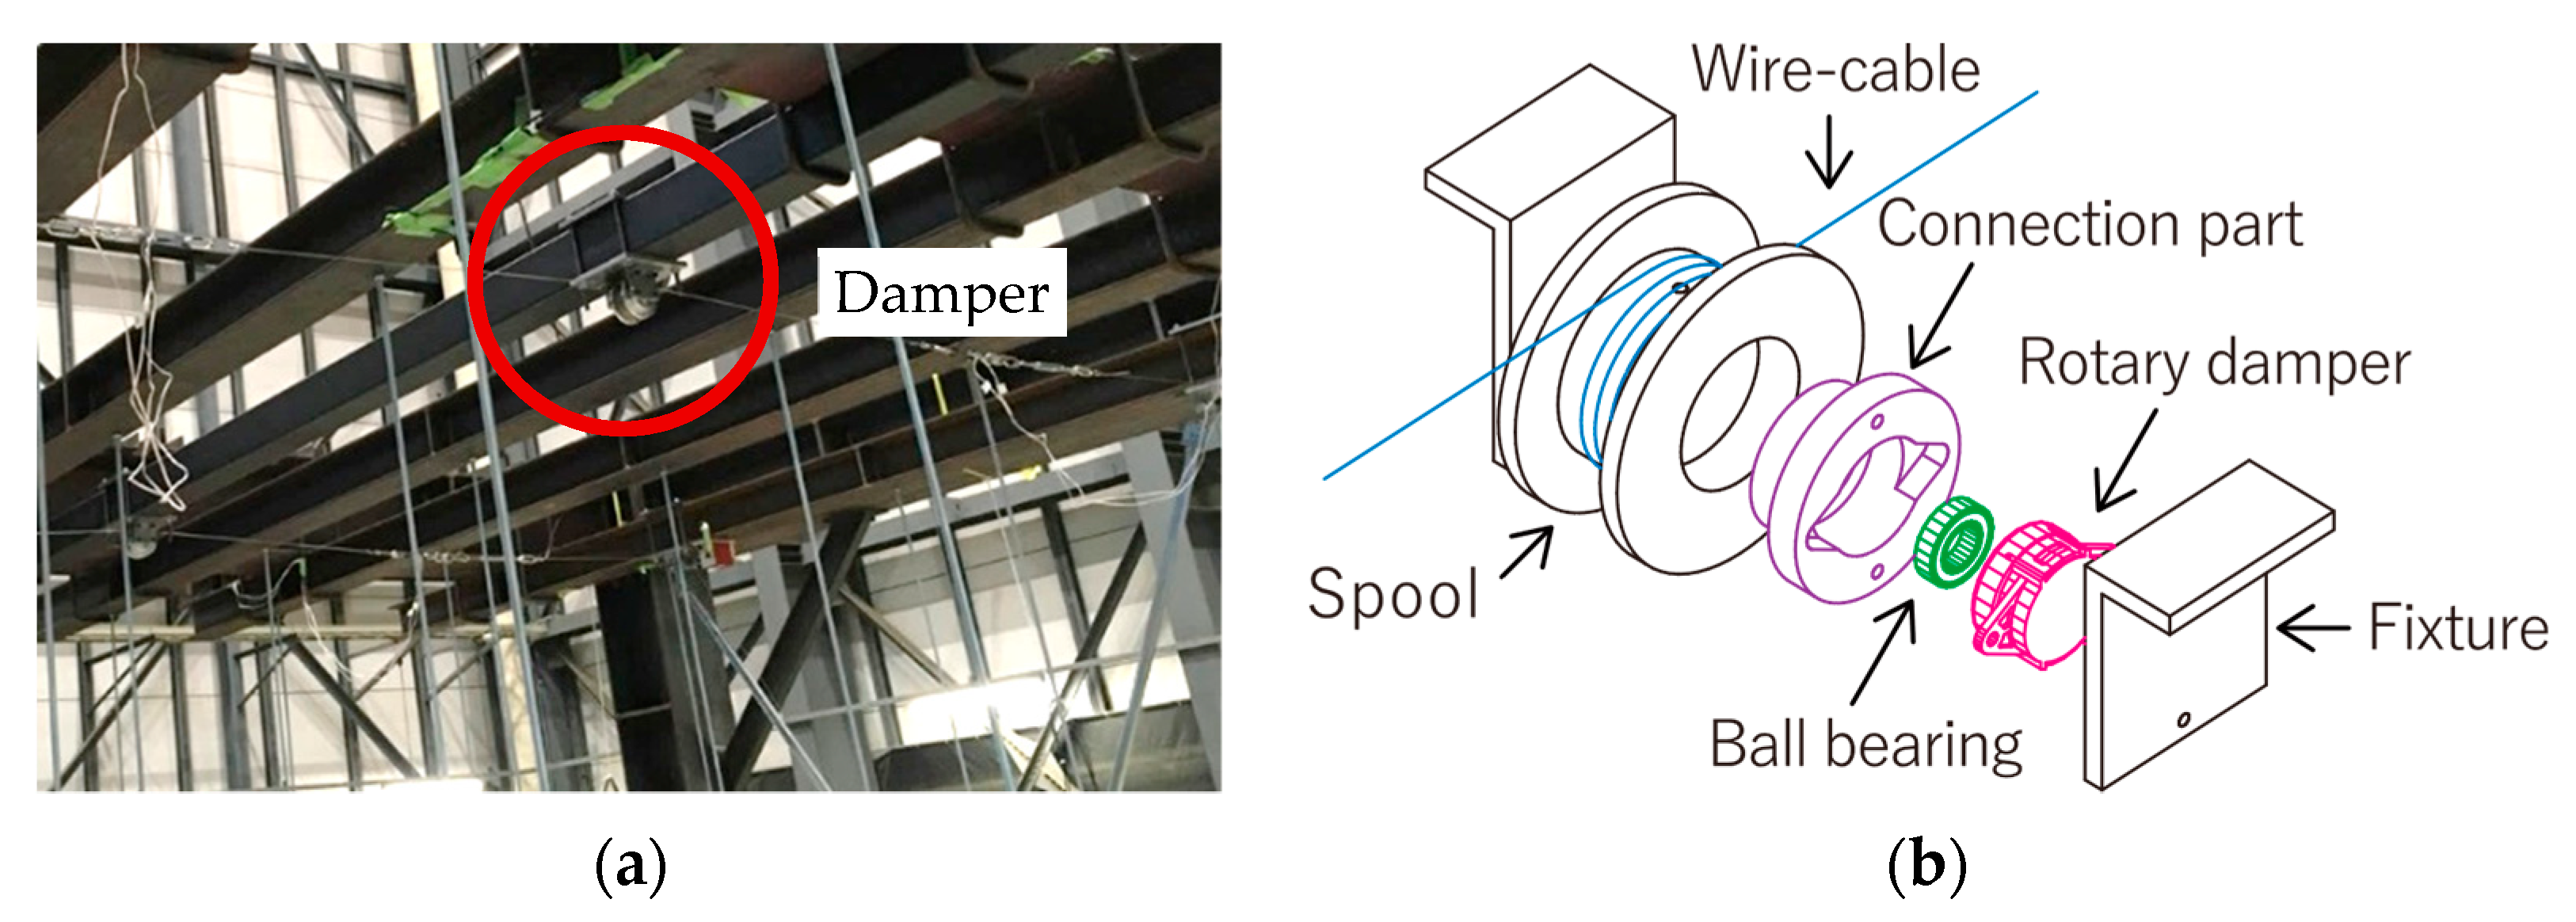
Figure 8 explains an assembly of the rotational non-linear viscous damper using silicon oil, which was specially developed to enhance the potential damping performance of the pulley–damper system. The component consists of two rotary dampers of 60 mNm-rated torque, two ball bearings, and other fixtures. Wire-cable should be wrapped around the spool several times to allow for a large stroke of the amplified wire-cable movement. As the velocity-force relationship can be expressed by Equation (11), and to quantify the velocity dependence, the sinusoidal excitation test and the frequency range between 0.1 Hz and 1.0 Hz were conducted to understand the variable of the equation:
where is the damping force, is the coefficient of the fluid inside the damper, is the velocity of the damper, and is the exponent ().

Figure 8.
(a) Overview of the damper attached to the supporting beam in the specimen; (b) details of the damper components.
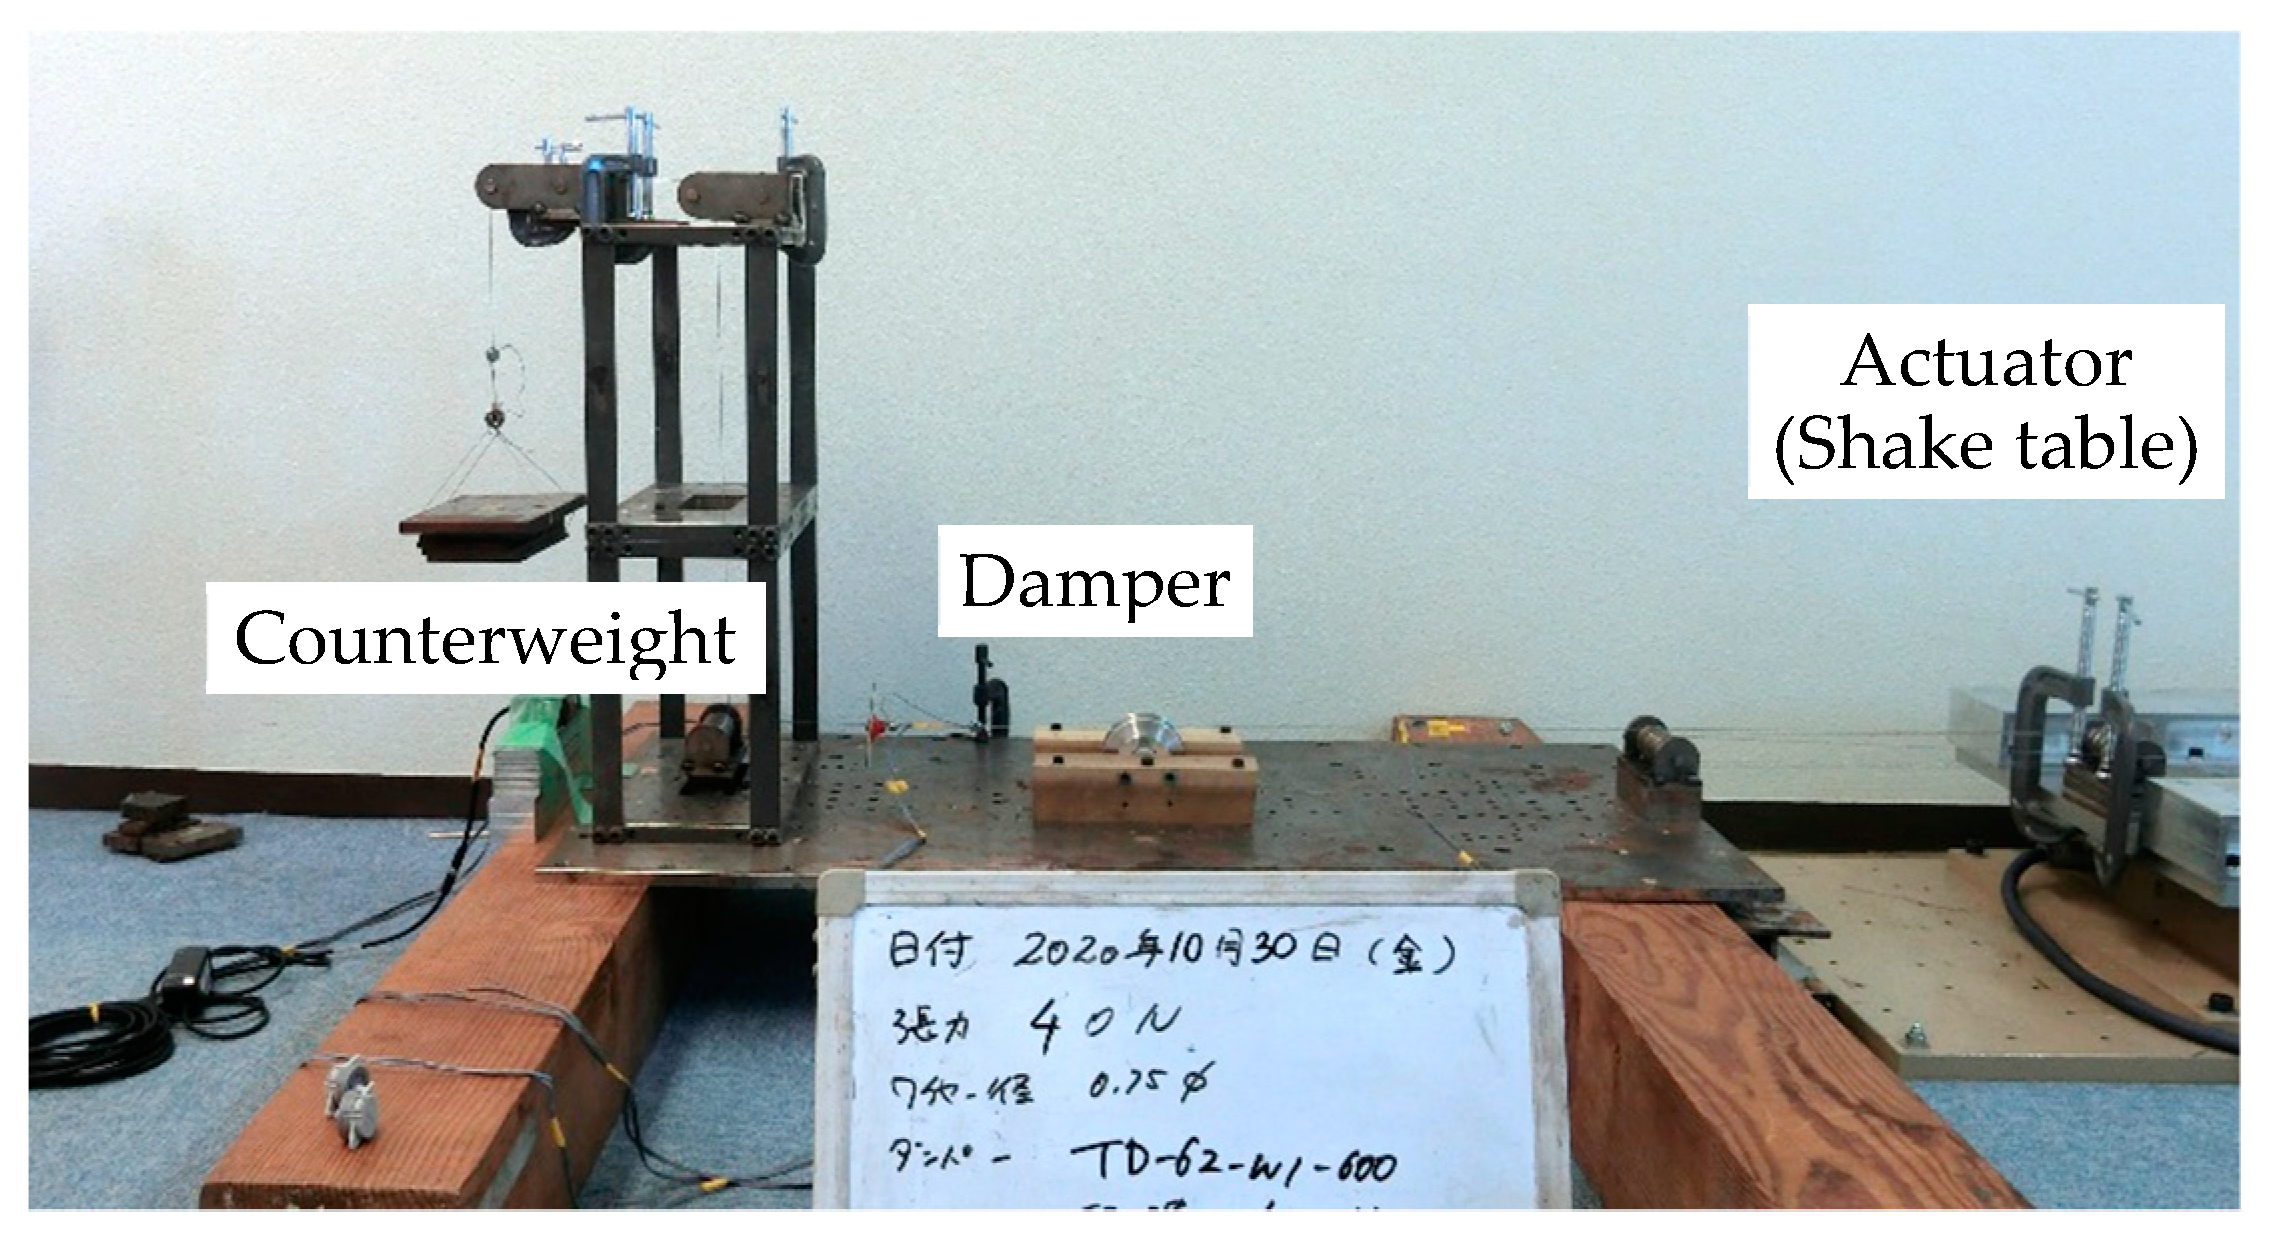
Figure 9 presents the test specimen for the sinusoidal wave excitation of the proposed rotational viscous damper. The damper is connected to actuator by the wire-cable to convert the horizontal movement of actuator to the rational motion in damper. Besides, the counterweight was set at the other side of wire end to provide initial wire tension to avoid the cable being slack during the excitations.
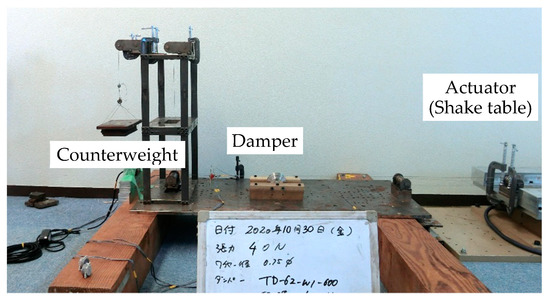
Figure 9.
Test setup for characterizing the dynamic behavior of viscous damper under sinusoidal wave excitation.
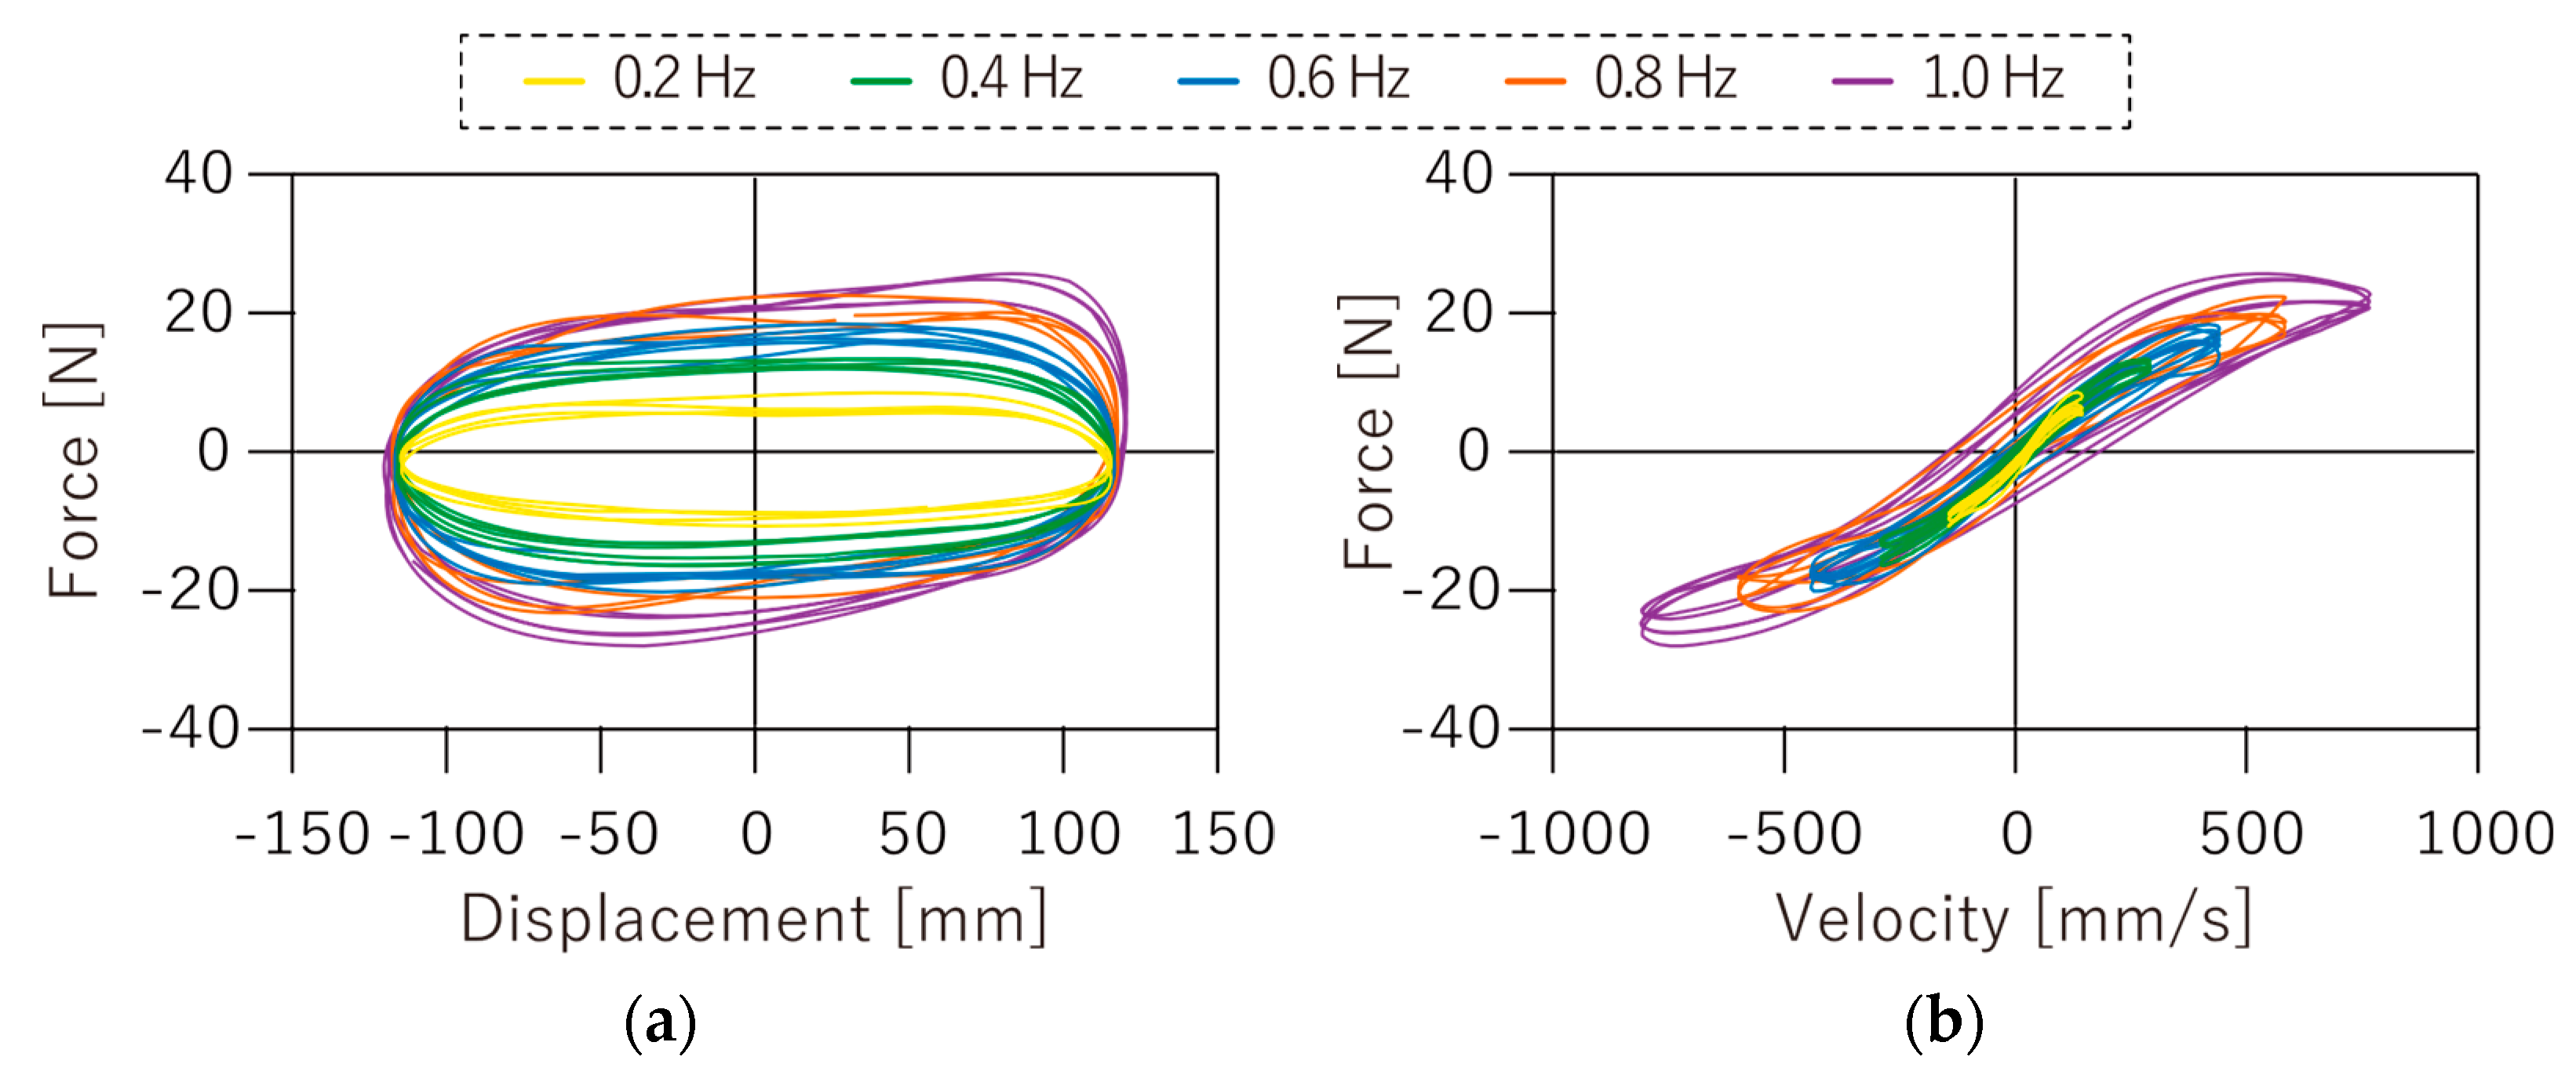
The hysteresis loop of the force–displacement relationship and force–velocity relationship under the sinusoidal frequency test of the non-linear viscous damper is presented in Figure 10. The damping force gradually grows up as the input frequency increased. While the energy absorption of the viscous damper is relatively limited at approximately 25 N, the velocity power coefficient of = 0.9 and the damping coefficient = 0.06 N∙(s/mm)α was decided based on the SRSS (square root of the sum of squares) of all the test results and modeled in the following simulation analysis.
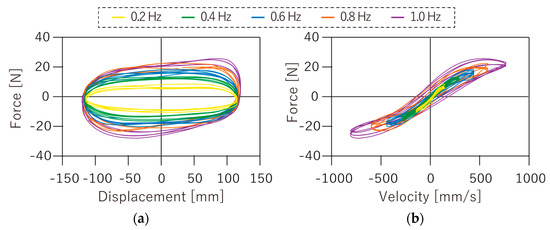
Figure 10.
Hysteresis loop of viscous damper measured under sin wave excitation test at different frequencies: (a) Force–displacement loops; (b) force–velocity loops.
4. Full-Scale Shake Table Test
4.1. Shake Table and Test Specimens
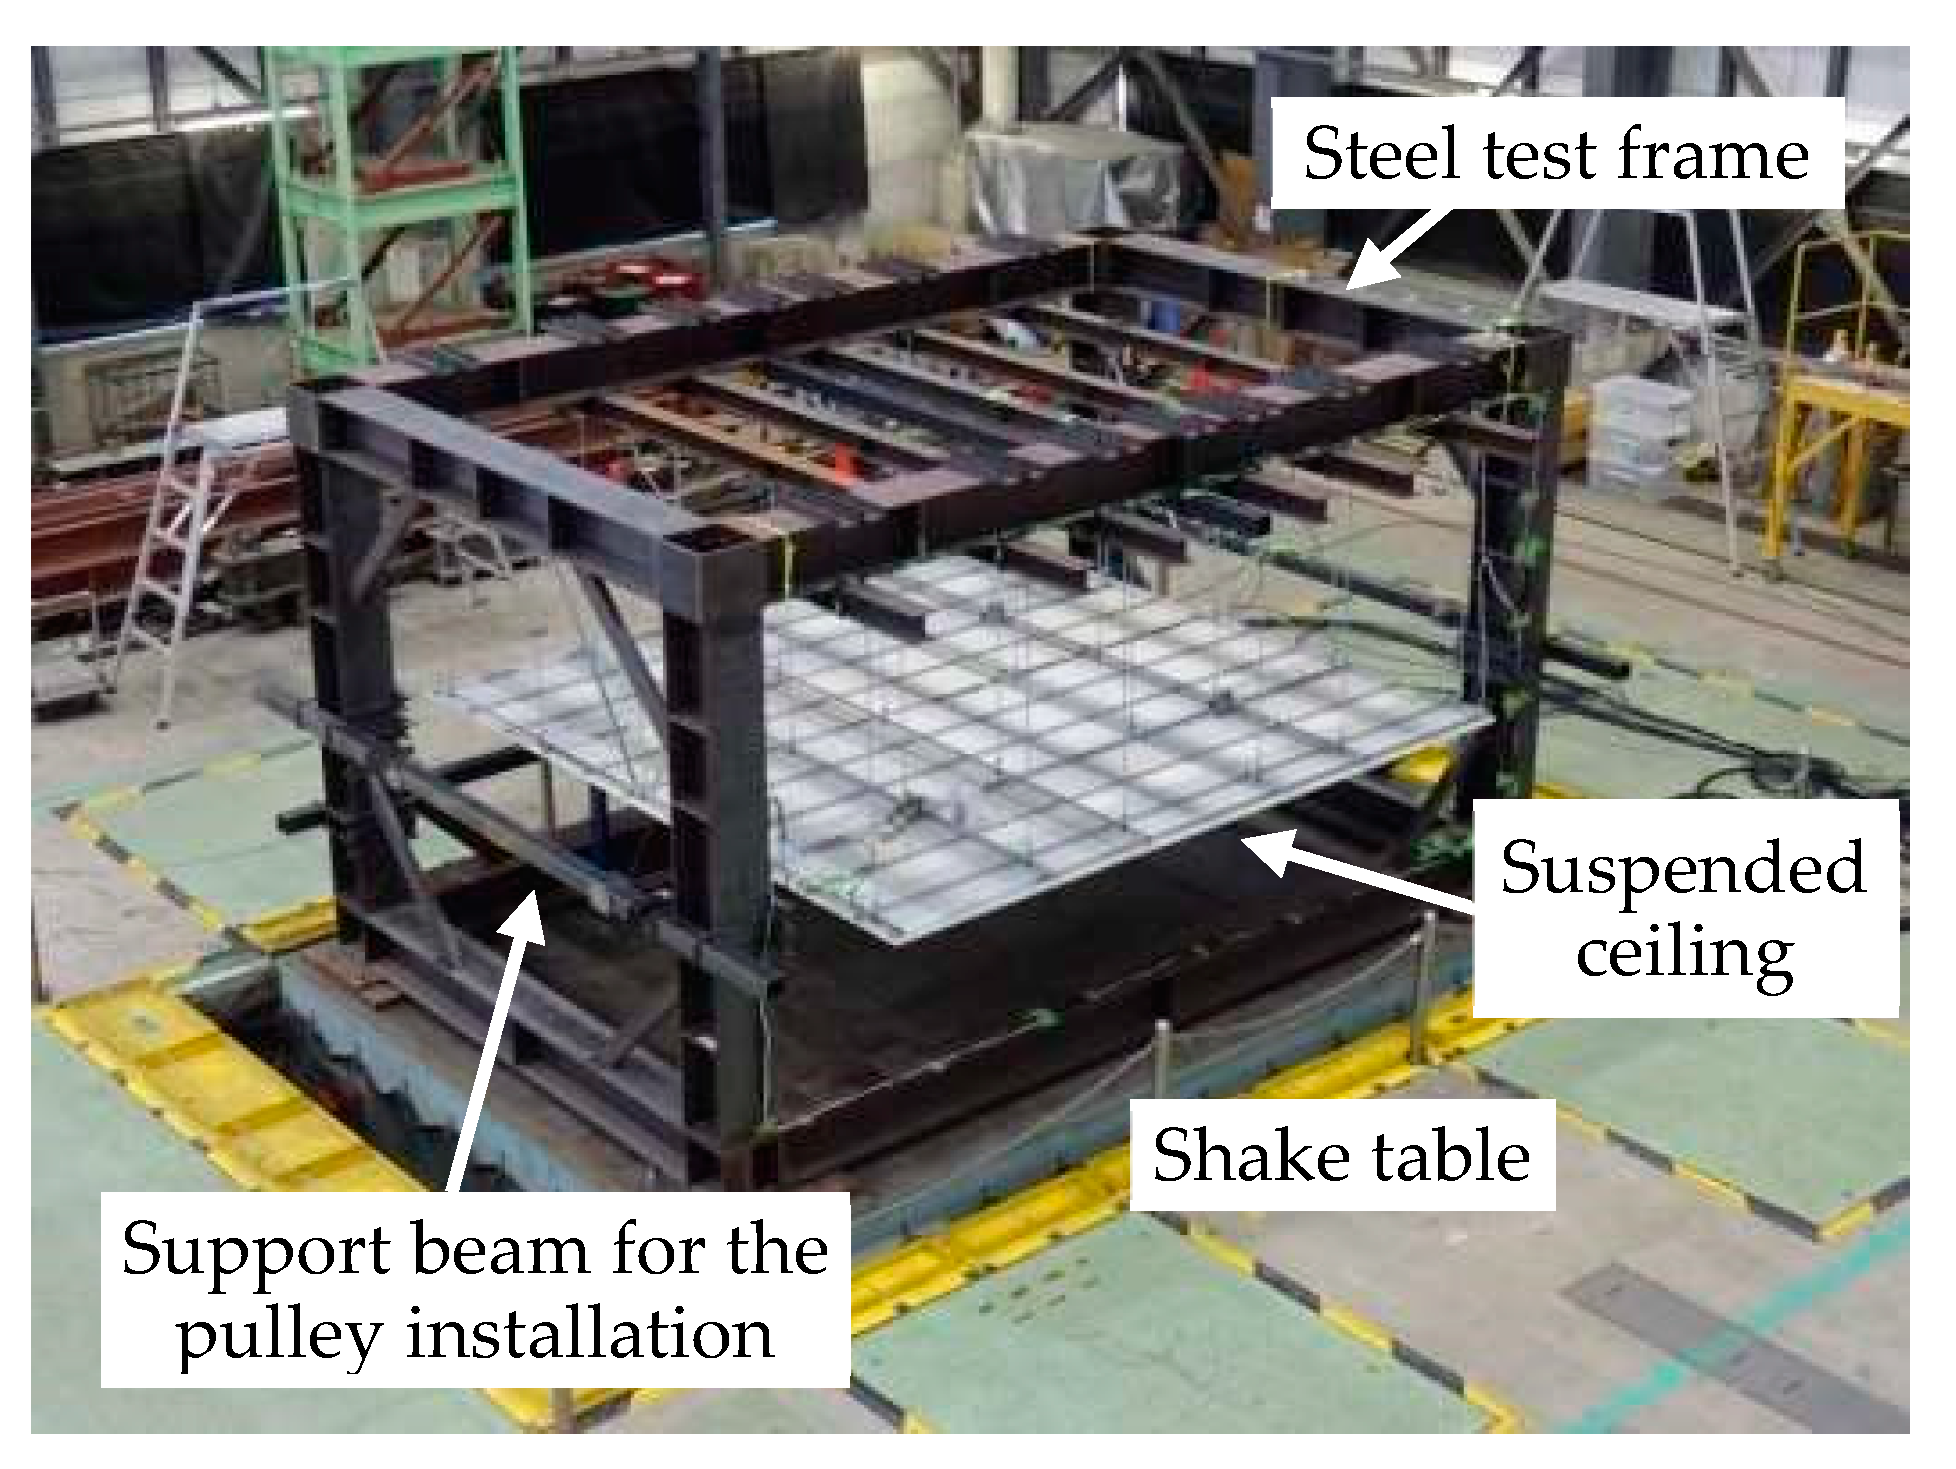
The unidirectional dynamic tests were performed using the earthquake simulator at the structural engineering laboratory of the Hazama Ando Technical Research Institute to evaluate and qualify the ceiling vibration control system in January 2020 and 2021. The performance envelops of the simulator are a ±300 mm displacement and 3.0 g acceleration at a payload of 35 tf in the horizontal direction.
An overall 5800 mm (length) × 3500 mm (width) × 3200 mm (height) rigid steel test frame was properly designed and built to hang the SCS specimens test (Figure 11) At the ceiling level, 1500 mm from the top, steel beams were fixed to the columns on two sides in a Y-direction to provide support for the pulley installation.

Figure 11.
Overall view of the SCS specimen on the shake table.
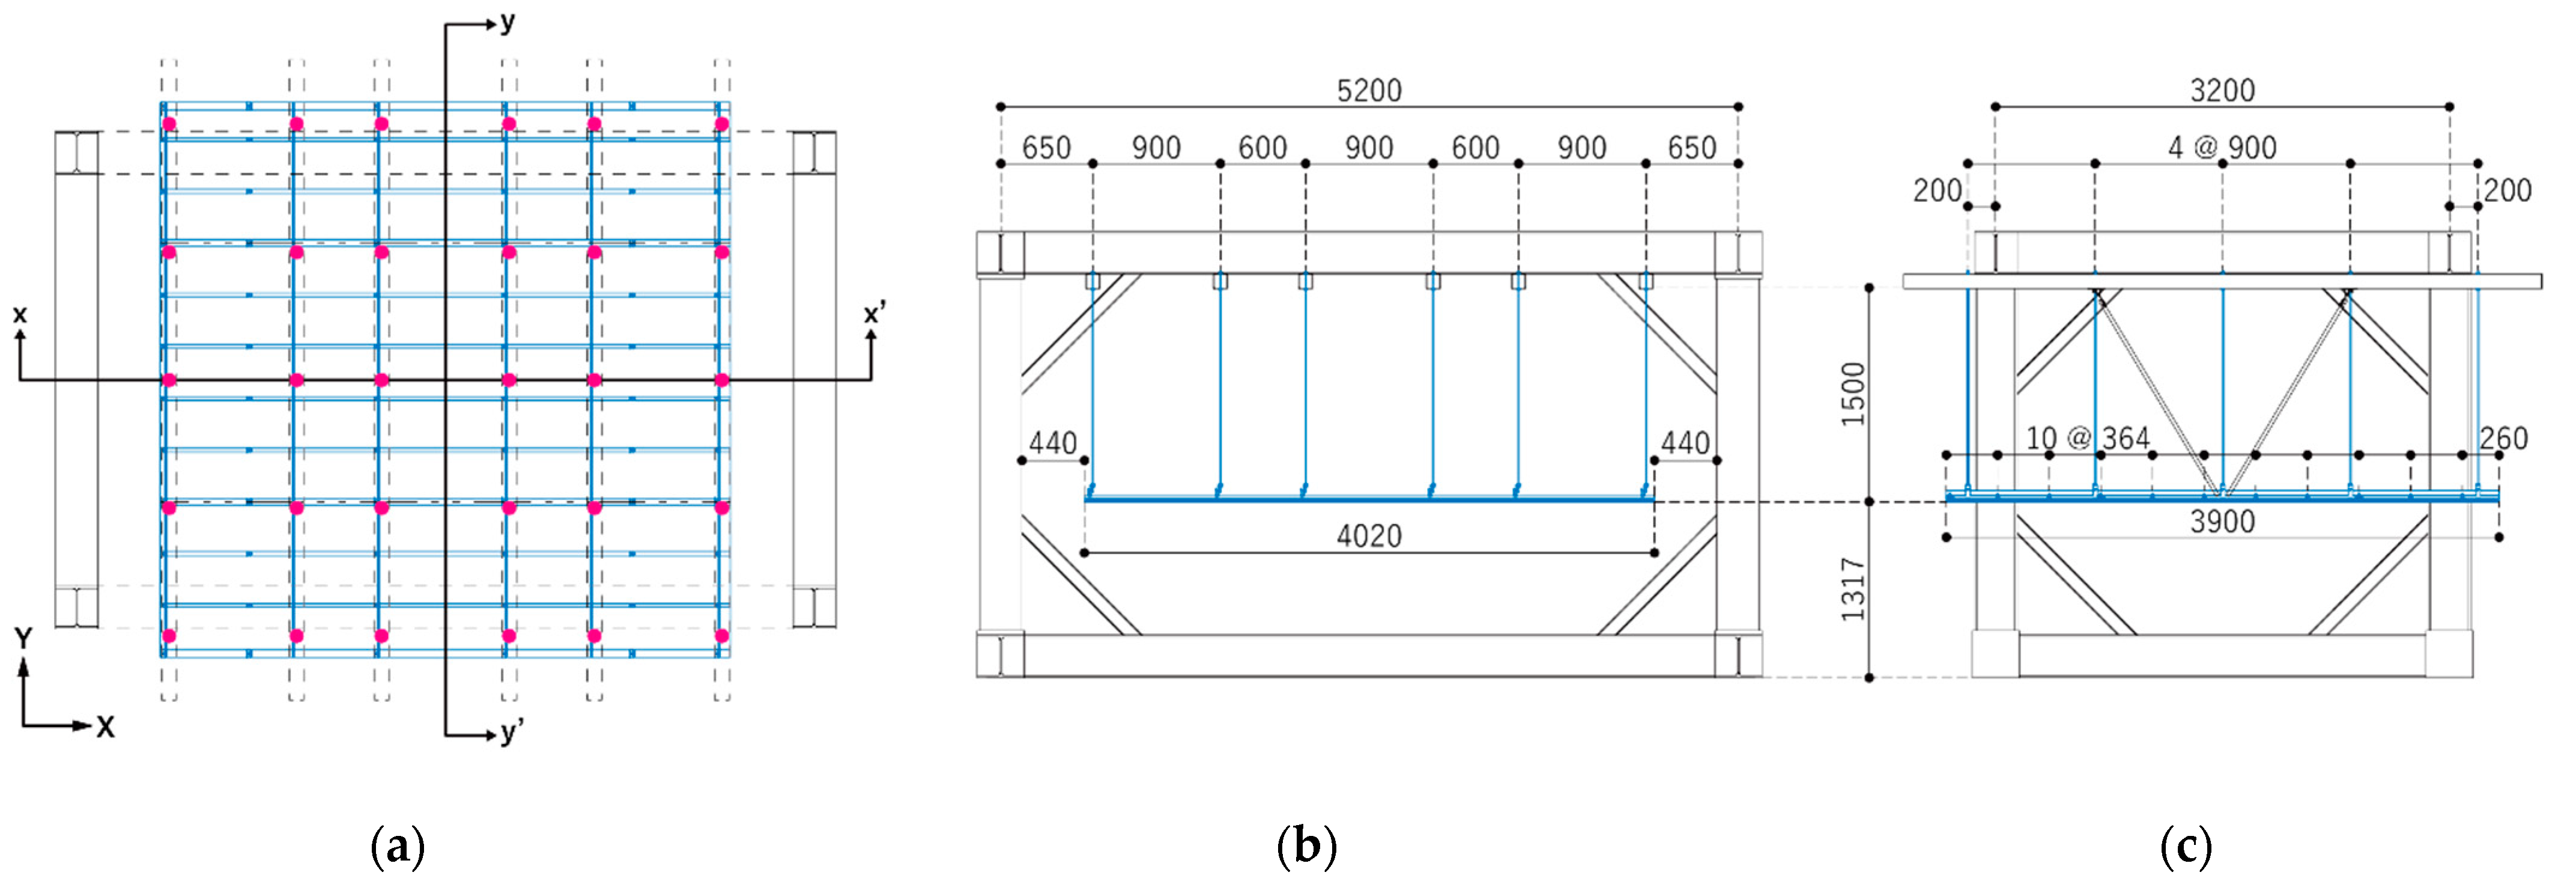
The ceiling specimen assemblies consisted of ceiling panels, hanger bolts, carrying channels, and seismic clips. The ceiling system, 4020 mm × 3200 mm in size, was suspended 1500 mm by the hanger bolt (9 mm diameter) under the beams attached to the structural frame (Figure 12). In the specimens, the primary runners were arranged along the Y-direction with a spacing of 900 or 600 mm. The secondary runners were placed under primary runners along the X-direction with a spacing of 364 mm. The interaction points of the ceiling runner were tightly connected by seismic clips. Then, plasterboard (1820 mm × 910 mm) was fixed on the bottom surface of secondary runners. Here, in order to avoid the torsion of the entire system, V-braces were placed in the Y-direction for all the test cases.
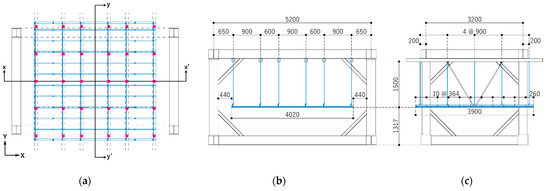
Figure 12.
Schematic view of overall specimen: (a) Plan view; (b) cross-section view in X-direction; (c) cross-section view in Y-direction.
4.2. Test Cases for the Shaking Table Tests
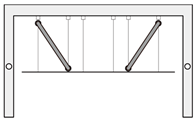
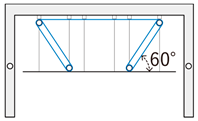
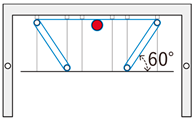
In this study, four types of indirect-SCSs with continuous panels were designed to understand the dynamic behavior of the proposed system: conventional SCS (Case C), braced SCS (Case CB), wired SCS (Case CW), and damped SCS (Case CWD), which places the proposed damper in Section 3.1. Moreover, to investigate the influence of the wire stretching angle on seismic performance, two types of system arrangement, the horizontally stretched case (0-degree angle) and diagonally stretched case (60-degree angle), were prepared. The list of specimens is summarized in Table 2. The wire was symmetrically reciprocated 2.5 times between pulleys on the left and right sides, with 50 N of initial tensile force.
Table 2.
Information on the SCS specimen.
4.3. Measurement Plan and Input Excitations
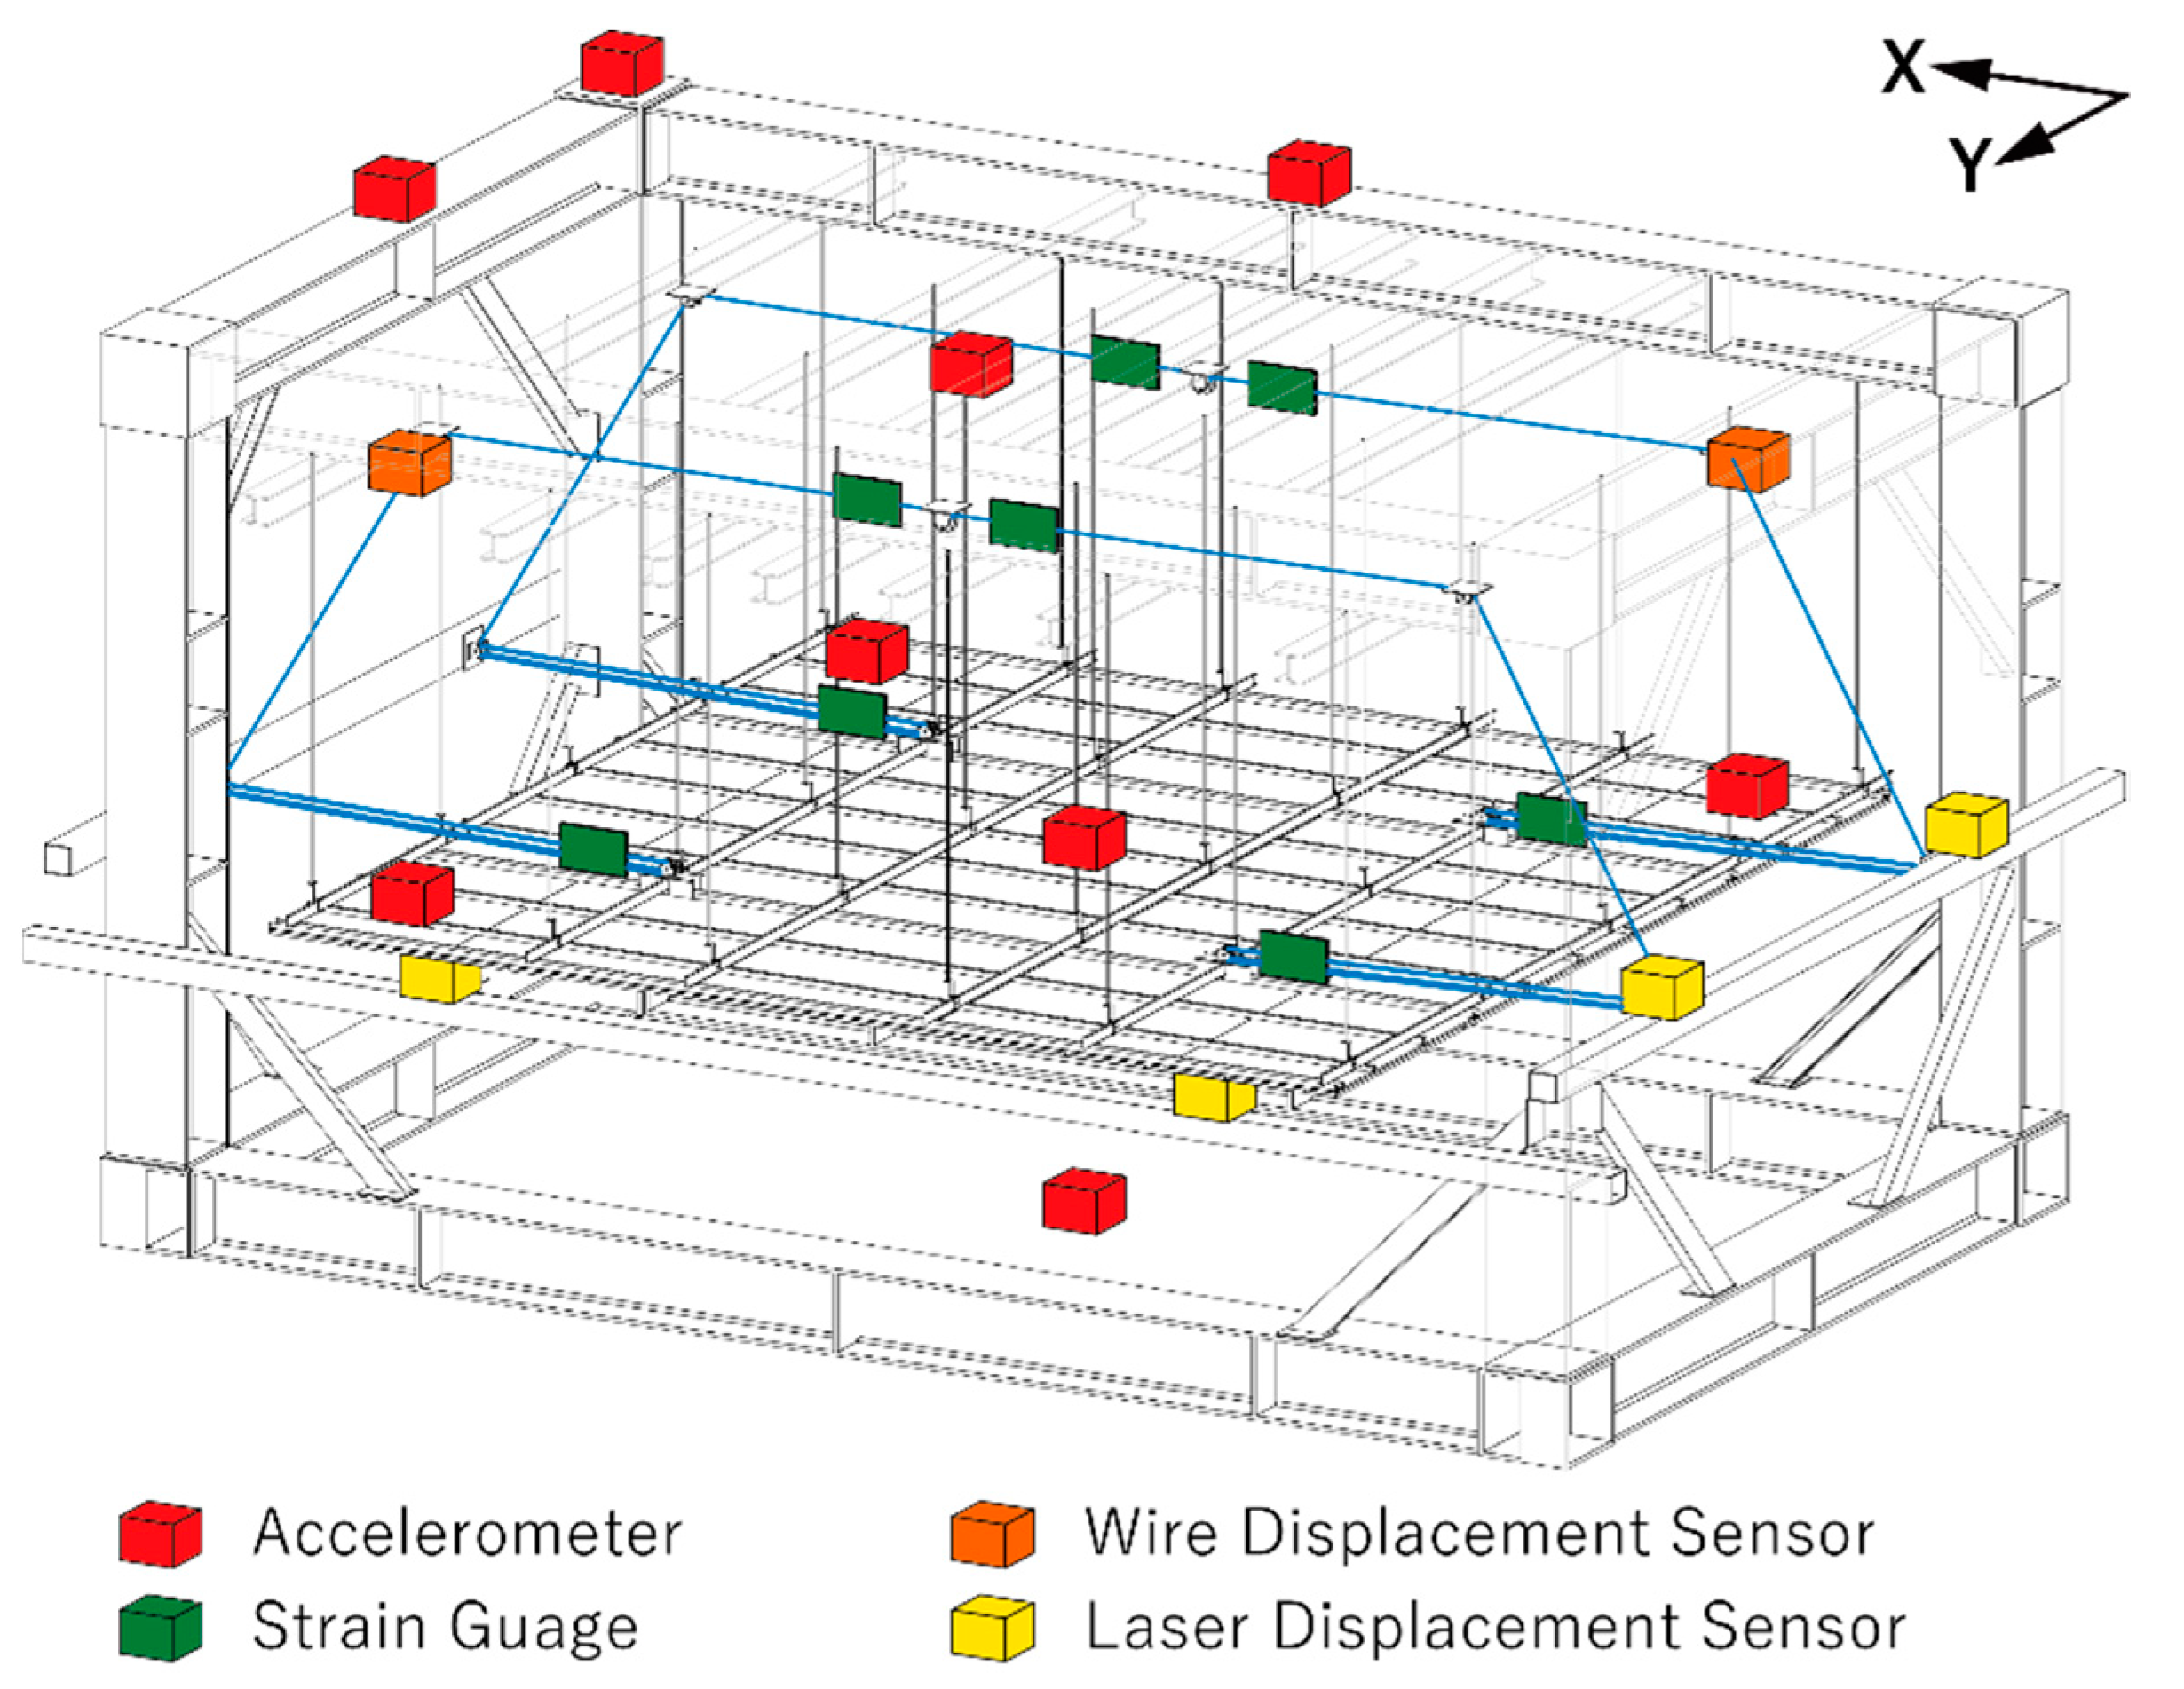
A total of 27 accelerometers, in a triaxial direction and with 9 locations (four of each on the specimen top and ceiling panel, and the shake table surface), and 4 laser displacement sensors (two of each in the X-direction and Y-direction) were used for monitoring the outputs in the tests with 500 Hz sampling frequency. During the excitation with the damper system, one draw-wire displacement sensor, and four tension measuring plates with strain gauges were installed for each pulley–damper system. The location and details of these instruments are shown in Figure 13.
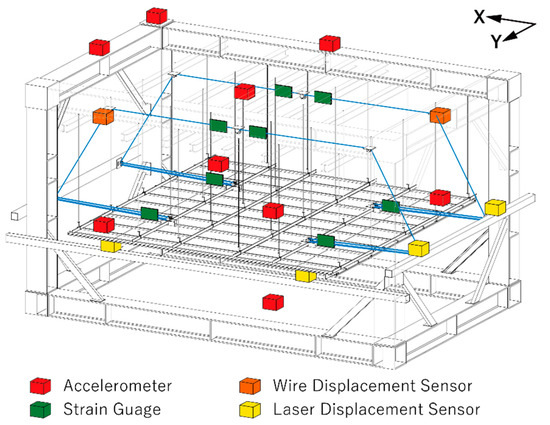
Figure 13.
Measurement instrument location for the full-scale suspended ceiling system.
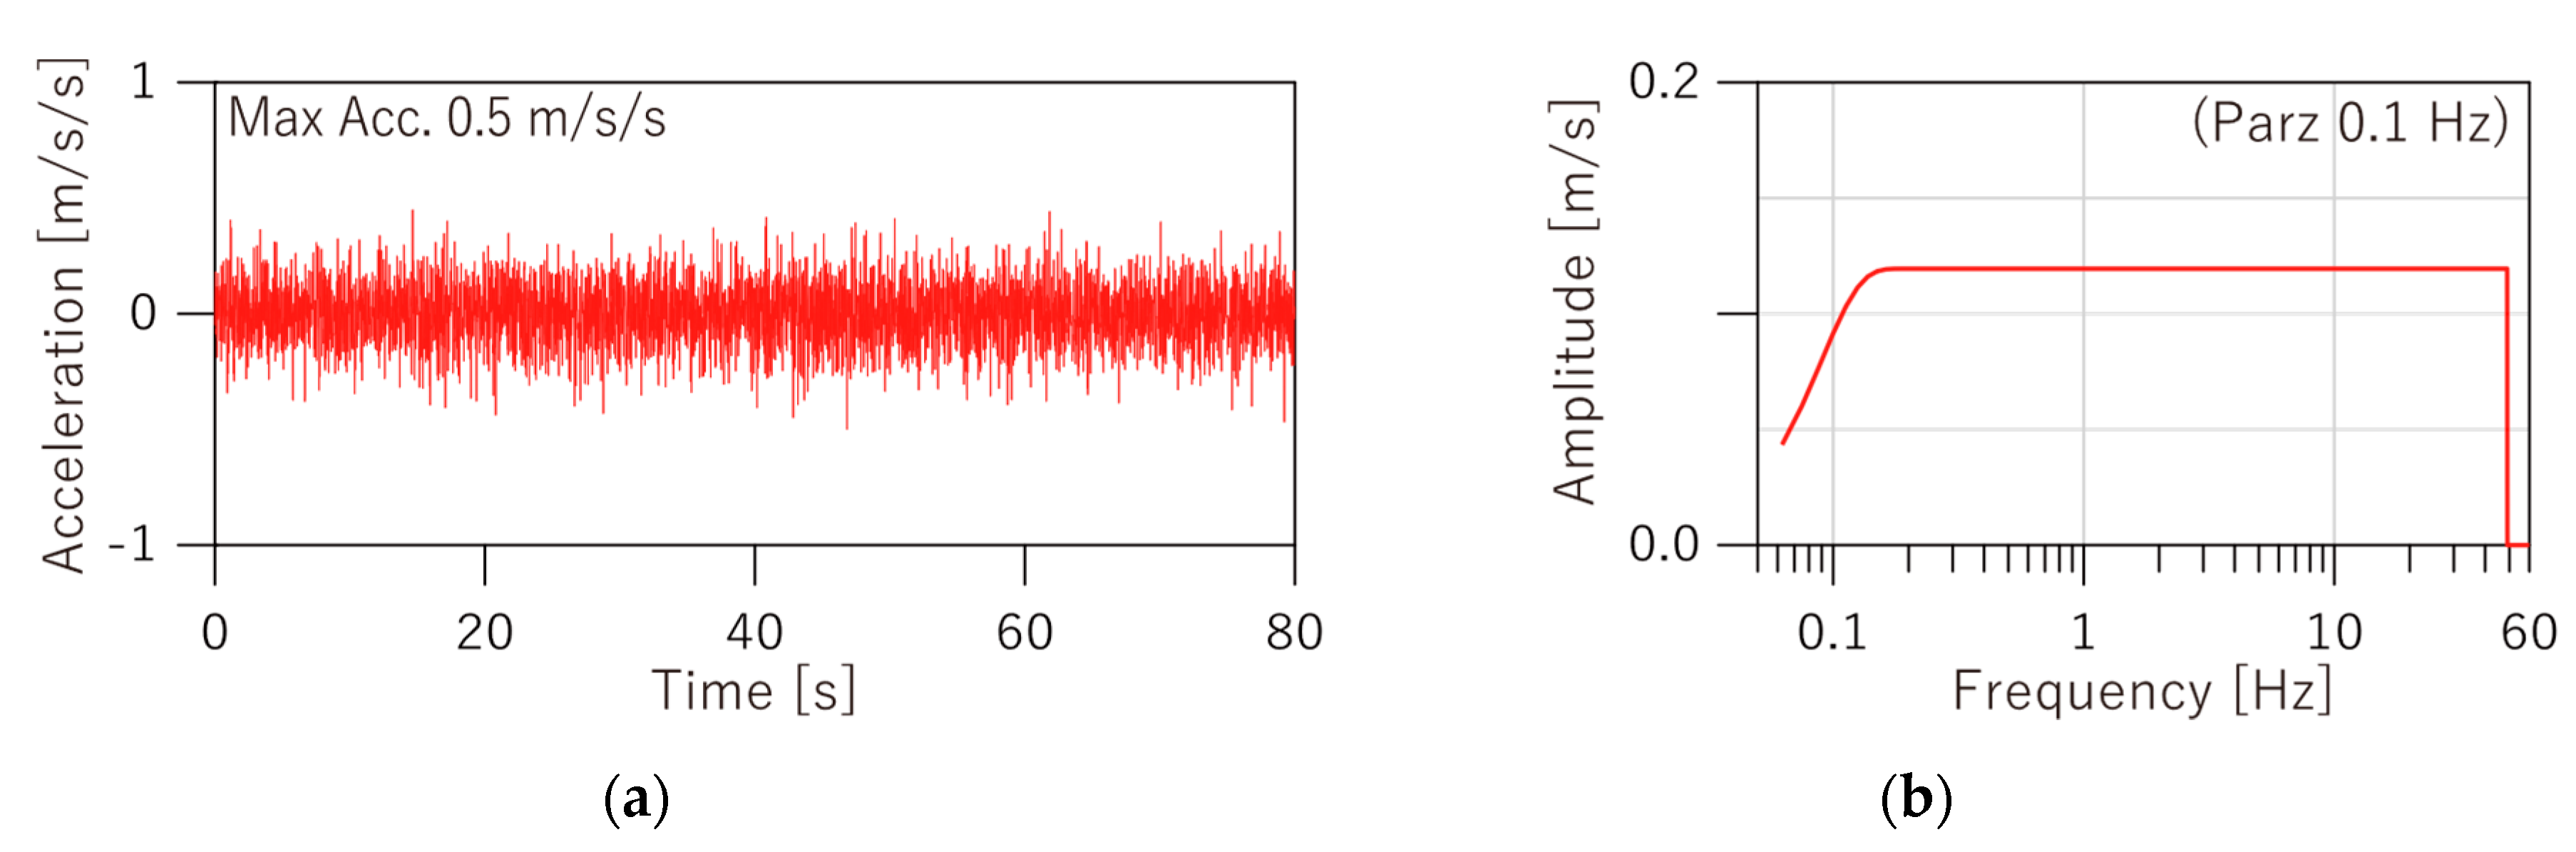
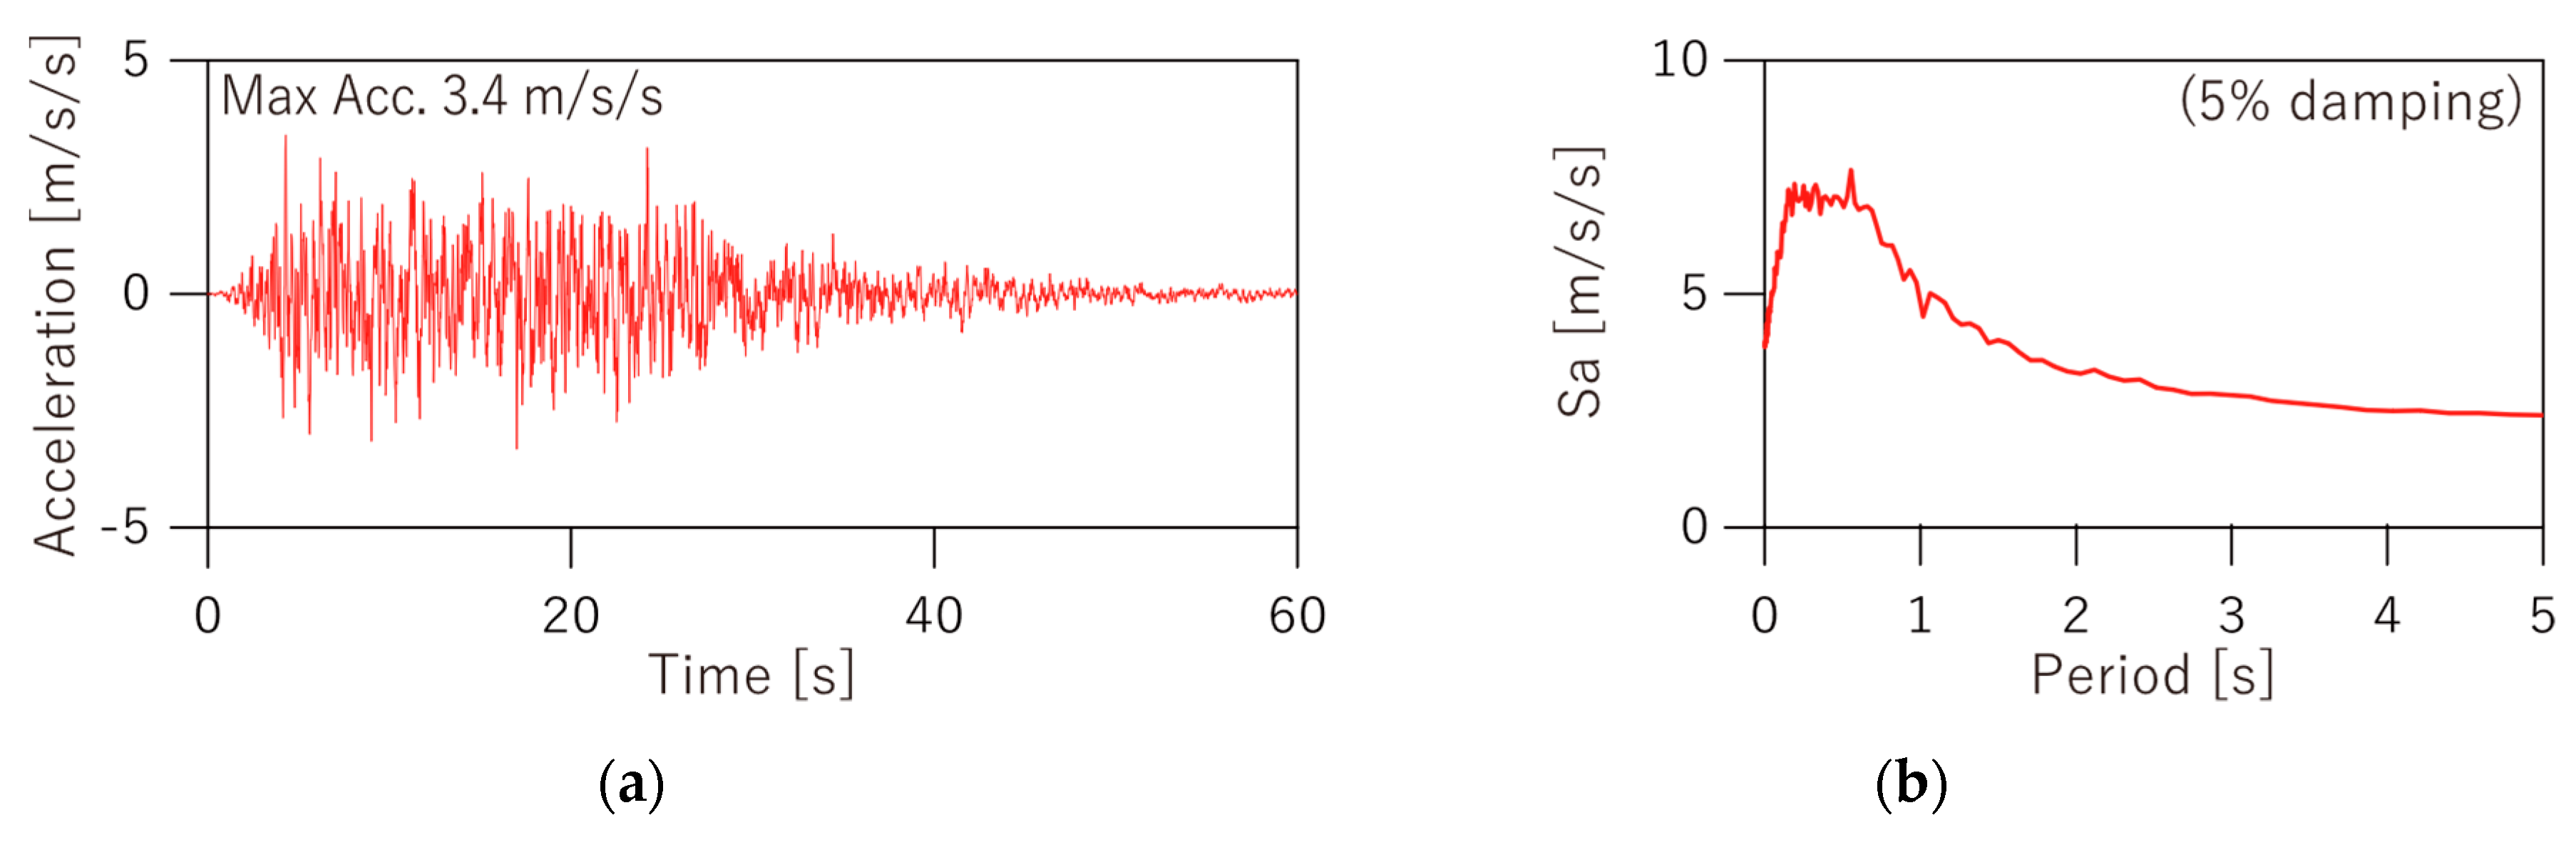
White noise with random phase tests (frequency range: 0.1 Hz to 49 Hz) were conducted for the initial tests to analyze the dynamic properties of the SCS and the test steel frame. Then, earthquake excitation tests using a simulated earthquake ground motion with random phases, based on the design spectrum specified in the Building Standards Law of Japan, were carried out. The amplitude was gradually scaled according to the condition of the specimens. Figure 14 and Figure 15 show the acceleration time histories and spectrum of the input motions given to the shake table.
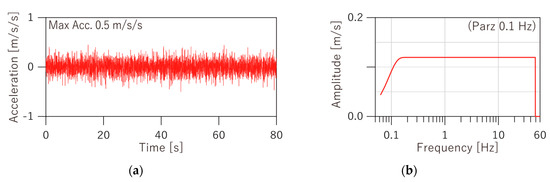
Figure 14.
White noise wave used in shake table test: (a) Acceleration time histories; (b) Fourier amplitude spectrum.
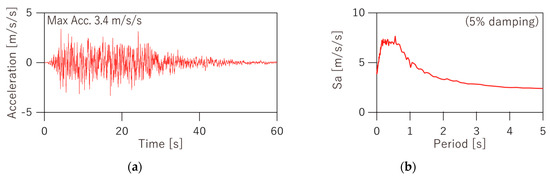
Figure 15.
Simulated earthquake wave used in shake table test: (a) Acceleration time histories; (b) spectral acceleration.
4.4. Full-Scale Shake Table Test Results
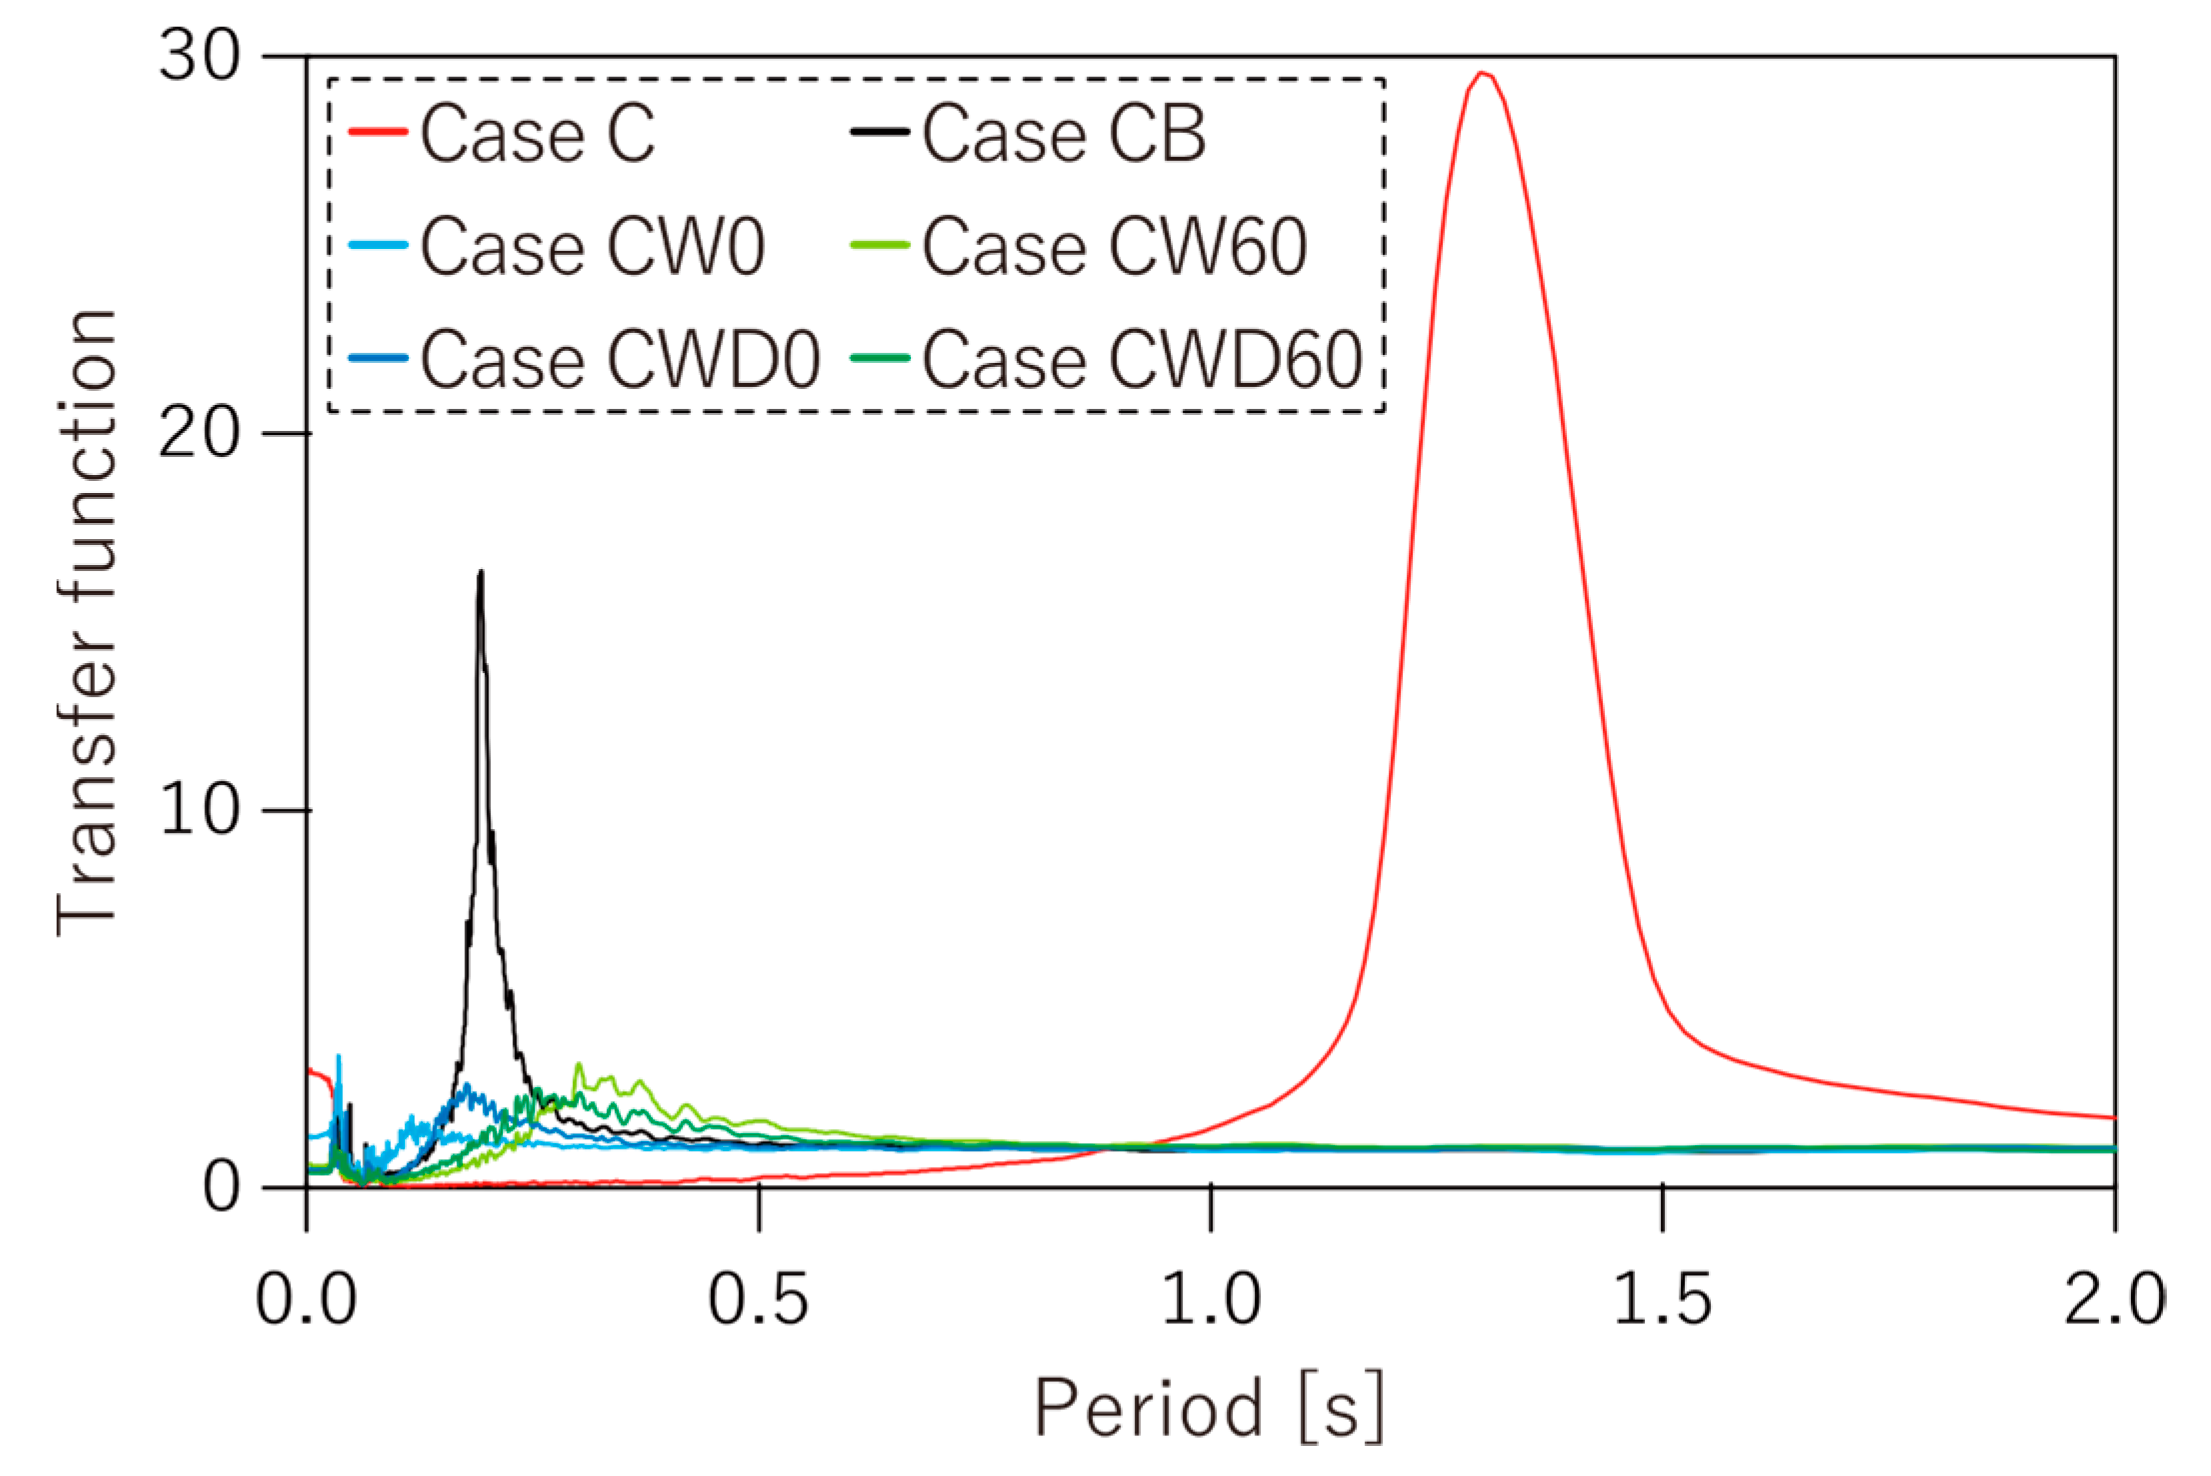
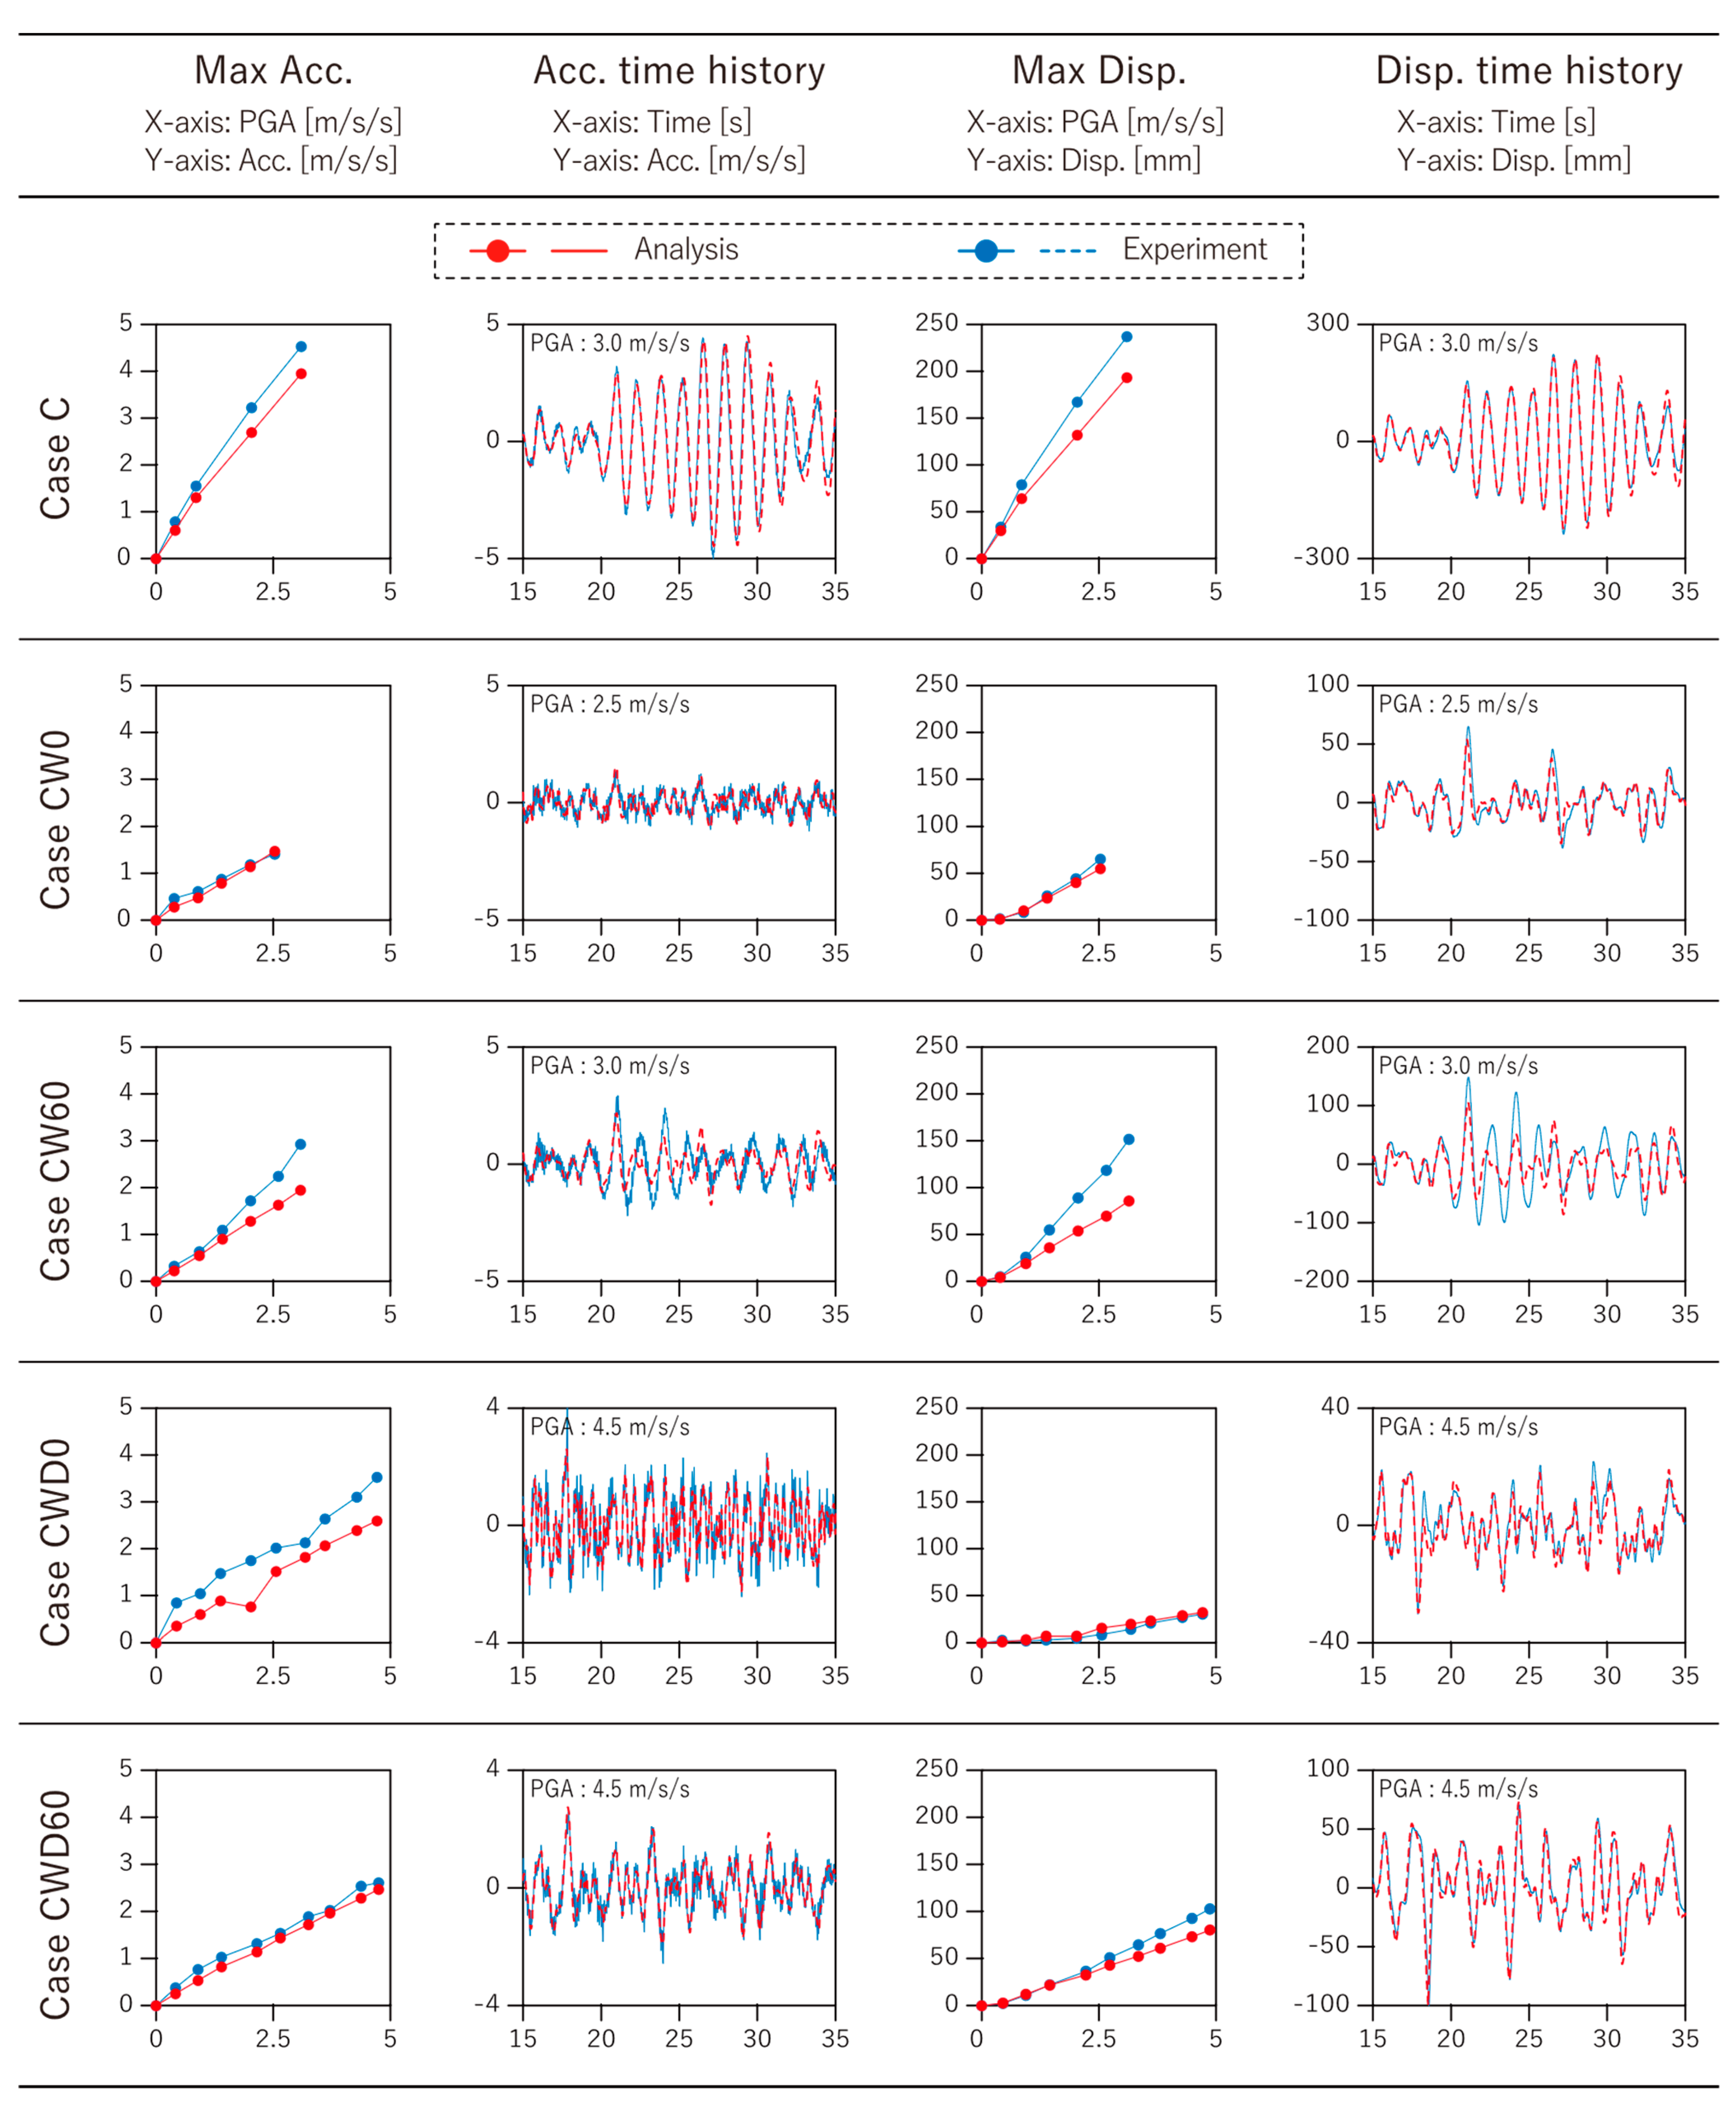
Figure 16 displays the amplitude of acceleration transfer functions from the shake table surface to the ceiling panel surface under random waves for a better understanding of the dynamic response of six specimens and to estimate the natural periods. The first natural periods of Case C and Case CB were 1.37 and 0.14 s, respectively. In other cases, for example, Case CW and Case CWD, a distinct peak point was not confirmed. That is, the implementation of PDCS into the SCS provides a great effect to suppress vibration and prevent resonance damage to the ceiling.
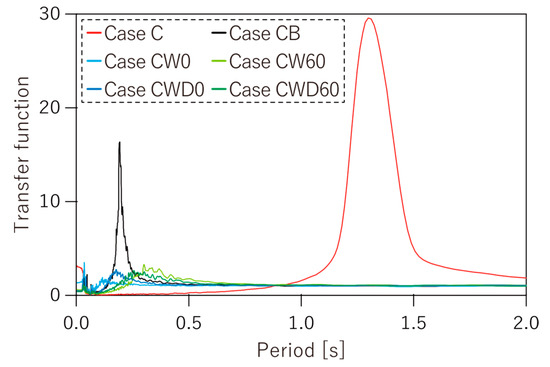
Figure 16.
Amplitude of acceleration transfer function under white noise wave.
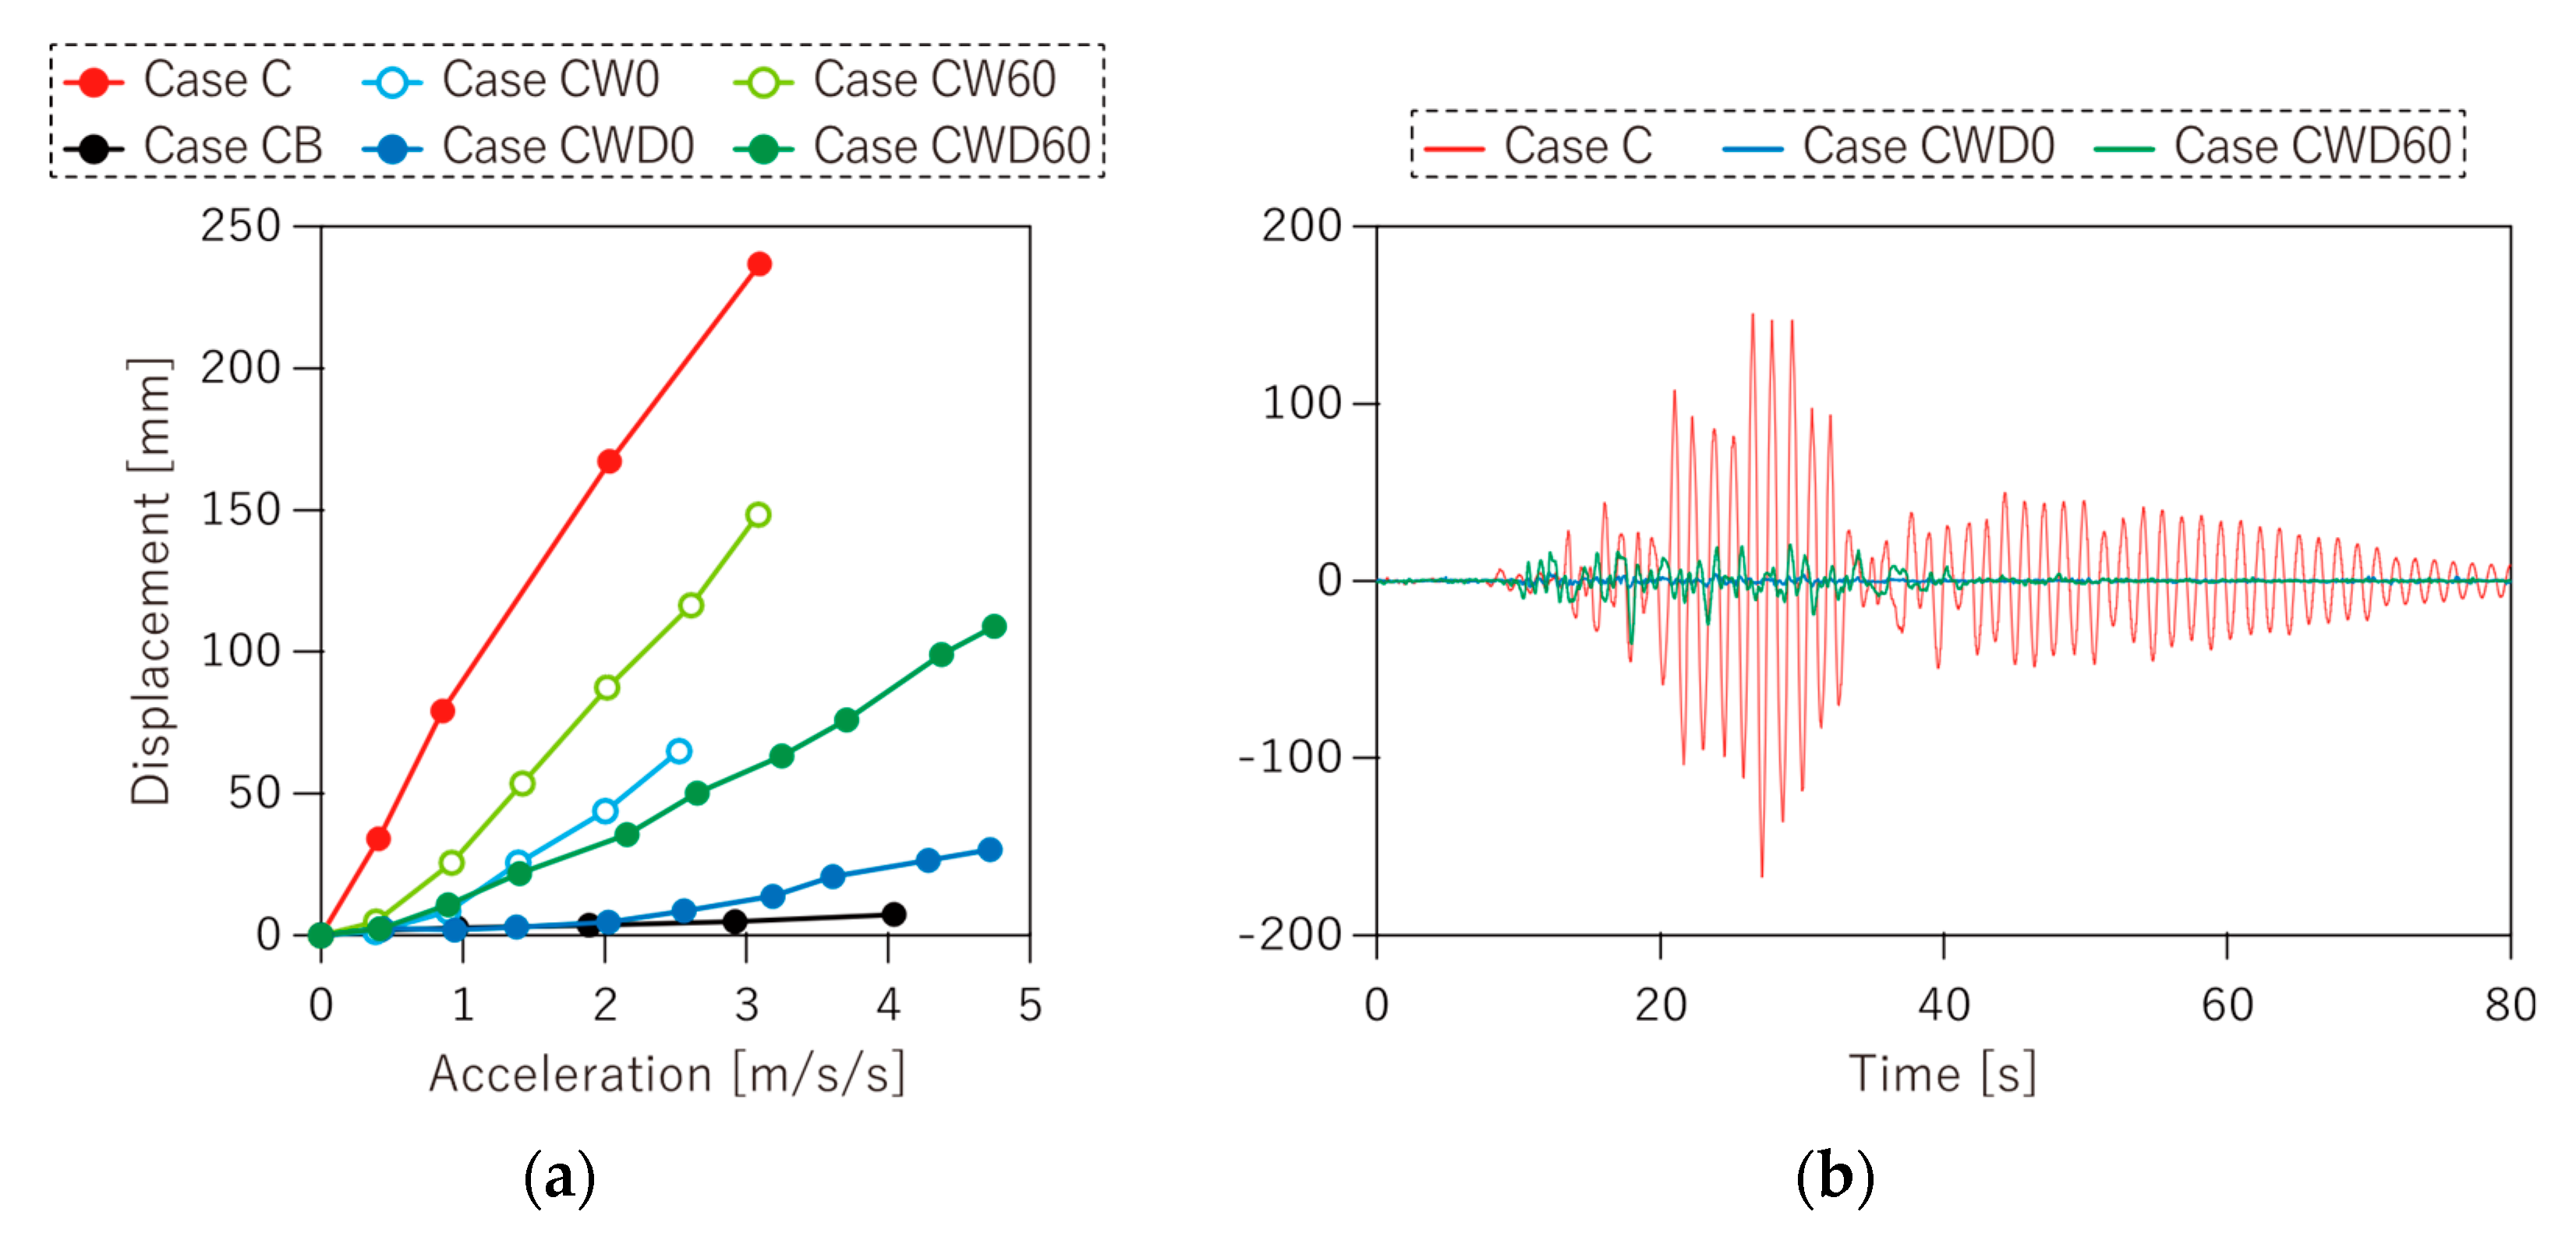
Figure 17a depicts the relationship between the maximum displacement response of the ceiling panel and the peak ground acceleration (PGA) at the shake table surface for simulated earthquake waves up to PGA 5 m/s/s. Table 3 summarizes the ratio of the maximum displacement response for each test case to Case C under major PGAs.
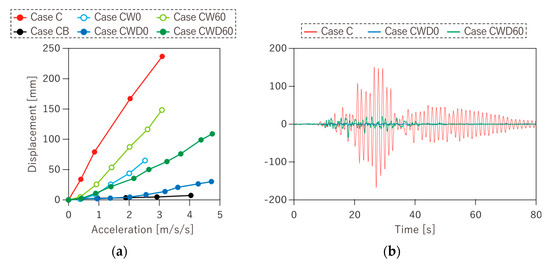
Figure 17.
Displacement response of the SCS surface under simulated wave: (a) Maximum displacement for different PGAs; (b) displacement time histories under PGA 2 m/s/s.
Table 3.
The response ratio of maximum displacement to the Case C under major PGAs.
As shown in Figure 17a and Table 3, Case CB, which was rigidly fixed to the floor above by the steel brace, exhibited the largest response reduction, of an average of 3% for the unreinforced Case C. Similarly, the specimens applying the proposed system, Case CWD0 and Case CWD60, effectively reduced the displacement response to 6% in Case CWD0 and 27% in Case CWD60, respectively, compared to Case C. Case CW0 mitigated the displacement response more than Case CW60, because the horizontal stiffness given by the stretched wire of Case CW0 is larger than that of Case CW60.
Figure 17b compares the displacement time history of the ceiling panel for each case under the simulated earthquake motion at PGA 2 m/s/s. As the displacement time history demonstrates, the displacements in Case CWD0 and CWD60 were much smaller than Case C, between 20 to 40 s, and they suppressed the shaking faster than Case C.
Figure 18a displays the relationship between the maximum acceleration response at the ceiling panel and the peak ground acceleration (PGA) at the shake table surface for simulated earthquake waves up to PGA 5 m/s/s. The ratio of the maximum acceleration response for each test case to Case CB under major PGAs is presented in Table 4.

Figure 18.
Acceleration response of the SCS surface under simulated wave: (a) Maximum acceleration for different PGAs; (b) acceleration time histories under PGA 2 m/s/s.
Table 4.
The response ratio of maximum acceleration to the Case CB under major PGAs.
As shown in Figure 18a and Table 4, the acceleration response of Case CB was amplified twice as compared with Case C; meanwhile, the Case CB provided great displacement reduction effect. Moreover, in the Case CB, the buckling of the hanger bolts after the excitation of the simulated earthquake motion at PGA 6 m/s/s was observed due to the large acceleration response. The accelerations in other cases were reduced to almost 20% of Case CB, and there were no significant differences at the maximum acceleration response between Case CWD0 and Case CWD60.
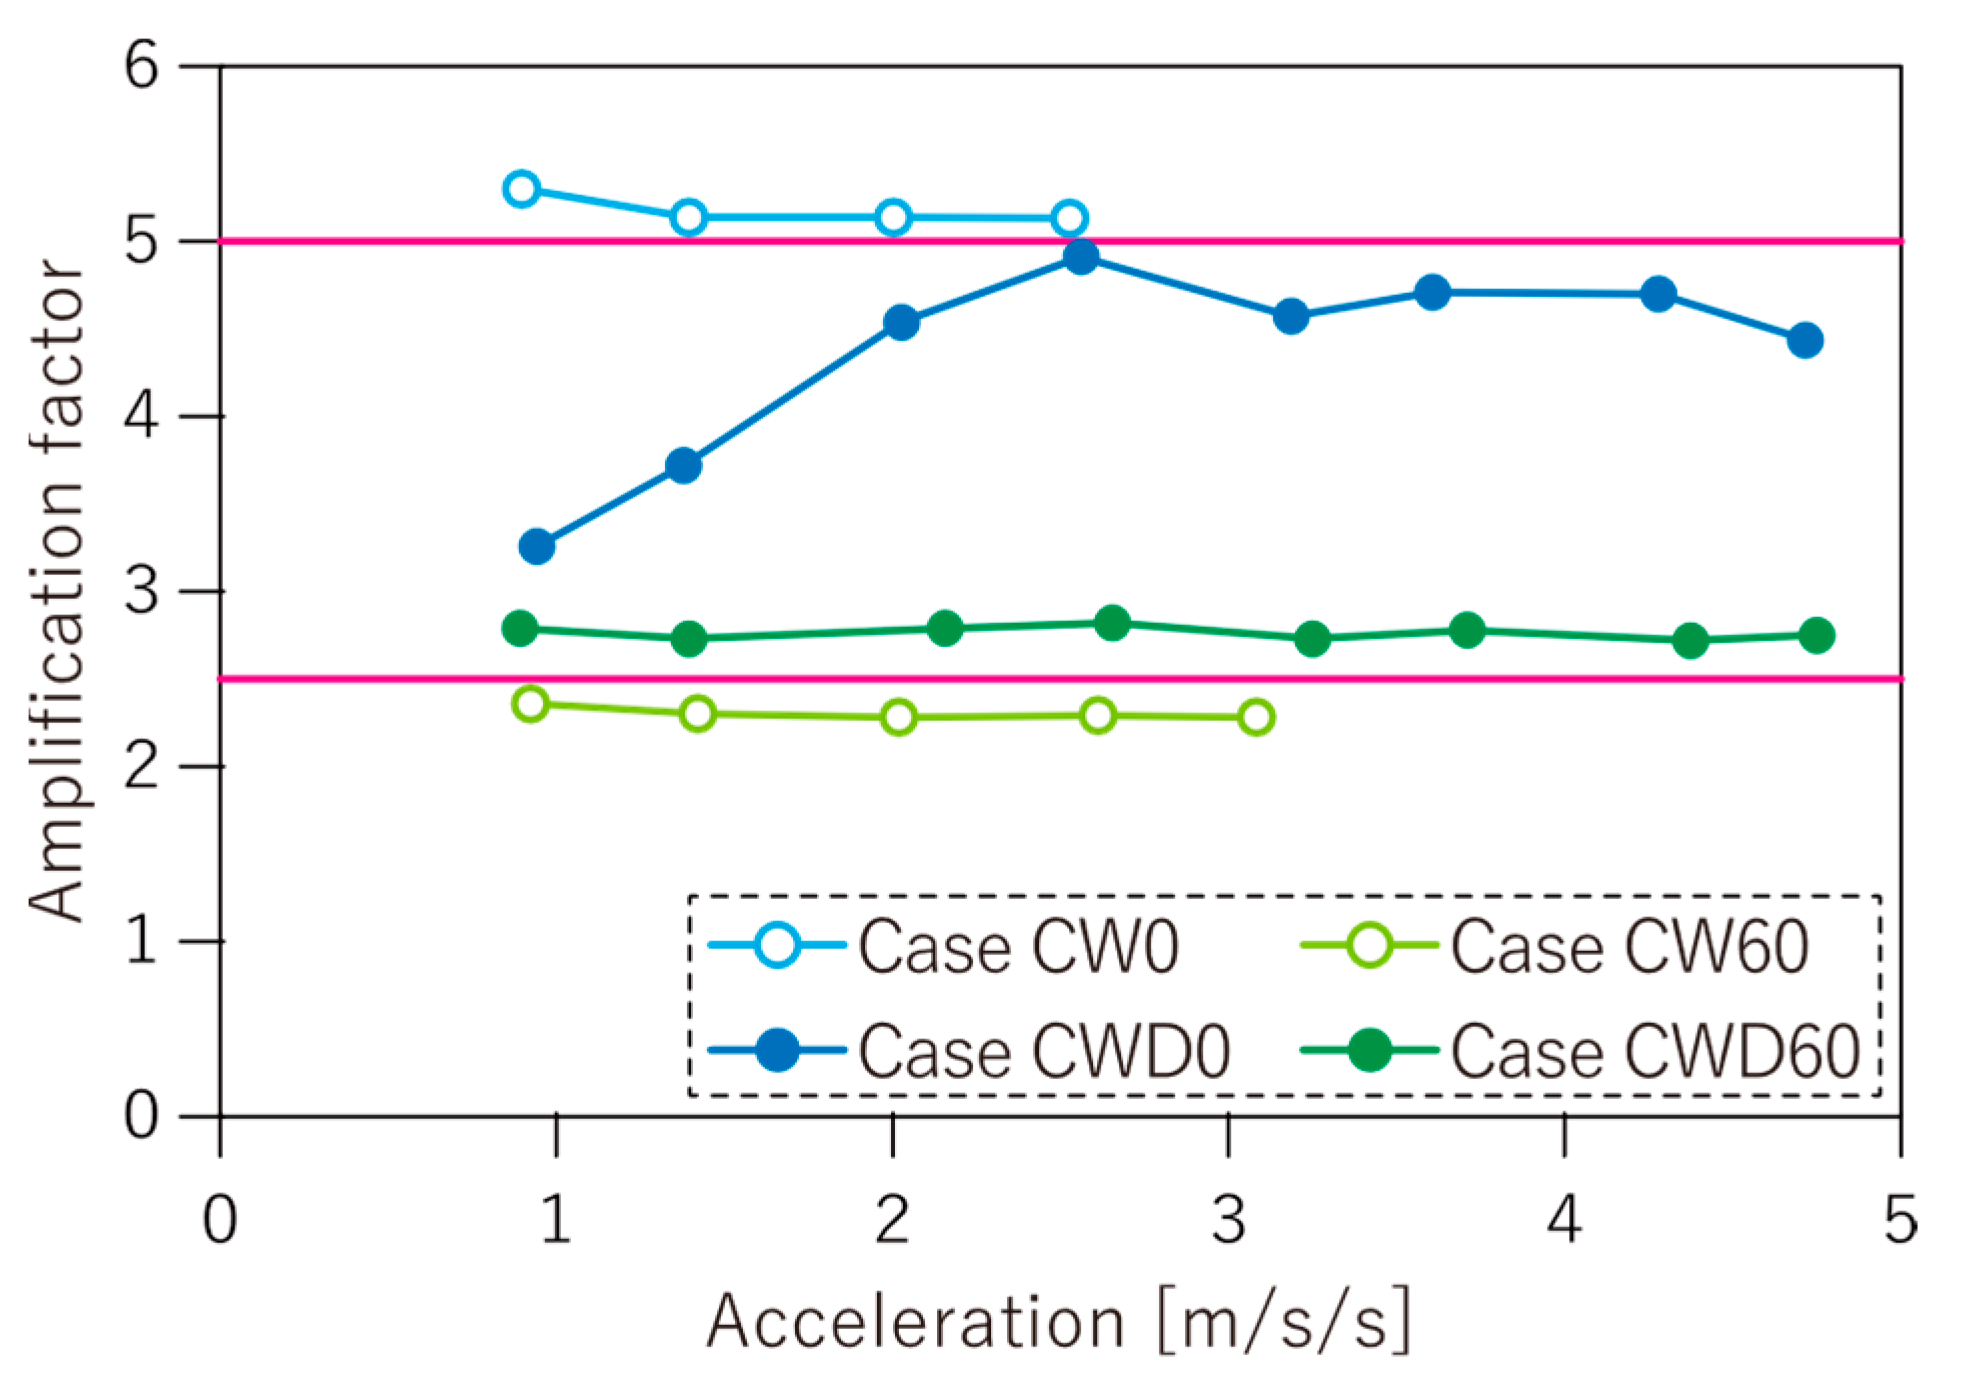
Figure 19 displays the amplification factor of PDCS under the simulated ground motion at different PGAs. This amplification factor is the ratio of the maximum damper displacement to the maximum ceiling panel displacement. The theoretical amplification factor for Case CW0/CWD0 and Case CW60/CWD60 are 5.0 and 2.5, respectively. While little fluctuation of the factor can be observed, especially in Case CWD0 when PGAs are small, the mean values of the experimental results are close to the theoretical values.
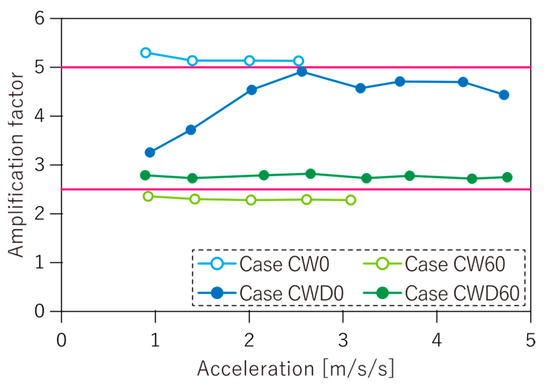
Figure 19.
Amplification factor for different PGAs.
5. Simulation Analysis
5.1. Simulation Model
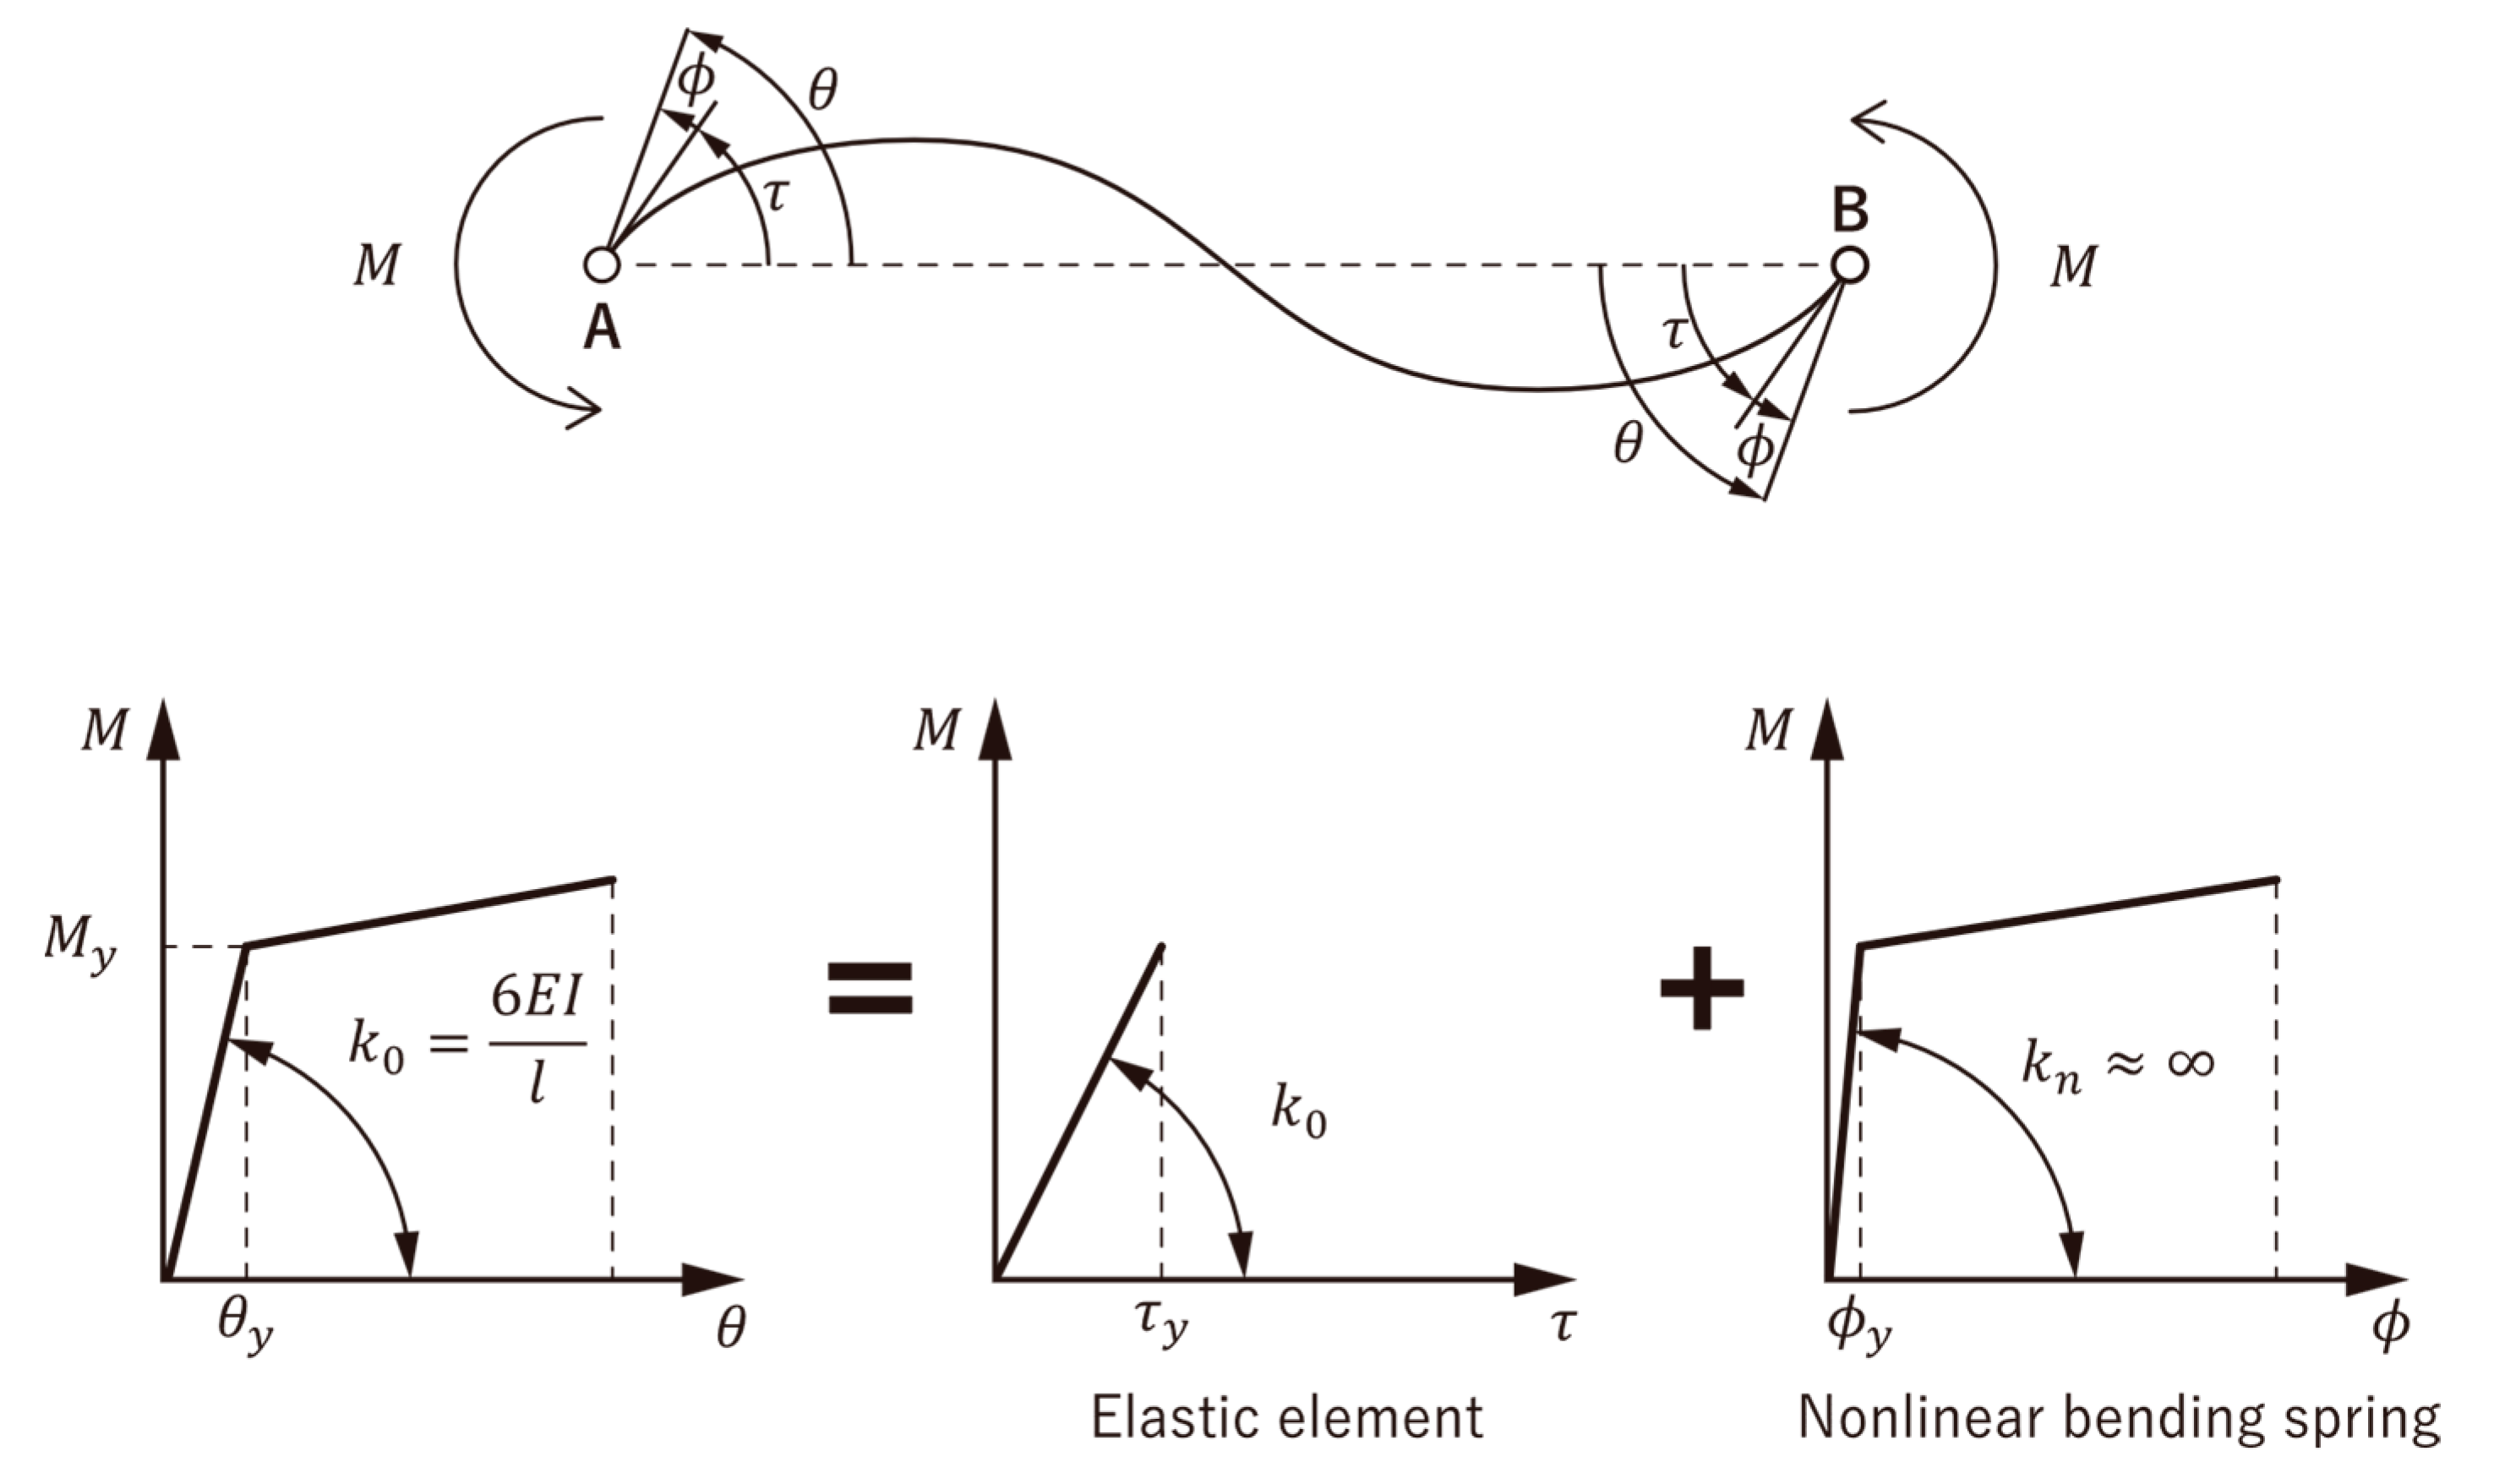
With the aim of observing the verification of the structural modeling using equivalent truss elements for the wire-cable, a simulation analysis was carried out and the modeling results were compared with the experimental results. The 3D-frame simulation model of the experimental test specimen was constructed by using the STructural Earthquake Response Analysis 3D (STERA 3D Version 10.8) software, which is a finite element-based program developed by one of the authors considering the material and geometric nonlinearities [33]. In the model, as illustrated in Figure 20, the steel beam element is presented by a line element and two nonlinear flexural springs at both ends. The steel column element is presented by a line element with nonlinear vertical springs in both end sections to consider nonlinear axial-moment interaction.
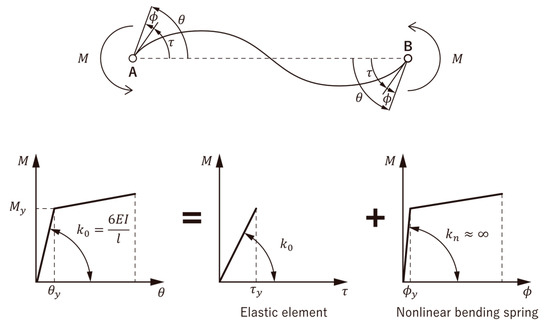
Figure 20.
Moment-rotation relationship for bending spring.
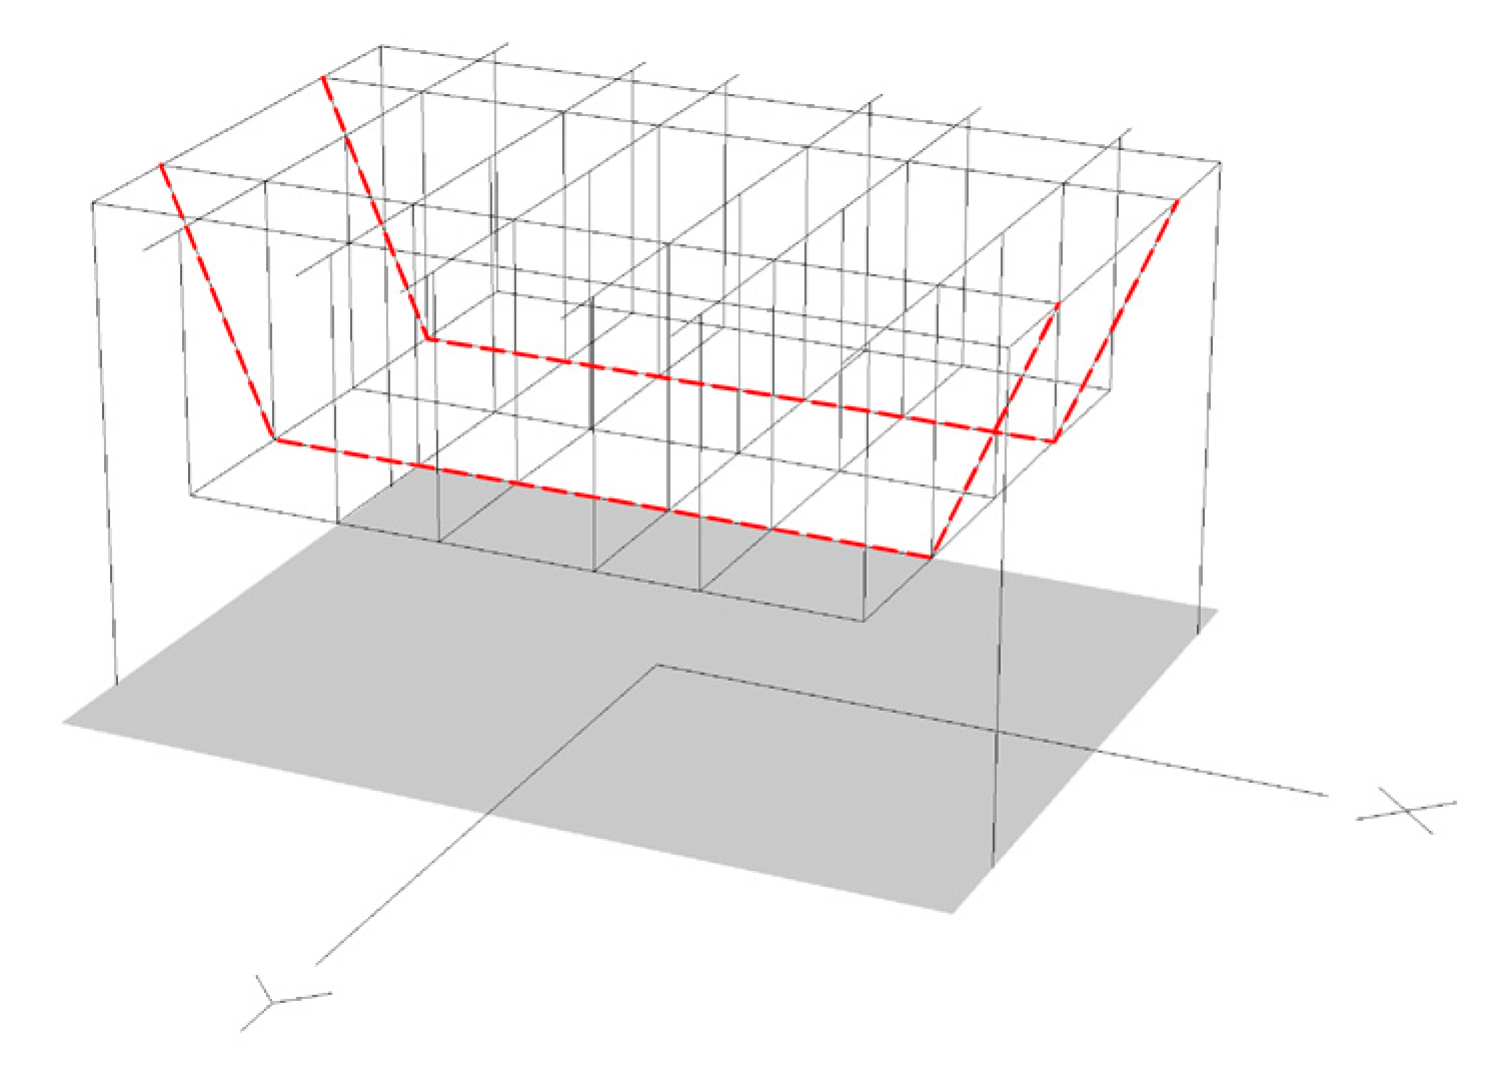
Figure 21 shows the simulation model in the STERA 3D. The ceiling panel is suspended 1500 mm from the supporting beams, and the model was analyzed applying the fixed-ended connection to all the joints. In addition, recorded acceleration data at the shake table surface during the excitation were used as the input seismic motions.
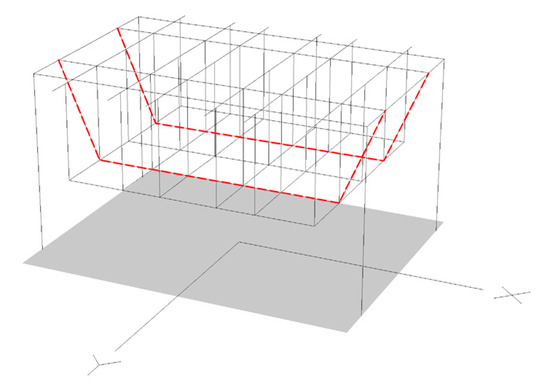
Figure 21.
Analytical model in the STERA 3D.
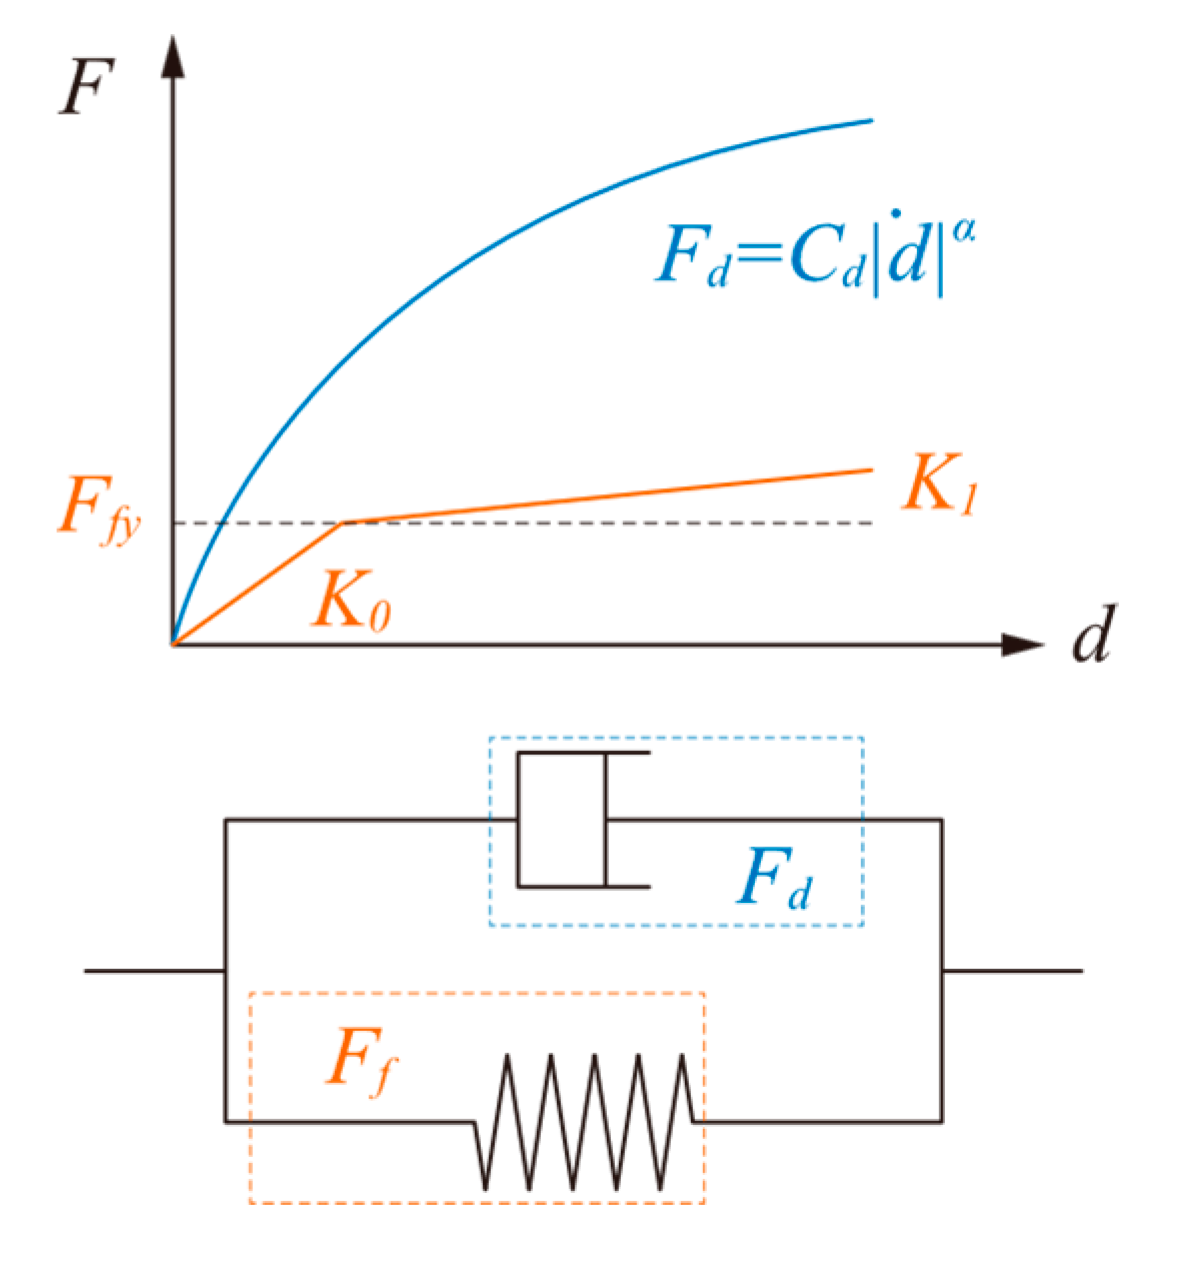
Figure 22 shows the mechanical model of the bilinear and non-linear viscous damper. The friction force, , generated on pulley-wire contacts, was modeled as one bilinear model, and the yield strength, , was estimated by multiplying the number of pulleys and the friction coefficient, using Equation (10). The initial and second stiffnesses of the bilinear hysteresis are and , respectively. The hysteresis behavior of the fluid viscous damper is modeled based on the element test results in Figure 10. The damping force is quantified in proportion to an exponential of the velocity (Equation (11)).
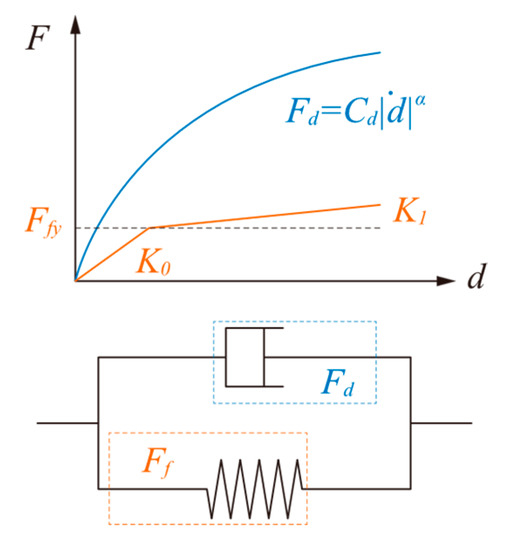
Figure 22.
Restoring force characteristics of damper in the simulation model.
The technical parameters for the one set of the pulley–damper system in the simulation model are summarized in Table 5. The damping factor in the SCS was predicted using a free-vibration range during shake table excitation, and 1.5% was selected for the inherent damping of the SCS by the logarithmic attenuation method.
Table 5.
Damper parameter in the analytical model.
5.2. Simulation Results
In Figure 23, the experimental results of maximum response values and time history data in displacement and acceleration at the SCS panel are compared with the analytical results for all the experimental cases under simulated earthquake waves. During the comparison of the maximum response value, while the experimental results are relatively larger than the analytical results, the experimental and numerical models’ responses are in good agreement.
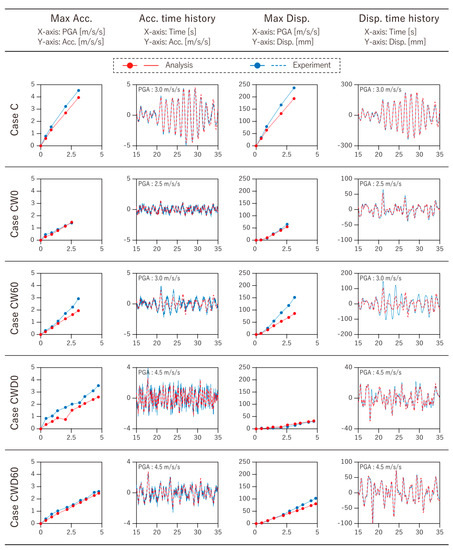
Figure 23.
Results comparison of the SCS response between shake table test and simulation analysis.
It is considered that the repeated earthquake excitation to the specimen decreased the pre-tension force of the stay cable, and the joint rigidness caused the differences between the experimental and analytical results. The shake table test of Case CW60 was carried out after the Case CW0 in 2020. Therefore, due to the cumulative of the previous test case damage, the error in Case CW60 was made to become larger than Case CW0.
The coefficient of determination, R2, is selected to quantitatively measure the accuracy of the simulation model in this study, and it is defined as Equation (12). In addition, Table 6 shows the R2 for the validation of each simulation model. The R2 value for all cases of the maximum acceleration and displacement response are 0.83 and 0.91, respectively. In particular, the minimum R2 value was 0.69 in the Case CW60. Besides, the simulation model accurately reproduced the time histories responses of the accelerations and displacements, including the frequency and the location of the wave crest.
where is the output by the shake table test, is the output by the simulation analysis, and is the mean of .
Table 6.
Coefficient of correlation for the validation of simulation model.
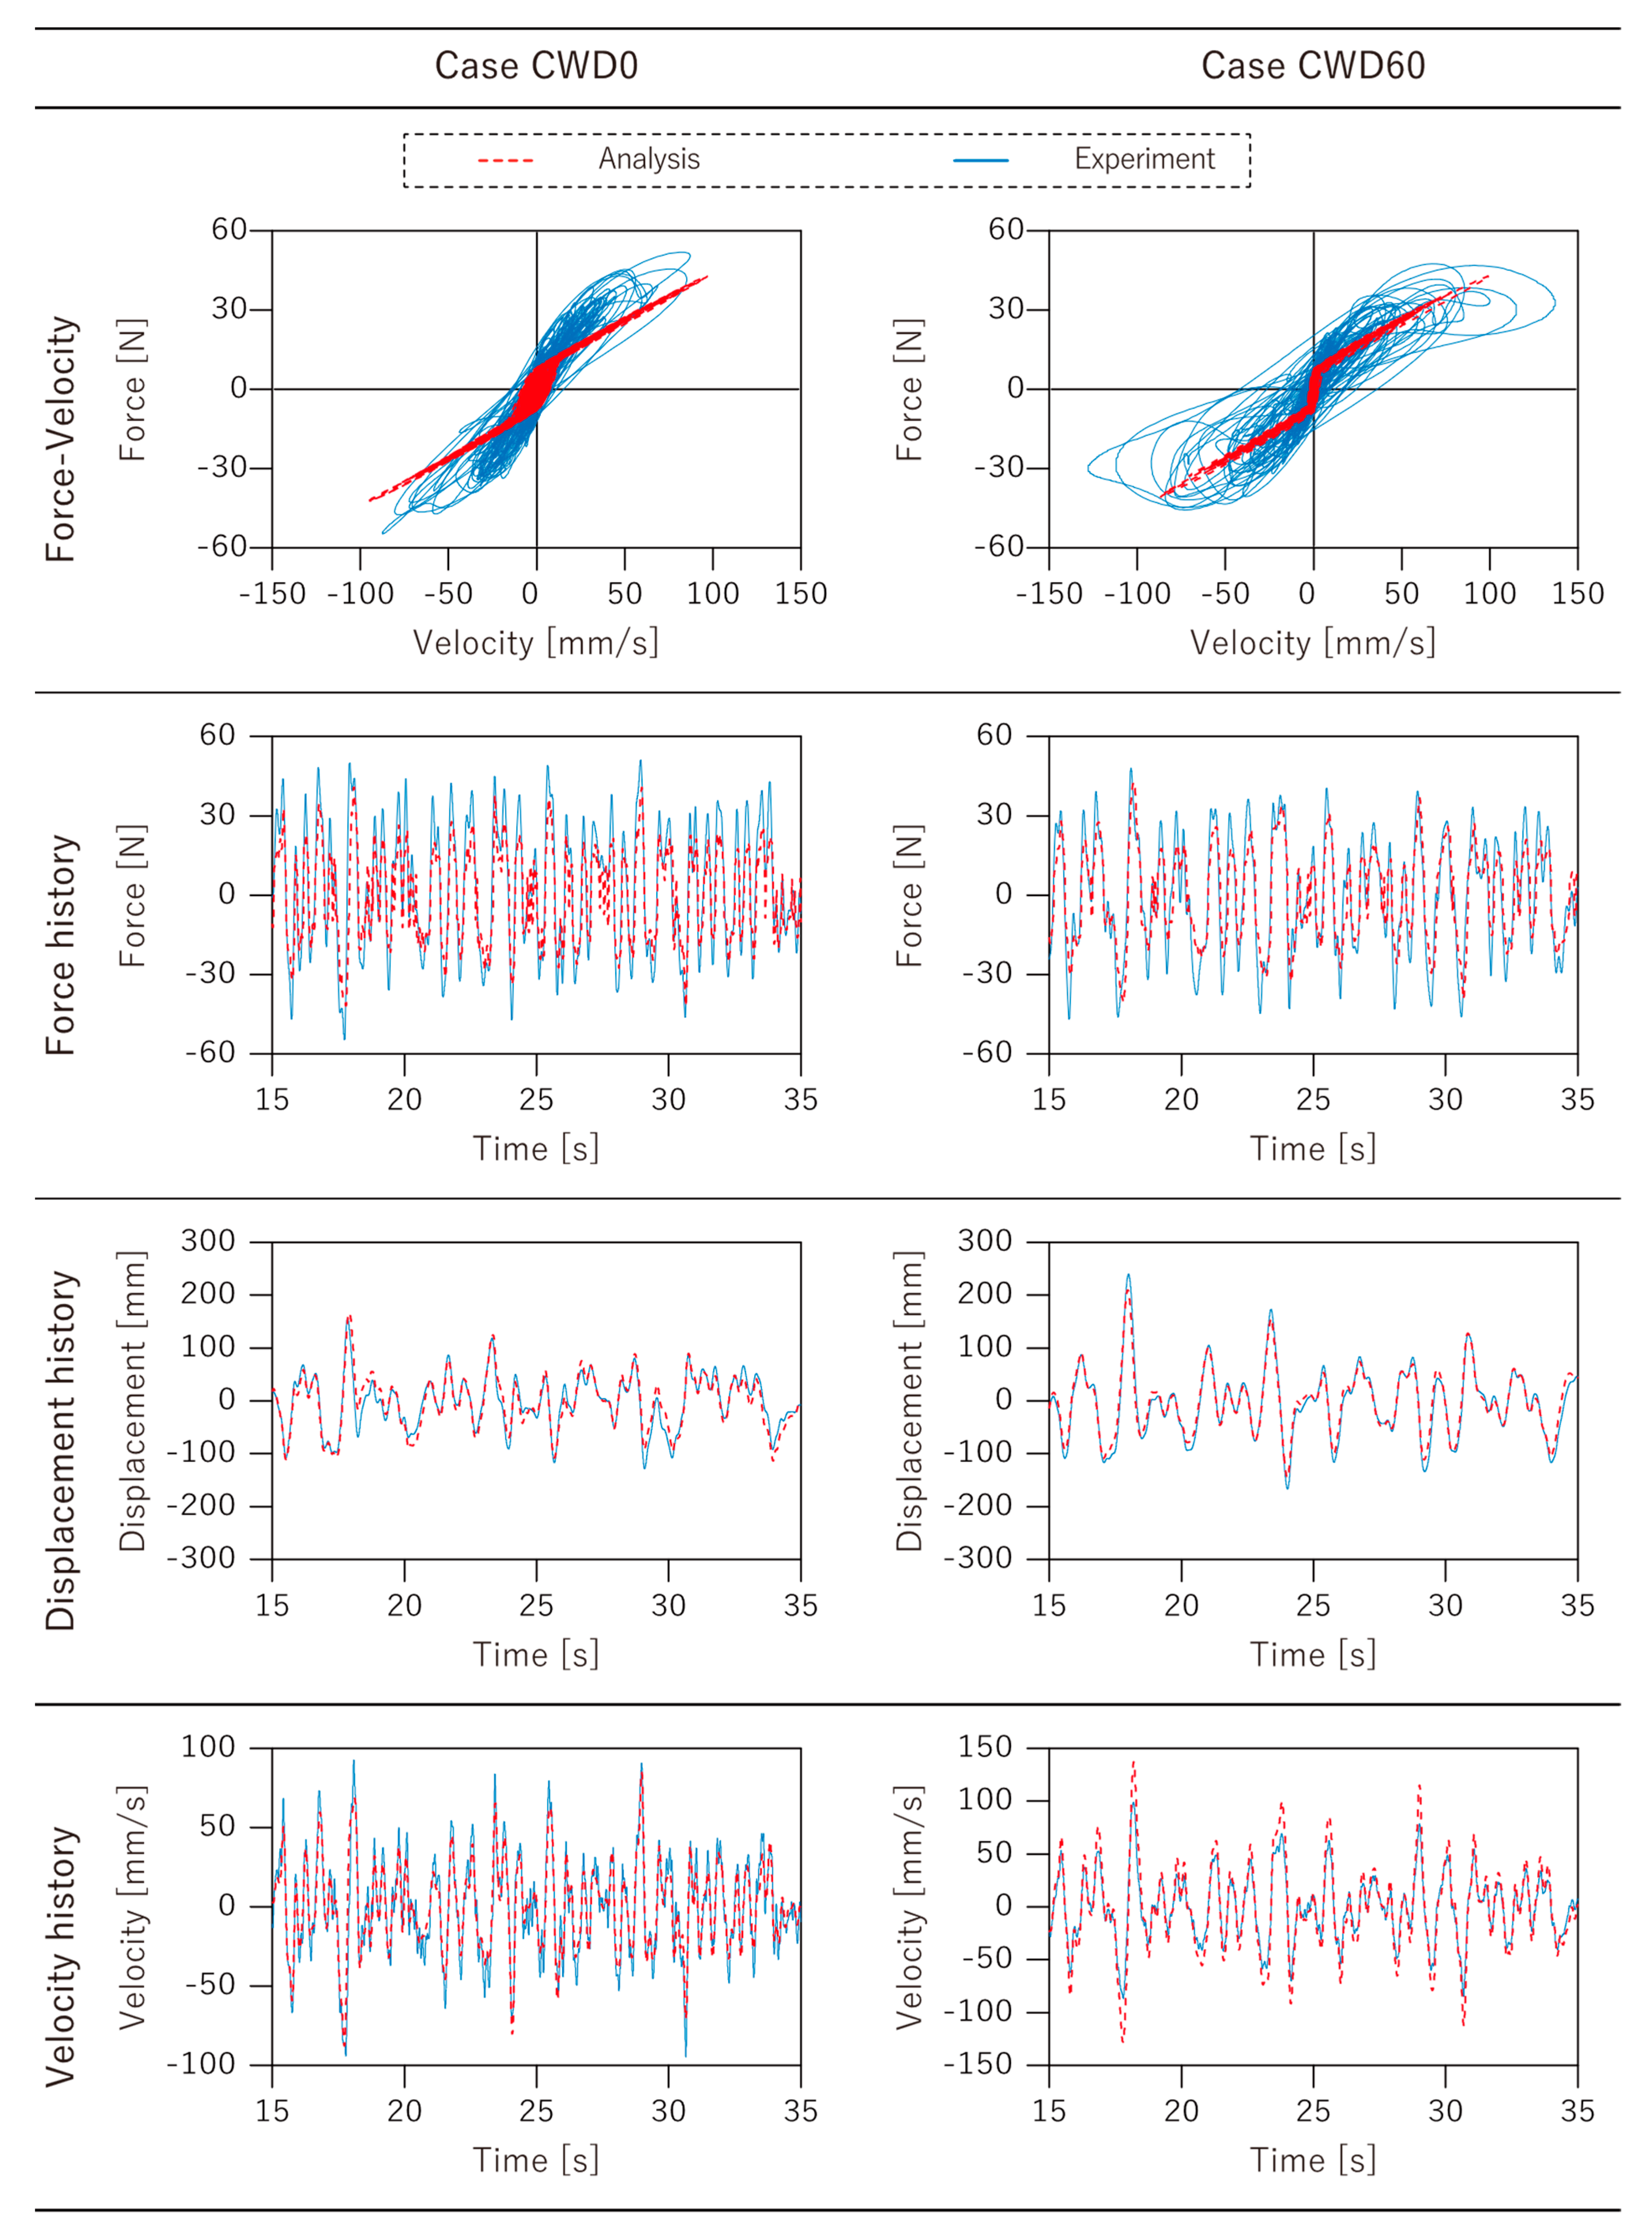
The results of the force–velocity relationship of the damper device in the shake table tests and simulation analyses are contrasted in Figure 24. The gaps in the hysteresis loop shape were confirmed; however, the error between the experimental and analytical results of the time histories are reproduced well. Thereby, the effect of displacement amplification was successfully simulated in the analytical model.
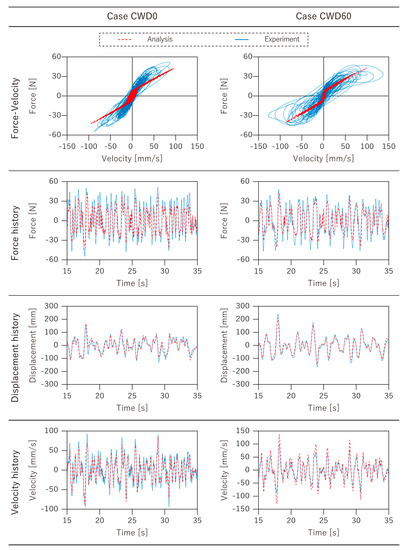
Figure 24.
Results comparison of the damper response between shake table test and simulation analysis.
6. Conclusions
This paper proposed an innovative passive vibration control structure for an indirect suspended ceiling system using pulley tackle mechanisms, named the pulley–damper ceiling system (PDCS), and provided detailed information on the system configuration. A preliminary experimental investigation of the dynamic characteristics of the proposed system was conducted. A main goal was to understand the behavior of the entire system under seismic motion and evaluate the feasibility. The results obtained in this study are summarized below:
- The fundamental concept to integrate passive damper system-employed pulley tackle mechanisms into a SCS was presented, which amplifies the SCS displacement in proportion to the number of stretched wire and its installing angle, and transmits to the damper. Moreover, theoretical formulation, considering the amplification mechanism and the elasticity of the wire-cable by modeling as equivalent truss elements, was established.
- Shake table tests using a full-scale SCS specimen of 4020 mm × 3200 mm in area were demonstrated using simulated earthquake ground motion to evaluate the vibration reduction effect of the PDCS. Conventional SCS (Case C), reinforced SCS with the steel brace (Case CB), and damped SCS using PDCS (Case CWD) were constructed. In addition, in the case of Case CWD, two configurations were prepared to investigate the influence of the system installing angle (horizontal: Case CWD0 and diagonal: Case CWD60) to the response reduction effect. The average response ratio of the maximum displacement in Case CWD0 and Case CWD60 to Case C were 0.04 and 0.21, respectively. Additionally, the average response ratio of the maximum displacement in Case CWD0 and Case CWD60 to Case CB were 0.19 and 0.15, respectively. It was confirmed that both acceleration and displacement could be controlled with high efficiency compared to the unbraced SCS and braced SCS.
- A non-linear rotational damper comprises of two fluid viscous dampers, and the cable bobbin was developed for the proposed system to follow up the large wire stroke. The damper successfully worked during shake table excitations and the theoretical amplification effect was observed.
- The analytical model of the full SCS specimens and formulation of the constitute equation in the DPDS were verified by comparing the experimental and analytical results. The friction force on the pulley was equivalently converted as a bilinear hysteresis model. The analytical model accurately simulated the experimental time history responses of both displacements with 0.83 R2 and acceleration with 0.91 R2, including the dynamic behavior of the damper.
Author Contributions
Conceptualization, T.S.; methodology, S.S.; software, T.S.; validation, R.M. and S.S.; formal analysis, R.M.; investigation, R.M.; data curation, R.M.; writing—original draft preparation, R.M.; writing—review and editing, T.S.; visualization, R.M.; supervision, T.S.; project administration, S.S.; funding acquisition, T.S. All authors have read and agreed to the published version of the manuscript.
Funding
This research received no external funding.
Institutional Review Board Statement
Not applicable.
Informed Consent Statement
Not applicable.
Data Availability Statement
The data presented in this study are available on request from the corresponding author.
Acknowledgments
The authors gratefully thank the practice committee of the development of the ceiling vibration control system: M. Uchikawa (Sato Kogyo Co., Ltd.), E. Nishimura (Toda Corp.), Y. Yamasaki (Nishimatsu Construction Co., Ltd.), H. Ryujin (Maeda Co., Ltd.), and R. Doi (Kumagai Gumi Co., Ltd.).
Conflicts of Interest
The authors declare no conflict of interest.
References
- Kasai, K.; Mita, A.; Kitamura, H.; Matsuda, K.; Morgan, T.A.; Taylor, A.W. Performance of Seismic Protection Technologies during the 2011 Tohoku-Oki Earthquake. Earthq. Spectra 2013, 29, 265–293. [Google Scholar] [CrossRef]
- Villaverde, R. Seismic Design of Secondary Structures: State of the Art. J. Struct. Eng. 1997, 123, 1011–1019. [Google Scholar] [CrossRef]
- Soroushian, S.; Zaghi, A.E.; Maragakis, M.; Echevarria, A.; Tian, Y.; Filiatrault, A. Analytical Seismic Fragility Analyses of Fire Sprinkler Piping Systems with Threaded Joints. Earthq. Spectra 2015, 31, 1125–1155. [Google Scholar] [CrossRef]
- Xu, Z.; Zhang, H.; Wei, W.; Yang, Z. Virtual Scene Construction for Seismic Damage of Building Ceilings and Furniture. Appl. Sci. 2019, 9, 3465. [Google Scholar] [CrossRef] [Green Version]
- Building Research Institute National Research and Development Agency, Japan. Report on the Field Survey of Damage to Ceilings in Airport Terminal Buildings during the 2003 Tokachi-Oki Earthquake; Building Research Institute National Research and Development Agency: Ibaraki, Japan, 2003. (In Japanese) [Google Scholar]
- Building Research Institute National Research and Development Agency, Japan. Quick Report of the Field Survey and the Building Damage by the 2016 Kumamoto Earthquake; Building Research Institute National Research and Development Agency: Ibaraki, Japan, 2016. (In Japanese) [Google Scholar]
- Reitherman, R.; Sabol, T. Nonstructural Damage. Earthq. Spectra 1995, 11, 453–514. [Google Scholar] [CrossRef]
- Miranda, E.; Mosqueda, G.; Retamales, R.; Pekcan, G. Performance of Nonstructural Components during the 27 February 2010 Chile Earthquake. Earthq. Spectra 2012, 28, 453–471. [Google Scholar] [CrossRef]
- Jun, S.C.; Lee, C.H.; Bae, C.J.; Lee, K.J. Shake-Table Seismic Performance Evaluation of Direct- and Indirect-Hung Suspended Ceiling Systems. J. Earthq. Eng. 2020. [Google Scholar] [CrossRef]
- Motosaka, M.; Mitsuji, K. Building Damage during the 2011 off the Pacific Coast of Tohoku Earthquake. Soils Found. 2012, 52, 929–944. [Google Scholar] [CrossRef] [Green Version]
- Architectural Institute of Japan. Guidelines for Preventing Falling Accidents of Nonstructural Elements Such as Ceilings; Special Investigation Committee on Safety Evaluation and Fall Accident Prevention of Nonstructural Elements, Architectural Institute of Japan: Tokyo, Japan, 2013. (In Japanese) [Google Scholar]
- Lee, J.-S.; Jung, D.-I.; Lee, D.-Y.; Cho, B.-H. Performance Evaluation of Rigid Braced Indirect Suspended Ceiling with Steel Panels. Appl. Sci. 2021, 11, 1986. [Google Scholar] [CrossRef]
- Lu, Y.; Mosqueda, G.; Han, Q.; Zhao, Y. Shaking Table Tests Examining Seismic Response of Suspended Ceilings Attached to Large-Span Spatial Structures. J. Struct. Eng. 2018, 144, 04018152. [Google Scholar] [CrossRef]
- Luo, Z.; Xue, J.; Zhou, T.; Qi, L.; Zhao, X. Shaking Table Tests and Seismic Design Suggestions for Innovative Suspended Ceiling Systems with Detachable Metal Panels. Eng. Struct. 2021, 232, 111830. [Google Scholar] [CrossRef]
- Ryu, K.P.; Reinhorn, A.M. Experimental Study of Large Area Suspended Ceilings. J. Earthq. Eng. 2019, 23, 1001–1032. [Google Scholar] [CrossRef]
- Soroushian, S.; Maragakis, M.; Jenkins, C. Capacity Evaluation of Suspended Ceiling-Perimeter Attachments. J. Struct. Eng. 2016, 142, 04015124. [Google Scholar] [CrossRef]
- Badillo-Almaraz, H.; Whittaker, A.S.; Reinhorn, A.M. Seismic Fragility of Suspended Ceiling Systems. Earthq. Spectra 2007, 23, 21–40. [Google Scholar] [CrossRef]
- Dhakal, R.P.; Macrae, G.A.; Pourali, A.; Paganotti, G. Seismic Fragility of Suspended Ceiling Systems used in NZ Based on Component Tests. Bull. N. Z. Soc. Earthq. Eng. 2016, 49, 45–63. [Google Scholar] [CrossRef]
- Fiorin, L.; Brandolese, S.; Scotta, R. Experimental and Numerical Assessment of Suspended Ceiling Joints. Bull. Earthq. Eng. 2021, 19, 919–962. [Google Scholar] [CrossRef]
- Yao, G.C. Seismic Performance of Direct Hung Suspended Ceiling Systems. J. Archit. Eng. 2000, 6, 6–11. [Google Scholar] [CrossRef]
- Pourali, A.; Dhakal, R.P.; Macrae, G.; Tasligedik, A.S. Fully Floating Suspended Ceiling System: Experimental Evaluation of Structural Feasibility and Challenges. Earthq. Spectra 2017, 33, 1627–1654. [Google Scholar] [CrossRef]
- Fiorino, L.; Shakeel, S.; Landolfo, R. Seismic Behaviour of a Bracing System for LWS Suspended Ceilings: Preliminary Experimental Evaluation through Cyclic Tests. Thin-Walled Struct. 2020, 155, 106956. [Google Scholar] [CrossRef]
- Fiorino, L.; Bucciero, B.; Landolfo, R. Evaluation of Seismic Dynamic Behaviors of Drywall Partitions, Façades and Ceilings through Shake Table Testing. Eng. Struct. 2019, 180, 103–123. [Google Scholar] [CrossRef]
- Magliulo, G.; Pentangelo, V.; Maddaloni, G.; Capozzi, V.; Petrone, C.; Lopez, P.; Talamonti, R.; Manfredi, G. Shake Table Tests for Seismic Assessment of Suspended Continuous Ceilings. Bull. Earthq. Eng. 2012, 10, 1819–1832. [Google Scholar] [CrossRef]
- National research Institute for Earth Science and Disaster Prevention, Japan. Collapse Mechanism of Wide-Area Suspended Ceiling System Based on E-Defense Full-Scale Shake Table Experiments; National Research Institute for Earth Science and Disaster Prevention: Ibaraki, Japan, 2015. (In Japanese) [Google Scholar]
- Soroushian, S.; Rahmanishamsi, E.; Ryu, K.P.; Maragakis, M.; Reinhorn, A.M. Experimental Fragility Analysis of Suspension Ceiling Systems. Earthq. Spectra 2016, 32, 881–908. [Google Scholar] [CrossRef]
- Soroushian, S.; Maragakis, E.; Zaghi, A.E.; Rahmanishamsi, E.; Itani, A.M.; Pekcan, G. Response of a 2-Story Test-Bed Structure for the Seismic Evaluation of Nonstructural Systems. Earthq. Eng. Eng. Vib. 2016, 15, 19–29. [Google Scholar] [CrossRef]
- Soroushian, S.; Rahmanishamsi, E.; Jenkins, C.; Maragakis, E.M. Fragility Analysis of Suspended Ceiling Systems in a Full-Scale Experiment. J. Struct. Eng. 2019, 145, 4019005. [Google Scholar] [CrossRef]
- Qi, L.; Kurata, M.; Ikeda, Y.; Kunitomo, K.; Takaoka, M. Seismic Evaluation of Two-Elevation Ceiling System by Shake Table Tests. Earthq. Eng. Struct. Dyn. 2021, 50, 1147–1166. [Google Scholar] [CrossRef]
- Soroushian, S.; Maragakis, E.; Ryan, K.L.; Sato, E.; Sasaki, T.; Okazaki, T.; Mosqueda, G. Seismic Simulation of an Integrated Ceiling-Partition Wall-Piping System at E-Defense. II: Evaluation of Nonstructural Damage and Fragilities. J. Struct. Eng. 2016, 142, 04015131. [Google Scholar] [CrossRef]
- Saito, T.; Maegawa, T.; Denno, S.; Sakai, S.; Uchikawa, M.; Kanagawa, M.; Ryujin, H. New Seismic Response Control System Using Block and Tackle. In Proceedings of the 16th World Conference on Earthquake Engineering (WCEE), Santiago, Chile, 9–13 January 2017; Chilean Association on Seismology and Earthquake Engineering (ACHISINA): Santiago, Chile, 2017. [Google Scholar]
- Saito, T.; Morita, K.; Hamada, M.; Maegawa, T.; Kikuta, S.; Denno, S.; Demizu, T.; Kanagawa, M.; Makita, T.; Sasaki, H.; et al. Basic Performance of Seismic Control Structure Using Block and Tackle System. J. Struct. Eng. B 2013, 59B, 349–355. (In Japanese) [Google Scholar]
- Saito, T. Structural Earthquake Response Analysis, STERA_3D Version 10.8 and STERA_WAVE Version 1.0. Available online: http://www.rc.ace.tut.ac.jp/saito/software-e.html (accessed on 24 October 2021).

Publisher’s Note: MDPI stays neutral with regard to jurisdictional claims in published maps and institutional affiliations. |
© 2022 by the authors. Licensee MDPI, Basel, Switzerland. This article is an open access article distributed under the terms and conditions of the Creative Commons Attribution (CC BY) license (https://creativecommons.org/licenses/by/4.0/).