Article

A Comparative Study of Deep Learning Models for Dental Segmentation in Panoramic Radiograph

by
Élisson da Silva Rocha
and
Patricia Takako Endo
*
Programa de Pós-Graduação em Engenharia da Computação, Universidade de Pernambuco, 50050-000 Recife, Pernambuco, Brazil
*
Author to whom correspondence should be addressed.
Appl. Sci. 2022, 12(6), 3103; https://doi.org/10.3390/app12063103
Submission received: 24 February 2022 / Revised: 15 March 2022 / Accepted: 16 March 2022 / Published: 18 March 2022
(This article belongs to the Special Issue Artificial Intelligence Applied to Dentistry)

Abstract

:
Introduction: Dental segmentation in panoramic radiograph has become very relevant in dentistry, since it allows health professionals to carry out their assessments more clearly and helps them to define the best possible treatment plan for their patients. Objectives: In this work, a comparative study is carried out with four segmentation algorithms (U-Net, DCU-Net, DoubleU-Net and Nano-Net) that are prominent in the medical literature on segmentation and we evaluate their results with the current state of the art of dental segmentation in panoramic radiograph. Methods: These algorithms were tested with a dataset consisting of 1500 images, considering experiment scenarios with and without augmentation data. Results: DoubleU-Net was the model that presented the best results among the analyzed models, reaching 96.591% accuracy and 92.886% Dice using the dataset with data augmentation. Another model that stood out was Nano-Net using the dataset without data augmentation; this model achieved results close to that of the literature with only 235 thousand trainable parameters, while the literature model (TSASNet) contains 78 million. Conclusions: The results obtained in this work are satisfactory and present paths for a better and more effective dental segmentation process.

1. Introduction

Radiography is a widely used examination in the field of dentistry and aims to help the dentist in the diagnosis of some diseases that are more difficult to detect in a routine appointment, such as periapical lesions, bone anomalies, among others, especially in their initial state [1]. The radiograph can be obtained in two ways: either intraorally, which are radiographs made using a film/sensor located inside of the mouth; or extraorally, which are radiographs made using a film/sensor located outside of the mouth (extraoral radiographs do not always contain the entire oral region of the patient). Of the extraoral radiographs, the best known are panoramic radiographs.
Panoramic radiographs have advantages over other types of radiographs because they cause less exposure to radiation, provide greater comfort for the patient, are faster and easier to perform and have a large field of view. However, they present disadvantages such as having a complex structure and lower resolution images, which can affect the interpretation of the results by the health professional [2].
By evaluating panoramic radiographs, the dentist can investigate the complete tooth structure and develop the patient’s treatment plan. However, due to the lack of automated resources to help the professional in the analysis of the images, the evaluation occurs in an empirical way, that is, the subjectivity of the surgeon-dentist directly interferes with the ability to diagnose their patients through this exam [3,4]. A task susceptible to human errors is the identification of teeth, their shapes and exact limits since panoramic radiographs also show details originated by the bones of the nasal and facial areas. This process, called tooth segmentation, is of paramount importance for the recognition of the dental visual pattern [5]. Thus, the literature review carried out by Silva et al. [4] revealed that there is still a need for an adequate method of segmenting dental radiographic images that can be used as a basis for the construction of specialized systems to aid in dental diagnosis.
With advances in artificial intelligence (AI), such as machine learning and deep learning, computer-aided diagnostic systems have been widely used in various medical areas, such as automated image-based diagnosis to detect lung and brain lesions [6,7,8], breast cancer in mammography images [9], segmentation of brain lesions [10] and segmentation of pulmonary nodules of various densities [11], among others. In dentistry, these techniques have also been applied in various segments. For example, the authors [12] used a convolutional neural network (CNN) to diagnose dental caries in premolars, molars or both, using periapical radiographs. In [13], a CNN was used to detect apical lesions in panoramic-rays. In [14], deep learning was used to segment the mandibular canal using computed tomography volumes. While in [15], segmentation of teeth in panoramic radiographs was performed. Although the results of previous research on AI have been extremely promising, the studies are still preliminary.
Starting from the idea that AI can aid dentists in identifying and segmenting teeth faster with the possibility of minimizing errors associated with human fatigue [3], this study aims to perform a comparison of segmentation of computational vision models and investigate their performance in segmenting panoramic radiograph images.
This paper is divided into five sections. After the introduction (Section 1), Section 2 provides an overview of related work in the field of segmentation in panoramic radiograph images. Section 3 describes the materials and methods of the work, such as the dataset used, the proposed models, applied loss function and evaluation metrics. Section 4 describes the experiments and presents the results and discussion. Finally, in Section 5, conclusions and presentation of future work are provided.

2. Related Works

There are some works that already use panoramic radiograph image segmentation. The authors in [1] propose a fully automatic approach using a statistical model together with a deep learning model. The deep learning model generates a mask of the tooth area and the statistical model segments and labels the 28 teeth. The proposed model was evaluated in 14 test images with average accuracy and recall of 79.0% and 82.7%, respectively, and Dice of 74.4%. The authors in [16] proposed a region-based convolutional neural network (R-CNN) to detect and locate dental structures using 846 dental notes from 30 panoramic radiographs for training and 20 radiographs for validation and testing. The results obtained were 85.8% accuracy and 89.3% recall and an average intersection-over-union (IoU) of 87.7%.
De Angelis et al. [17] proposed a machine learning to analyze 120 panoramic radiographs selected from the Department of Oral and Maxillofacial Sciences of the Sapienza University of Rome, Italy. The analyses performed resulted in an overall sensitivity of 0.89 and an overall specificity of 0.98. The downside of the work is that it does not detail the configuration of the machine learning model.
Silva and Oliveira [4] conducted a literature review on segmentation methods applied in dental images. In the study, they noticed a gap in the panoramic radiograph images and, to fill this gap, the authors presented a new dataset containing 1500 panoramic radiograph images with great variability and proposed a deep learning model to segment images in this set of images. The initial results obtained were 84% precision, 76% recall and 92% accuracy. Subsequently, using this same database, the authors in [15] proposed the TSASNet (two-stage attention segmentation network) which is divided into two stages. The first stage contains an attention network, which can be global and/or local, to obtain preliminary information on the radiograph and, in the second stage, in fact, a segmentation network. This method was evaluated and reached 96.94% accuracy, 94.97% precision, 93.77% recall and 92.72% Dice. The authors in [18] proposed a fully convolutional neural network (FCN) model based on the U-Net architecture to improve segmentation performance. The final result was 93.4%, 93.5% and 93.7% of Dice, precision and recall, respectively. Other models using ensemble strategies were proposed, in which the best model obtained results of 93.6%, 93.3% and 94.3% of Dice, precision and recall, respectively.
This work is very similar to the works of [15,18], but it uses other segmentation models that are gaining prominence in the literature with other medical segmentation datasets [19,20,21,22].

3. Materials and Methods

3.1. Dataset

In this work, we used a dataset created by Silva and Oliveira [4] and made publicly available. This dataset is the largest freely available dataset for research and contains 1500 panoramic radiograph images divided into 10 categories. The images were acquired at the Imaging Diagnostic Center of the Universidade Estadual do Sudoeste da Bahia (UESB) using an X-ray camera model ORTHOPHOS XG 5/XG 5 DS/Ceph, manufactured by Sirona Dental Systems GmbH (please see [4] for more details such as: focus-sensor distance, scale of images, widescreen sensor resolution). The teeth mask was defined globally in each buccal image, rather than per tooth. The images were classified according to the variety of structural features of the teeth. This information is shown in detail in Table 1. We selected 80% of the images for the training set, 10% for the validation set and 10% for the test set.
Images have been resized from 1127 px height by 1991 px width (originally) to 256 px height by 256 px width. We used the panoramic radiograph images in RGB colors, that is, with three color channels, and the masks only in gray scale, that is, one color channel. Before passing the data to the models, we normalized each pixel that initially ranged from 0 to 255 to 0 to 1.

3.2. Data Augmentation

This work applied data augmentation in the training set to increase data diversity and test whether the models present a good generalization. For the data augmentation, two techniques were used: random rotation and horizontal inversion. With this, the training dataset has increased from 1200 to 3600 images. The validation and test set did not change.

3.3. Segmentation Models

3.3.1. U-Net

U-Net is a semantic segmentation model that uses convolutional layers and was proposed by Ronnerberger et al. [19]. The architecture of this network is symmetrical and consists of an encoder path (encoding) and a decoder path (decoding). The encoder follows the typical architecture of a convolutional network, which is used to extract features from images. The encoder consists of four convolution blocks. The decoder is used to build the segmentation map based on the encoder’s features. Since this architecture is symmetrical, as stated earlier, the decoder is also formed by four blocks. At the end, a convolution operation is performed to generate the final segmentation. With this, the U-Net reaches the end with 23 convolutional layers, as shown in Figure 1. For more details on the model and the convolution blocks in the encoder and decoder, please see [19].

3.3.2. DCU-Net

The DCU-Net (Dual-Channel U-Net) is a model that is proposed by Lou et al. [20], which is based on the U-Net architecture and MultiResUnet architecture (MultiResUnet is another proposed model that is also described in the paper by [20]). Based on the comparisons made between U-Net and MultiResUnet, authors noted that MultiResUnet obtained better outputs than the U-Net model, but in some cases, MultiResUnet may not work well in relation to feature extraction. With this, the author developed a new architecture, DC-Unet, in which a two-channel block is used (Dual-Channel block) with formations used in U-Net and MultiResUnet.
The U-Net is represented by the DC blocks, where each block contains 3 convolutional layers and the MultiResUnet is represented by the ResPath. Each ResPath also contains a block of convolutional, being ResPath 1 with 8 convolutional layers, ResPath 2 with 6 convolutional layers, Respath 3 with 4 convolutional layers and finally ResPath 4 with 2 convolutional layers (see Figure 2). For more details on the model, please see [20].

3.3.3. DoubleU-NET

The DoubleU-Net model was proposed in the paper by [21] and was validated using four medical image segmentation databases. The proposed architecture of DoubleU-Net [21] (Figure 3) consists of two large networks.
The first network (NETWORK 1) starts with a VGG-19 as an encoder, which passes through an Atrous Spatial Pyramid Pooling (ASPP), which aims to capture contextual information within the network and is followed by four decoder blocks to reach the output of the first network (output 1). Next, we multiply the input image by the output of NETWORK 1 (output 1), which acts as input for the second model. The second model consists of four encoder blocks, which passes to the ASPP and follows on to the four decoder blocks that generate the output of the second network (output 2). For more details on the model, see the paper by [21].

3.3.4. Nano-NET

The Nano-Net model was proposed in the paper by [22], and its objective is to perform accurate segmentation in real time. As a result, Nano-Net uses the encoder-decoder model (see Figure 4), but in the encoder a pre-trained model is used so that the convergence of the model is faster. The pre-trained model used in Nano-Net was MobileNetV2 [23]. The decoder, in turn, is formed by three blocks. In the paper by [22], three configurations of Nano-Net are proposed (Nano-Net-A, Nano-Net-B and Nano-Net-C); the difference between the models is the number of feature channels used, where A is 32, 64 and 128; B is 32, 64 and 96; and C is 16, 24 and 32. In the present paper, Nano-Net-A was used because it was the model that obtained the best results. For more details about Nano-Net, see the paper by [22].

3.4. Loss Function

The loss function used in the segmentation models of this paper was a weighted equation, which is described as follows:
L = λ 1 L C E + λ 2 L I o U
where the L C E is the cross entropy (CE) function multiplied by weight λ 1 and the L I o U is a loss function as proposed by [24], which calculates the intersection-over-union (IoU) region multiplied by λ 2 . λ 1 and λ 2 are 0.4 and 0.6, respectively. The calculation of L I o U is shown below:
L I o U = | P G | | P G |
in which P represents the predicted area and G represents the actual area (ground truth).

3.5. Evaluation Criterion

In the field of medical image segmentation, the Dice coefficient [25] is widely used to evaluate segmentation models and is defined as follows:
d i c e = 2 | P G | | P | + | G |
in which P is the predicted area and G is the real area (ground truth). The value of the Dice coefficient varies between 0 and 1, in which 0 is the lowest possible accuracy and 1 the highest possible accuracy.
Segmentation models can also be evaluated pixel by pixel, and for this type of evaluation, the following metrics can be used:
accuracy = T P + T N T P + T N + F P + F N
precision = T P T P + F P
recall = T P T P + F N
in which:
  • TP: are the amount of pixels correctly predicted from the tooth area;
  • TN: are the amount of pixels correctly predicted from the background area;
  • FP: are the amount of incorrectly predicted pixels of the tooth area;
  • FN: are the amount of pixels incorrectly predicted from the background area.
Finally, we add the amount of trainable parameters (param) in the segmentation model for comparison between the models.

4. Experimental Results and Discussion

4.1. Comparison Setting

The results are divided into three subsections: segmentation models using a dataset with data augmentation (Section 4.2), segmentation models using a dataset without data augmentation (Section 4.3) and the third step of comparing the models with the state of the art (Section 4.4).
In the training settings of the models, the ADAM optimizer with the learning rate of 0.0001 was used, and the loss function is described in Section 3.4. The models were trained with 30 epochs. Only Nano-Net was trained with 50 because it is a model that uses a pre-trained layer. The training process was faster and its convergence used 50 epochs on average. The other models used 30 epochs based on empirical tests, see Table 2. The batch size was different for datasets, with data augmentation and without data augmentation. Models trained with a dataset without data augmentation used a batch size of 4. The models trained with the dataset that includes the data augmentation had the following sizes: 32 for the U-Net and Nano-Net, 16 for the DoubleU-Net and 10 for the DCU-Net. The batch size for the U-Net and Nano-Net were not affected but the DoubleU-Net and DCU-Net had their batch size reduced due to limitations of the training machine.
All models were trained and tested using the Google Collaboratory platform. This platform provided a machine with an nVidia195Tesla P100 video card and 27.3 GB of RAM.

4.2. Results Using Data Augmentation

The results of the four metrics (Dice, accuracy, precision and recall) for the models trained with the dataset containing the data augmentation can be seen in Table 3.
The Dice metric obtained 92.886% with the DoubleU-Net model, followed by DCU-Net, U-Net and, finally, Nano-Net with 89.855%. For accuracy and recall, the order remained the same, with DoubleU-Net with 96.591% and 92.705%, respectively. Nano-Net was 95.576% and 84.222%. For precision, the Nano-Net Model obtained 96.326%, followed by DCU-NET, U-NET and DoubleU-Net with 93.095%.
DoubleU-net performed better in three of the four metrics analyzed, falling behind Nano-Net only in the precision metric, 3% less. Nano-Net obtained the worst recall result, well behind the other models, and reached an 8% difference compared to DoubleU-Net. Analyzing the number of parameters trained by the model, Nano-Net used 235,000 while U-Net reached 31 million parameters.
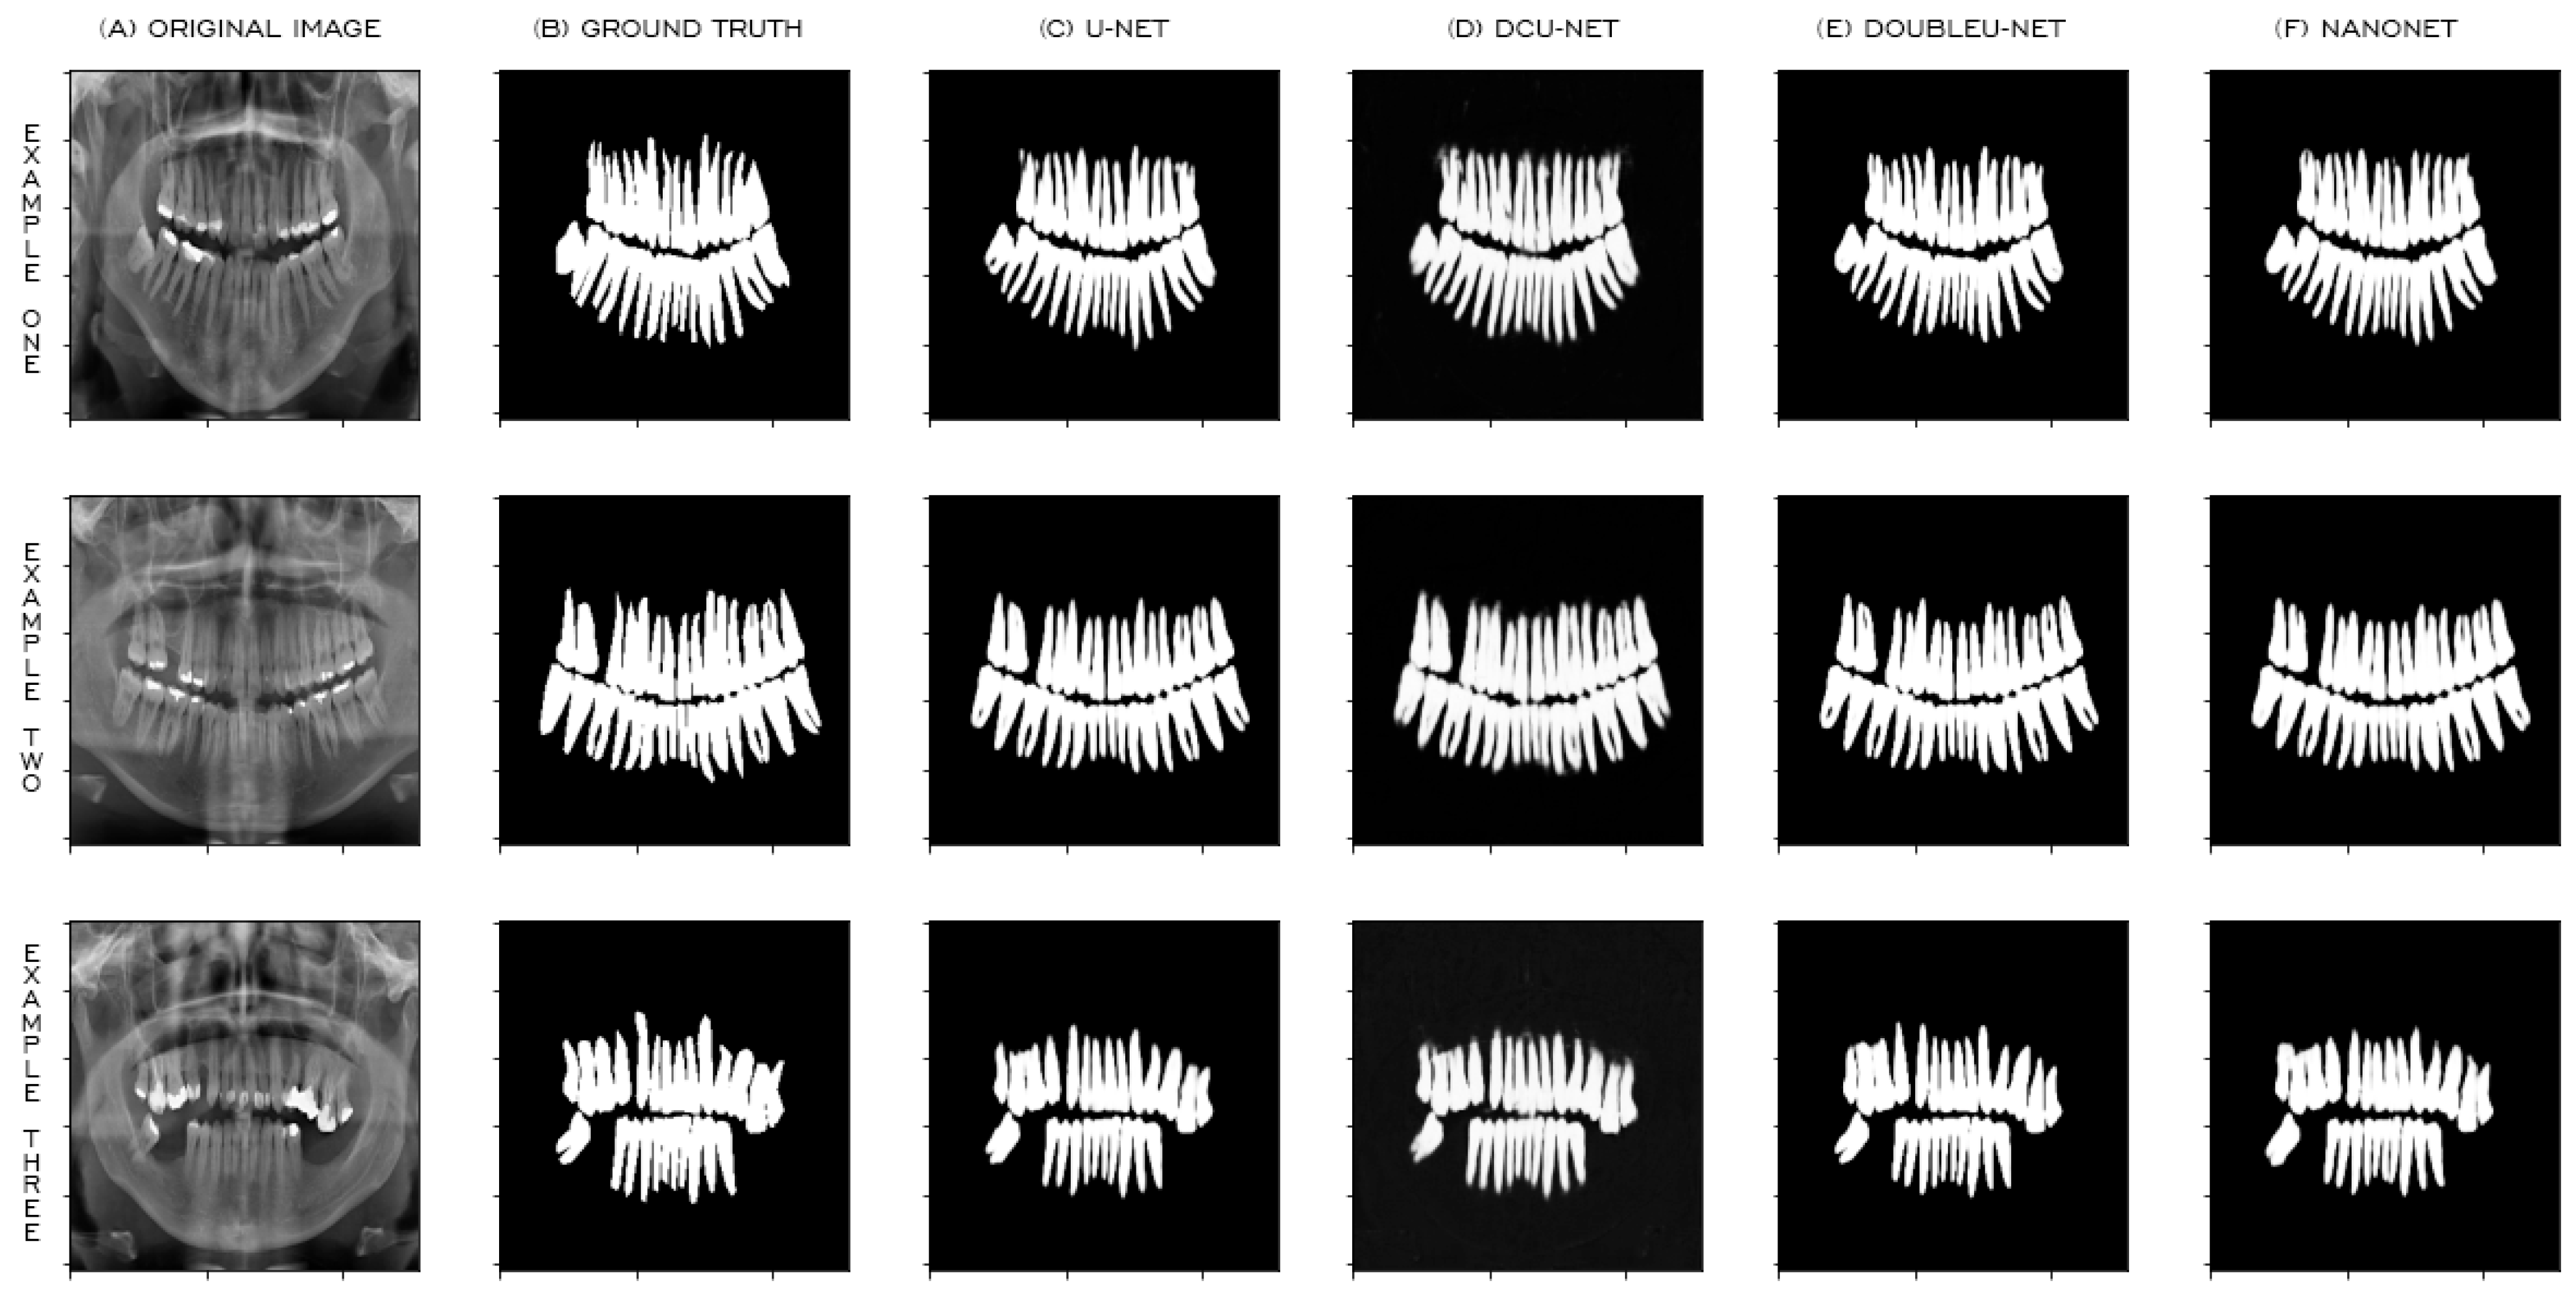
Figure 5 shows three examples of images tested by the four models, comparing them with the original image and the ground truth.
In general, the models presented outputs that were very close to ground truth, though with a few observations for some models. The DCU-Net model was the one that presented more failures in its outputs, as can be seen more easily in Example 1 and Example 3. The U-Net model was the model that presented some flaws in detail, especially in the roots of the teeth. As shown in Examples 1 and 3, the circled areas have root detection failures. The DoubleU-Net and Nano-Net models were the ones that presented the best details in the roots.

4.3. Results without Using Data Augmentation

The results of the four metrics (Dice, accuracy, precision and recall) for models trained with the dataset without data augmentation can be seen in Table 4.
The DoubleU-Net model obtained 92.695% of Dice followed by Nano-Net, U-Net and, finally, the DCU-Net with 91.451%. This same order was seen for the recall metric, with 91.283% for DoubleU-Net and 87.846% for DCU-Net. Regarding accuracy, the order was changed to DoubleU-net, Nano-Net, DCU-Net and U-Net. With regard to precision, DCU-Net presented the best result with 95.390%, followed by U-NET, DoubleU-Net and Nano-Net with 93.783%.
DoubleU-Net continues to show great prominence, as it also obtained the best results in three of the four metrics analyzed in this experiment. However, another model that stood out was Nano-Net, which for training without data augmentation presented results close to DoubleU-Net with fewer trainable parameters.
Figure 6 shows the same three examples of images tested in the previous experiment (with data augmentation) with the outputs of the models that were trained without data augmentation.
The conclusions are the same as the experiment with data augmentation, but with some negative points for the DCU-Net Model. The U-Net showed some flaws in the details of the roots, the Nano-Net also showed some flaws and the DoubleU-Net was the model with more satisfactory performance.
It was observed that the models had more difficulties in detailing the roots, with the exception of the Double-UNet, which better managed this task. In Figure 6B (example one), the roots present a little square and do not follow exactly the design of the root as we can see in the real image of the radiograph, Figure 6A (example one). The Double-UNet model was able to better draw the image and be closer to the real one, as shown in Figure 6E (example one).

4.4. Comparison with the State of the Art

From the results described above, we highlight the results of the DoubleU-Net and Nano-Net models, both for training using data augmentation, as well as for training without data augmentation. Thus, this section presents a comparison of these models with others from the literature [15,18]. Table 5 presents the results obtained by the models proposed by [15,18], using the same dataset tested in this work.
The U-Net* model proposed by [18] obtained the best Dice coefficient with 93.58%, followed by DoubleU-Net with data augmentation with 92.886%. TSASNet obtained the best accuracy, with 96.94%, while U-Net* [18] with 95.17% had the worst. Precision was a highlight of Nano-Net (True) with 96.326% but obtained the worst recall. For recall, the best result was U-Net* [18] with 93.91%, followed by 93.77% for TSASNet and 92.705% for DoubleU-Net (True).
Regarding the number of parameters, TSASNet requires more than 78 million trainable parameters, which shows how costly this architecture can be for training. DoubleU-Net managed to lower this number to 29 million and the greatest prominence is for Nano-Net, which uses 235,000. The number of parameters trained by the U-Net architecture* [18] was not presented, but by analyzing the work of [18], their proposal uses an ensemble of two U-Net models, in which each model corresponds to approximately 31 million parameters. Thus, their proposal is expected to be close to 62 million trainable parameters.
It is observed that U-Net* [18] has better results in two metrics, while TSASNet and Nano-Net (True) have better results in one. With the analysis, we see DoubleU-Net (True) has competitive results in almost all metrics and Nano-Net is competitive even with the number of trainable parameters being far below any other model.

5. Conclusions and Future Work

Panoramic radiographs can be a very effective tool to support patients’ diagnosis and to define a treatment plan to them. The use of segmentation models to detect teeth and their exact limits can be of paramount importance for eliminating a task that is quite susceptible to human failure. In this work, we analyzed four models that are being used in the literature for other purposes in order to investigate their performance for classifying a panoramic radiograph database.
The results obtained in this work are satisfactory and present paths for a better and more effective dental segmentation process. All four models tested had good results. Originally, these models were proposed with another purpose and when adapting them for dental segmentation in panoramic radiographs, they presented good performance in the face of the evaluated metrics. However, two models deserve to be highlighted. DoubleU-Net presented a very competitive performance, with results very close and even better than those in the literature while using a high number of parameters trained, going from 78 M (TSASNet) to 29 M (DoubleU-Net). On the other hand, the Nano-Net used only 235k trained parameters (which represents less than 1% of the TSASNet), and was able to obtain promising results in terms of accuracy, precision, recall and Dice, thus showing that it is a model that can be explored for better results.
A limitation of this work is in relation to the database used. As described in Section 3.1, all images were recorded by the same machine, so the deep learning models can have this performance only for the parameters used by that given machine.
As the next steps of this research, it is planned to further evaluate the learning process of DoubleU-Net and Nano-Net to mold the creation of a new segmentation model that can better detail and evaluate dental panoramic radiograph images. Another way is to perform an analysis of the images generated as the output of each model in order to propose an improvement in ground truth. When analyzing the database used, it is noticed that some dental roots are square rather than more rounded. This can be a characteristic of human fatigue, since we are dealing with a dataset that is too large for the area. Another step of this research is to look for datasets that contain more variable data, obtained from different machines with different parameters for a greater generalization of the trained models.

Author Contributions

Conceptualization, E.d.S.R. and P.T.E.; Data curation, E.d.S.R. and P.T.E.; Formal analysis, E.d.S.R. and P.T.E.; Funding acquisition, P.T.E.; Investigation, E.d.S.R. and P.T.E.; Methodology, E.d.S.R. and P.T.E.; Resources, P.T.E.; Software, E.d.S.R.; Supervision, P.T.E.; Validation, E.d.S.R. and P.T.E.; Visualization, P.T.E.; Writing—original draft, E.d.S.R. and P.T.E.; Writing—review & editing, E.d.S.R. and P.T.E. All authors have read and agreed to the published version of the manuscript.

Funding

This research received no external funding.

Institutional Review Board Statement

Not applicable.

Informed Consent Statement

Not applicable.

Data Availability Statement

The data was provided by [4] and can be requested by form available at https://github.com/IvisionLab/dns-panoramic-images (accessed on 23 February 2022).

Acknowledgments

Authors would like to thank Conselho Nacional de Desenvolvimento Científico e Tecnológico (CNPq); Coordenação de Aperfeiçoamento de Pessoal de Nível Superior (CAPES); Fundação de Amparo a Ciência e Tecnologia do Estado de Pernambuco (FACEPE); and Universidade de Pernambuco (UPE), an entity of the Government of the State of Pernambuco focused on the promotion of Teaching, Research and Extension.

Conflicts of Interest

The authors declare no conflict of interest.

References

  1. Wirtz, A.; Mirashi, S.G.; Wesarg, S. Automatic teeth segmentation in panoramic X-ray images using a coupled shape model in combination with a neural network. In Proceedings of the International Conference on Medical Image Computing and Computer-Assisted Intervention, Granada, Spain, 16–20 September 2018; pp. 712–719. [Google Scholar]
  2. Kim, J.; Lee, H.S.; Song, I.S.; Jung, K.H. DeNTNet: Deep Neural Transfer Network for the detection of periodontal bone loss using panoramic dental radiographs. Sci. Rep. 2019, 9, 17615. [Google Scholar] [CrossRef]
  3. Leite, A.F.; Van Gerven, A.; Willems, H.; Beznik, T.; Lahoud, P.; Gaêta-Araujo, H.; Vranckx, M.; Jacobs, R. Artificial intelligence-driven novel tool for tooth detection and segmentation on panoramic radiographs. Clin. Oral Investig. 2021, 25, 2257–2267. [Google Scholar] [CrossRef]
  4. Silva, G.; Oliveira, L.; Pithon, M. Automatic segmenting teeth in X-ray images: Trends, a novel data set, benchmarking and future perspectives. Expert Syst. Appl. 2018, 107, 15–31. [Google Scholar] [CrossRef] [Green Version]
  5. Barboza, E.B.; Marana, A.N.; Oliveira, D.T. Semiautomatic dental recognition using a graph-based segmentation algorithm and teeth shapes features. In Proceedings of the 2012 5th IAPR International Conference on Biometrics (ICB), New Delhi, India, 29 March–1 April 2012; pp. 348–353. [Google Scholar]
  6. Akkus, Z.; Galimzianova, A.; Hoogi, A.; Rubin, D.L.; Erickson, B.J. Deep learning for brain MRI segmentation: State of the art and future directions. J. Digit. Imaging 2017, 30, 449–459. [Google Scholar] [CrossRef] [PubMed] [Green Version]
  7. Song, Q.; Zhao, L.; Luo, X.; Dou, X. Using deep learning for classification of lung nodules on computed tomography images. J. Healthc. Eng. 2017, 2017, 8314740. [Google Scholar] [CrossRef] [PubMed] [Green Version]
  8. Wang, H.; Zhou, Z.; Li, Y.; Chen, Z.; Lu, P.; Wang, W.; Liu, W.; Yu, L. Comparison of machine learning methods for classifying mediastinal lymph node metastasis of non-small cell lung cancer from 18 F-FDG PET/CT images. EJNMMI Res. 2017, 7, 11. [Google Scholar] [CrossRef]
  9. Becker, A.S.; Marcon, M.; Ghafoor, S.; Wurnig, M.C.; Frauenfelder, T.; Boss, A. Deep learning in mammography: Diagnostic accuracy of a multipurpose image analysis software in the detection of breast cancer. Investig. Radiol. 2017, 52, 434–440. [Google Scholar] [CrossRef] [PubMed]
  10. Kamnitsas, K.; Ledig, C.; Newcombe, V.F.; Simpson, J.P.; Kane, A.D.; Menon, D.K.; Rueckert, D.; Glocker, B. Efficient multi-scale 3D CNN with fully connected CRF for accurate brain lesion segmentation. Med. Image Anal. 2017, 36, 61–78. [Google Scholar] [CrossRef] [PubMed]
  11. Kubota, T.; Jerebko, A.K.; Dewan, M.; Salganicoff, M.; Krishnan, A. Segmentation of pulmonary nodules of various densities with morphological approaches and convexity models. Med. Image Anal. 2011, 15, 133–154. [Google Scholar] [CrossRef] [PubMed]
  12. Lee, J.H.; Kim, D.H.; Jeong, S.N.; Choi, S.H. Detection and diagnosis of dental caries using a deep learning-based convolutional neural network algorithm. J. Dent. 2018, 77, 106–111. [Google Scholar] [CrossRef] [PubMed]
  13. Ekert, T.; Krois, J.; Meinhold, L.; Elhennawy, K.; Emara, R.; Golla, T.; Schwendicke, F. Deep learning for the radiographic detection of apical lesions. J. Endod. 2019, 45, 917–922. [Google Scholar] [CrossRef] [PubMed]
  14. Jaskari, J.; Sahlsten, J.; Järnstedt, J.; Mehtonen, H.; Karhu, K.; Sundqvist, O.; Hietanen, A.; Varjonen, V.; Mattila, V.; Kaski, K. Deep learning method for mandibular canal segmentation in dental cone beam computed tomography volumes. Sci. Rep. 2020, 10, 1–8. [Google Scholar] [CrossRef] [Green Version]
  15. Zhao, Y.; Li, P.; Gao, C.; Liu, Y.; Chen, Q.; Yang, F.; Meng, D. TSASNet: Tooth segmentation on dental panoramic X-ray images by Two-Stage Attention Segmentation Network. Knowl.-Based Syst. 2020, 206, 106338. [Google Scholar] [CrossRef]
  16. Lee, J.H.; Han, S.S.; Kim, Y.H.; Lee, C.; Kim, I. Application of a fully deep convolutional neural network to the automation of tooth segmentation on panoramic radiographs. Oral Surgery Oral Med. Oral Pathol. Oral Radiol. 2020, 129, 635–642. [Google Scholar] [CrossRef]
  17. De Angelis, F.; Pranno, N.; Franchina, A.; Di Carlo, S.; Brauner, E.; Ferri, A.; Pellegrino, G.; Grecchi, E.; Goker, F.; Stefanelli, L.V. Artificial Intelligence: A New Diagnostic Software in Dentistry: A Preliminary Performance Diagnostic Study. Int. J. Environ. Res. Public Health 2022, 19, 1728. [Google Scholar] [CrossRef]
  18. Koch, T.L.; Perslev, M.; Igel, C.; Brandt, S.S. Accurate segmentation of dental panoramic radiographs with U-Nets. In Proceedings of the 2019 IEEE 16th International Symposium on Biomedical Imaging (ISBI 2019), Venice, Italy, 8–11 April 2019; pp. 15–19. [Google Scholar]
  19. Ronneberger, O.; Fischer, P.; Brox, T. U-net: Convolutional networks for biomedical image segmentation. In Proceedings of the International Conference on Medical Image Computing and Computer-Assisted Intervention, Munich, Germany, 5–9 October 2015; pp. 234–241. [Google Scholar]
  20. Lou, A.; Guan, S.; Loew, M.H. DC-UNet: Rethinking the U-Net architecture with dual channel efficient CNN for medical image segmentation. In Medical Imaging 2021: Image Processing; International Society for Optics and Photonics: Bellingham, WA, USA, 2021; Volume 11596, p. 115962T. [Google Scholar]
  21. Jha, D.; Riegler, M.A.; Johansen, D.; Halvorsen, P.; Johansen, H.D. Doubleu-net: A deep convolutional neural network for medical image segmentation. In Proceedings of the 2020 IEEE 33rd International Symposium on Computer-Based Medical Systems (CBMS), Rochester, MN, USA, 28–30 July 2020; pp. 558–564. [Google Scholar]
  22. Jha, D.; Tomar, N.K.; Ali, S.; Riegler, M.A.; Johansen, H.D.; Johansen, D.; de Lange, T.; Halvorsen, P. NanoNet: Real-Time Polyp Segmentation in Video Capsule Endoscopy and Colonoscopy. arXiv 2021, arXiv:2104.11138. [Google Scholar]
  23. Sandler, M.; Howard, A.; Zhu, M.; Zhmoginov, A.; Chen, L.C. Mobilenetv2: Inverted residuals and linear bottlenecks. In Proceedings of the IEEE Conference on Computer Vision and Pattern Recognition, Hangzhou, China, 26–28 August 2018; pp. 4510–4520. [Google Scholar]
  24. Yu, J.; Jiang, Y.; Wang, Z.; Cao, Z.; Huang, T. Unitbox: An advanced object detection network. In Proceedings of the 24th ACM International Conference on Multimedia, Amsterdam, The Netherlands, 15–19 October 2016; pp. 516–520. [Google Scholar]
  25. Milletari, F.; Navab, N.; Ahmadi, S.A. V-net: Fully convolutional neural networks for volumetric medical image segmentation. In Proceedings of the 2016 Fourth International Conference on 3D Vision (3DV), Stanford, CA, USA, 25–28 October 2016; pp. 565–571. [Google Scholar]
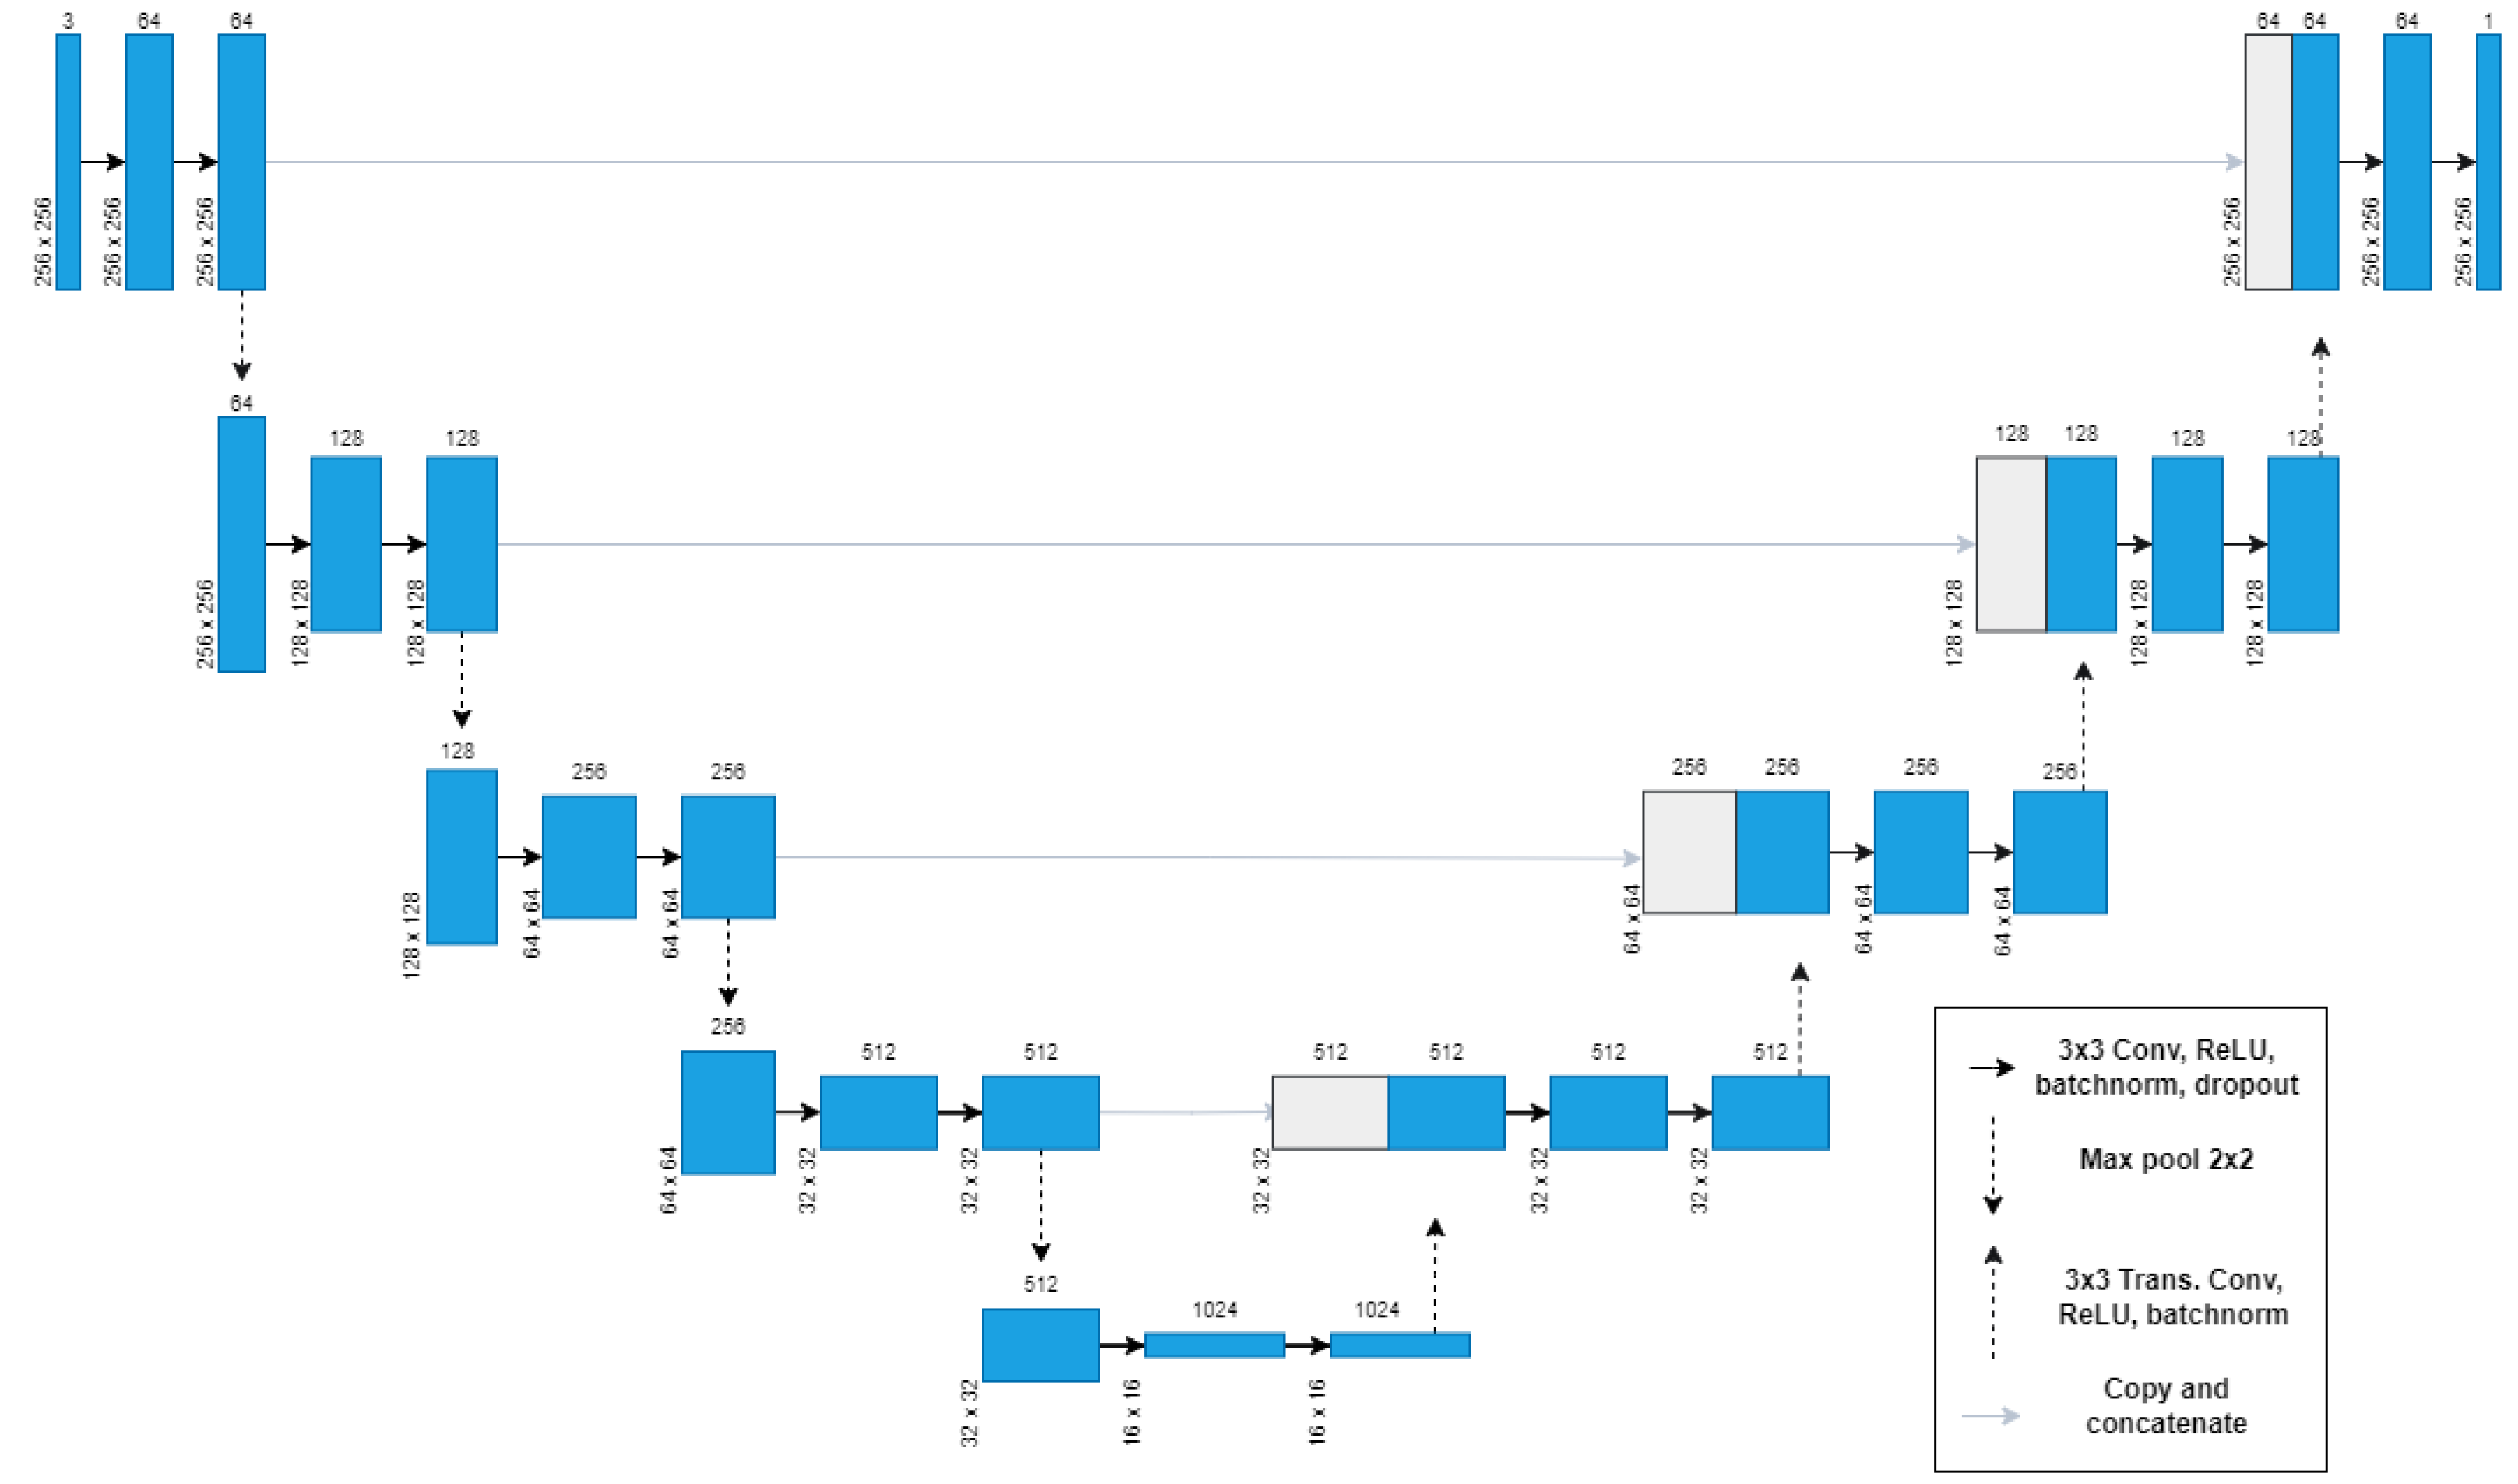
Figure 1. U-Net architecture (adapted from [19]).
Applsci 12 03103 g001
Figure 2. DCU-Net architecture (adapted from [20]).
Applsci 12 03103 g002
Figure 3. DoubleU-Net architecture (adapted from [21]).
Applsci 12 03103 g003
Figure 4. NanoNet architecture (adapted from [22]).
Applsci 12 03103 g004
Figure 5. Example of three panoramic radiograph images tested by segmentation models with data augmentation.
Applsci 12 03103 g005
Figure 6. Example of three panoramic radiograph images tested by segmentation models without data augmentation.
Applsci 12 03103 g006
Table 1. Patient categories.
Category12345678910
32 teethYesYesYesYes+32-NoNoNoNo
FillingYesYesNoNo--YesYesNoNo
BracesYesNoYesNo--YesNoYesNo
Dental implantNoNoNoNoNoYesNoNoNoNo
Table 2. Model training settings.
ModelBatch_Size with Data AugmentationBatch_Size without Data AugmentationEpochs
U-Net32430
DCU-Net10430
DoubleU-Net16430
Nano-Net32450
Table 3. Result (in %) of segmentation models using data augmentation.
ModelDice (%)Accuracy (%)Precision (%)Recall (%)Parameter
U-Net91.03395.96695.34287.12231,031,745
DCU-Net91.61696.20896.10787.54710,069,928
DoubleU-NET92.88696.59193.09592.70529,264,930
Nano-Net89.85595.57696.32684.222235,425
Bold cells show the best result for that metric.
Table 4. Segmentation models without augmentation data.
ModelDice (%)Accuracy (%)Precision (%)Recall (%)Parameter
U-Net91.68196.19194.89888.70031,031,745
DCU-Net91.45196.12395.39087.84610,069,928
DoubleU-NET92.69596.55294.18491.28329,264,930
Nano-Net91.73996.17393.78389.815235,425
Bold cells show the best result for that metric.
Table 5. Comparison with literature models.
ModelDice (%)Accuracy (%)Precision (%)Recall (%)Parameter
TSASNET [15]92.7296.9494.9793.7778,270,000
U-NET (Ensemble) [18]93.5895.1793.6993.91-
DoubleU-NET w/data augmentation92.88696.59193.09592.70529,264,930
Nano-Net w/data augmentation89.85595.57696.32684.222235,425
DoubleU-NET wo/data augmentation92.69596.55294.18491.28329,264,930
Nano-Net wo/data augmentation91.73996.17393.78389.815235,425
Bold cells show the best result for that metric.
Publisher’s Note: MDPI stays neutral with regard to jurisdictional claims in published maps and institutional affiliations.