Abstract
Materials can be subjected to severe wear and corrosion due to high temperature, high pressure and mechanical loads when used in components for the production of geothermal power. In an effort to increase the lifetime of these components and thus decrease cost due to maintenance High-Entropy Alloy Coatings (HEACs) were developed with different coating techniques for anti-wear properties. The microstructure, mechanical and tribological properties of CoCrFeNiMox (at% x = 20, 27) HEACs deposited by three different technologies—high-velocity oxygen fuel (HVOF), laser cladding (LC) and electro-spark deposition (ESD)—are presented in this study. The relationship between surface morphology and microstructural properties of the as-deposited coatings and their friction and wear behavior is assessed to evaluate their candidacy as coatings for the geothermal environment. The wear rates were lower for the HVOF coatings compared to LC and ESD-produced coatings. Similarly, a higher hardness (445 ± 51 HV) was observed for the HVOF HEACs. The mixed FCC, BCC structure and the extent of σ + µ nano precipitates are considered responsible for the increased hardness and improved tribological performance of the HEACs. The findings from the study are valuable for the development of wear-resistant HEAC for geothermal energy industry applications where high wear is encountered.
1. Introduction
In past developments, wear resistance has been linked to the intrinsic hardness directly related to a raw material property (e.g., diamond, cubic boron nitride). Subsequently, extrinsic hard coatings from a combination of elements, phases, structures, gradient layer and multilayers have been evolved through the implementation of binary, ternary and quaternary alloying [1]. Mainly nitrides, carbides, carbon-based oxide and the borides of a single base element or metal are the materials used in coating technologies.
New possibilities have arisen recently for developing multi-principal element coatings based on bulk materials known as high entropy alloys (HEAs) and compositional complex alloys (CCAs) [2,3,4,5,6] which have shown to achieve high hardness by at least quinary-based alloys. Recently, differences have been made between high-entropy single-phase alloys and compositionally complex multi-phase alloys (CCAs), both of which meet the defined requirements for high-entropy alloys containing at least 5% to 35% of the near-or-equiatomic elemental concentration blends. Several classes of CCAs have been proposed over the years including CCAs with a large number of components in equal or near-equal proportions dependent on their alloying method, the constituent species, the manufacturing process and the micro-and-phase structures that arise [2,3,4,5,6]. The synthesis of these CCAs has the propensity to form definite solid solution matrices, whereas nano-sized dispersed particles or intermetallic compounds have also been shown to improve mechanical properties. However, such intermediate phases reported in the literature [5,6,7,8] had structures of intermetallic compounds such as B2, L12, sigma and laves phases, in some cases leading to performance issues [6,9] such as the decrease in corrosion resistance in corrosive environments [9].
Currently reported HEAs and CCAs include those based on 3D transition metals and those based on refractory elements (Co, Cr, Cu, Fe, Mn, Ni, Ti, W, Zr, Nb, Ta and V) [5]. Due to the extreme melting temperature (>1000 °C) of these elements and consolidation capabilities, research and development have introduced a relatively short list of HEA/CCA thin films or coating layers on substrates while extensive research has been dedicated and reported on developing bulk HEAs and CCAs. The majority of related research focused on mechanical properties, deformation and strengthening mechanisms derived from crystallized phases, grain refinement, lattice distortion, precipitation and solution hardening [8,10,11,12,13]. A review of high entropy bulk alloy, HEA films and HEA coatings (HEACs) [14,15,16,17] revealed that the fabrication is identical to conventional coating techniques. The authors emphasized this growing field via deposition techniques such as vapor deposition (e.g., vacuum arc, sputtering), laser-based methods (e.g., laser cladding (LC)), cold/plasma/thermal spraying (e.g., high-velocity oxygen fuel (HVOF)) and electro-spark deposition (ESD). The functionality of the produced coatings depends on the microstructure, adhesion, thickness, ductility, hardness, oxide levels and stress state developed from the fabrication techniques mentioned above. Thus, microstructural, chemical compositional, mechanical and tribological analyses of novel HEACs from different fabrication processes are important for exploring their potential usage in intended engineering and structural applications, for example, as durable and cost-effective solutions for components in geothermal power production, where corrosion, erosion and wear are experienced due to mechanical loads and the corrosive nature of geothermal fluid [18].
A widely researched equiatomic HEA alloy is the single-phase-Co20Cr20Fe20Ni20Mn20 alloy with excellent fracture toughness and ductility but low yield strength [10] reported by Cantor and his team [11]. Meanwhile, several related variants of the Cantor alloy compositions have been developed, including non-equimolar and multi-phase derivatives. Research by Miao et al. [12] in optimizing such alloys’ mechanical properties found that the plasticity was attributed to the inherent FCC slip system of all the series of CoCrFeNi quaternary, CrCoNi ternary and other binary sub-unit alloys. Per such explorations and the simplest design of HEAs, the highly soluble–ductile CoCrFeNi alloy is retained as a quaternary stem (QS) [19,20,21] and further exploited for their mechanical/tribological properties (influenced by a balance in strength and ductility). An atomic size ratio (ASR) study of the QS + X alloys by Tsai et al. [19] concluded that X is replaceable or added on by similar-sized elements. As such, group 3B to 4B elements have contributed to the secondary-phase strengthening of HEAs and hence coating performance [13,14,15,16,17,18,19].
Xiao et al. [21] studied the tribological properties of plasma-sprayed CoCrFeNi alloy against WC-Co ball in dry sliding conditions. The as-sprayed and annealed HEAC demonstrated good wear resistance, which doubled with optimized process parameters. Similarly, Cui et al. [22] added fractions of Al to the cantor alloy and evaluated the wear resistance against 4Cr5MoSiV die steels. The HEAC with Al fraction at 0.75 demonstrated the existence of two dual phases (FCC+BCC), yielding the least worn volume at room temperature. Lin et al. [23] also reported improved properties, i.e., increasing hardness for as-cast and aged Al0.5CoCrFeNi due to the FCC to BCC matrix transition formation of segregated Al-Ni phases. Lin and other researchers [7,24] deduced Al as a BCC former. The BCC structures’ appearance with increased elemental concentration and associated lattice distortion confirmed the hypothesis. Zhang et al. [25] affirmed an excellent compromise between strength and ductility for the Ti-Alx rich + QS alloy, contrary to the non-ductile failure captured for the alloy with no Al. Wu et al. [26] reported a low wear coefficient with increasing Al-rich phases in AlxCu + QS in a Cu segregated microstructure. In a study to control the segregation, Ni et al. [15] fixed at% Cu and at% Al in AlxCux + QS deposited laser clad on aluminum alloy. This rendered the alloy a micro-hardness of 750 HV, eight times that of the substrate. Therefore, aside from segregation, the matching counter surface undergoes severe wear if softer, detrimental to practical applications. Zhang et al. [16] investigated the addition of Si instead of Cu to the AlxCux + QS alloy deposited by laser cladding. The deposit avoided abrasive wear, although a decrease in hardness was observed to 630.4 HV with Si segregation, while surface oxidation promoted strong wear resistance.
Other researchers have pursued the effect of Mo on the microstructure of the QS. Due to the QS’s known properties, other authors achieved self-lubricating and wear resistive coatings in the presence of Mo, MoS2 and graphite powders for tribological applications. Zhang et al. [20] spark plasma sprayed (SPSed) a well dispersed, densified, anti-wear and self-lubricating composite from room temperature to 800 °C of a QS matrix. The wear resistance increased because the composite’s yield strength almost doubled by adding the nickel-coated-MoS2 and graphite. CoCrFeNiMo bulk material fabricated by Cui et al. [27] showed a reduction in friction coefficient from 0.61 to 0.15 by treating with ion sulfurization with a similar trend for the wear coefficient. Liu et al. [6] found hard intermetallic phase precipitation and subsequent strengthening with no observed embrittlement by the secondary phases, even with the minor addition of Mo (at x = 0 to 0.3). However, Deng et al. [28] spark plasma sintered (SPS) QS + Mo0.2 and Mu et al. [29] arc plasma sprayed (APS) QS + Mo coatings and both reported worn surfaces dominated with combined abrasive and adhesive wear under dry sliding wear conditions. Shun et al. [14] further increased the Mo fraction to 0.85, which showed the hard phases formed improved the mechanical properties. Fanicchia et al. [30] found that the QS + Mo0.85 coating deposited with HVOF with FCC and BCC mixed phases had good corrosion resistance in electrochemical tests at room temperature. Improved wear resistance is critical for extending the life of materials used industrial plant components, such as in geothermal power plants, which must withstand high mechanical loads and corrosiveness of such aggressive environments. The development and testing of HEACs with high hardness, wear, corrosion and erosion resistance could be a solution for industrial application. While there is a clear potential for Mo addition to the QS, information on tribological properties is scarce particularly for HEAC coatings; thus, further evaluation of the microstructure and tribological properties of QS-based HEAC coatings in connection to possible fabrication techniques is needed.
The present work investigates starting compositions of two QS + Mo powders, i.e., CoCrFeNiMox (at% x = 20, 27), each deposited by three different coating technologies—laser cladding (LC), high-velocity oxygen fuel (HVOF) and electro-spark deposition (ESD)—selected for application potential in the geothermal energy industry with prospects in improving service life of shafts, rotors and oscillating and sliding parts. The resulting morphology, microstructure is investigated with scanning electron microscopy (SEM), energy-dispersive X-ray spectroscopy (EDX) and X-ray diffraction (XRD), and tribological properties with hardness and wear sliding tests. Compared to previous research, the tribological properties of QS + Mox are rarely reported, so further study is necessary to enhance their applicability beyond the research level. This work, therefore, allows the assessment of surface conditions and tribological properties of these alloys correlated to the microstructural characteristics obtained for each deposition technique.
2. Materials and Methods
2.1. Materials and Coating Processes
High purity, raw powders of Fe, Cr, Co, Ni and Mo were processed in a planetary ball mono-mill (Pulverisette 6® Fritch, Idar-Oberstein, Germany). Stainless steel vial and balls were used to avoid contamination in a 10:1 ball to powder weight ratio under Argon atmosphere. A wet milling process was selected, with 2% N-Heptane as the process control agent (PCA), increasing the alloying ratio and decreasing the powder’s adherent tendency to the balls and vial. From the overall batch of powder produced, −56 + 20 μm, −35 + 10 μm and −150 + 63 μm size distributions for the HVOF, ESD and LC process, respectively, were obtained by using mechanical alloying and composition of the materials employed in the work is reported in Table 1. The powders used for the ESD technique were consolidated by pressing and sintering in a step-by-step approach to achieve the best consolidation degree. Electrodes were then machined from the bulk material obtained from the pressing and sintering (P&S) of powders. Electro-spark deposition (ESD) equipment was used (SparkDepo® Model 300 Shizuoka, Japan) for the ESD depositions by employing a miniature applicator using the process parameters shown in Table 2. The HVOF deposition was conducted at the process parameters in Table 3 by using the (Tafa Model 5220 HP/HVOF®, Praxair Surface Technologies, Indianapolis, IN, USA) gun equipment. A 5.3 kW disc laser system (Trudisk 8002 Trumpf®, Ditzingen, Germany) equipped with a TruControl 1000 controller and Trumpf BEO D70 processing optics with motor collimation was used to prepare the LC coatings. The process parameters used for the depositions are summarized in Table 4. The parameters were optimized in the design phase of the research project to minimize defects such as pores and micro-cracks in the coatings which were then tested in this study. The 304 stainless steel (SS) substrates were cut into 30 mm disc with 5 mm thickness and prepared by grit finishing to a 60 size and degreasing with acetone before deposition.

Table 1.
Summary table of the powder composition, properties and techniques used for the different deposition techniques.
Table 2.
Electro-spark deposition (ESD) process parameters employed to deposit high entropy alloy powders.
Table 3.
High-velocity oxygen fuel (HVOF) process parameters employed to deposit the high entropy alloys powders.
Table 4.
Laser Cladding (LC) process parameters employed to deposit the high entropy alloys powders.
2.2. Surface Morphology and Microstructural Analysis
Microstructural and chemical analysis was carried out with a field emission-scanning electron microscope (FE-SEM, Zeiss Supra 25® Oberkochen, Germany), fitted with an Energy Dispersive X-ray Spectroscopy Detector (EDX, Oxford Instruments®, Oxford, UK). The X-ray Diffraction (XRD) measured the phase composition on a diffractometer (Empyrean, Panalytical® Malvern, UK) with Cu Kα radiation (λ = 1.54056 Å), 45 kV, 40 mA in the 2θ range of 20–100 degree. A non-contact optical profilometer (NC-OP) (Solarius® California, USA) coupled with the Mountains® software-generated 2D and 3D topographic profiles to investigate the average roughness Ra and other morphological surface features of the HEACs.
2.3. Hardness Test
The hardness of the HEACs was obtained from seven different locations in the cross-section with Vickers micro-hardness tester (VH1202 Wilson®, Esslingen, Germany) using 0.1 kg-f load.
2.4. Tribological: Friction and Wear Testing
The tribological wear tests of the as-sprayed coatings were conducted at ambient temperature with a ball-on-disc configuration using a tribometer (TRB3, Anton Paar® Graz, Austria). The set-up, procedures [31] and measurements followed the ASTM G99 standard [32]. The test involved unidirectional dry sliding of the ball pressed against the 30 mm coated disc at an applied load of 5 N. Based on the Archard elastic model [33] (i.e., H0/H value should be high; H0 is the hardness of the abradant, and H is the hardness of the test sample) and the known properties of WC (tungsten carbide) coatings on bearings, seals and turbine blades [34], WC balls were considered as a counter body to the sprayed coatings to produce an appreciable and reliable wear assessment in the laboratory accelerated-wear test. WC ball with 6 mm diameter and higher hardness of 1640 HV was used as a rubbing counterpart. The test duration and motor speed were kept constant at 3600 s and 200 rpm (linear speed: 10.47 cm/s), respectively. In practice, the steam turbines, e.g., geothermal turbines (with targeted units such as bearings, valve stem, shaft, rotor and blades) rotates at 1800–3600 rpm, which is clearly faster than the speeds selected for this work. Here, we simulate startup and shutdown conditions where frequently slower speed runs (100–600 rpm for 1 h) to troubleshoot before normal operational speeds are reached [35]. Furthermore, with no shaft/rotor imbalance, steam turbines run smoothly at inlet pressures ranging from 400 to 4000 kPa and vibration levels less than 2.54 mm/s [36].
The coefficient of friction (CoF) was monitored during rubbing without interruption. The data from the tribometer was processed with Anton Paar® Instrument X software version 8.1.5. The COF (µ) Equation (1) was used to calculate the dimensionless averages values of the stepwise and entire stable stages of the curve and the standard deviation (SD) was used to assess the degree of fluctuation during the tangential friction (Ft) acquisition process. The SD values obtained primarily explain the degree of fluctuation of COF (µ) and geometric contact changes during the test that could reflect the contact interface properties.
The wear rate, wsample (mm3/Nm), was evaluated according to Equation (2) by measuring the volume of the removed material, v (mm3), and using the applied load, Fn (N), and the distance covered during testing, L (m). After the wear test, cross-sectional profiles and images were extracted from the worn areas with optical profilometer (NC-OP) (Solarius® California, San Jose, CA, USA). The extracted profiles were from at least three representative locations on the wear tracks and final averages were used to determine the wear volume and calculate the wear rate (wsample). Each sample was subjected to three parallel tests, with the results reported as averages.
3. Results and Discussion
3.1. Surface Morphology, Microstructure and Chemical Composition
The microstructural images and chemical composition of the coatings resulting from the various deposition techniques are presented in Figure 1, Figure 2, Figure 3, Figure 4, Figure 5 and Figure 6. Figure 1, Figure 3 and Figure 5 show the top surface while Figure 2, Figure 4 and Figure 6 reveal cross section microstructural SEM images and corresponding EDX surface maps of the as-deposited HEACs. The micrographs of the as-sprayed coatings revealed a clear distinction in surface morphology for coatings deposited by different technologies. The surface morphology of the coatings consists of fully melted, semi-melted and un-melted particles. Surface defects observed were generally either or both pores and/or micro-cracks and are typical of such deposits. Dissimilarities between the same deposition technique for the different types of coating (i.e., HEA_Mo27 and HEA_Mo20) can be difficult to discern only by SEM/EDX analysis of the top surface; thus an XRD analysis was additionally performed as discussed in Section 3.2. From the high content of oxygen detected on all the surfaces, as can be seen from the EDX surface maps in Figure 1, Figure 3 and Figure 5, it can be concluded that particles underwent oxidation during the deposition for all deposition processes. While this is not surprising for the HVOF and ESD coatings deposited in air, the finding also applies to the LC coating where argon was used as shielding gas. The high content of oxygen found with the chemically stable elements (i.e., Ni, Cr, Mo, Fe) can be due to the active formation of surface protective films in contact with the atmosphere.
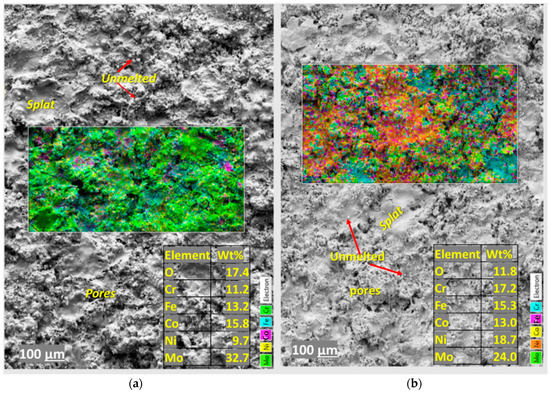
Figure 1.
Top surface morphologies, elemental concentration and surface maps of the as-sprayed (a) HVOF-HEA_Mo27, and (b) HVOF-HEA_Mo20 coatings.
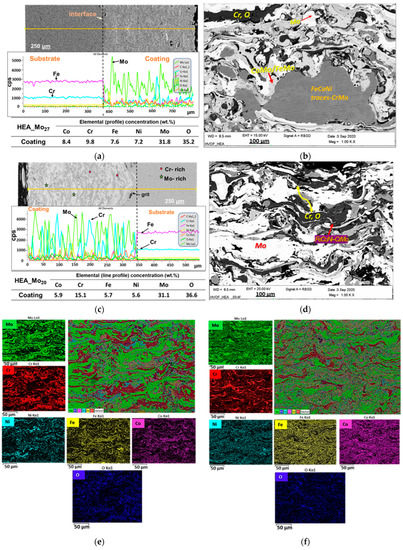
Figure 2.
SEM (a,c) and BSE micrographs (b,d) of the cross-sections of the as-sprayed HVOF-HEA_Mo27 (a,b,e) and HVOF-HEA_Mo20 coatings (c,d,f) and the corresponding EDX line scans (a,c) and maps (e,f).
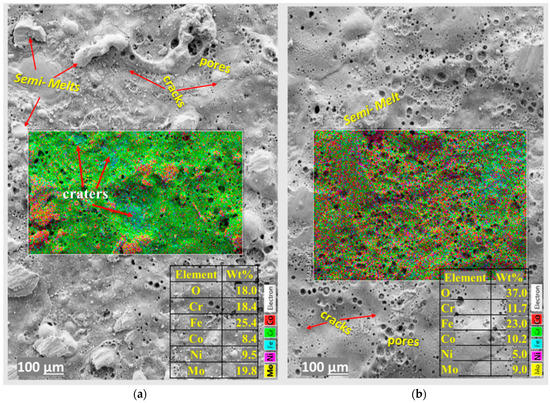
Figure 3.
Top surface morphologies, elemental concentration and surface maps of the as-sprayed (a) ESD-HEA_Mo27, (b) ESD-HEA_Mo20 coatings.
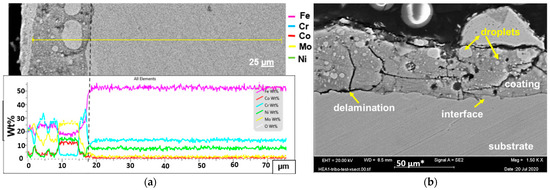
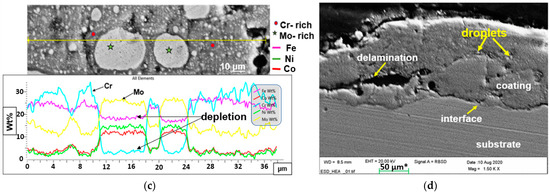
Figure 4.
SEM and BSE micrographs of the cross-section and EDX line scans, revealing of the as-sprayed (a,b) ESD-HEA_Mo27 and (c,d) ESD-HEA_Mo20 coatings.

Figure 5.
Top surface morphologies, elemental concentration and combined EDX surface map of the as-sprayed (a) LC-HEA_Mo27 and (b) LC-HEA_Mo20 coatings.
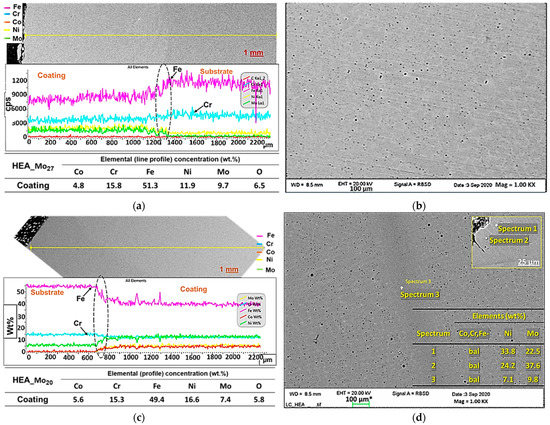
Figure 6.
SEM and BSE micrographs of the cross-sections, and EDX line scans, point and area analysis of the as-sprayed (a,b) LC-HEA_Mo27 and (c,d) LC-HEA_Mo20 coatings.
Apart from oxygen, the result from SEM/EDX reveals that all the precursor elements in the HEA powders (reported in Table 1) were present. However, the composition of the HEACs showed inconsistencies with the nominal (theoretical) powder composition, suggesting the activation of effects during the deposition process [37]. These phenomena can be linked to chemical-physical properties of the substrate and materials to be deposited and deposition technique-specific thermodynamic effects (such as convective motion and substrate/coating interdiffusion in laser metal deposition, etc.). The relevant substrate and coating material properties that are relevant in the final composition of the coating include melting temperatures, solubility, volatility and mixing enthalpy. Due to the mechanical alloying process of the powder production used for the HVOF and LC deposition techniques, fractions of single elements are likely to be still present in the powder prior to deposition for this alloy composition [27]. The melting points of Fe, Co, Ni, Cr and Mo elements at ambient pressure are 1538, 1495, 1455, 1907 and 2623 °C, respectively. For the coatings from the LC and ESD processes, less amount of the highest melting point element (Mo) was observed in the elemental maps of the surfaces compared to the powder starting composition. This could be because of the non-homogenous distribution of Mo and/or substrate melting and dilution, which both affect the composition in the melt pool [18,27]. Furthermore, each element was of 5% to 35% atomic concentration, which falls within the rigorous HEA definitions and satisfies the overall goal of exploring the central regions of complex phase space.
3.1.1. Morphological and Microstructural Characterization of HVOF HEACs
The HVOF process produced features characteristic of thermally sprayed coatings (see Figure 1 and Figure 2), such as splats (full-melted particles) and semi-molten particles, which were also seen in other articles [29,30]. The mixed powder grain size and thermal process ensured good adherence and spread of molten lamellar deposits to achieve cohesive splats within the coating bulk. Thus, no line cracks were present in the coatings’ cross-section (Figure 2a–f). The observed porosity, a common feature in such coating systems, is due to the overlap between unmelted and melted particles during splats overlap.
Figure 2a–d show the cross-section micrographs with line scans by SEM/EDX for the HVOF coating compositions. The results indicated a lamellar structure, all elements present and a higher oxygen content compared to the top surface across the thickness. The HVOF-coating process ensured good adherence maintaining coating thickness of 418.7 ± 20 µm and 313.8 ± 24 µm for HEA_Mo27 and HEA_Mo20, respectively. Both had a good mechanical interlayer interface but with some Al2O3 grit retention from surface preparation of sample before spraying. Distinctive variation in phase distribution was observed along the cross-section of the HVOF HEACs. The cross-sections of both HVOF HEACs in Figure 2b,d had similar features; the only difference is that a brighter phase (Mo rich) is more visible and involves a greater amount for the HEA_Mo20 compared to dark gray phases in the HEA_Mo27. The coating has three variations in the splats with different compositions resulting from the impingement and high oxidation related to the coating process. The EDX mapping (see Figure 2e,f) showed the two soft grey regions in the microscopic images (see BSE Figure 2b,d) to be of either Co-Mo/Fe-Mo or FeCoNi matrix with traces of Mo and Cr for the HEA_Mo27. A darker grey region visible in the microscopic images exhibited higher Cr content, while a bright grey region is rich in Mo. The line profiles show that the average composition across the thickness contains higher Mo and O than the other elements for both the HVOF HEACs, but an increase in Cr was observed for the HVOF-HEA_Mo20 (see Tables in Figure 2 and EDX maps in Figure 2e,f for the comparison). In correlation to backscattered images shown in Figure 2c,d, the Cr-splats were rich in O. The high melting and boiling points (i.e., 2623 °C and 4639 °C, respectively) can potentially explain the Mo content. During the HVOF process, in-flight particle temperature is estimated as 3000–3300 °C, significantly lower than the boiling point and approximately close to pure Mo melting temperature. Moreover, Mo volatility is the lowest in the CoCrFeNiMox molten alloy due to its higher molecular weight. Fanicchia et al. [30] identified similar bright Mo-rich phases uniformly distributed in MA-QS + Mo0.85 coating and the appearance of oxides related to the HVOF spray process.
3.1.2. Morphological and Microstructural Characterization of ESD HEACs
Figure 3 and Figure 4 show the top surface and cross-sectional views of the ESD-HEACs as analyzed via SEM/EDX. The top surfaces of the coatings show more micro-cracks and pores compared to the coatings prepared by the HVOF and LC techniques. However, the SEM images and the corresponding EDX maps in Figure 3a,b revealed a uniform, smooth and continuous coating. The top morphology appeared bubbly on a 1 mm scale but expanded into pinholes and soft bulges overlapping with craters, as seen in Figure 3a,b. These craters are likely formed from the shrinkage of the hot liquid pool thrusting around semi-melted or unmelted droplets from the solidifying molten pool. The surface maps show a relatively homogeneous elemental distribution of Co, Cr, Fe, Ni, Mo and O in the HEACs. However, the EDX mapped surface of the HEA_Mo27 reveals an area with increased Fe concentration in the craters and higher Co content in the droplets compared to the HEA_Mo20 (see Figure 3a,b).
Cross-section micrographs in Figure 4 show the microstructure of the ESD HEACs. The two-phase microstructure was characterized by a single-phase dark grey matrix and a significant amount of spherical droplet particles, as shown in Figure 4. The dark grey matrix was highly oxygenated with no secondary phases present. A pulsed-arc welding process is used to build multi-pass ESD HEA layers on the substrate from individual splats of the material from the electrode. A single spot deposit using this technique has a typical ‘splash appearance’ [38]; therefore, droplet particles were likely trapped if uneven heating and electric field oscillations occurs during the manual application. The obvious difference between the coatings HEA_Mo20 compared to HEA_Mo27 (SEM micrographs of Figure 4d over Figure 4b) is the increased thickness and consolidated microstructure without the large globules indicating spraying of fine molten droplets along the discharge arc during argon shielding deposition. A homogeneously dense and adherent two-phase microstructure with no pores was reported by Karlsdottir et al. [39] for the same deposition technique as for the HEA_Mo20 (QS + Mo) coating. However, the HEA electrode was prepared by vacuum arc melting with multiple passes (3–4) in that study and thus thicker and more uniform coating was obtained. The ESD process produced a coating thickness of 23.5 ± 5 µm and 28.8 ± 6 µm for HEA_Mo27 and HEA_Mo20, respectively, which the approximated value is comparable to already reported single deposit thickness [38]. The droplet particles appear light grey in SEM/EDX analysis and are rich in Mo, although traces of Cr and O are also found. The maps and line profiles from Figure 4a,c confirmed a considerable amount of Cr, Fe and Mo in the HEACs. The Fe and Cr content increased from substrate melting and mixing in the liquid pool, which explained the craters’ high Fe content from the surface analysis (see Figure 3). The ESD process has been reported to promote Cr segregation in FeCrMo type alloys with CrxOy formation [39]. There is also evidence of this in this work, as clearly shown in the composition profile scans in Figure 4a,c, showing depletion of Fe and Cr indicated by lower wt% in the un-melted regions. The entrapped powder particles contributed to coating layer-to-layer (L/L) fusion and defects in substrate-coating interfacial (S/C). As seen in Figure 4b, spherical voids in the coating could also be generated by entrapped gas during deposition.
Furthermore, branched cracks originated from the bridging of the voids during solidification. Residual thermal effects and stresses most likely propagated other cracks, either parallel or perpendicular to the surface. The L/L stresses created within the coating during L/L fusion promoted the formation of cracks, which propagated vertically (see Figure 4b). Additionally, delamination cracks also formed in a direction parallel to the surface (see Figure 4b,d). Hence, delamination resulted in a weak metallurgical interlayer at the S/C interface.
3.1.3. Morphological and Microstructural Characterization of the LC HEACs
The top surface morphology showed spherical granules and loose particles lightly bonded to large lumps of semi-melted structures. The mixed coarse powder distribution and rapid solidification of the LC process may have led to uneven heating of the particles promoting an uneven surface where the particles were partially melted or maintained their shape. However, finer granules were observed on the HEA_Mo20 coatings compared to HA_Mo27 (see Figure 5) due to high melting capabilities needed with the increase in Mo. Thus, the alloy elements are not homogeneously spread on the surfaces, as seen from the EDX surface maps in Figure 5a,b.
Figure 6 shows the microstructures of the cross-sectional area of the LC HEACs. The LC technique is known to develop thicker coatings, where the measured thickness was 1200 ± 0.1 µm and 1300 ± 0.1 µm for HEA_Mo27 and HEA_Mo20, respectively. The L/L build in the micrograph was homogeneous, dense and compact with no entrapped particles, only nano-scale pores (seen in Figure 6b,d) likely caused by the residual shielding gas. Compared to the HVOF and ESD coatings, the dense and homogenous structure is due to the higher temperatures reached by the process, leading to the development of a melting pool. At high magnification, the LC process was seen to have generated a dense cross-section and substantial substrate interdiffusion zone. The effect of volume fraction between the different molten phases resulted in the final morphology of a two-phase microstructure produced by spinodal decomposition, which was previously reported for the same alloy [40]. The compositional profiles in Figure 6a,c show the S/C metallic bond is enhanced with substrate melting and dilution, indicated with the increasing wt.% of Fe, %Cr and %Ni at the interface verified by the EDX line scan results, which then decreased across the coating thickness. Moreover, in Figure 6b,d, light grey phases are obvious in both alloys. The features and preferred orientation of the segregated phases were different in the matrices. The darkest phase (see Spectrum 3 in Figure 6d) was (Fe, Cr)-rich, while the brightest phase (see Spectrum 2 in Figure 6d) was Mo-rich. The solidification rate and temperature gradient during the multiple pass process in laser cladding can influence the crystal formation, transformation and final microstructure across the coating thickness due to the dependence of the ratio of both phenomena on crystal growth along a plane or the fastest direction of heat dissipation [41,42].
3.2. X-ray Diffraction (XRD) Analysis
Figure 7 shows XRD patterns of CoCrFeNiMox coatings fabricated from the MA powders. It shows three major phases: A mixture of FCC and BCC, as well as a residual Mo phase linked to the Mo element present in both alloys. The valence electron concentration (VEC) is a parameter that predicts FCC and BCC phase content present in a structure. The VEC number of the equiatomic CoCrFeNiMo alloy suggests that FCC phases should form in more significant quantities than BCC [43], the diffraction patterns reported here support this hypothesis, see Figure 7. The VEC of the CoCrFeNiMox decreases by 1.4% by increasing at% x from 20 to 27. Thus, HEA_Mo27 has a lower calculated VEC, 7.69, compared to HEA_Mo20 which has a VEC of 7.8, which would suggest more dominance of the FCC and less BCC for the HEA_Mo20. The XRD patterns support that, particularly for the LC-HEA_Mo20 coating as shown in Figure 7b where the FCC peaks are sharper and more pronounced than the BCC. Additionally, σ phase was detected in the HEA_Mo27 patterns. The established σ phase of a tetragonal structure was Fe-Cr or Cr-Mo rich and Ni deficient [37,38,43], while the Mo compound-based phase was a Fe-Mo or Co-Mo rich phases of a rhombohedral structure (presumably an µ phase) with Ni traces as reported in [39,43,44]. The Fe-Mo phase was present in the ESD and LC developed coating explained by high Fe content in the microstructure from SEM/EDX results whereas Co-Mo phase was found in the HVOF HEACs. Research on the CoCrFeNiMox alloy revealed the same crystal structures for these two intermetallics and that the σ phase + µ phase could co-exist [6,16] or undergo a transformation in the same matrix [44,45,46]. Thus, this confirms some segregation, as indicated as an example with: (1) The Co-Mo and Cr-Mo soft grey phases predicted in Figure 2b,d; (2) the Fe-rich FCC matrix depleted in Mo (see EDX results of LC-HEA_Mo20 in table in Figure 6d), while the bright region is a Mo rich -Ni phase, according to Figure 6d. The droplet phases in the ESD-HEA_Mo27 in Figure 4 show a similar trend in composition related to the BCC structures. The element distribution is in line with the literature [29,37,41,42,43,44] and has been attributed to sluggish Mo diffusion, which tends to be divided into dendritic and interdendritic regions during solidification. While research on Mo-containing HEA systems (cast or coated) is limited, our results are comparable to those of other studies with HEA alloys where similar VEC values are prone to the formation of σ intermetallic phase and FCC + BCC structures [13].
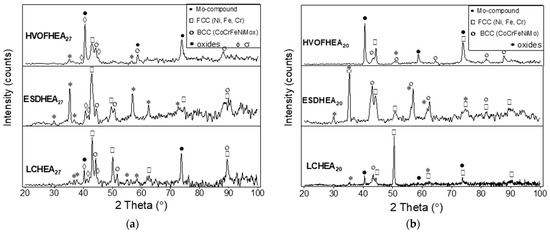
Figure 7.
XRD scan of the as-sprayed (a) HEA_Mo27 and (b) HEA_Mo20 coatings with the different deposition techniques.
All the coatings show the appearance of oxide phases generated during all the deposition processes; this is in line with what has been reported for HEA coatings produced with thermal spray processes due to the oxygenated atmosphere. The oxides identified in the diffraction pattern were composed of the following elements: Ni, Cr, Mo and Fe. This is consistent with the microstructure analysis of CoCrFeNiMox coatings developed by [30] by LC and [39] by ESD deposition who reported the formation of both FCC and BCC phases in the structure. Both researchers related the FCC structures to a binary constituent of Fe, Ni and Co while BCC to Mo compounds. Liu et al. [6] attributed the strength of CoCrFeNiMox bulk material to the formation of BCC phase and hard σ + μ intermetallic structures.
3.3. Micro-Hardness of the HEACs
The averages of micro-hardness results taken are reported from the cross-section of the coatings. The substrate’s hardness was improved from 164 HV0.1 to an average of 444.5 HV0.1 for the HEA_Mo27 and 304.2 HV0.1 for the HEA_Mo20 coatings produced by the HVOF technique. The HVOF coatings were recorded with the highest hardness among the ones tested in this work, likely due to the additional hard phases such as the Cr2O3 phases shown in Figure 2c,d. In addition, grain boundaries are visible around splats from the HVOF technique, which may increase the resistance to the deformation mechanism during indentation. The LC-HEACs had the thickest coatings and defect-free interface, suggesting a good metallurgical bond. The LC-HEA_Mo27 samples had a hardness value of 276 HV0.1. However, a lower value was obtained for LC-HEA_Mo20 at 209.3 HV0.1. Thus, using the LC instead of HVOF technique, the hardness of HEA_Mo27 decreased by 38%, while HEA_Mo20 by 31%. This is the same trend as for the HVOF, i.e., HEA_Mo27 outperformed the HEA_Mo20 in the hardness testing. This can likely be attributed to localized hardening due to the microstructural strengthening of each precipitated phase, the σ phase that was only detected in the XRD analysis for the HEA_Mo27 and not for the HEA_Mo20. Additionally, based on the backscattered images in Figure 6b,d, the solution matrix is undoubtedly made up of Fe, Cr and Ni elements. Further examination of the XRD results in Figure 7 reveals a higher intensity of the prevalent double-diffraction peaks from 42° to 45° in HEA_Mo27 than in HEA_Mo20, implying that the mass fractions of Fe, Cr and Ni in phase formation also affect the hardness. The Fe, Cr, Ni fractions are 51.3 wt%, 15.8 wt%, 11.9 wt% for HEA_Mo27 and 49.4 wt%, 15.3 wt%, 16.6 wt% for HEA_Mo20, respectively. Because wt% of Fe accounts for roughly half of the mass fraction, it can be assumed that the hardness was influenced by Fe compositional variations in the microstructure. Moreover, Zhang et al. [16] found the formation of martensitic structures (i.e., FCC Fe to BCC Fe compounds) in lower regions via 304 stainless steel substrate dilution as a contributing factor to the overall hardness of LC produced coatings [8].
Thus, by comparing the microstructures explains the higher hardness of the HEA_Mo27 over HEA_Mo20 alloy since: (1) BCC and tetragonal phases were dominant for HEA_Mo27, which promoted hardness; and (2) the decrease in hardness in HEA_Mo20 was confirmed as the tetragonal-σ phase disappeared or transformed into a rhombohedral-phase structure shown in the patterns (compare Figure 7a,b), as observed and supported by relevant literature [31,34]. The formation of the Cr, Mo-based -σ phase in the matrix improves the alloy hardness as has been also reported by Shun et al. for age hardened CoCrFeNiMo0.85 high-entropy alloy [45], as lattice distortion associated with Mo increase is noticeable in the solid solution strengthening for the CoCrFeNiMox.
The thinnest coatings were produced by the ESD technique, measured with 23.5 ± 4.6 µm and 28.8 ± 5.0 µm for HEA_Mo27 and HEA_Mo20, respectively. For these coatings, Vickers micro-hardness could not be determined in the cross-section due to their thin nature.
3.4. Surface Roughness of the HEA Coatings (HEACs)
A critical factor in defining tribological properties is the surface interaction of two moving parts. In practice, the arithmetic average roughness, Ra, or its root mean square, Rq, are the engineering parameters that determine the load-bearing capacity of surfaces. The results from the surface roughness analysis for the HEACs showed a similar increasing trend in roughness for both compositions of the as-sprayed HEACs in the order: ESD < HVOF < LC as reported in Table 6. This low roughness could be related: The lower the process speed, the smaller the precursor particle size and post treatment (pressing and sintering of the MA powder) to consolidate the electrode for the ESD process. The surface features of HEA_Mo27 and HEA_Mo20 had similar features defined by each coating process’ inherent characteristics; thus, in this case, only information on HEA_Mo27 is presented. The Ra for both coating types was evaluated and compared in Table 6.
Figure 8 is a pictorial display of 3D topographic images of the surfaces from the LC, ESD and HVOF deposition techniques. The images show rough bulges on all the surfaces. The surface roughness parameters with the initial S were investigated with other height distribution parameters such as skewness (Ssk) and kurtosis (Sku). The obtained average and root mean square surface roughness (Sa, Sq) values of the HVOF and ESD coating were approximately half that of the LC coatings. The correlation between Ssk and Sku converged for height distribution near-symmetry in all the coatings except the HVOF.
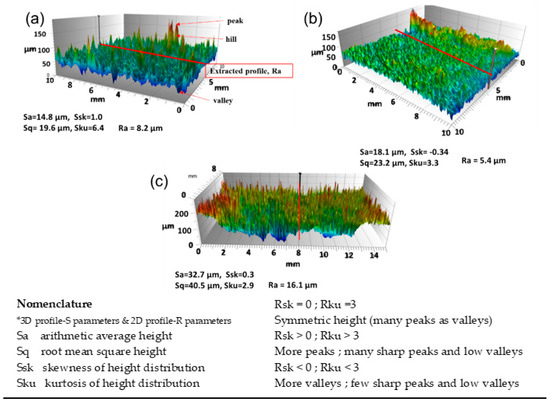
Figure 8.
Three-dimensional topographic images and selected surface parameter of the as-sprayed (a) HVOF-HEA_Mo27 (b) ESD-HEA_Mo27 and (c) LC-HEA_Mo27 coatings.
The as-sprayed LC and HVOF HEACs had low valleys and sharp peaks (from the rule of thumb: Sku ≥ 3). However, the HVOF surfaces were characterized with the highest and sharpest peak ratio (Figure 8a), where the value of Ssk was unity. The ESD developed coatings were somewhat sensitive to low valley formation to symmetric broader peaks (hills in Figure 8), where Ssk was negative. The LC HEACs depicted a similar distribution, but the features of a more compact and spiky surface asperities (peaks) were seen. The plateau-like microdomain structures showed close symmetry in peak sharpness and height distribution (Sku ≈ 3, Ssk ≈ 0, see Figure 8c). This localized macro to nano-scale structures on LC HEACs contributed to the large statistical roughness parameters in line with the coarse granular morphology seen from the top surface SEM micrographs in Figure 5a,b. Thus, though all the coatings contained similar precursor elemental content, the highest Sa was recorded for the LC coating deposition process, which is consistent with the microstructural SEM analysis of the coating surfaces.
3.5. Sliding Friction Coefficient and Wear Behavior
The representative coefficient of friction (CoF) curves of each as-sprayed HEAC with its deposition process as a function of time under the dry sliding is shown in Figure 9a–c. Figure 9d compares the CoF traces for all the HEACs and 304 SS substrate. Two time-dependent regimes characterized the fluctuations. From Table 5 and Table 6, the average values in these regions and that of the entire curves were compared with the value of stainless steel of 304 SS (0.80). On contact between the tribo-pairs under the applied load, an initial force is needed to alter the morphology of the contact zone for a continuous motion. The initial sliding period corresponded to breaking-in or running-in with the highest CoF value (µpk) shown on the friction curves. The running-in is related to the surface structures or morphology of the coating and the 304SS. The running-in was severe for all the HEACs and the steady-state was harder to achieve in the HEA_Mo27 than HEA_Mo20 coatings before coating run-through (µc). Figure 9a,b show a very short running-in stage for both the HVOF and ESD techniques with the least Ra values (i.e., 8.2 and 5.4) but recorded the highest µpk values (see Table 5). This may be attributed to a higher nominal/apparent contact area since, at the initial contact pressure, the area to load ratio is low during sliding (i.e., there is a low volume of material/asperity peaks above). However, this effect did not guarantee a high overall mean CoF value, implying an opposite general trend in which frictional response was controlled by the wear behavior of the coatings. Figure 9a–c shows these transitions (µpk, µc, µs) according to the friction behavior indicated lines (and arrows, only for Mo27 due to clarity).

Figure 9.
Evolution of coefficient of friction (CoF) versus sliding time after 12,000 wear cycles under dry test condition for the as-sprayed (a) HVOF, (b) ESD, (c) LC -HEA coatings and (d) 304L SS and HEACs with the different deposition techniques.
Table 5.
Averaged transition stages in the friction traces of HEA_Mo27 coatings from the different deposition techniques assigned as: Break-in peak value—µpk; coating run-through—µc; sub-stresses from substrate—µs.
Table 6.
Summary table of the surface characterization results obtained for each HEAC deposited with the different coating techniques and results from the hardness and dry sliding wear test.
The HEACs with the lowest mean CoFs values (between 0.5–0.8) were the HEA_Mo27 with LC, HVOF and ESD deposition techniques which were similar or slightly smoother than HEA_Mo20 (Figure 9). While the roughness effect was difficult to clarify, the influence was reflected in the surface conformance indicated by fluctuations of the CoF curves. For instance, the LC-HEA_Mo27 with the highest fluctuations (SD = 0.2, indicating the least friction stability) had a low and comparable average roughness parameter (Ra = 16.1) to LC-HEA_Mo20 (Ra = 17.2) but experienced the largest CoF reduction of about 30% when compared to the 304SS substrate. Moreover, although high Ra influenced maximum contact of the sliding pair, which was critical for developing real contact zones and lowering CoF [47], other mechanical processes were unavoidable in the unlubricated contact (such as plastic deformation depicted in very large deviation in CoF with sliding time to achieve the steady-state conditions). This is illustrated in the pronounced elastic shakedown or the gradual accumulation of plastic strains in the LC-HEA_Mo27, HVOF-HEA_Mo27 and ESD-HEA_Mo27 friction curves (see Figure 9a–c) in the initial stages, which persisted until the steady state or coating wear-through (µc).
In the present study, all the HEACs showed a general decrease in the steady-state friction coefficient compared to the 304 SS bulk material (Figure 9d). The mean CoF values (µmean) are reported in both Table 5 and Table 6. The largest CoF reduction of the LC-HEA_Mo27, HVOF-HEA_Mo27, ESD- HEA_Mo27 coatings compared to 304 SS was about 30%, 14% and 5%, respectively, whilst a 1% to 3% rise was observed for the HEA_Mo20 coatings. It should be noted that these HEA coatings investigated in this work have heterogeneity in surface morphology, microstructure, phases and oxides (before the sliding test) as discussed in earlier sections. Therefore, the transitions and progressive evolution of friction were mainly attributed not only to the microstructure but alterations in the surface condition with repetitive sliding (i.e., wear debris, adhesive shear, films and local roughening of the subsurface). For instance, the sharp friction rises (0.7–0.9) in the curves of HEA_Mo27, then the monotonic decrease in the curves until coating wear-through (µc) around the 40th min or changes due to sub-surface stresses (µs) (see Figure 9). Under the same loading conditions, the CoF of the lower hardness HEA_Mo20 coatings increased rapidly after the running-in and continued to the steady-state. At maximum contact, when the pressures exceed the elastic limit of the HEACs, large tangential forces, strong adhesion, extensive plastic deformation and/or material loss occur. While such transitions are gradual and difficult to assign definite values, the recorded averages are given in Table 5 for the HEA_Mo27 coatings which showed the best lubrication and wear-performance. As can be seen in Table 5, the µpk decreased by 13% for HVOF-HEA_Mo27, ESD-HEA_Mo27 and 17% for LC-HEA_Mo27 coatings before a steady state coating run through (µc) was achieved. Likewise, other transition (µc to µs) showed a further decrease in the CoF values at about 1%, 13% and 7% for HVOF, ESD and LC obtained with slight variance except in the HVOF technique (SD = 0.17).
The wear rate estimated from measurable material loss or wear volume was calculated with Equation (2) as previously described to evaluate the wear resistance of each HEAC for the corresponding deposition technique. Figure 9 has the 3D surface maps of the worn surfaces of the coatings observed by an optical profilometer where profiles were extracted as shown in Figure 10. The results of the wear depth and wear rates are given in Table 6.
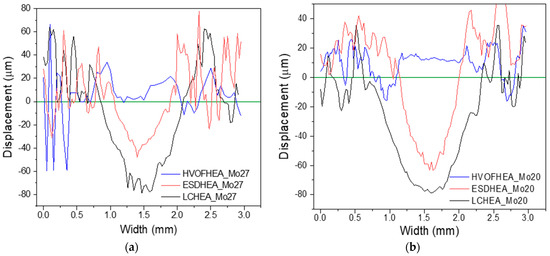
Figure 10.
The topography profiles of the HEA coatings with the different deposition techniques after 12,000 wear cycles under dry test condition (a) HEA_Mo27 and (b) HEA_Mo20.
Surfaces with higher material removal showed large and broad wear tracks with a deeper depth of wear track at maximum contact between the WC ball and the coatings. It was found that the LC HEACs had the roughest and deepest profile (see Figure 10). Since the coatings were over 1 mm thickness, the average width and maximum depth were about 938 µm and 110 µm (Figure 10b), which was observed in the HEA_Mo20 coatings. Among the HEA_Mo20 coatings, track width and a complete coating depth wear-through approximately 864 µm and 44 µm, respectively, was observed for the thin ESD-HEA_Mo20 coating (initial average thickness of 28.8 µm). The least depth was observed for the HVOF-HEA_Mo20 coatings at about 20 µm corresponding to 5% decrease in the original thickness of the coating. Similarly, the wear rate from this removed volume corresponded to 72% improvement in wear resistance compared to 304 SS. The estimated average track width was rather wider (1.32 mm), which complements the excessive WC ball wear diameter (1.71 mm see Figure 11a). In Figure 11b, the local roughening of the WC ball can be seen that occurred due to repeated wear of the LC-HEA_Mo20 with a consistently lower micro-hardness (209 ± 7 HV) throughout the cross-section.
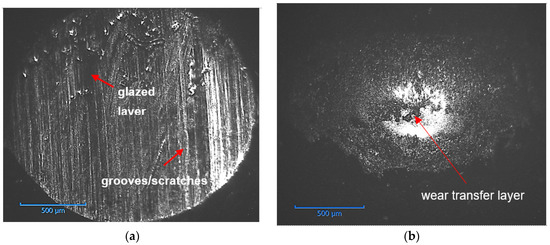
Figure 11.
Optical micrographs of worn scars morphology of WC ball sliding against (a) HVOF-HEA_Mo20 and (b) LC-HEA_Mo20 coatings after 12,000 wear cycles under dry test condition.
In accordance with the CoF results, the HEA_Mo27 coatings exhibited the highest wear resistance, since higher CoF and wear rate values were measured for the HEA_Mo20 coating. It was found that both for HEA_Mo27 and HEA_Mo20, the wear reduction from using HVOF over LC deposition techniques were 81% and 35%, respectively, and that the ≈420 µm thick HVOF-HEA0.85 decreased wear rate by 95% compared to the 304SS.
A similar room-temperature dry sliding frictional behaviour was reported for dual-phase and equimolar HEA alloys: CoCrFeNiMnAlx (x = 0, 0.25, 0.5, 0.75) [19], CoCrFeMnNi and CoCrFeNiAlx (x = 0.3, 0.6, 1) [48]. The study reported the highest fluctuations and CoF value for the equimolar CoCrFeNiAl alloy at 0.73. Though the CoF values obtained in the present study differ from values of AlCoCrFeNi, similar high CoF values have also been reported for CoCrFeNiMn [21] and CoCrFeNiMo [26]. Xiao has shown that the plasma sprayed coating’s cohesive strength and hardness were adversely affected by the Mn2O3. Concurrently, oxides of both Mn2O3 and Cr2O3 formed a protective layer that enhanced wear resistance [21]. Thus, the debris oxidation-related HEA materials compared to 304 SS under dry wear conditions significantly influence the wear process. Wear rates for the different deposition methods decreased in the following order: LC, ESD and HVOF coatings, from highest to lowest. This was the case for both coating types: The HEA_Mo27 and the HEA_Mo20. However, wear depth results obtained from cross-section profiles, on the other hand, showed complete coating wear through in ESD coatings. Meanwhile, in the LC HEACs, the largest penetration depth was less than 10% of the nominal coating thickness. Thus, it is worth mentioning that the depth of wear was not visible in cross-section SEM images of both the LC and HVOF sprayed coatings after the dry sliding test. It was observed that the wear rate of the HVOF coatings was of the order of 1 × 10⁻⁵ mm3/Nm, indicating shear resistance from sliding ranges to a magnitude higher than ESD and LC (1 × 10⁻⁴ mm3/Nm). The results show that the wear resistance of the CoCrFeNiMox alloys were sensitive to the resulting microstructure (FCC, BCC, σ + µ) after deposition, which can be linked to the hardness and deformation resistance of the alloys [46] discussed in the next section.
3.6. Worn Scar Morphology and Wear Mechanism
The surface SEM micrographs from the wear tracks are shown in Figure 12 and Figure 13, where wear characteristics for the two coating systems and three different deposition techniques can be seen. The red arrows indicate discontinuous regions in the tracks that were either minimally abraded (with oxide debris) or had no wear-forming abrasion pits. The white arrows point out the areas that experienced continuous smearing or scratching from the repetitive sliding of the coatings. The arbitrary track features on the coating surfaces were promoted by the high surface irregularities (Sa) and large thickness in LC HEAC. From the wear trace morphology in Figure 12(a1,a2), obvious oxide film was observed (indicated with white arrows) on the HVOF HEACs in the direction of sliding at room temperature, with HEA_Mo20 having the best film continuity. In comparison to the coatings prepared by the LC and ESD techniques, the micrographs revealed severe plastic deformation, glazed (adhesive) layer and oxide debris for the LC and ESD samples, as shown in Figure 12(b1–c2). Moreover, localized damage close to the contact area and a transfer film was observed on the counter body (see WC ball in Figure 11b).
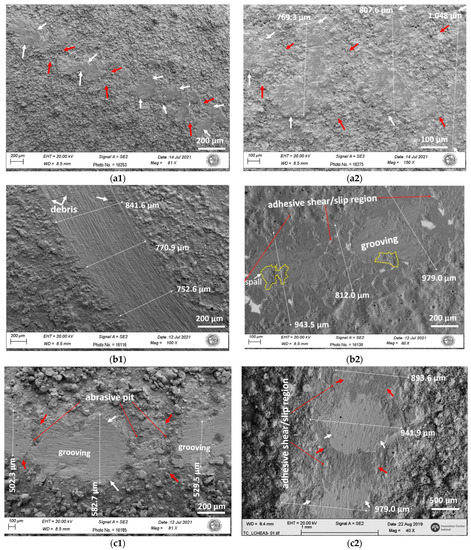
Figure 12.
SEM micrographs of morphology of the wear tracks of the (a1) HVOF-HEA_Mo27, (b1) ESD-HEA_Mo27, (c1) LC-HEA_Mo27 and (a2) HVOF-HEA_Mo20, (b2) ESD-HEA_Mo20, (c2) LC-HEA_Mo20—CoCrFeNiMo coatings with the different coating techniques after 12,000 wear cycles under dry test condition.
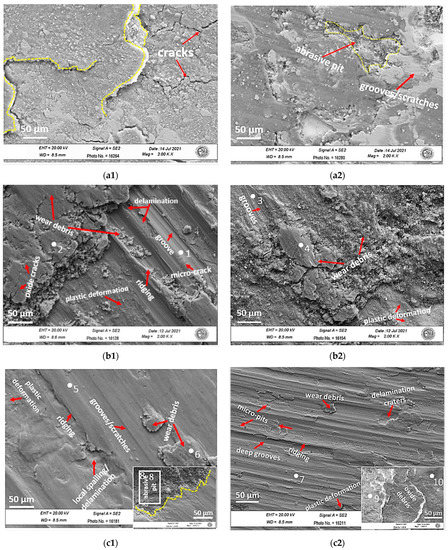
Figure 13.
SEM micrographs of morphology of the wear scars and debris of the (a1) HVOF-HEA_Mo27, (b1) ESD-HEA_Mo27, (c1) LC-HEA_Mo27 and (a2) HVOF-HEA_Mo20, (b2) ESD-HEA_Mo20, (c2) LC-HEA_Mo20 coatings with the different deposition techniques after 12,000 wear cycles under dry test condition.
In Figure 13, the localized microscopic surface damages were revealed in higher magnification SEM micrographs. Based on images in Figure 13(a1,a2), it can be inferred that the primary mechanism of the HVOF HEACs was mild abrasive to oxidative wear. While lower Ssk values tend to minimize friction [47], no correlation is observed here. This is because, while the steady state CoF does not change with surface roughness, the plowing and adhesion components of friction do [49]. The results from surface topography showed the HVOF technique were found to produce coatings of the many high peak-to-low valley ratio (Ssk≈unity), significantly influencing a non-conforming contact between the polished WC ball and the as-sprayed coatings reducing real contact areas. Thus, during the wear process, high peaks (asperities) wore off and the valleys filled up with the debris from the plastic deformation of the previous peaks. The truncated peaks then bore the load through oxidation of the exposed plateau and the debris (oxide layer) generated during smearing or scratching. It should be noted that both types of HVOF HEACs have FCC and BCC phases where the differences were from the additional tetragonal -σ, rhombohedral -µ and extrinsic oxide compositions. EDX map of the micrographs of the oxide layer in Figure 13(a1,a2) and the elemental composition are presented in Figure 14. It has been reported by many studies that the oxidized debris has a crucial role as a protective interlayer preventing metal to metal contact [28]. Therefore, the wear resistance of the HVOF HEACs can be attributed to the microstructures in contact under severe plastic deformation and the tribo-layer formed on the surface during sliding. The chemical composition of Figure 13(a1,a2) was determined using EDX analysis. The results show the oxide layers of both HEACs rich in O and Mo and similar concentrations of Co, Cr, Fe, Ni from the EDX table in Figure 14. It is evident that the wear mechanism at the early stage of sliding is typical abrasion (dominant) and the steady-state sliding is characterized by continuous plastic deformation and oxidation of the produce debris flakes to form a tribo-layer separating the contact pairs.
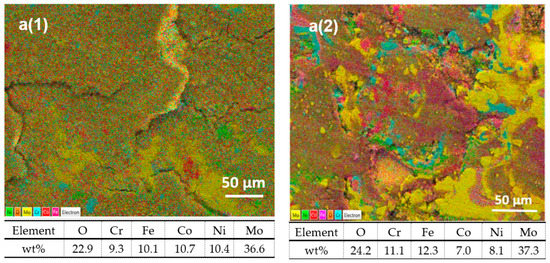
Figure 14.
EDX mapping results (a) of the layer formed on the (a1) HVOF-HEA_Mo27 and (a2) HVOF-HEA_Mo20 as-sprayed coatings after 12,000 wear cycles under dry test condition.
This phenomenon was evident in the friction curve of HVOF-HEA_Mo27, where a hump in the friction trace (see Figure 9a) indicates the debris accumulation within the coatings during the coating wear-through (µc). In addition, the FCC+BCC matrix which permitted extensive plastic deformation additional identified secondary σ and μ structures reinforced the HEA_Mo27 coating [6,13]. Moreover, the work hardening effect on the surface increase the shear strength of the HVOF produced hard HEA_Mo27 coatings, reducing yield and tangential forces (≈lower CoF values) while increasing brittleness when the contact pressure exceeded the strain limit. This means that while the harder surface partially covered with oxide layers can reduce wear, the wear phenomenon can also intensify associated with the abrasive action of the debris. While MoOx particles are lamellar flaking in shape, MoO3, which is easily produced from decomposition of the Mo-based coatings during sliding, lacks intrinsic shear properties (unlike amorphous C and MoS2) [20,27] because of its sharp edge crystalline structure. The SEM/EDX image in Figure 14(a1)) shows the lamellar debris generated from wear of the surface which undergoes micro-cracking either parallel or at an angle to the surface to sustain the repetitive sliding stress. As the crack appears in the plastically deformed surface oxide layers, the flaky debris generated, if not refined to build up the lamellar layer, acts as an abrasive, causing (three-body) wear. Because the VEC number suggested a more dominant BCC phase, the cracking on the HEA_Mo27 (Figure 14(a1)) coating is reasonable; nonetheless, prior research revealed that the σ and µ strengthening phases that existed in the matrix were hard but also brittle [6]. Thus, if the FCC matrix sustains the rather high deformation by extreme work hardening, micro-cracking is suppressed as seen in the HVOF-HEA_Mo20. Furthermore, the grain and inter-splats boundaries (with local compositional variation) in the near-surface layer minimize the propagation of plastic deformation under the abrasive wear to prevent subsurface fracture. Thus, the friction curves fluctuate and the CoF value increases significantly (Figure 9a), which was typically observed in the HEA_Mo20.
The energy dissipation in the contact and low wear rates of the HVOF HEACs were compensated by material loss from the WC counter ball by abrasion (see Figure 11a), where a glazed layer reduces the continuous wear of the ball. The oxidized worn surfaces and debris were composed of high contents of Mo and Cr, as well as traces of Ni, Co and Fe observed as constituents of the BCC phase (with load-bearing properties) [24,28] from the XRD results. These phases have been linked to the wear resistance of HEA alloys [50]. Moreover, Zhao found Al0.8CrCoFeNi, less frictitious and more wear resistive compared to equiatomic AlCrCoFeNi; however, the surfaces had severe abrasive peeling explained by the FCC+BCC dual-phased matrix reported [50]. The BCC phases were reported harder compared to the highly plastic FCC phases. Due to the high wear resistance, removing softer FCC phases produces a higher CoF, while removing the same amount of hard BCC and σ phases require more energy, explaining the lower CoF. From the EDX result of the tribo-oxide layer, the oxygen content reached 31.6% for HEA_Mo27 and doubled for HEA_Mo20 coatings after the dry sliding signifying a large number of atmospheric oxidation processes and mechanical mixing. In conclusion, groove or scratch marks constituted the wear features, a sub-mechanism of abrasion, but wear resistance was dependent on the formation and growth of tribo-oxide layer within the contact and their strain rate response during plastic deformation. Therefore, the HVOF HEAC surface having a dense and adherent oxide film resulted in the lowest wear.
The LC HEACs and ESD HEACs (Figure 12(b1–c2) and Figure 13(b1–c2)) experienced higher wear rates compared to the HVOF HEACs. The surfaces were severely grooved in the direction of sliding along with wear debris either flaky or fragmented. Accordingly, severe run-in occurred for both HEA_Mo27 and HEA_Mo20 ESD coatings within the shortest time compared to HVOF and LC coatings by rapid truncation of the asperities It can be inferred that the coatings from both techniques experienced abrasive wear. Large strain rates have been associated with material removed from the sides of the grooves (ridges) during microploughing and microcutting [30]. Moreover, microcracking, chipping and delamination (shown in Figure 13(b1–c2)) cause wear volumes greater than the grooving or scratching in the coatings. The SEM images in the LC-HEA_Mo27 coating (Figure 13(c1)) showed rather fine striations on the powdery debris remnants from previously worn asperities and pull-outs from local spalls. Thus, ploughing and cutting of micro-asperities during the friction test are primarily responsible for the extent of wear in LC-HEA_Mo27. From the surface wear morphology, the debris was generated and most pits that appeared were by abrasive wear rather than spalls. The debris (tribolayer) is mostly oxidized at the maximum contact pressures, but is metallic at intermediate loads. This occurs when the debris is non-adherent or lost within the contact. The transition from oxidative to severe adhesive wear (metallic) causes a rapid increase in wear rate seen in LC-HEA_Mo20 and ESD HEACs.
After testing, the EDX analysis results in the grooves (marked at points 1, 3, 5 and 7) on worn areas of both coating compositions given in Table 7 revealed almost no oxide formed and higher wt% Fe (possibly from the steel substrate). The mass fraction of Fe in the region for ESD and LC are 69.1 wt%, 43.5 wt% (HEA_Mo27) and 68.3 wt%, 50.3 wt% (HEA_Mo20) demonstrating the severe wear conditions for the ESD technique and typically for the HEA_Mo20. However, in LC HEAs, the increase in mass fractions in the worn depth compared to nominal composition were 55.4%, 19.6%, 76.4% (HEA_Mo27) and 12.7%, 6.2%, 11.5% (HEA_Mo20) for Co, Ni, Mo. This shows little-to-no contribution of the substrate to the wear rate. In Figure 13(b1,b2) (ESD HEACs) and Figure 13(c1,c2) (LC HEACs) it can be seen that the oxidized wear debris was constantly consumed and regenerated. If consumed, the particles are fragmented, forming a multilayer or clump shaped as a result of continuous oxidation after peeling (see Figure 13(b1–c1)). From the EDX results, the elemental debris composition (points 2, 4 and 6) shows the high wt% of Fe, O. For instance, confirming the complete coating wear-through, Fe and O increased over 60% in the ESD-HEA_Mo27 but a 12.5% reduction in wear rate was observed compared to the 304 SS. In the ESD-HEA_Mo20 coating, the oxygen content in the debris increased by 51.9%, where the easiest oxide to form under this system is Fe2O3.
Table 7.
Chemical composition of the HEA_Mo20 and HEA_Mo27 coatings deposited with the different coating techniques from EDX analysis after the dry sliding wear test. The EDX point and area spectra 1–10 are marked in the SEM images in Figure 13.
Besides the grooves/scratches, oxides could be seen on the mid-junctions and edges (red arrows) of the worn surfaces of the HEACs, as can be seen in Figure 12(b2–c2). Thus, the initial wear process of the ESD coatings was due to abrasion wear within the contact zone followed by oxidative wear. Here, abrasive pits with oxidized debris were observed for abrasive resistant coating (i.e., LC-HEA_Mo27 in the bottom image in Figure 13(c1)). Furthermore, the continuous grooving process co-occurred with delamination related to near-surface damage during the repeated sliding cycles. In lower wear-resistant coatings, the lamellar oxides are hoarded to the surface forming adhesive junctions. The hoarded lamellar mixed oxide film in the ESD HEACs reduced friction and wear by acting as slip regions, contrary to the flake debris in LC HEACs. The discontinuous smooth glazed layer suggested that adhesive and oxidative wear occurred confirmed in EDX results of points 9 and 10 in Table 7, while in the other regions, the debris sloughed, aggravating the abrasive wear as in the bottom image in Figure 13(c2). Additional debris formed was propelled by localized spallation and delamination (forming micropits, craters) developed from repeated plastic deformations apparent as fractured ridges or adhesive traces (Figure 13(b1–c2)). Firstly, this is the result of the cutting-type mechanism attributed to the ductile microstructure which causes materials to deformation plastically in the direction of sliding. Secondly, in both ESD and LC techniques, the coating and the substrate were well combined, with no visible grain boundaries in the microstructure of the coating that was metallurgically bonded due to the dilution effect of Fe (from the substrate). Furthermore, the coating possessed a mixed FCC (Fe-Cr-Ni) and Mo-based BCC phase with intermetallic compounds or secondary phases. This effectively allows spalling during the dry-sliding wear process which originates from deformation of the hard particles [6,8,22]. Lastly, the coatings exhibited the lowest hardness and thus lowest strength, which can resist plastic deformation and delamination. However, extensive plastic deformation was compromised by the mid-junction adherent-oxidized debris layers (see Figure 12(b2–c2)).
Besides, studies indicate a proportionality of debris volume to load and sliding distance with further research employed by Archard [33] to characterize sliding wear volume (w) depicted in Equation (3) where hardness (H) of the contacting surface approximated with the workdone by friction forces (i.e., Load (Fn) ∗ sliding distance (L)).
The value of dimensionless K is constant in a stable wear situation, experimentally related to surface quality, chemical affinity, etc. A thorough wear test under constant conditions, on the other hand, indicated that the wear rate is variable where Archard [33] defined K factor as ‘mild’ wear (10−8) ≥ K ≥ ‘severe’ wear (10−2).
At higher magnification images in Figure 13(c1,c2), the HEA_Mo27 had sufficient wear performance, owing to the long-term lubrication of the phases in the oxides layer that formed and lack of surface adhesion. Figure 11b shows an optical micrograph of LC-HEA_Mo20 coating heavily glazed with debris due to material transfer. In the EDX results, of the 50 µm images of Figure 13(c1,c2) given in Table 7, the loose wear debris in abrasive pits (area spectrum 8) are mainly Cr, O content reaching 60.4 wt%, 29.2 wt%, respectively.
Similarly, in the EDX results of the hoarded oxides (i.e., adhesive-oxidized debris layer), the lamellar oxide layer underneath had wt% Cr and wt% O as 70.7 and 22.0 (point 10) compared to the top layer 13.0 and 28.6 (see point 9). The Fe content in the top layer reached 35.3%, with O at 28.6%. Thus, the contact pressures were supported by both oxide films. Therefore, under these composition systems and the selected test conditions, the main atmospheric oxides that could form are MoO, MoCrO (see SEM/EDX of HVOF HEACs), NiO, Cr2O3 and Fe2O3. From EDX maps, all the oxides appeared denser except Fe2O3, which was obviously loose and peeled easily in the contact and functioned as third body abrasive.
Meanwhile, to confirm the wear behavior from the cross-section results from the optical profilometer, SEM/EDX analysis was performed on the grooved regions in Figure 13. The EDX results of two HEACs deposited by ESD and LC technique is presented in Table 8 to support the high magnification images generated in Figure 13(b1–c2). It was found that the surfaces (grooved/excessively abraded regions) are predominantly composed of Fe, Cr and Ni with little-to-no O (reaching the maximum value of 6.07 wt% in ESD-HEA_Mo20). This confirms complete coating wear-through for the ESD HEACs. In the LC and HVOF technique, the worn regions from the abrasion zone were observed with higher weight concentrations of Co, Ni and Mo. The increase in mass fractions on the surfaces with these elements from the EDX data, like HVOF HEACs, confirm that such highest constituent phase in enhancing wear performance are primarily found in the oxidized intermetallic phases reported with good mechanical properties and wear resistance by XRD [6].
Table 8.
Chemical composition of the HEA_Mo20 deposited with ESD and LC techniques from EDX analysis after the dry sliding wear test. The EDX map spectrum from worn regions with parallel grooves in the SEM images in Figure 13.
Figure 15 shows the schematic of the proposed wear mechanisms based on the surface characterization of the HEA coating compositions by the different deposition techniques. The identified wear behavior was an abrasion-mixed mechanism with plastic deformation to an extent for all the tested coatings. However, depending on the coatings’ inherent surface, mechanical and microstructural properties, the wear mechanism transitioned into oxidative (i.e., in the HVOF HEACs) and adhesive wear (i.e., in the ESD HEACs and LC HEACs), affecting the debris generation and surface damage. In summary, owing to the good mechanical properties and compatibility with the substrates, the microstructure and phases formed by the HVOF and LC techniques provided sufficient hardness, which increased the resistance to excessive plastic deformation under the dry sliding test. Based on the results of the experiments conducted in this study, it seems evident that adjusting the spray parameters is needed to achieve a thicker and dense coating for the ESD technique to improve the microstructure and minimize defects. An excellent mechanical and wear performance was observed for the HVOF sprayed coatings as a dense tribo-oxidation layer was formed from the generated debris from the dominant abrasive wear mechanism preventing near-and sub-surface damages, schematically shown in Figure 15b. On the other hand, the oxidation of the wear debris associated with the two HEA coatings changes in morphology and composition in the overall sliding period causing transitions in the friction and wear modes. The HEA_Mo27’s tribological properties are excellent evident by the hardness and wear resistance. This affords the possibility to employ HEA_Mo27 on components that are subject to wear and erosion-corrosion in challenging environment as in geothermal power plants and well components such as valves, turbine rotors and shaft.
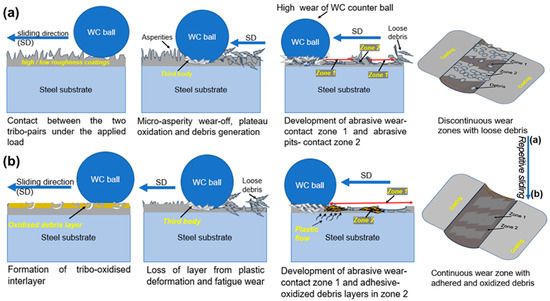
Figure 15.
A schematic of the wear evolution proposed for the produced HEACs: (a) abrasive wear mode with plastic deformation and debris generation at the onset of sliding and (b) third body influence with subsequent decrease in the wear. Wear transition from mode (a) to (b) due to oxidation and repetitive sliding.
4. Conclusions
In summary, the study investigated the microstructural, mechanical and tribological properties of Co19Cr17Fe19Ni18Mo27 and Co20Cr20Fe20Ni20Mo20 deposited by HVOF, ESD and LC techniques. As expected, the coatings’ topography, microstructure, hardness, friction and wear properties were depended on the coating composition and deposition technique. The main following conclusions from the study are:
- The results indicate that the HVOF and LC were more efficient deposition techniques than ESD in the powder melting of all elements, producing a relatively even surface and cross-section microstructure for both HEA compositions (Co19Cr17Fe19Ni18Mo27 and Co20Cr20Fe20Ni20Mo20). The surface morphology correlated with the topographic features. Accordingly, the surface roughness was very large in all cases, representing a potential concern during running-in for practical applications.
- The results showed that Co19Cr17Fe19Ni18Mo27 had better mechanical and tribological performance than Co20Cr20Fe20Ni20Mo20. The Co19Cr17Fe19Ni18Mo27 had lower roughness, coefficient of friction and wear rates compared to the equiatomic Co20Cr20Fe20Ni20Mo20 HEA coating.
- Three major phases: A mixture of FCC and BCC and a residual BCC phase linked to the Mo element were detected in both HEAC compositions, and additionally two intermetallics (σ phase and Mo-rich phase concluded as µ phase). In Co19Cr17Fe19Ni18Mo27, a mixture of σ and µ phase precipitation occurred, while the µ phase was only observed in Co20Cr20Fe20Ni20Mo20.
- The variation in microstructure and hardness of each coating was explained by the difference in Mo content in the coatings, which contributed to improved resistance to deformation through the formation of BCC, σ and presumably the µ phases.
- The coatings wore out by a mixed-abrasive and oxidative wear mechanism for the HVOF HEACs. For ESD HEACs and LC HEACs, delamination occurred in areas where abrasive wear was severe and transitioned into adhesive wear, but the adhesive oxidative layers compromised excessive surface damage.
- Despite Co19Cr17Fe19Ni18Mo27 coating producing better results than Co20Cr20Fe20Ni20Mo20 from this study, more research on the coating properties would be beneficial before usage in a geothermal environment, such as corrosion resistance, due to the complex microstructure produced from mechanical alloying and the powder deposition, which plays a crucial role in the performance of the alloys.
Author Contributions
Investigation, A.M.O., B.G.G. and G.O.B.; Data curation, I.C., L.E.G. and F.F.; Conceptualization, Visualization, Formal analysis, Validation, Writing—original draft preparation, G.O.B.; Supervision, D.K. and S.N.K.; Conceptualization, Validation, Formal analysis, Writing—review and editing, S.N.K. All authors have read and agreed to the published version of the manuscript.
Funding
This work was part of the H2020 EU Geo-Coat project. This project received funding from the European Union’s Horizon 2020 research and innovation programme under grant agreement number “764086”.
Institutional Review Board Statement
Not applicable.
Informed Consent Statement
Not applicable.
Data Availability Statement
Not applicable.
Acknowledgments
The authors would also like to acknowledge the resources and collaborative efforts provided by the consortium of the GeoCoat project.
Conflicts of Interest
The authors declare no conflict of interest.
References
- Hoornaert, T.; Hua, Z.K.; Zhang, J.H. Hard Wear-Resistant Coatings: A Review. In Advanced Tribology; Springer: Berlin/Heidelberg, Germany, 2009; pp. 774–779. [Google Scholar] [CrossRef]
- Yeh, J.-W.; Chen, S.K.; Lin, S.-J.; Gan, J.-Y.; Chin, T.-S.; Shun, T.-T.; Tsau, C.-H.; Chang, S.-Y. Nanostructured High-Entropy Alloys with Multiple Principal Elements: Novel Alloy Design Concepts and Outcomes. Adv. Eng. Mater. 2004, 6, 299–303. [Google Scholar] [CrossRef]
- Ye, Y.; Wang, Q.; Lu, J.; Liu, C.; Yang, Y. High-entropy alloy: Challenges and prospects. Mater. Today 2016, 19, 349–362. [Google Scholar] [CrossRef]
- Miracle, D.B.; Miller, J.D.; Senkov, O.N.; Woodward, C.; Uchic, M.D.; Tiley, J. Exploration and Development of High Entropy Alloys for Structural Applications. Entropy 2014, 16, 494–525. [Google Scholar] [CrossRef]
- Senkov, O.N.; Miracle, D.B.; Chaput, K.J.; Couzinie, J.-P. Development and exploration of refractory high entropy alloys—A review. J. Mater. Res. 2018, 33, 3092–3128. [Google Scholar] [CrossRef] [Green Version]
- Liu, W.; Lu, Z.; He, J.; Luan, J.; Wang, Z.; Liu, B.; Liu, Y.; Chen, M.; Liu, C. Ductile CoCrFeNiMox high entropy alloys strengthened by hard intermetallic phases. Acta Mater. 2016, 116, 332–342. [Google Scholar] [CrossRef]
- Senkov, O.; Senkova, S.; Woodward, C.; Miracle, D. Low-density, refractory multi-principal element alloys of the Cr–Nb–Ti–V–Zr system: Microstructure and phase analysis. Acta Mater. 2013, 61, 1545–1557. [Google Scholar] [CrossRef]
- Shu, F.; Yang, B.; Dong, S.; Zhao, H.; Xu, B.; Xu, F.; Liu, B.; He, P.; Feng, J. Effects of Fe-to-Co ratio on microstructure and mechanical properties of laser cladded FeCoCrBNiSi high-entropy alloy coatings. Appl. Surf. Sci. 2018, 450, 538–544. [Google Scholar] [CrossRef]
- Niu, Z.; Wang, Y.; Geng, C.; Xu, J.; Wang, Y. Microstructural evolution, mechanical and corrosion behaviors of as-annealed CoCrFeNiMox (x = 0, 0.2, 0.5, 0.8, 1) high entropy alloys. J. Alloys Compd. 2020, 820, 153273. [Google Scholar] [CrossRef]
- Lehtonen, J.; Koivuluoto, H.; Ge, Y.; Juselius, A.; Hannula, S.-P. Cold Gas Spraying of a High-Entropy CrFeNiMn Equiatomic Alloy. Coatings 2020, 10, 53. [Google Scholar] [CrossRef] [Green Version]
- Cantor, B.; Chang, I.T.H.; Knight, P.; Vincent, A.J.B. Microstructural development in equiatomic multicomponent alloys. Mater. Sci. Eng. A 2004, 375–377, 213–218. [Google Scholar] [CrossRef]
- Miao, J.; Guo, T.; Ren, J.; Zhang, A.; Su, B.; Meng, J. Optimization of mechanical and tribological properties of FCC CrCoNi multi-principal element alloy with Mo addition. Vacuum 2018, 149, 324–330. [Google Scholar] [CrossRef]
- Tsai, M.-H.; Tsai, R.-C.; Chang, T.; Huang, W.-F. Intermetallic Phases in High-Entropy Alloys: Statistical Analysis of their Prevalence and Structural Inheritance. Metals 2019, 9, 247. [Google Scholar] [CrossRef] [Green Version]
- Shun, T.-T.; Chang, L.-Y.; Shiu, M.-H. Microstructure and mechanical properties of multiprincipal component CoCrFeNiMox alloys. Mater. Charact. 2012, 70, 63–67. [Google Scholar] [CrossRef]
- Ni, C.; Shi, Y.; Liu, J.; Huang, G. Characterization of Al0.5FeCu0.7NiCoCr high-entropy alloy coating on aluminum alloy by laser cladding. Opt. Laser Technol. 2018, 105, 257–263. [Google Scholar] [CrossRef]
- Zhang, G.; Liu, H.; Tian, X.; Chen, P.; Yang, H.; Hao, J. Microstructure and Properties of AlCoCrFeNiSi High-Entropy Alloy Coating on AISI 304 Stainless Steel by Laser Cladding. J. Mater. Eng. Perform. 2020, 29, 278–288. [Google Scholar] [CrossRef]
- Sharma, A. High Entropy Alloy Coatings and Technology. Coatings 2021, 11, 372. [Google Scholar] [CrossRef]
- Karlsdóttir, S. Corrosion, Scaling and Material Selection in Geothermal Power Production. In Comprehensive Renewable Energy; Elsevier: Amsterdam, The Netherlands, 2012; pp. 241–259. [Google Scholar] [CrossRef]
- Tsai, M.-H.; Fan, A.-C.; Wang, H.-A. Effect of atomic size difference on the type of major intermetallic phase in arc-melted CoCrFeNiX high-entropy alloys. J. Alloy. Compd. 2017, 695, 1479–1487. [Google Scholar] [CrossRef]
- Zhang, A.; Han, J.; Su, B.; Li, P.; Meng, J. Microstructure, mechanical properties and tribological performance of CoCrFeNi high entropy alloy matrix self-lubricating composite. Mater. Des. 2017, 114, 253–263. [Google Scholar] [CrossRef]
- Xiao, J.-K.; Tan, H.; Wu, Y.-Q.; Chen, J.; Zhang, C. Microstructure and wear behavior of FeCoNiCrMn high entropy alloy coating deposited by plasma spraying. Surf. Coat. Technol. 2020, 385, 125430. [Google Scholar] [CrossRef]
- Cui, Y.; Shen, J.; Manladan, S.M.; Geng, K.; Hu, S. Wear resistance of FeCoCrNiMnAlx high-entropy alloy coatings at high temperature. Appl. Surf. Sci. 2020, 512, 145736. [Google Scholar] [CrossRef]
- Lin, C.-M.; Tsai, H.-L. Evolution of microstructure, hardness, and corrosion properties of high-entropy Al0.5CoCrFeNi alloy. Intermetallics 2011, 19, 288–294. [Google Scholar] [CrossRef]
- Wang, W.-R.; Wang, W.-L.; Wang, S.-C.; Tsai, Y.-C.; Lai, C.-H.; Yeh, J.-W. Effects of Al addition on the microstructure and mechanical property of AlxCoCrFeNi high-entropy alloys. Intermetallics 2012, 26, 44–51. [Google Scholar] [CrossRef]
- Zhang, K.; Fu, Z.; Zhang, J.; Wang, W.; Wang, H.; Wang, Y.; Zhang, Q.; Shi, J. Microstructure and mechanical properties of CoCrFeNiTiAlx high-entropy alloys. Mater. Sci. Eng. A 2009, 508, 214–219. [Google Scholar] [CrossRef]
- Wu, J.-M.; Lin, S.-J.; Yeh, J.-W.; Chen, S.-K.; Huang, Y.-S.; Chen, H.-C. Adhesive wear behavior of AlxCoCrCuFeNi high-entropy alloys as a function of aluminum content. Wear 2006, 261, 513–519. [Google Scholar] [CrossRef] [Green Version]
- Cui, G.; Han, B.; Yang, Y.; Wang, Y.; Chunyang, H. Microstructure and tribological property of CoCrFeMoNi High entropy alloy treated by ion sulfurization. J. Mater. Res. Technol. 2020, 9, 2598–2609. [Google Scholar] [CrossRef]
- Deng, G.; Tieu, A.K.; Lan, X.; Su, L.; Wang, L.; Zhu, Q.; Zhu, H. Effects of normal load and velocity on the dry sliding tribological behaviour of CoCrFeNiMo0.2 high entropy alloy. Tribol. Int. 2019, 144, 106116. [Google Scholar] [CrossRef]
- Mu, Y.; Jia, Y.; Xu, L.; Tan, X.; Yi, J.; Wang, G.; Liaw, P. Nano oxides reinforced high-entropy alloy coatings synthesized by atmospheric plasma spraying. Mater. Res. Lett. 2019, 7, 312–319. [Google Scholar] [CrossRef]
- Fanicchia, F.; Csaki, I.; Geambazu, L.E.; Begg, H.; Paul, S. Effect of Microstructural Modifications on the Corrosion Resistance of CoCrFeMo0.85Ni Compositionally Complex Alloy Coatings. Coatings 2019, 9, 695. [Google Scholar] [CrossRef] [Green Version]
- Boakye, G.O.; Kovalov, D.; Thórhallsson, A.Í.; Karlsdóttir, S.N.; Motoiu, V. Friction and Wear Behaviour of Surface Coatings for Geothermal Applications. In Proceedings of the World Geothermal Congress 2020 + 1, Reykjavik, Iceland, 24–27 October 2021; pp. 1–9. [Google Scholar]
- ASTM, G99; Standard Test Method for Wear Testing with a Pin-on-Disk Apparatus. ASTM Int.: West Conshohocken, PA, USA, 2016; Volume G99, pp. 1–5. [CrossRef]
- Archard, J.F. Contact and Rubbing of Flat Surfaces. J. Appl. Phys. 1953, 24, 981–988. [Google Scholar] [CrossRef]
- Mannem, U.D.; Anand, K.; Gray, D.M.; Ghasripoor, F. Protective Coatings Which Provide Wear Resistance and Low Friction Characteristics, and Related Articles and Methods, 11/610,826. 2008. Available online: https://patents.google.com/patent/US20080145649A1/en (accessed on 16 July 2019).
- Perez, R.X.; Lawhon, D.W. Installation, Commissioning and First Solo Run. In Operator’s Guide to General Purpose Steam Turbines: An Overview of Operating Principles, Construction, Best Practices, and Troubleshooting, 1st ed.; John Wiley & Sons, Inc.: Salem, MA, USA, 2016; pp. 147–186. [Google Scholar]
- Perez, R.X.; Lawhon, D.W. Operator’s Guide to General Purpose Steam Turbines. In Operator’s Guide to General Purpose Steam Turbines: An Overview of Operating Principles, Construction, Best Practices, and Troubleshooting; Wiley: Salem, MA, USA, 2016. [Google Scholar] [CrossRef]
- Hsu, U.; Hung, U.; Yeh, J.; Chen, S.; Huang, Y.; Yang, C. Alloying behavior of iron, gold and silver in AlCoCrCuNi-based equimolar high-entropy alloys. Mater. Sci. Eng. A 2007, 460–461, 403–408. [Google Scholar] [CrossRef]
- Xie, Y.-J.; Wang, M.-C. Microstructural morphology of electrospark deposition layer of a high gamma prime superalloy. Surf. Coat. Technol. 2006, 201, 691–698. [Google Scholar] [CrossRef]
- Karlsdottir, S.N.; Geambazu, L.E.; Csaki, I.; Thorhallsson, A.I.; Stefanoiu, R.; Magnus, F.; Cotrut, C. Phase Evolution and Microstructure Analysis of CoCrFeNiMo High-Entropy Alloy for Electro-Spark-Deposited Coatings for Geothermal Environment. Coatings 2019, 9, 406. [Google Scholar] [CrossRef] [Green Version]
- Dong, Z.; Sergeev, D.; Dodge, M.F.; Fanicchia, F.; Müller, M.; Paul, S. Microstructure and Thermal Analysis of Metastable Intermetallic Phases in High-Entropy Alloy CoCrFeMo0.85Ni. Materials 2021, 14, 1073. [Google Scholar] [CrossRef] [PubMed]
- Niemann, R.; Backen, A.; Kauffmann-Weiss, S.; Behler, C.; Rößler, U.; Seiner, H.; Heczko, O.; Nielsch, K.; Schultz, L.; Fähler, S. Nucleation and growth of hierarchical martensite in epitaxial shape memory films. Acta Mater. 2017, 132, 327–334. [Google Scholar] [CrossRef] [Green Version]
- Yang, J.; Li, X.; Li, F.; Wang, W.; Li, Z.; Li, G.; Xie, H. Effect of Cooling Method on Formability of Laser Cladding IN718 Alloy. Materials 2021, 14, 3734. [Google Scholar] [CrossRef]
- Chen, R.; Qin, G.; Zheng, H.; Wang, L.; Su, Y.; Chiu, Y.L.; Ding, H.; Guo, J.; Fu, H. Composition design of high entropy alloys using the valence electron concentration to balance strength and ductility. Acta Mater. 2018, 144, 129–137. [Google Scholar] [CrossRef]
- Su, S.-Y.; Fan, Y.-T.; Su, Y.-J.; Huang, C.-W.; Tsai, M.-H.; Lu, M.-Y. Lattice distortion and atomic ordering of the sigma precipitates in CoCrFeNiMo high-entropy alloy. J. Alloys Compd. 2021, 851, 156909. [Google Scholar] [CrossRef]
- Shun, T.-T.; Chang, L.-Y.; Shiu, M.-H. Age-hardening of the CoCrFeNiMo0.85 high-entropy alloy. Mater. Charact. 2013, 81, 92–96. [Google Scholar] [CrossRef]
- Wu, Q.; Wang, Z.; He, F.; Li, J.; Wang, J. Revealing the Selection of σ and μ Phases in CoCrFeNiMox High Entropy Alloys by CALPHAD. J. Phase Equilibria Diffus. 2018, 39, 446–453. [Google Scholar] [CrossRef]
- Joseph, J.; Haghdadi, N.; Shamlaye, K.; Hodgson, P.; Barnett, M.; Fabijanic, D. The sliding wear behaviour of CoCrFeMnNi and AlxCoCrFeNi high entropy alloys at elevated temperatures. Wear 2019, 428–429, 32–44. [Google Scholar] [CrossRef]
- Sedlaček, M.; Podgornik, B.; Vižintin, J. Correlation between standard roughness parameters skewness and kurtosis and tribological behaviour of contact surfaces. Tribol. Int. 2012, 48, 102–112. [Google Scholar] [CrossRef]
- Menezes, P.L.; Kishore; Kailas, S.V. Influence of surface texture on coefficient of friction and transfer layer formation during sliding of pure magnesium pin on 080 M40 (EN8) steel plate. Wear 2006, 261, 578–591. [Google Scholar] [CrossRef]
- Zhao, D.; Yamaguchi, T.; Wang, W. Fabrication and wear performance of Al0.8FeCrCoNi high entropy alloy coating on magnesium alloy by resistance seam welding. Mater. Lett. 2020, 265, 127250. [Google Scholar] [CrossRef]
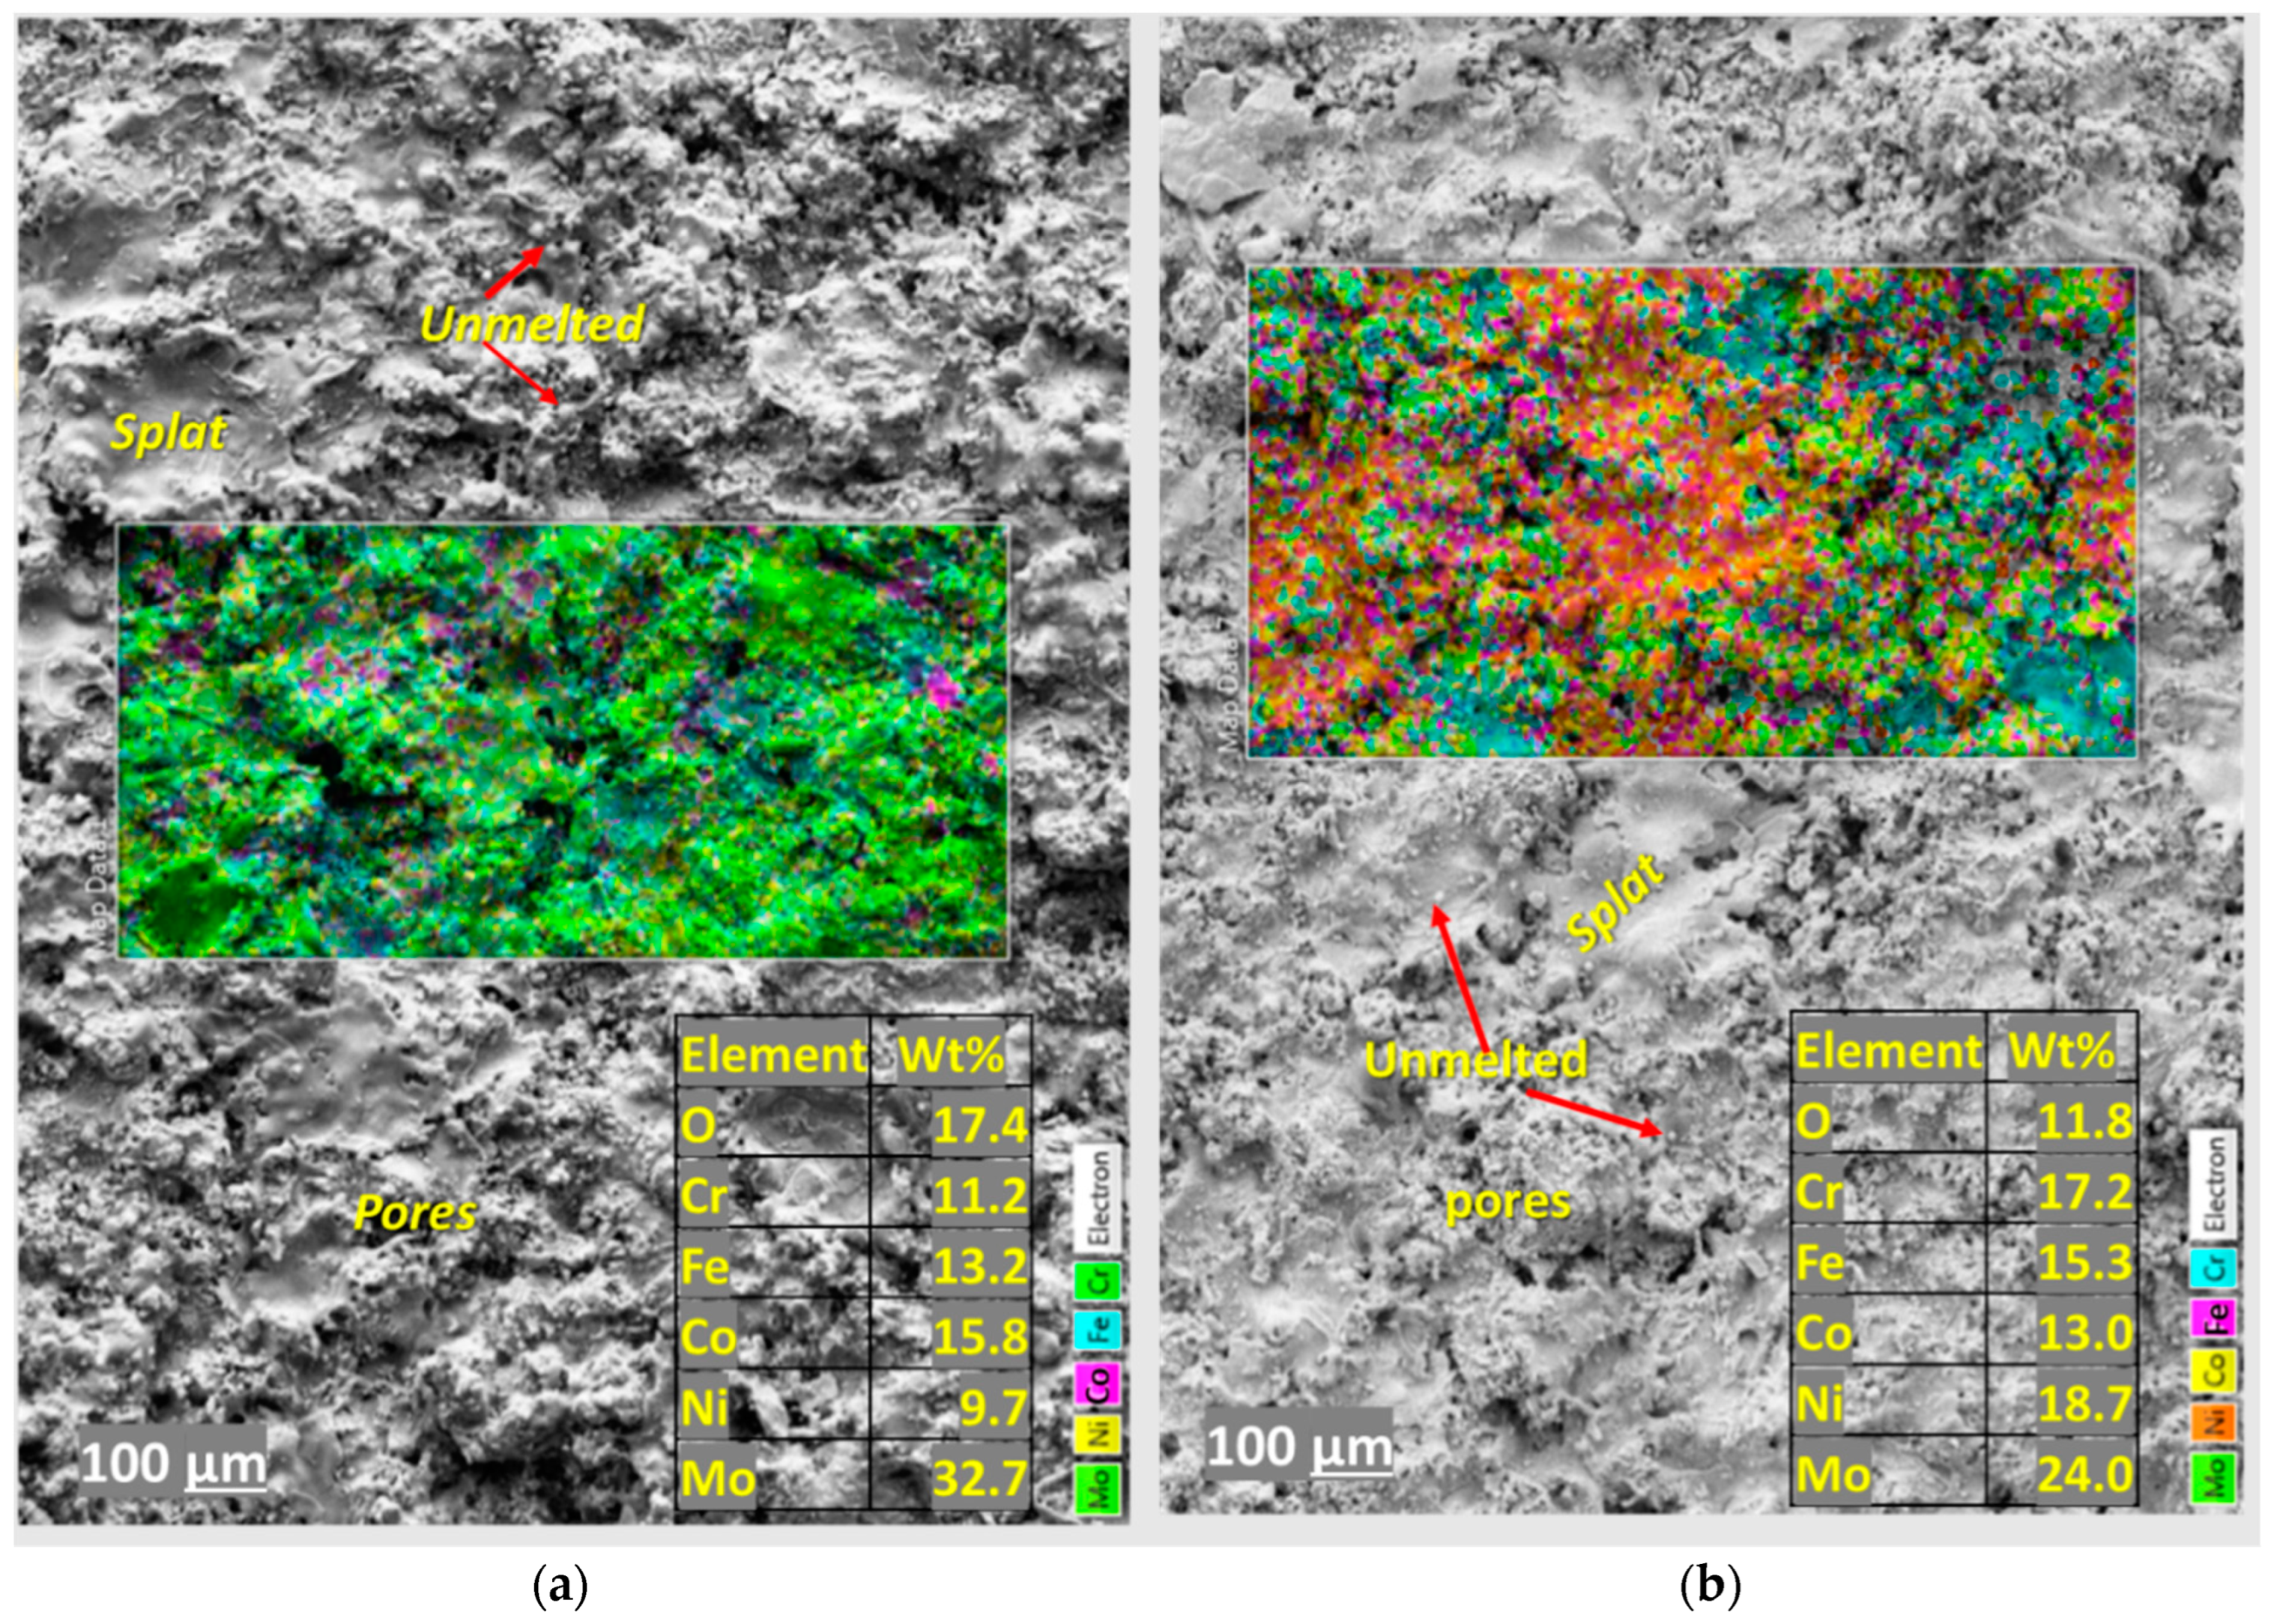


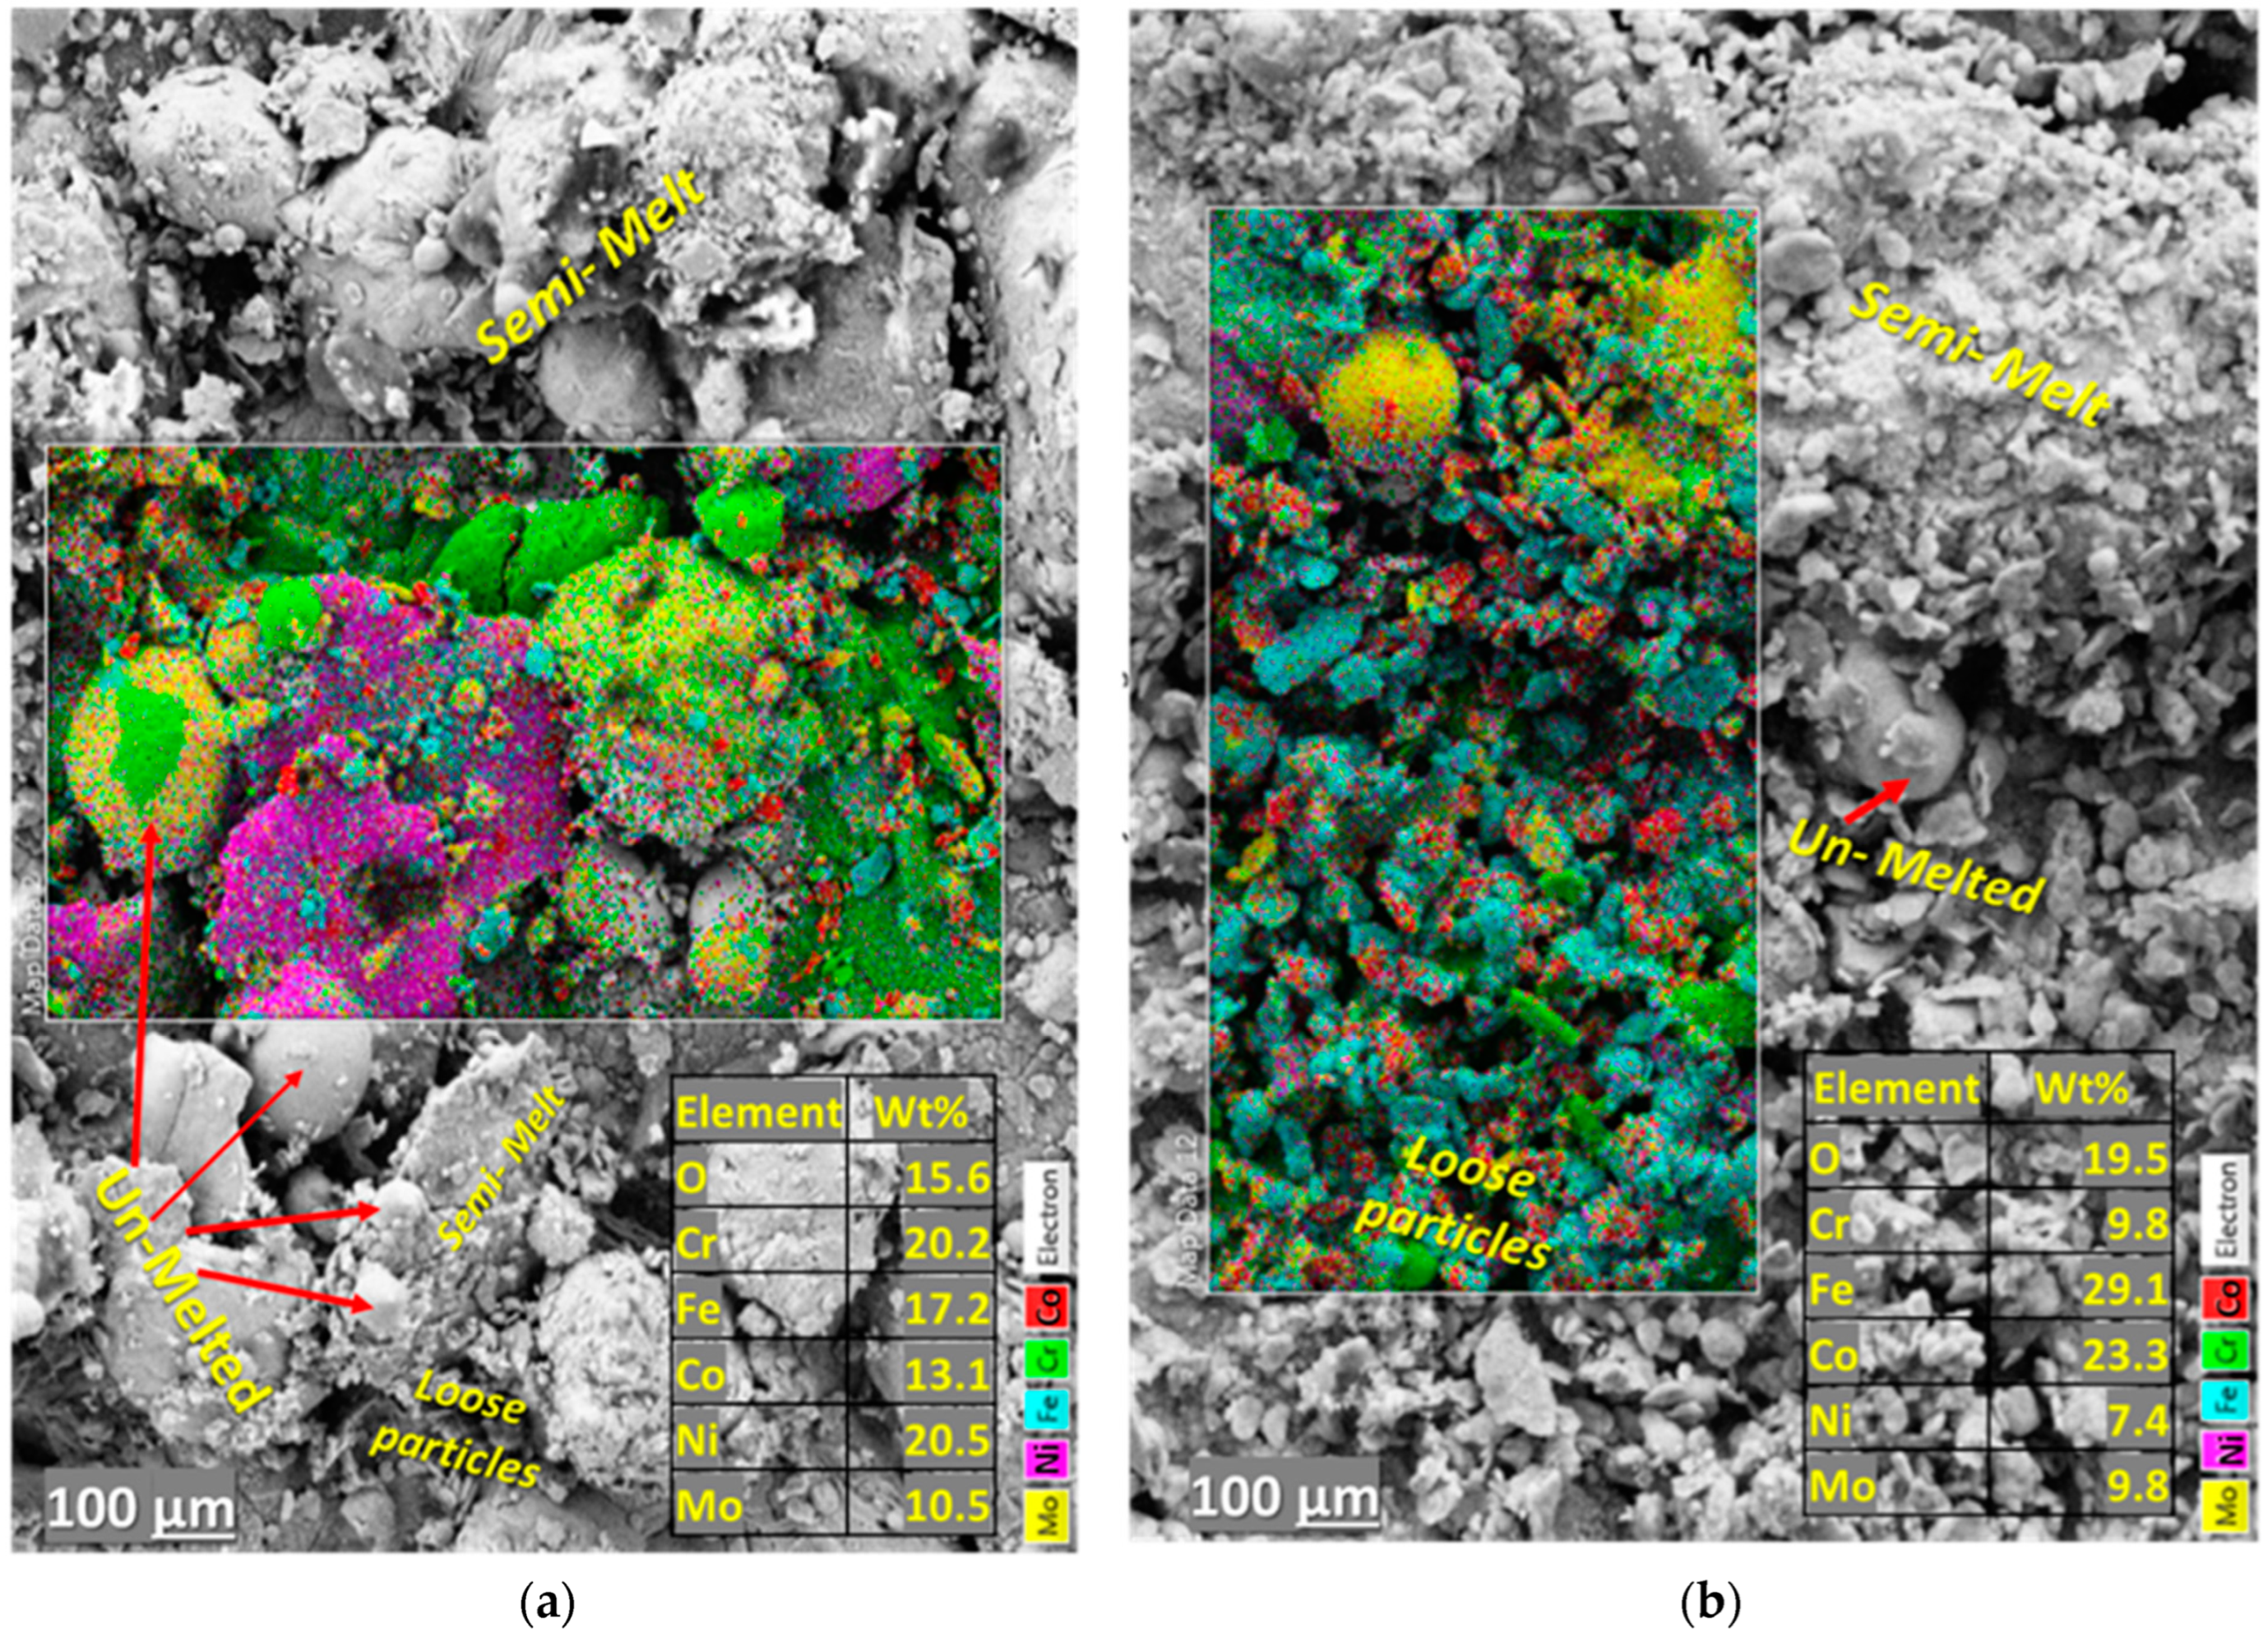

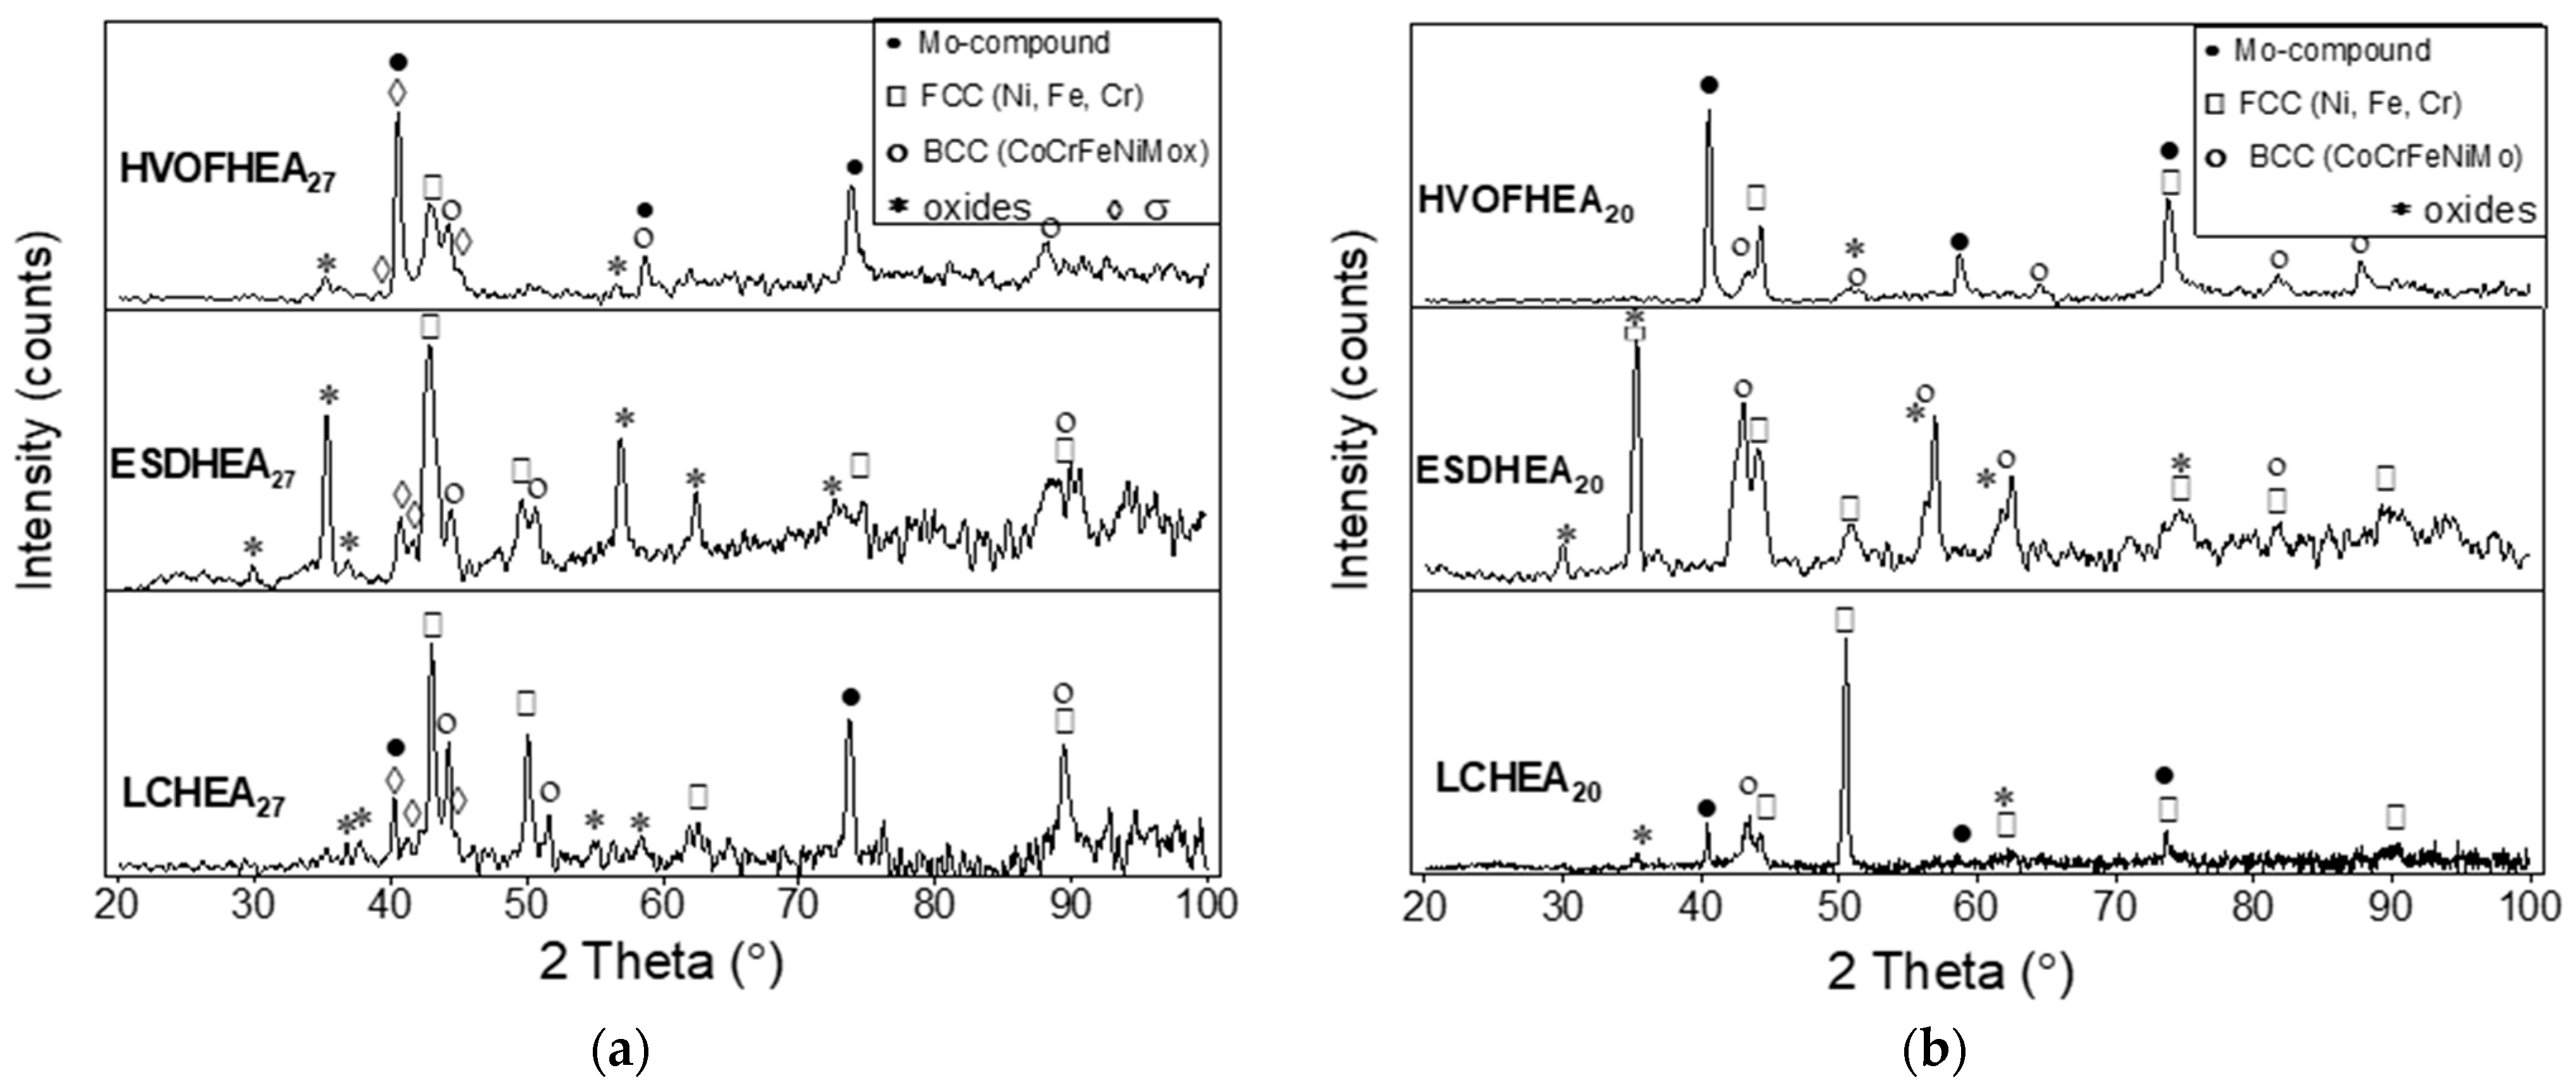
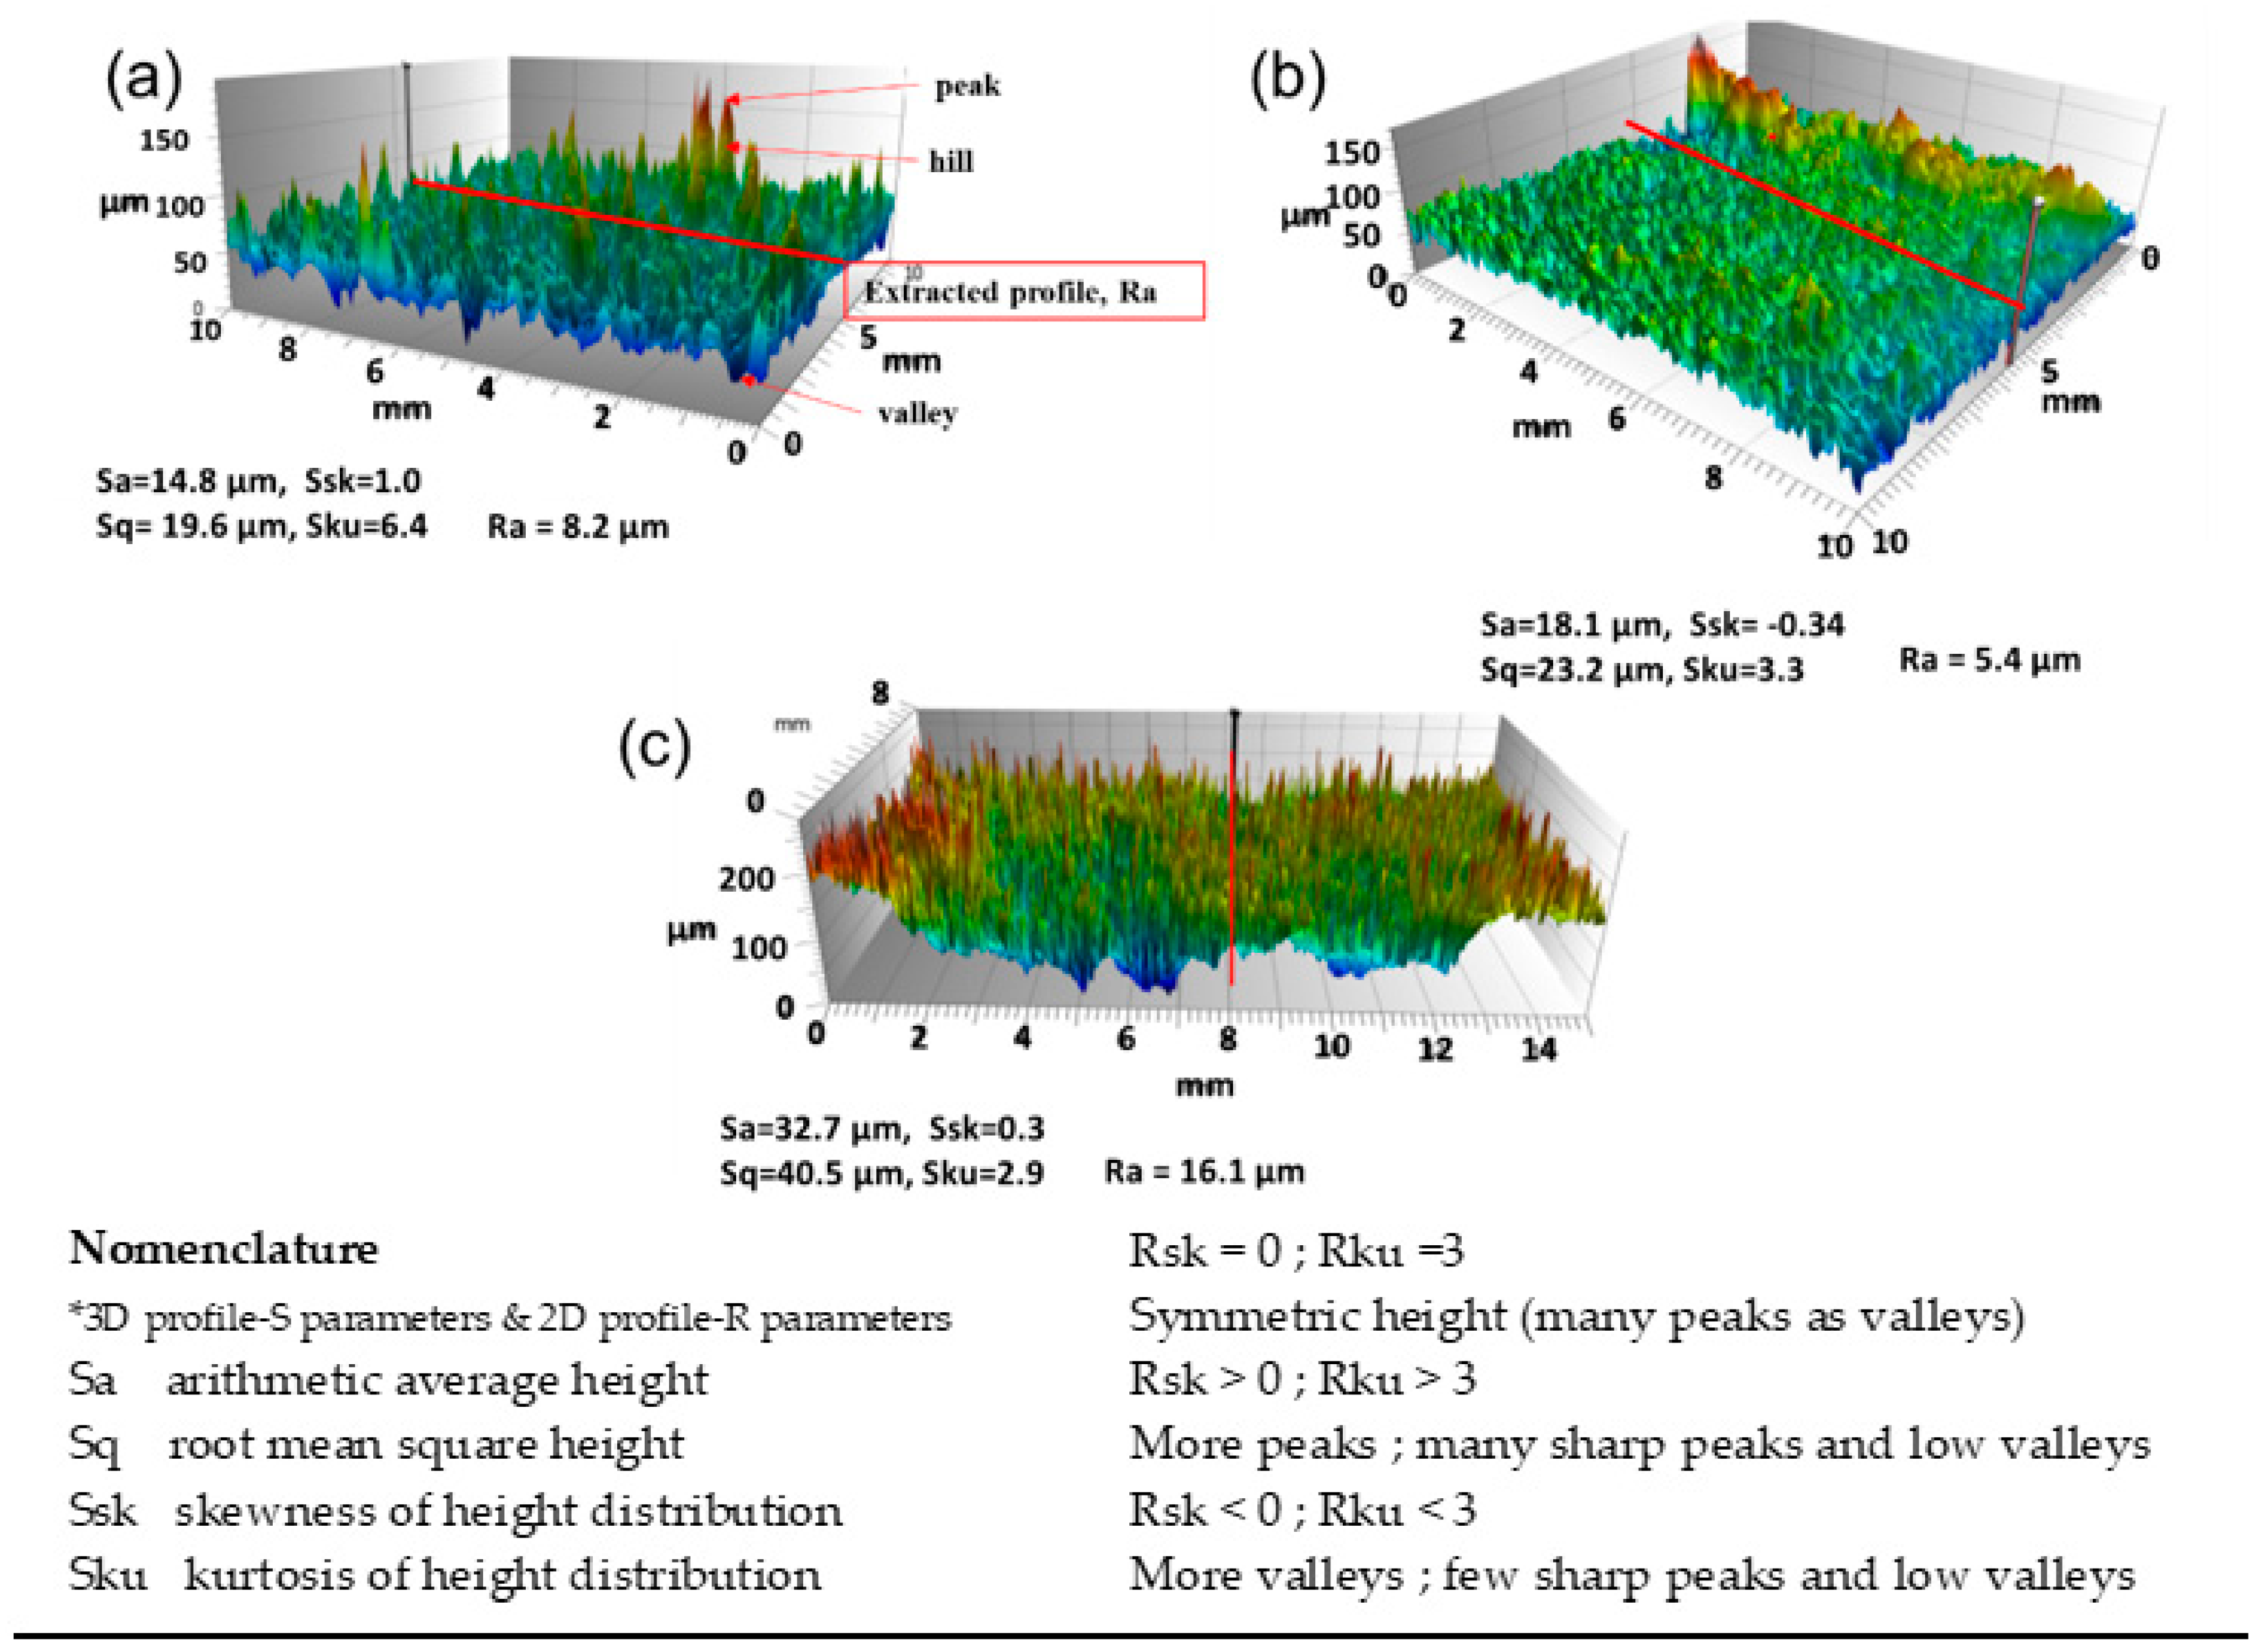
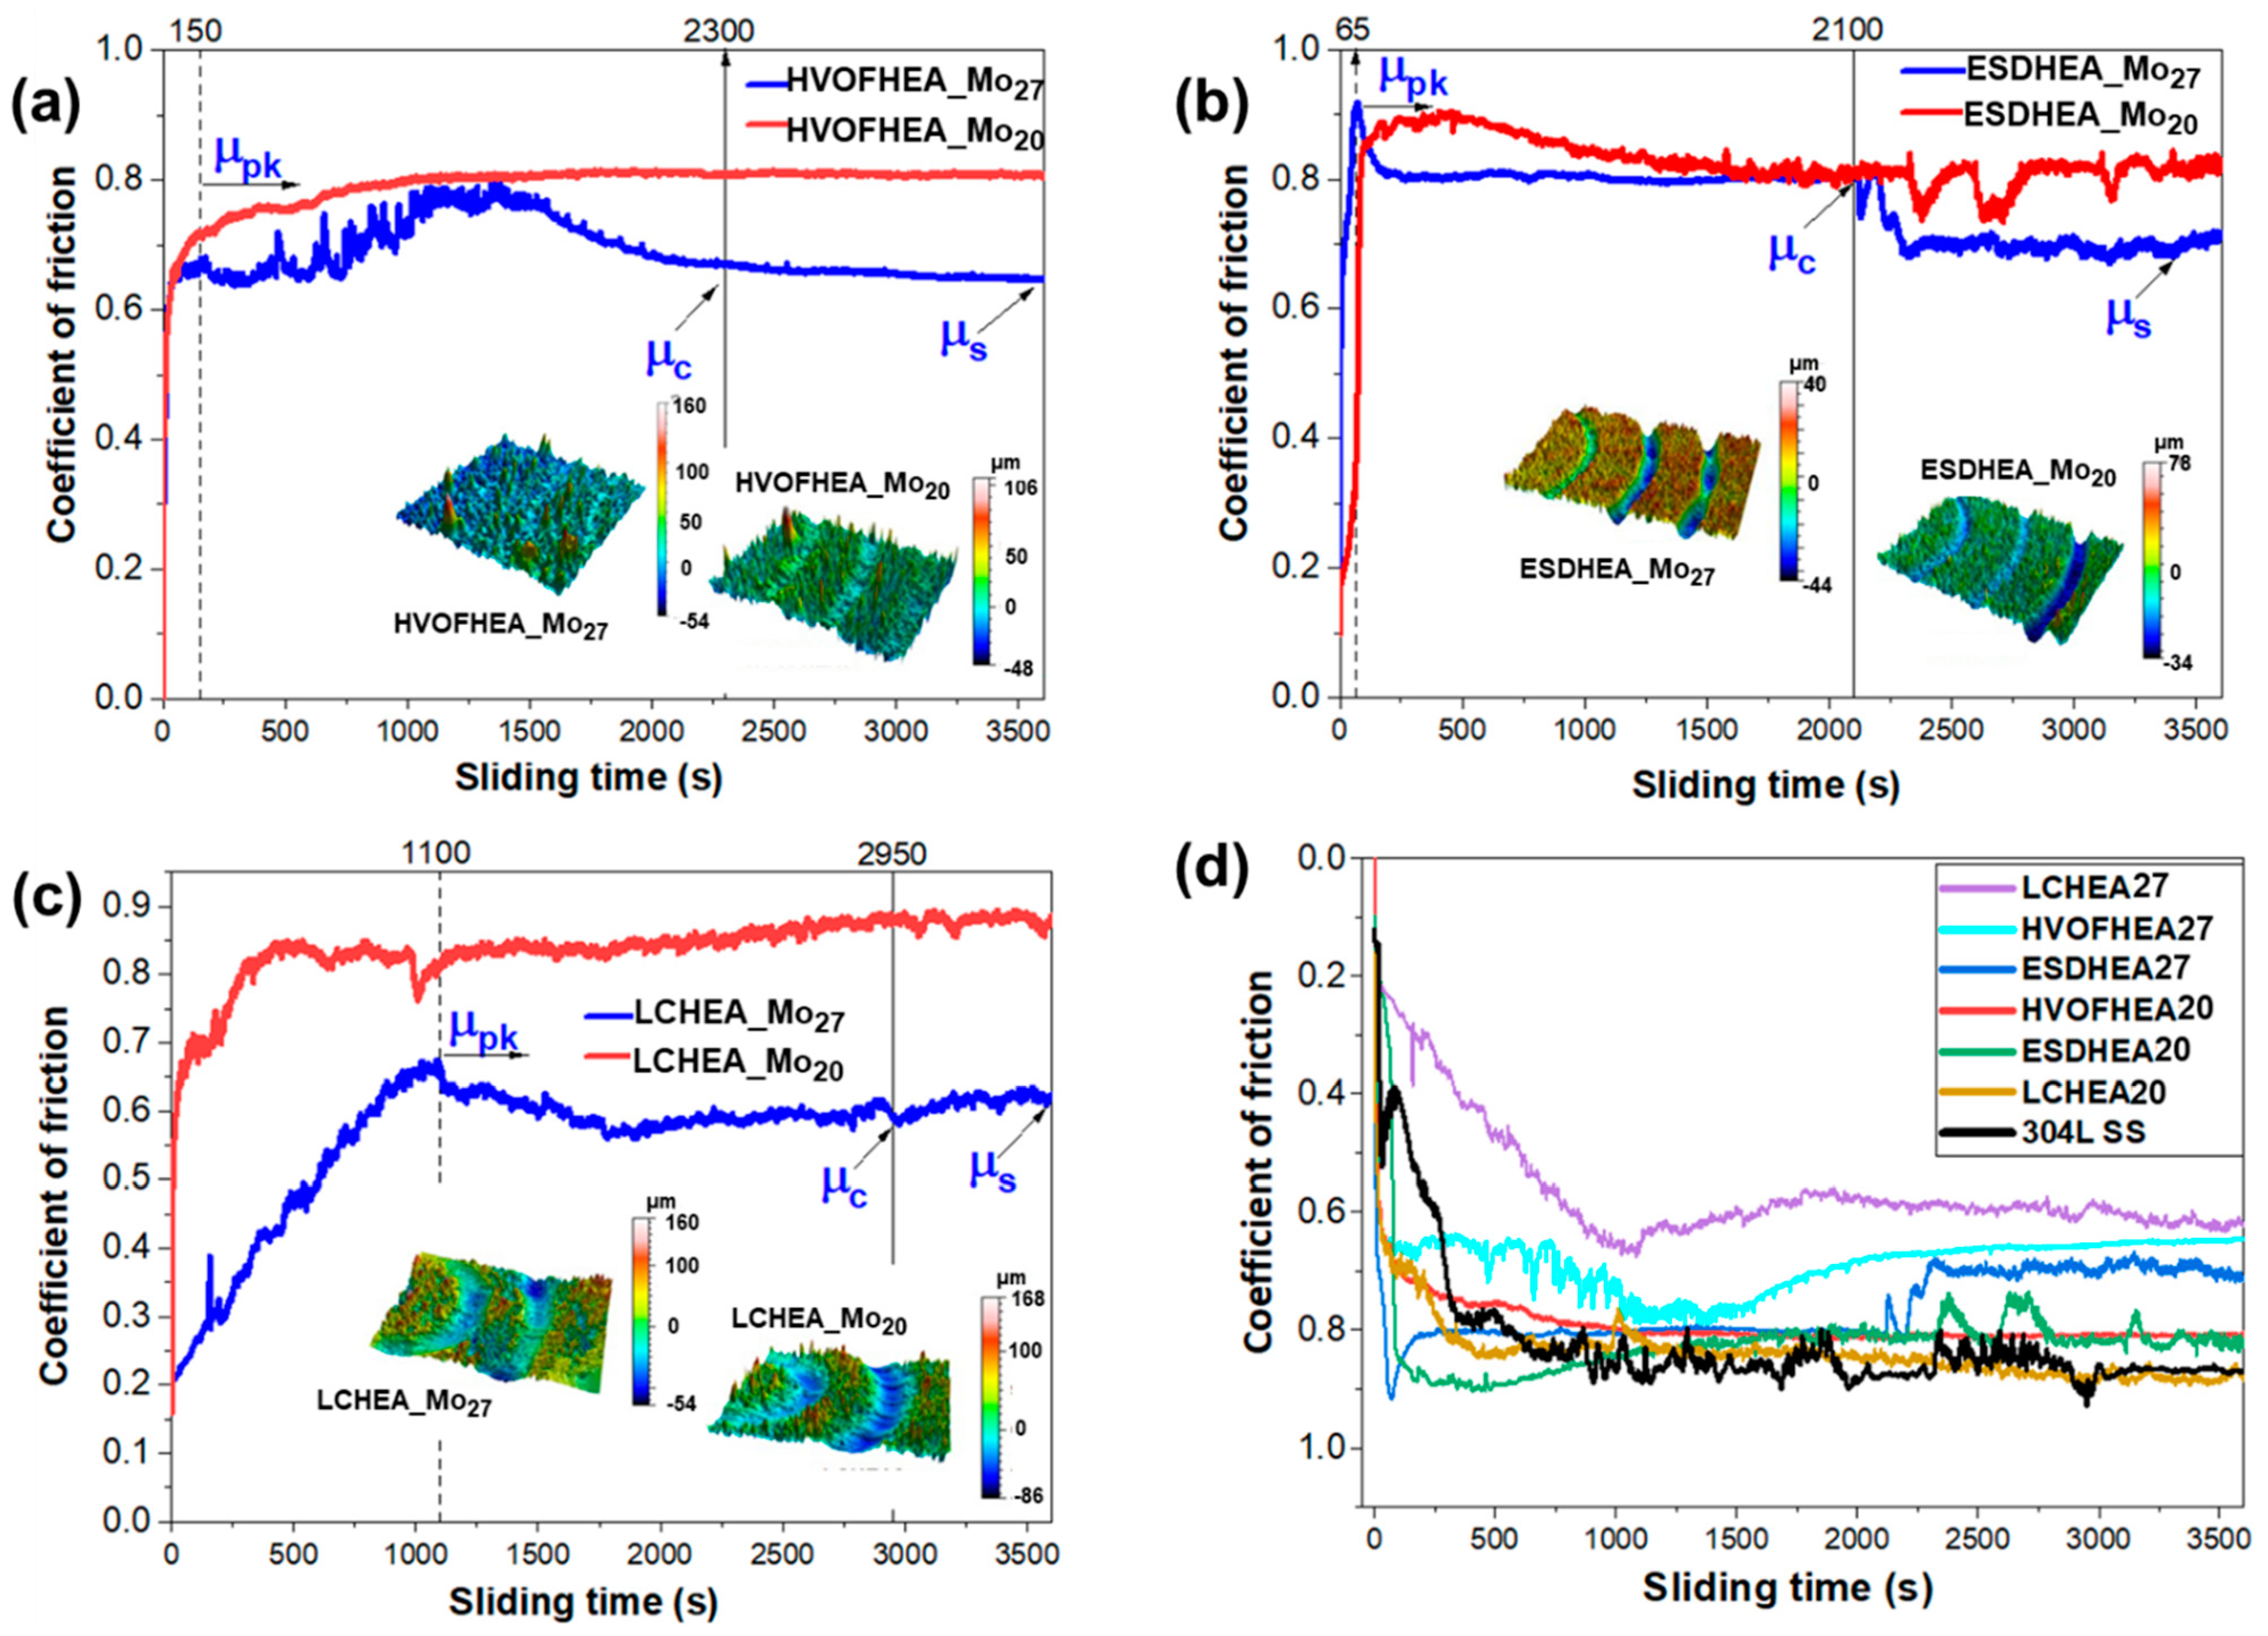
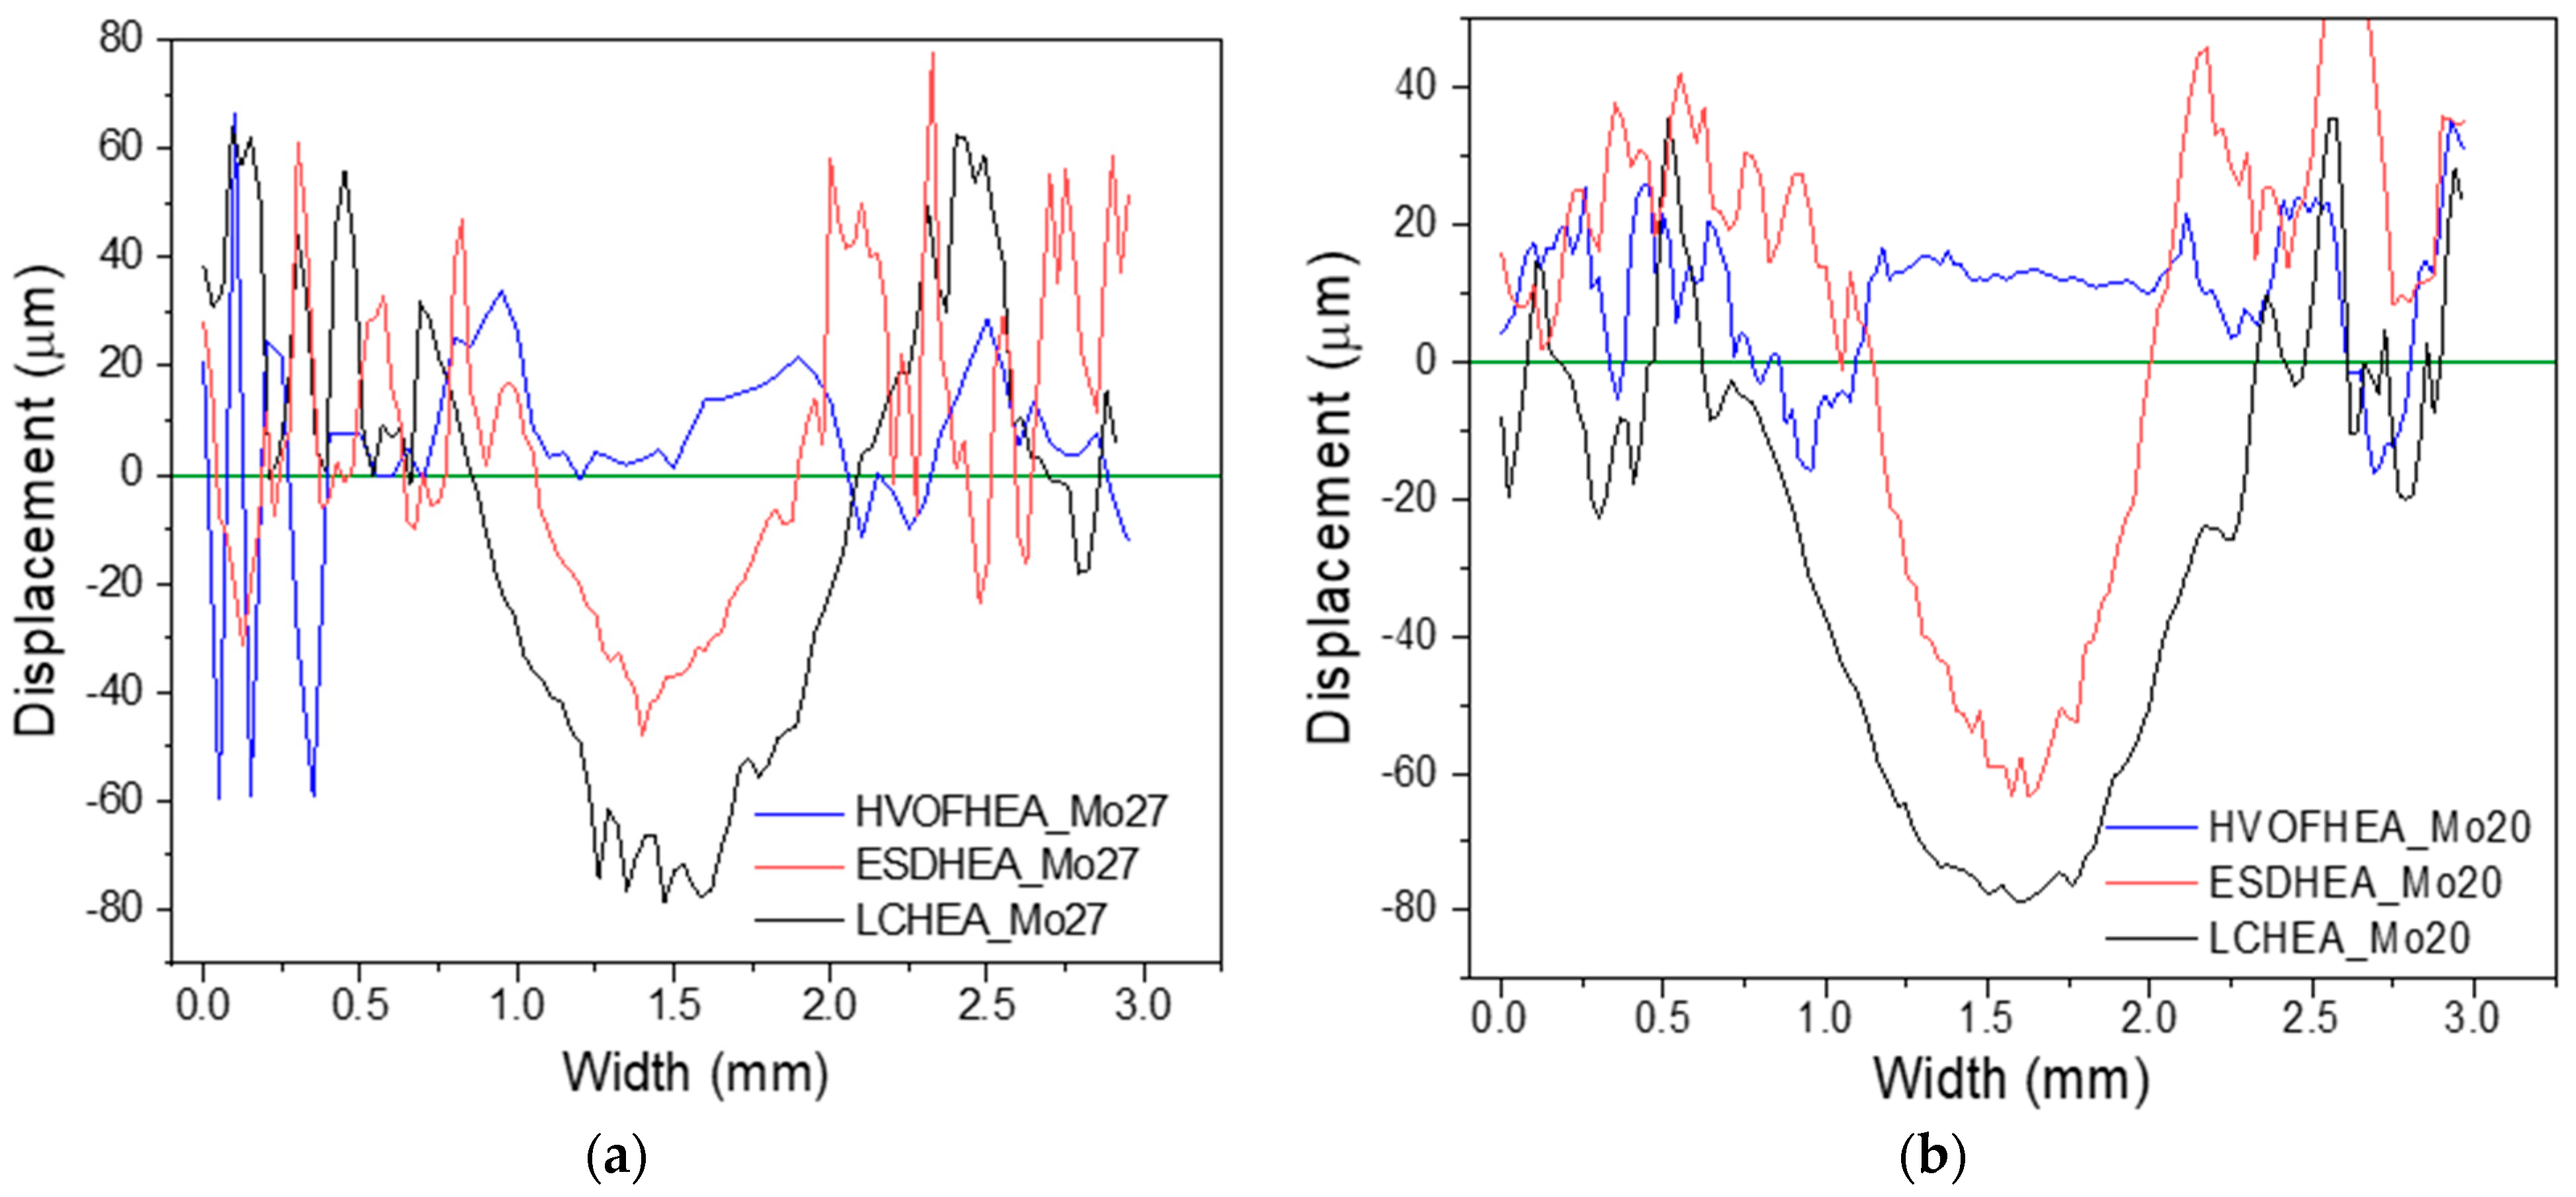

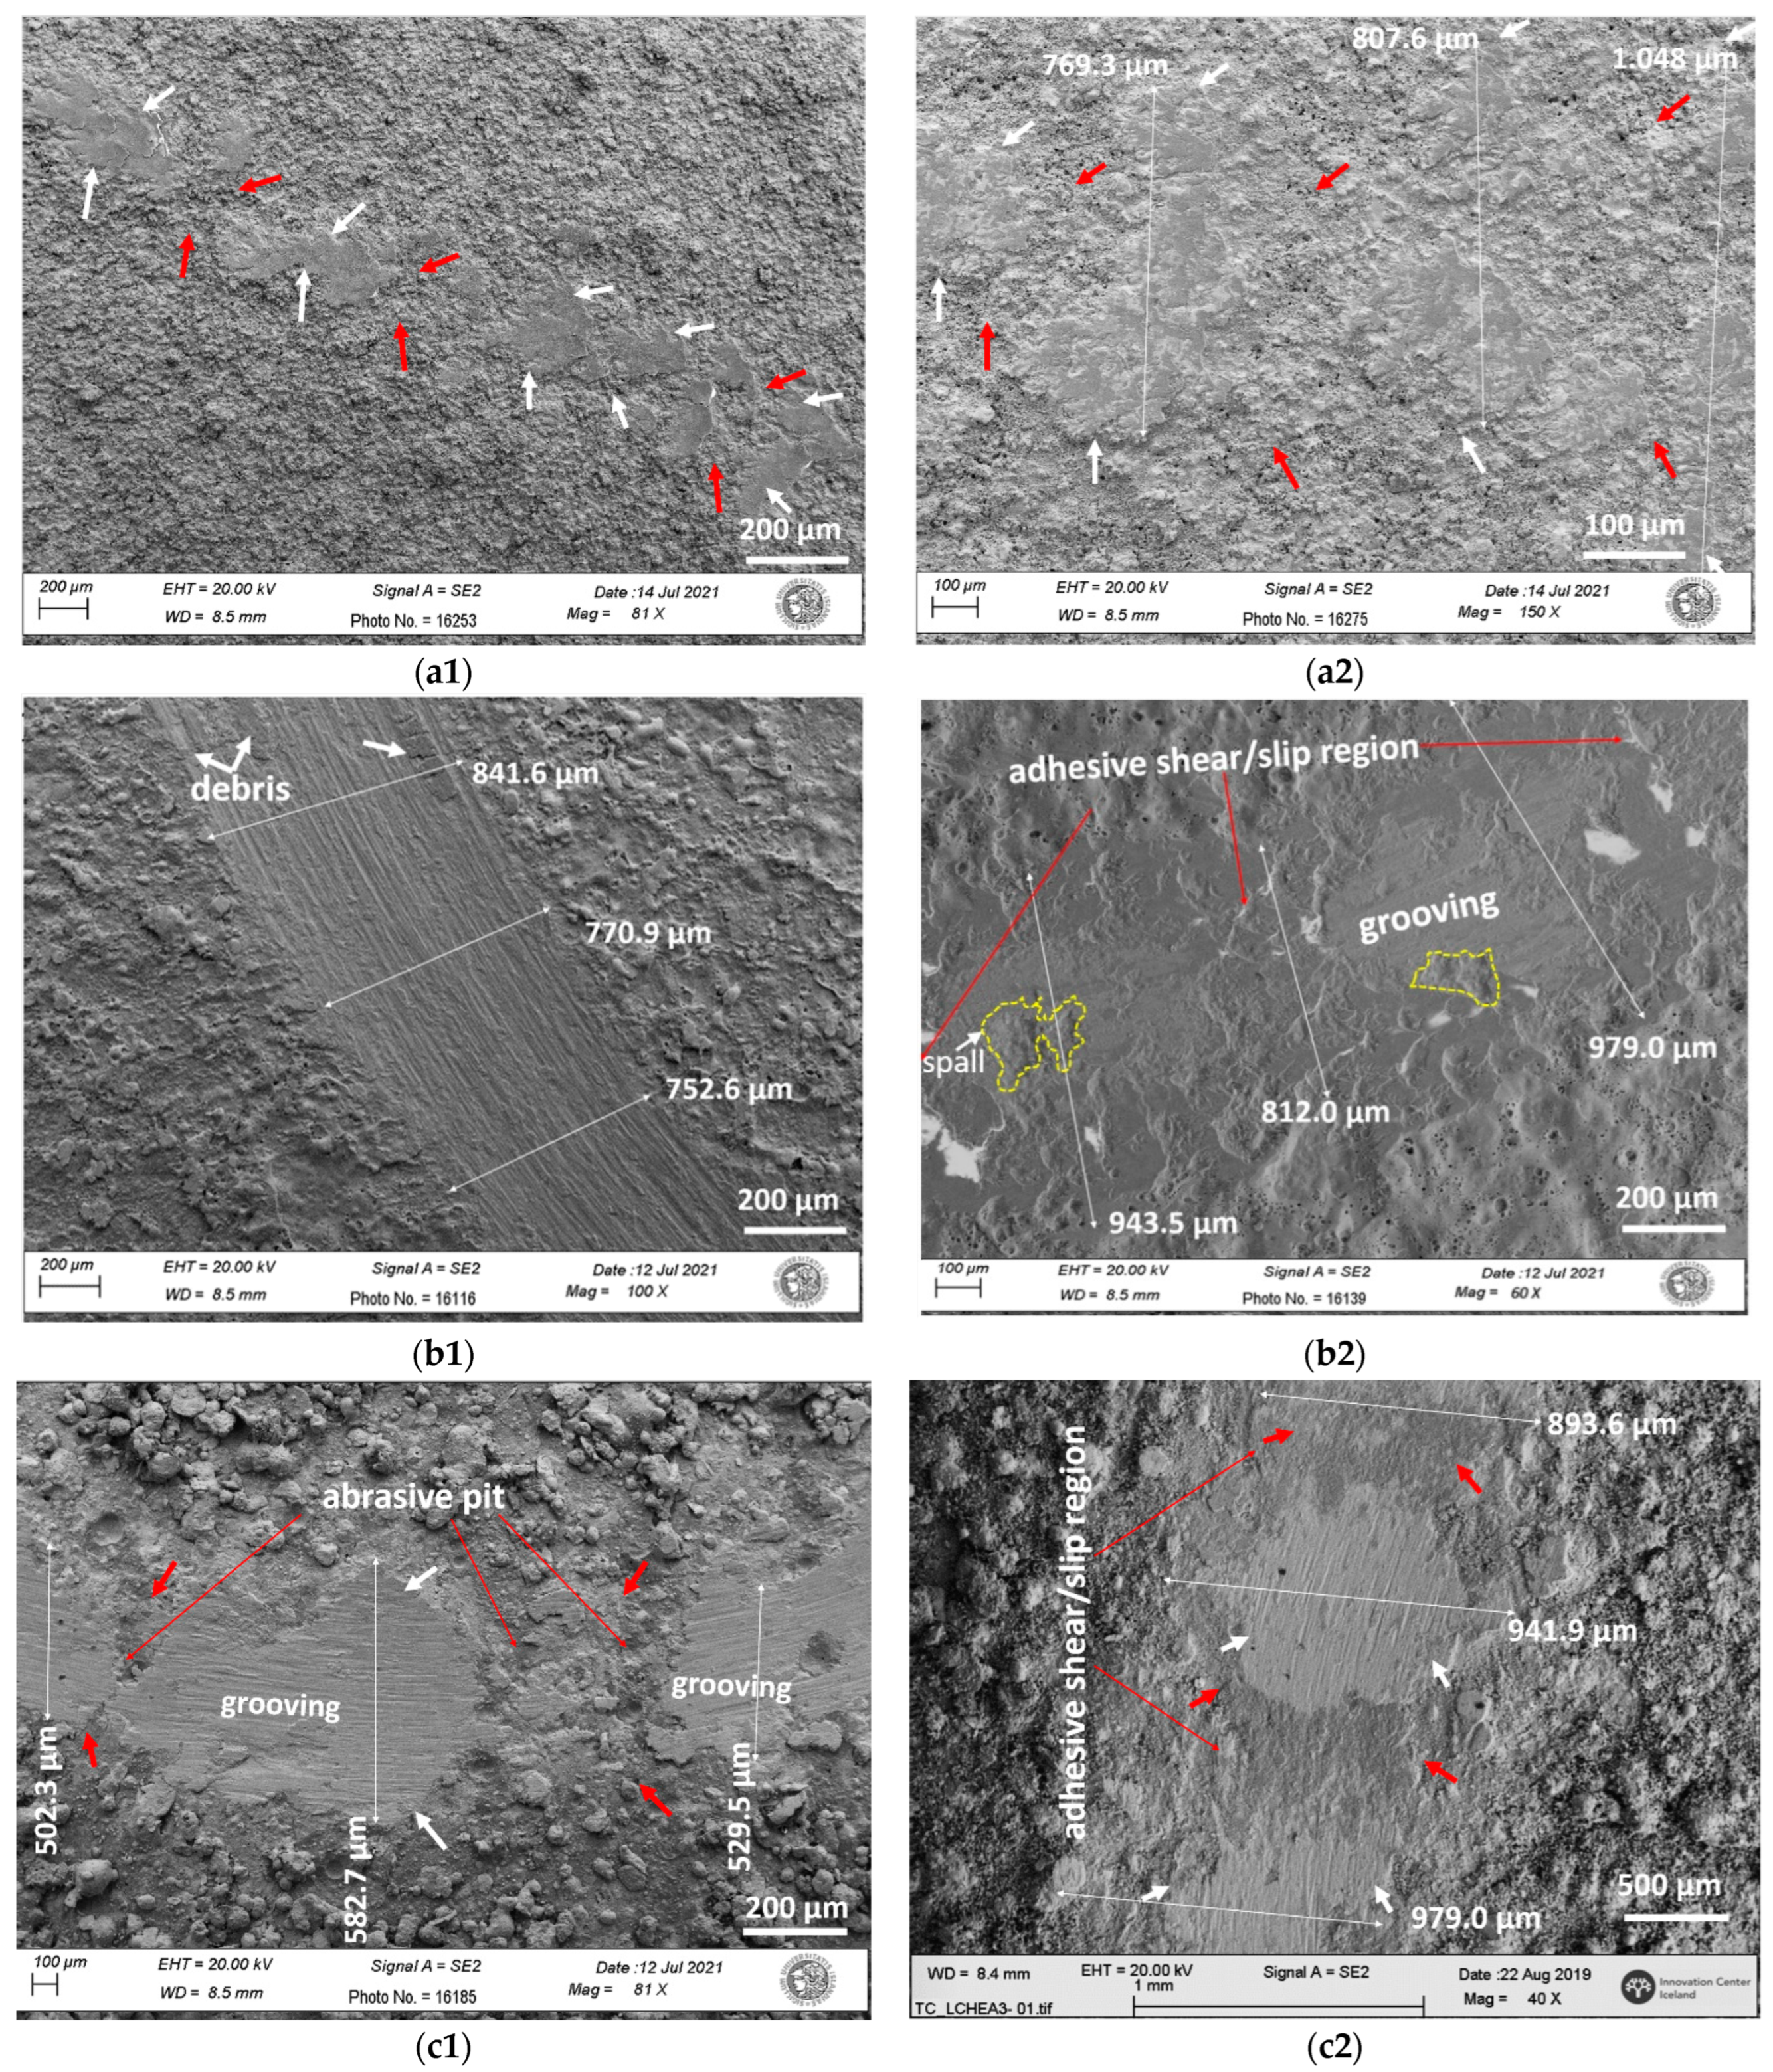
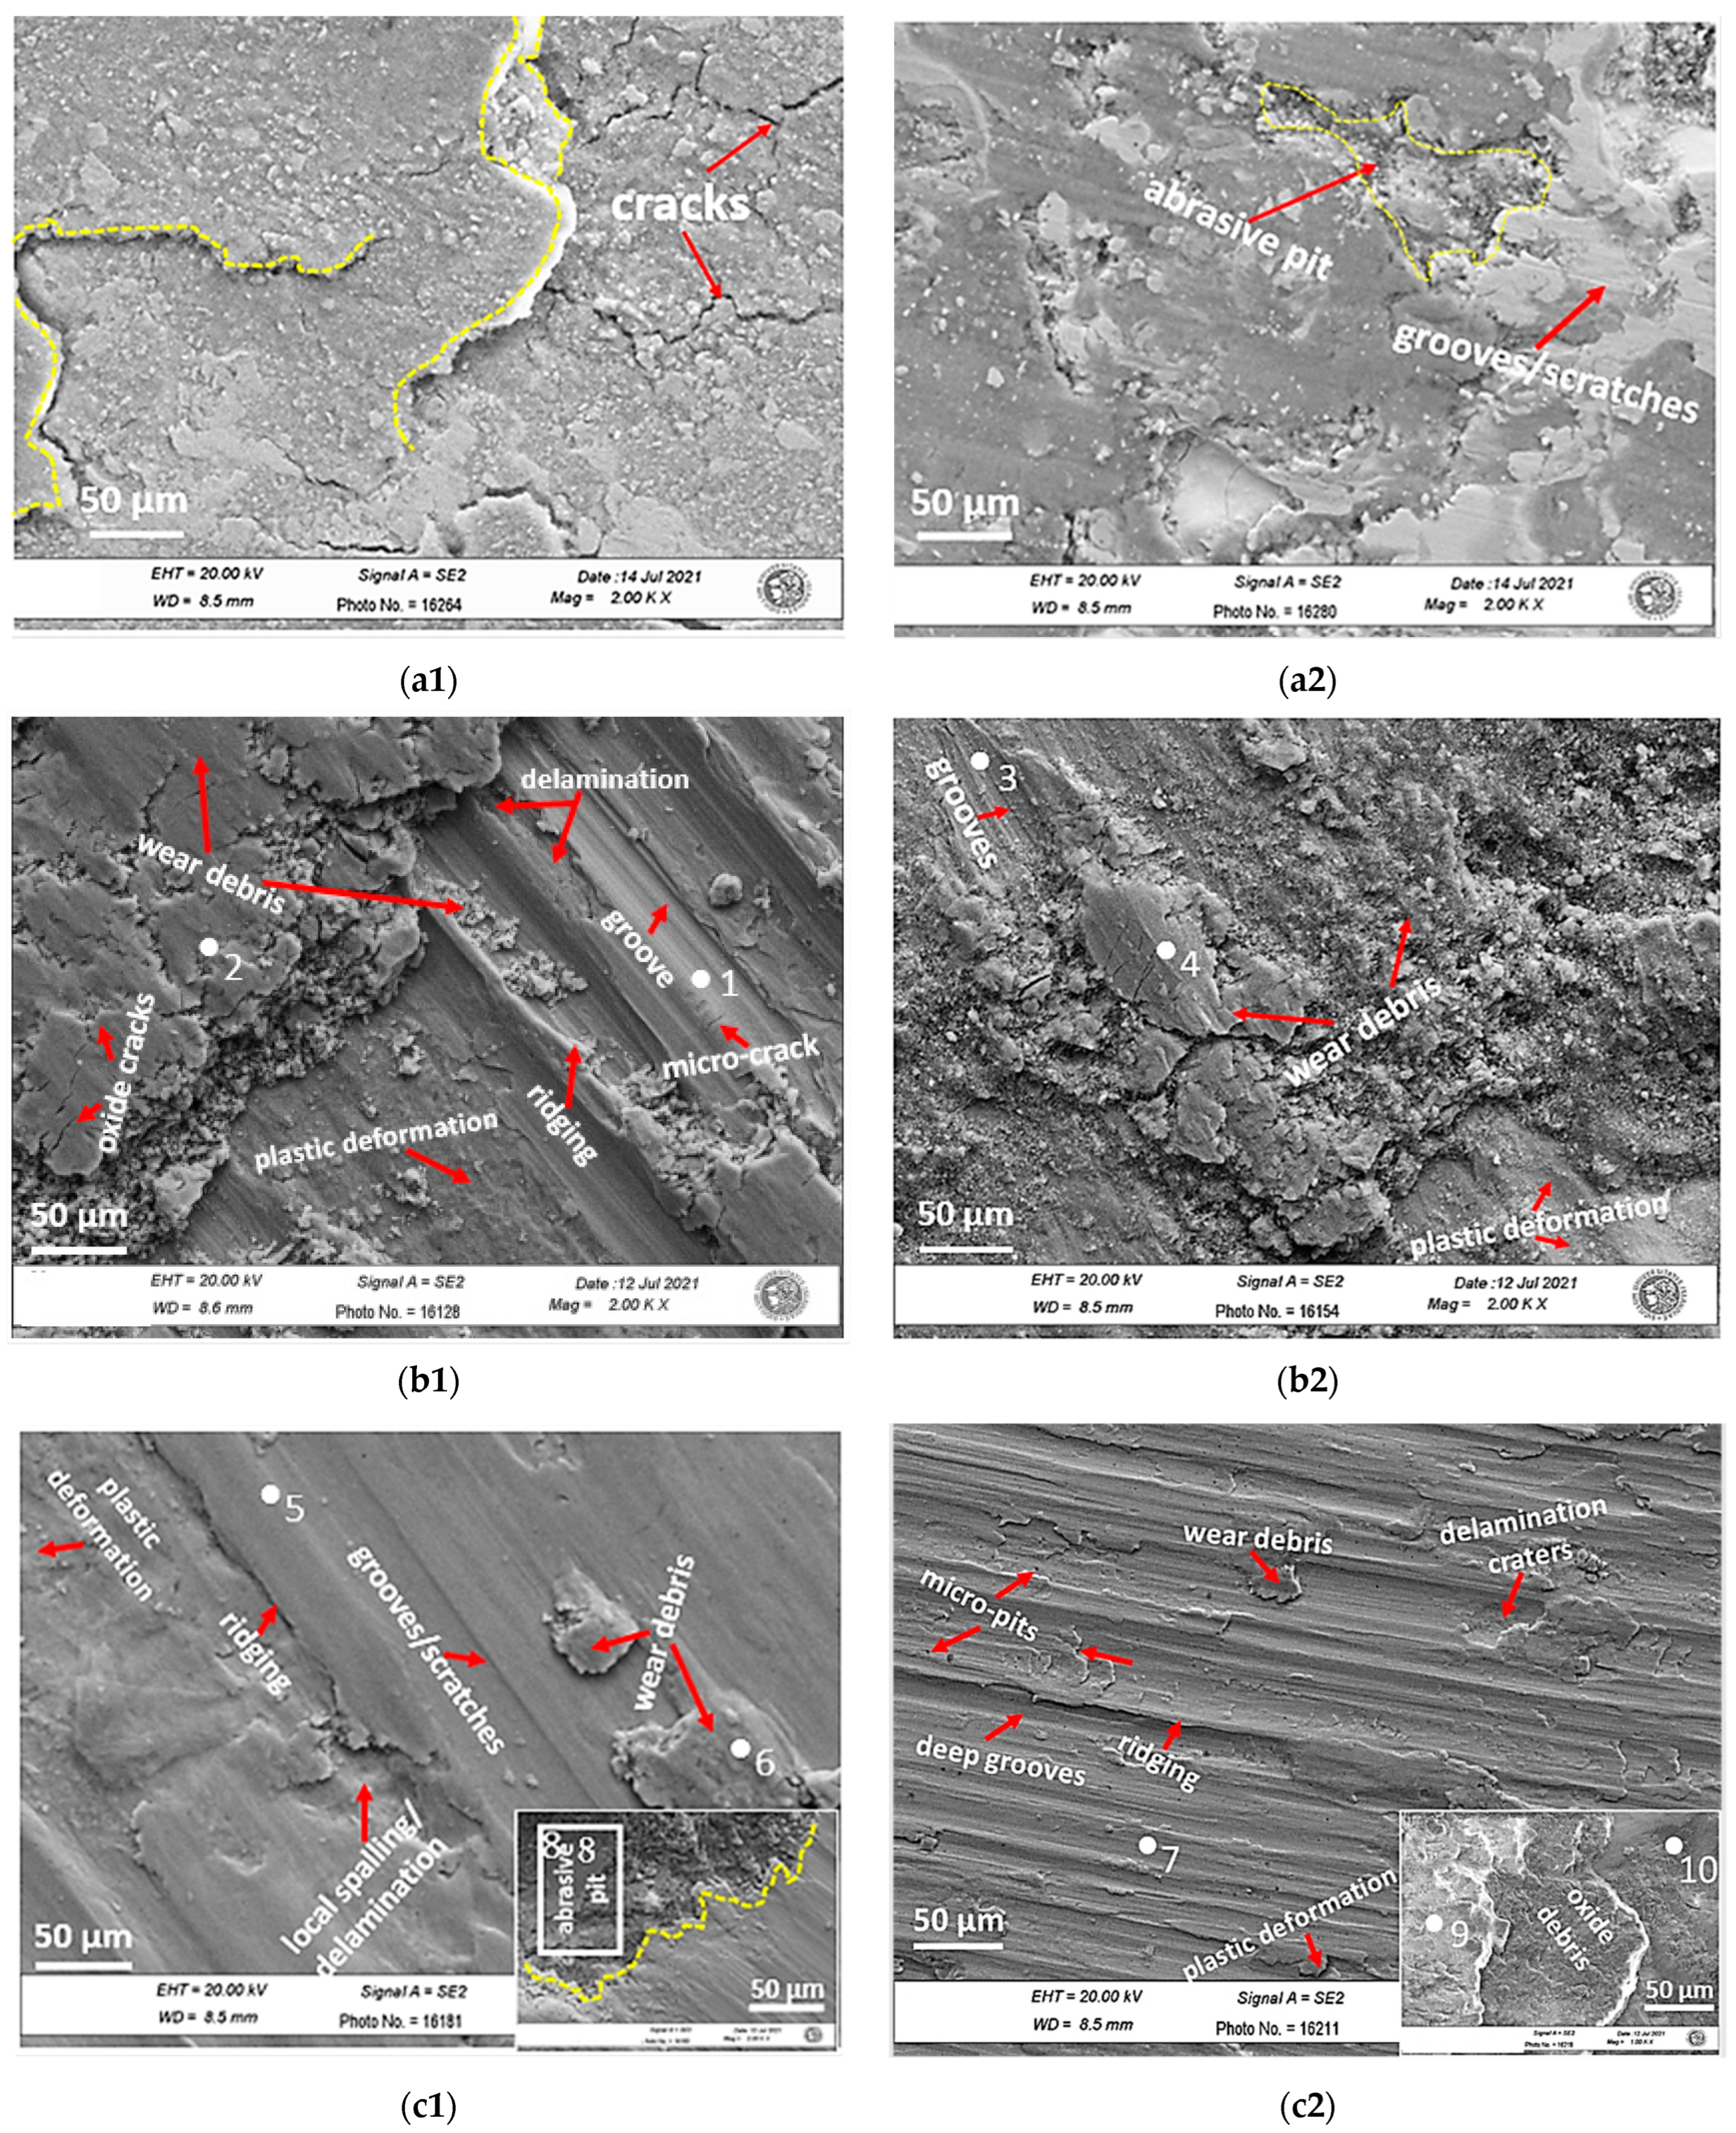
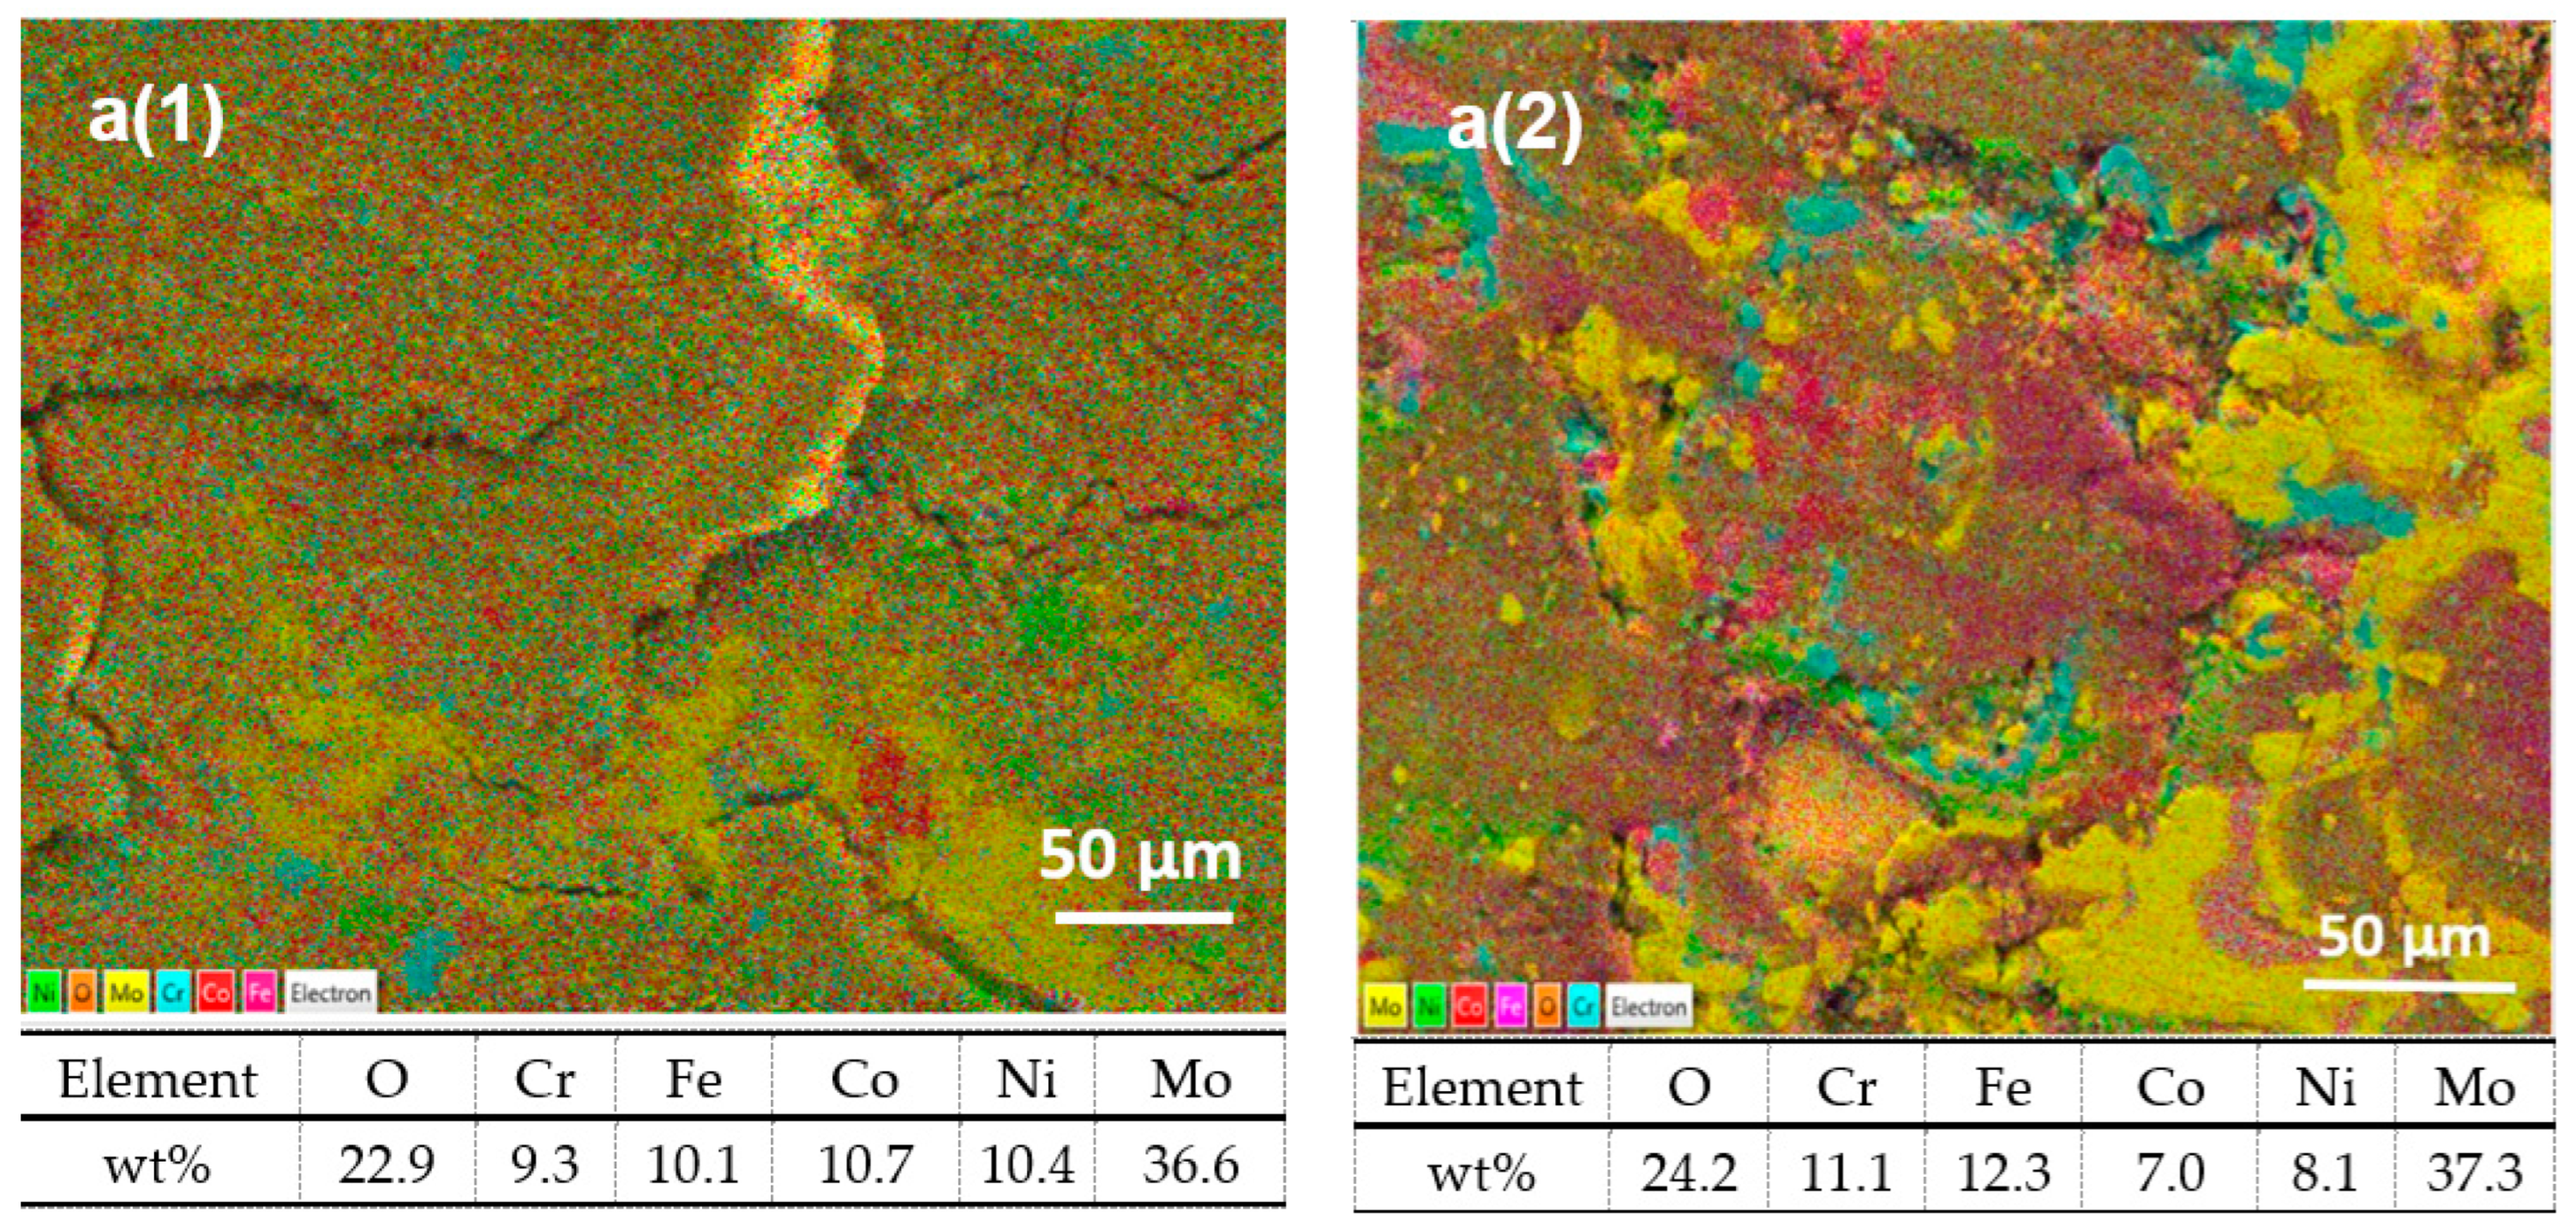
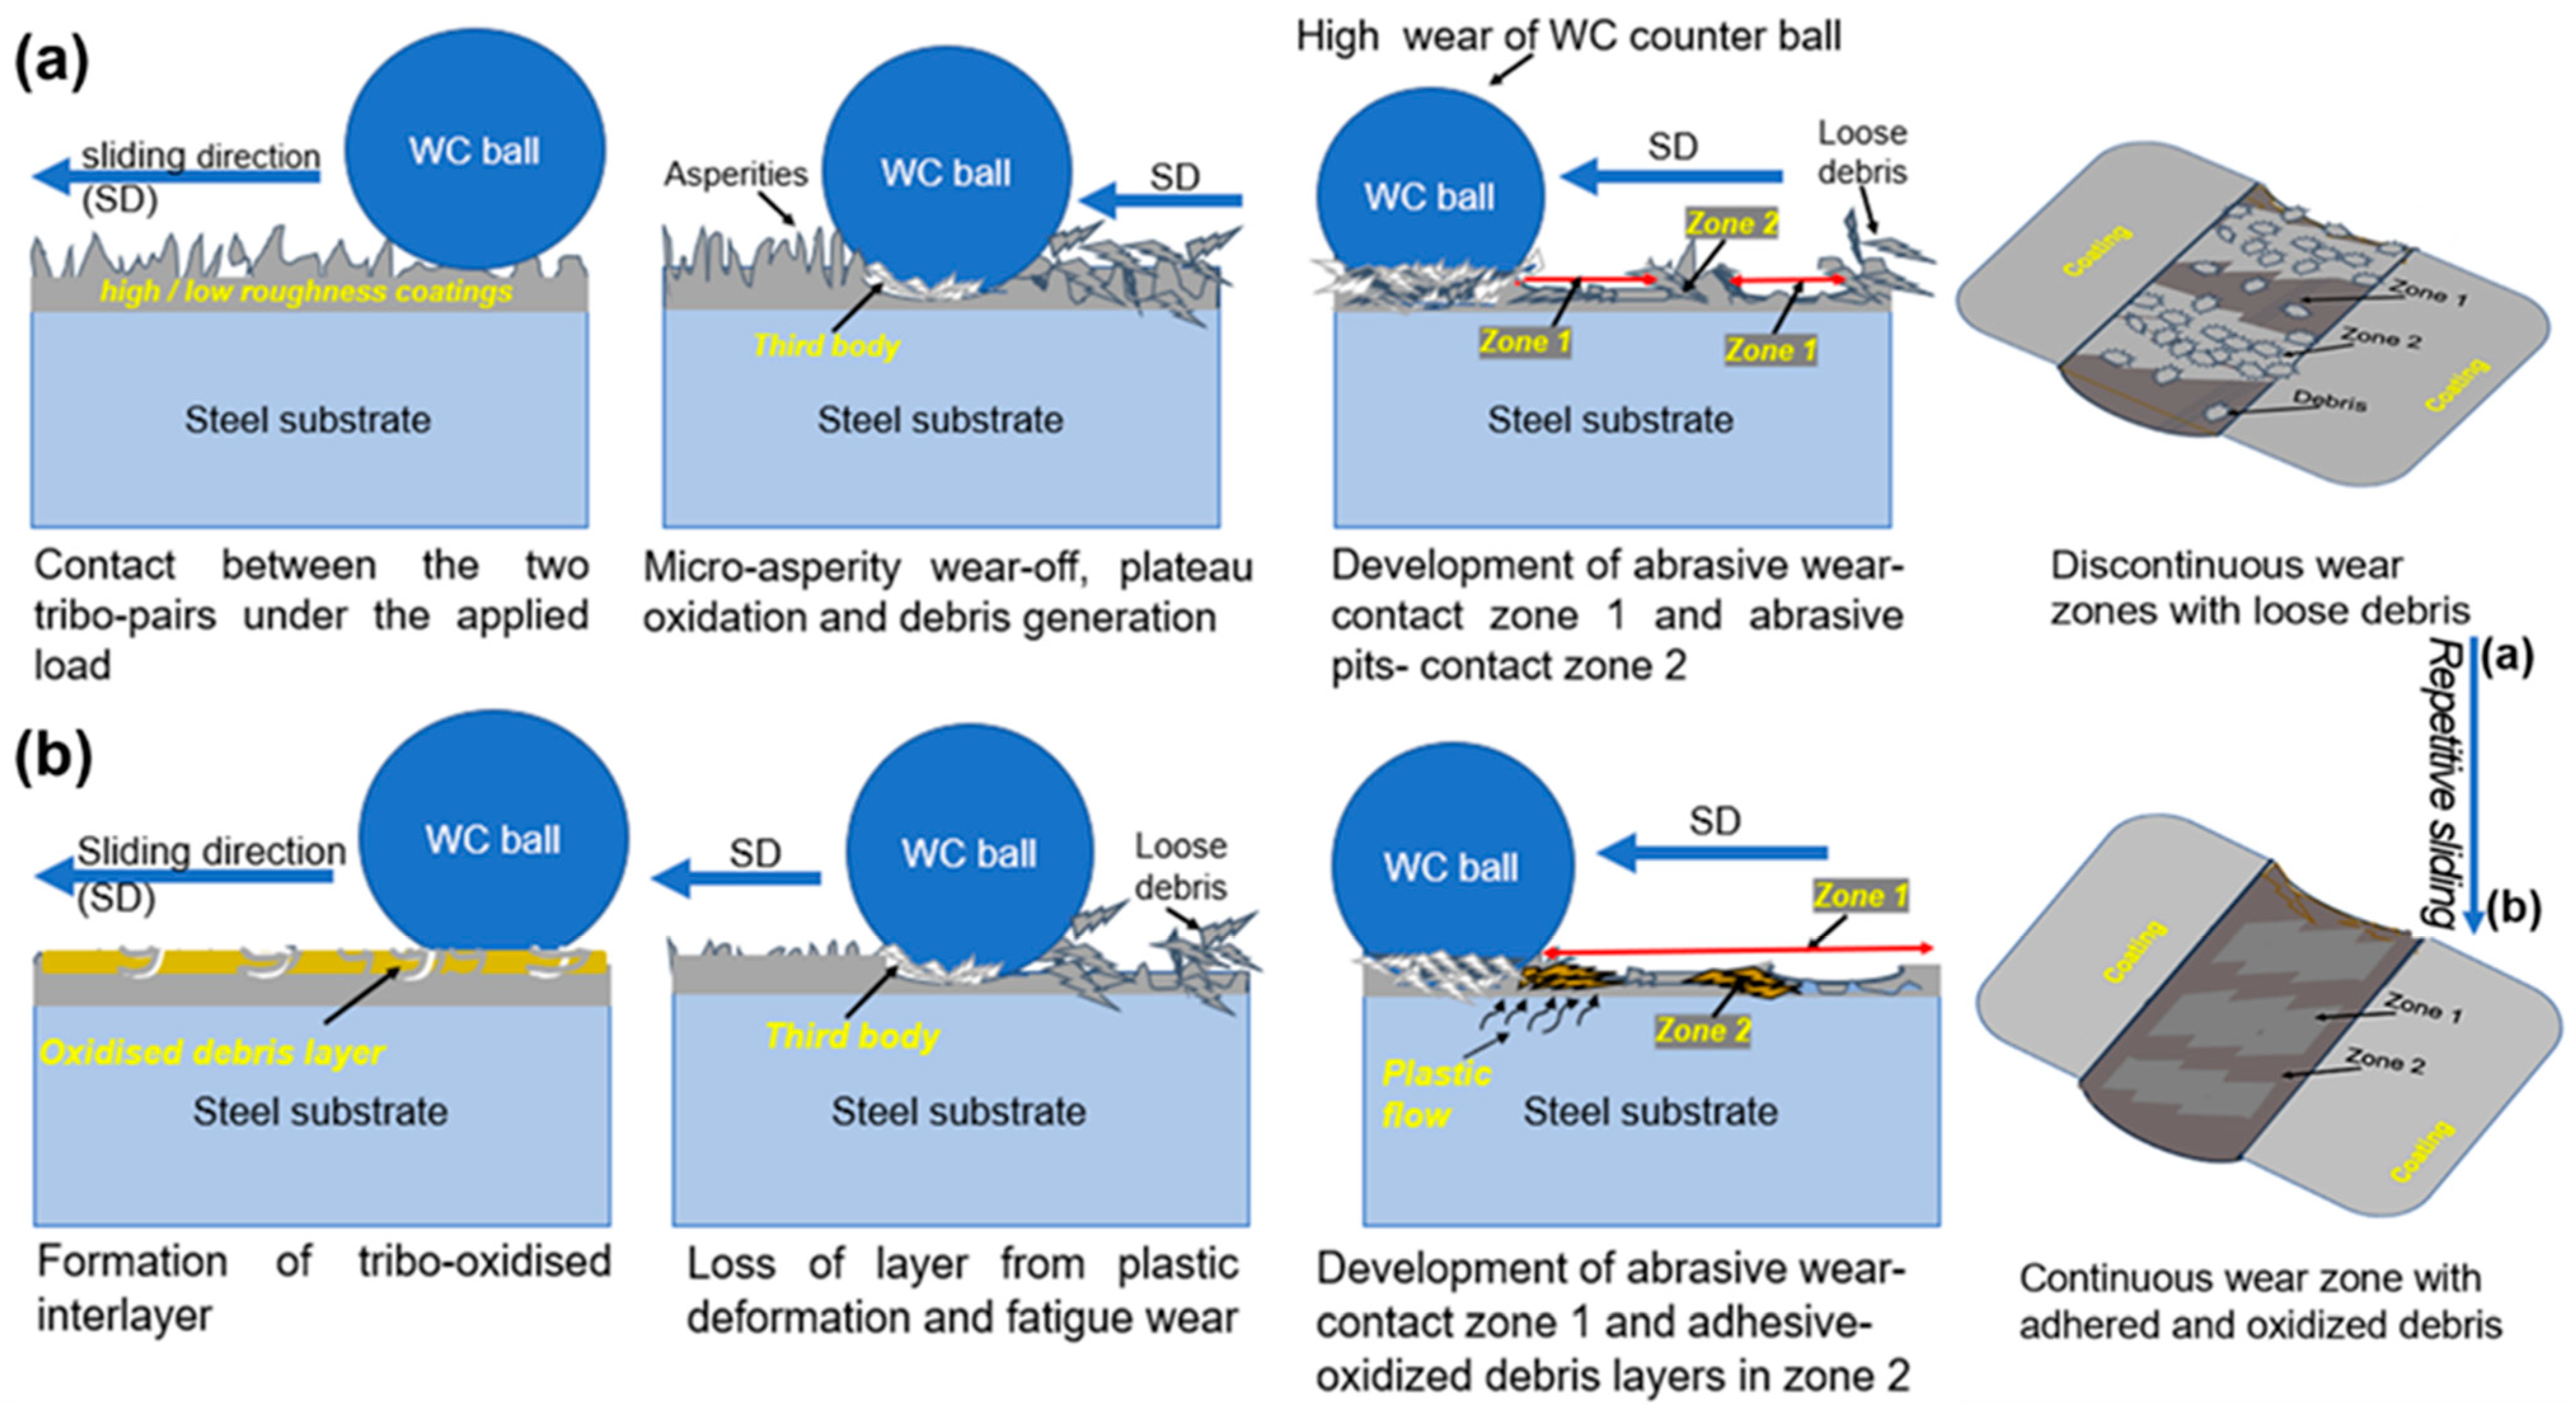
Publisher’s Note: MDPI stays neutral with regard to jurisdictional claims in published maps and institutional affiliations. |
© 2022 by the authors. Licensee MDPI, Basel, Switzerland. This article is an open access article distributed under the terms and conditions of the Creative Commons Attribution (CC BY) license (https://creativecommons.org/licenses/by/4.0/).