Article

Shear Behavior of Superposed Perfobond Connectors Considering Lateral Constraints

1
State Key Laboratory of Green Building in Western China, Xi’an University of Architecture & Technology, Xi’an 710055, China
2
School of Civil Engineering, Xi’an University of Architecture & Technology, Xi’an 710055, China
3
Key Lab of Structural Engineering and Earthquake Resistance, Ministry of Education, Xi’an University of Architecture & Technology, Xi’an 710055, China
*
Author to whom correspondence should be addressed.
Appl. Sci. 2022, 12(6), 3162; https://doi.org/10.3390/app12063162
Submission received: 27 January 2022 / Revised: 17 March 2022 / Accepted: 18 March 2022 / Published: 20 March 2022
(This article belongs to the Topic Advances on Structural Engineering)

Abstract

:
Superposed perfobond connectors are a type of connector used in composite structures. When the construction conditions are limited to increase the diameter of the opening, the shear capacity of the connector can be improved by enhancing the confining effect of the concrete dowel. In this study, 12 superposed perfobond connectors were fabricated to investigate the influence of lateral constraints on their shear behavior. The effects of hole area and holes’ number, diameter of the perforating rebar, concrete compressive strength, and the number of transverse reinforcements were investigated via the failure modes and load–slip curves. The results indicate that double-sided shear failure occurs in connectors with perfobond rib thicknesses exceeding 9 mm, and the connectors featuring strong lateral constraints not only exhibited higher bearing capacities but also superior load-holding capacities after peak load. Finally, an equation for the shear capacity of multi-hole perfobond connectors, considering lateral constraints, was proposed according to the double-sided shear theory.

1. Introduction

Steel–concrete composite structures are a new version of conventional steel and reinforced concrete structures. They combine the advantages of steel and concrete materials, offer improved mechanical performances, and yield better economic benefits. Connectors play a crucial role in realizing the combined properties of steel and concrete. At present, headed stud connectors are widely used [1,2]. Leonhardt et al. [3] first proposed a new connector (referred to as the perfobond connector), which was constructed by welding a perfobond rib to the flange of the steel beam and inserting the rebar through the hole. After the concrete is poured, the concrete dowel and perforating rebar in the hole can transmit the longitudinal shear force and resist vertical lifting between the concrete and steel. Previous studies have shown that perfobond connectors offer convenient construction, good shear performance, and superior fatigue performance [4,5,6]. Two primary types of perfobond connectors are currently in use: the superposed perfobond connectors for composite structures and the inserted perfobond connectors for bridge construction. Their structural forms are shown in Figure 1a,b, respectively.
Push-out tests and numerical simulations are typical methods for studying inserted perfobond connectors. Using these, the calculation equation for the connector’s shear capacity can be derived through regression fitting. Xiao et al. [7] studied the mechanical properties and proposed an analytical model for calculating the shear capacity of perfobond connectors with different plate thicknesses. Zhang et al. [8] developed a shear equation that could simultaneously estimate the shear capacities of studs and perfobond connectors. The equation obtained by He et al. [9,10] incorporated the shear action of the concrete dowel, perforating rebar, and interface bonding. Zou et al. [11,12] carried out push-out tests and finite element analysis on 13 groups of PBL connectors and proposed a formula for calculating the bearing capacity considering the constraints of external concrete and the transverse reinforcement, in which the contributions of the concrete dowel and perforating rebar were nonlinear. A typical load–slip curve of the inserted perfobond connector is shown in Figure 2. Its shear capacity is seen to be relatively high, owing to the strong confinement of the concrete dowel. A negligible decline period can be seen during the curve’s loading process, demonstrating the inserted perfobond connector’s excellent load-holding ability.
The previous studies on superposed perfobond connectors can be primarily divided into three categories: (1) Oguejiofor and Hosain [13,14,15], Veríssimo et al. [16], Al-Darzi et al. [17], Ahn et al. [18], and Yang Yong et al. [19,20] conducted push tests and numerical analyses on connectors, considering the concrete end-bearing effect; (2) Medberry and Shahrooz [21] performed an experimental study taking into account the chemical bond between steel and concrete; (3) Hosaka et al. [6], Xue et al. [22], Zhao and Liu [23], and Zheng et al. [24] studied connectors by neglecting the concrete end-bearing effect and chemical bond, by means of push-out tests and finite element nonlinear analysis. Numerous scholars have analyzed the mechanical properties and failure mechanisms of all types of connectors. Then, the shear capacity equations have been proposed via parameter analysis and regression fitting. The parameters mostly include the number of holes, hole sizes and shapes, concrete compressive strength, diameter of the perforating rebar, and so on. As shown in Figure 2, research regarding the load–slip curves of superposed perfobond connectors indicate that their capacity is lower than that of inserted perfobond connectors because of the weak constraints of the concrete dowel. The experimental results show that the curve of a superposed perfobond connector can be seen to rapidly decrease above the peak load, owing to the failure of the concrete dowel. This indicates that the superposed perfobond connectors poorly maintain the load.
By summarizing the studies for both types of perfobond connectors, we can see that the confinement of the concrete dowel has a significant impact on the failure mode and capacity of the connectors. Zheng et al. [24] indicated that the shear capacities of the superposed perfobond connectors under relatively weak constraints were mostly controlled by the constraint effect when the hole size exceeded a specific range. Su et al. [25,26] showed that the lateral constraint provided by transverse reinforcements represents a crucial factor underlying the mechanical behavior differences between superposed and inserted perfobond connectors. Fujii [27] drew the conclusion that the lateral constraint of the concrete dowel primarily comprises the concrete-wrapping perforating rebar and bottom friction. Because of the different design methods and specimen-loading environments, it is difficult to model a unified bottom friction; hence, we neglect this factor here. As a result, it is important to study the different mechanical properties of weakly constrained superposed perfobond connectors when varying the hole diameters and lateral constraints. Changes in lateral constraint can be realized by varying the concrete compressive strength, diameter of the perforating rebar, and stirrup form. Thus, when superposed perfobond connectors are used in composite structures, their shear and load-holding capacities can be improved by increasing the confining effect of the concrete dowel.
This study aimed at evaluating the influence of lateral constraints on shear behavior of superposed perfobond connectors in composite structures and 12 push-out specimens were tested. The parameters included hole number, hole area, and lateral constraint. The lateral constraints were mainly affected by the concrete compressive strength, diameter of perforating rebar, and the number of transverse reinforcements. Finally, based on the test results, an analytical model for shear capacity of the multi-hole perfobond connectors considering the lateral constraint was proposed to thereby guide the design of perfobond connectors in composite structures.

2. Experimental Program

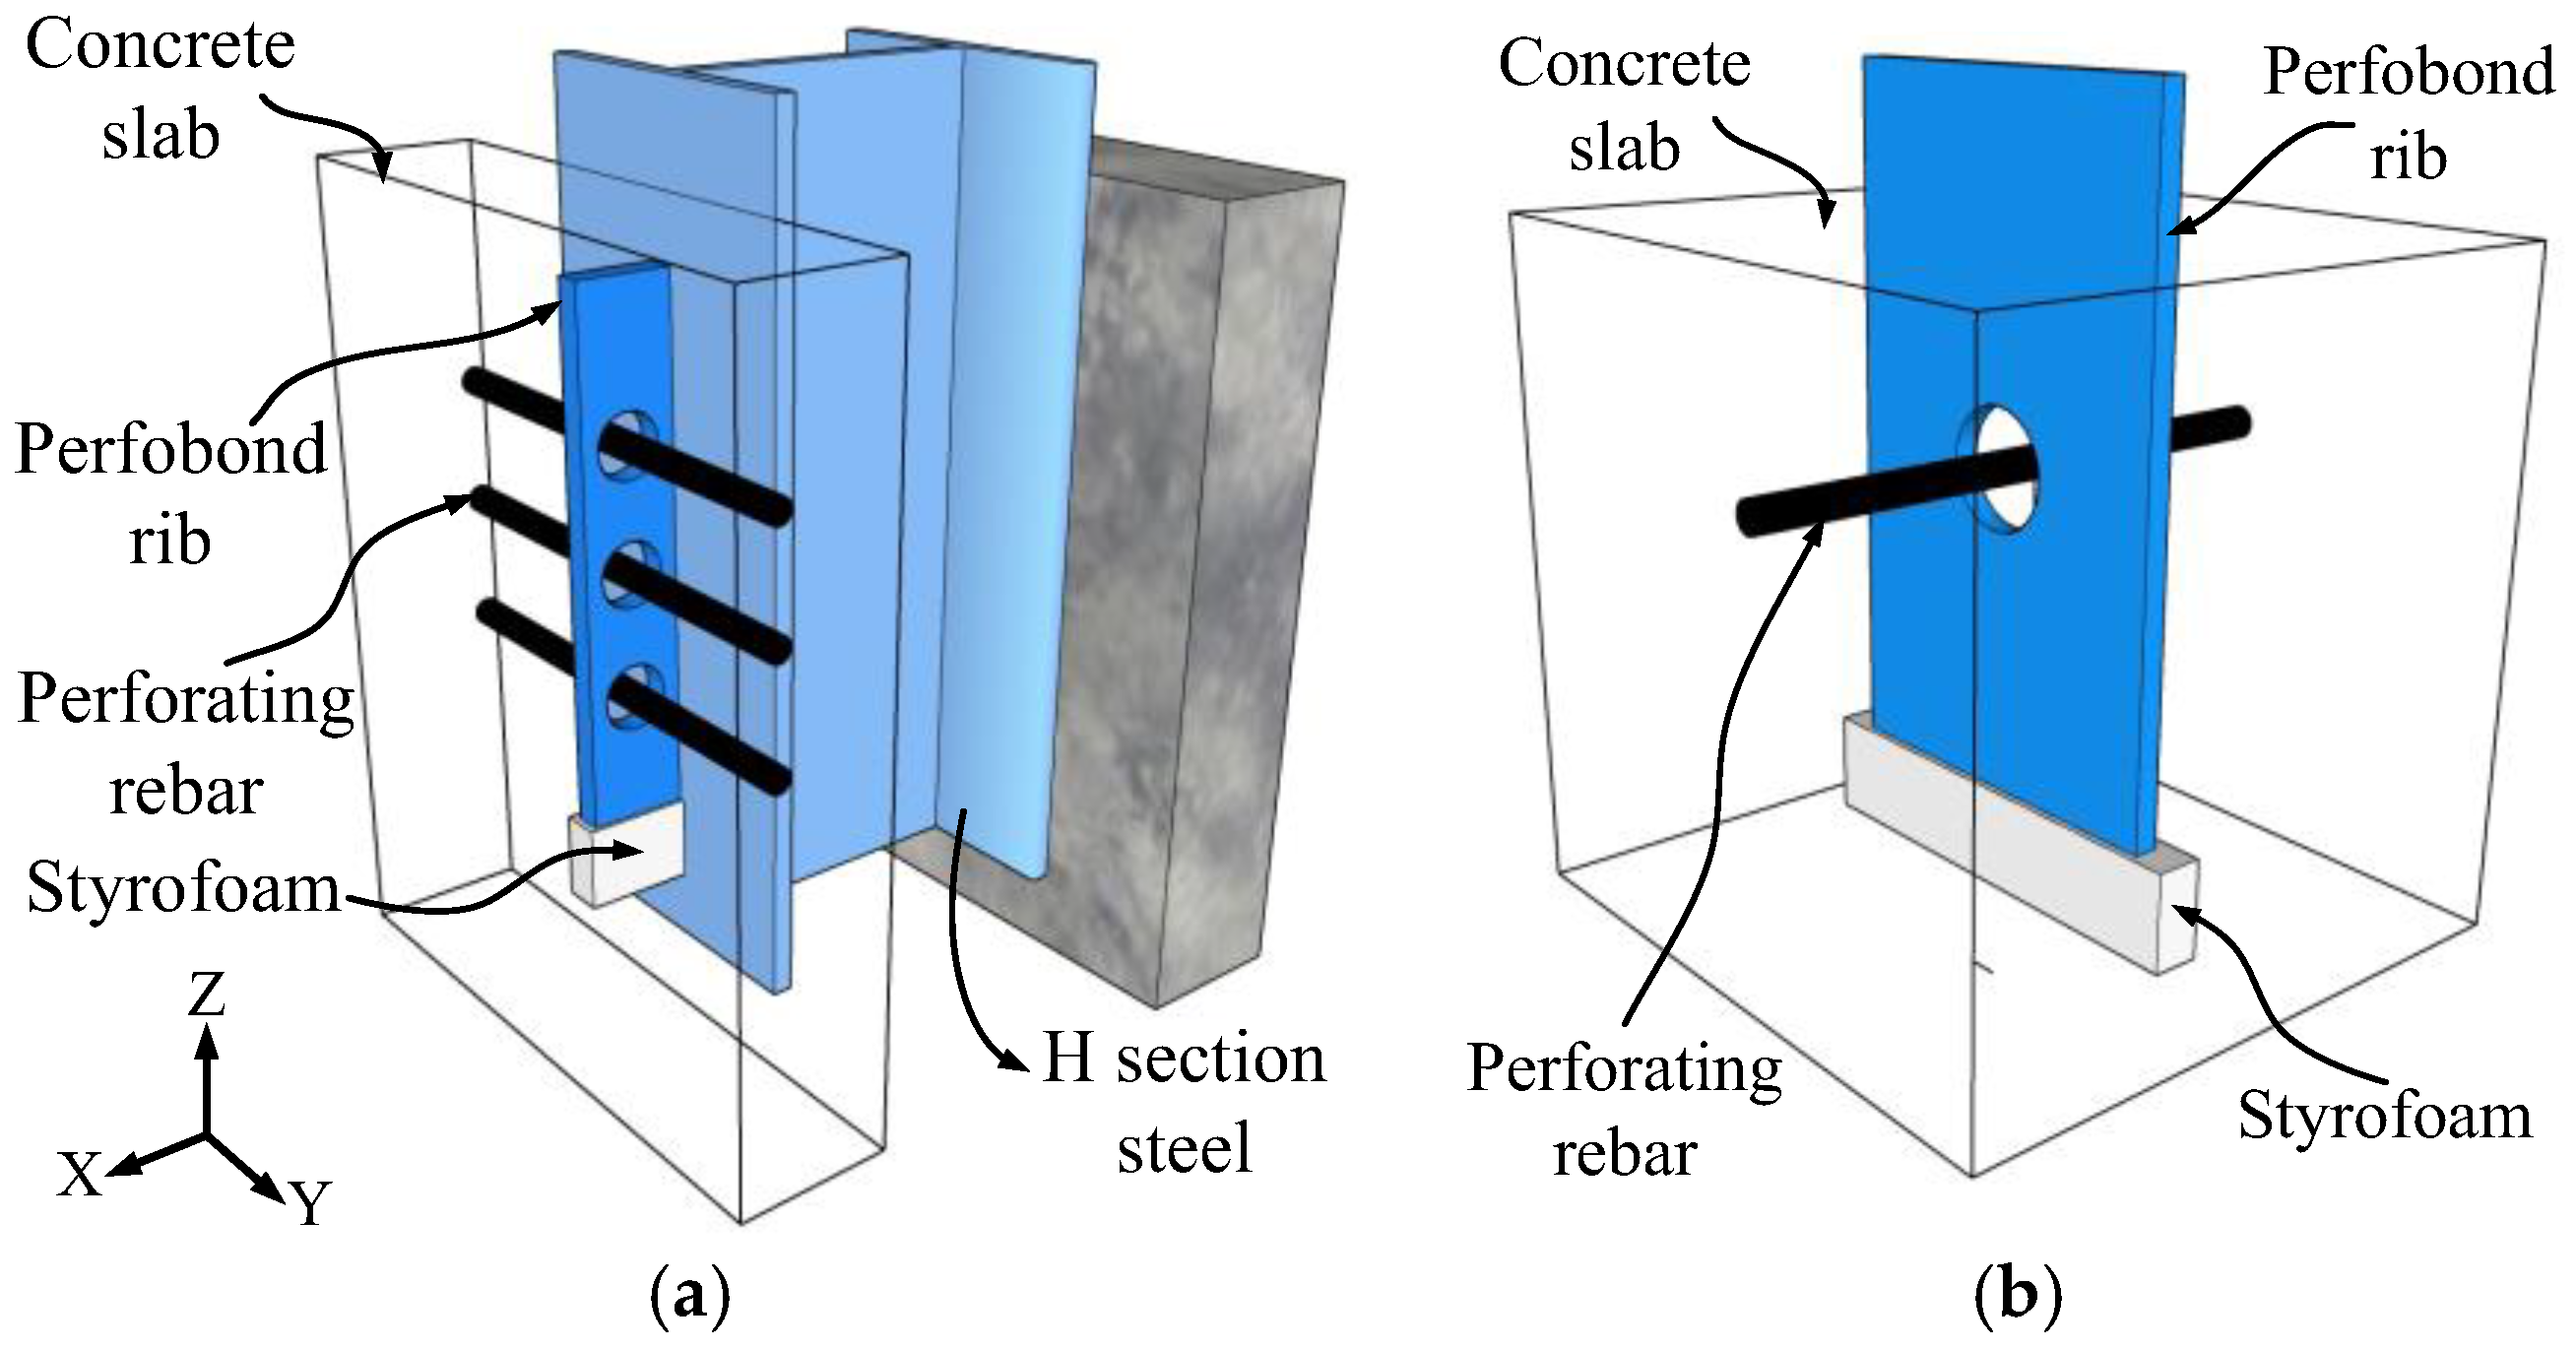
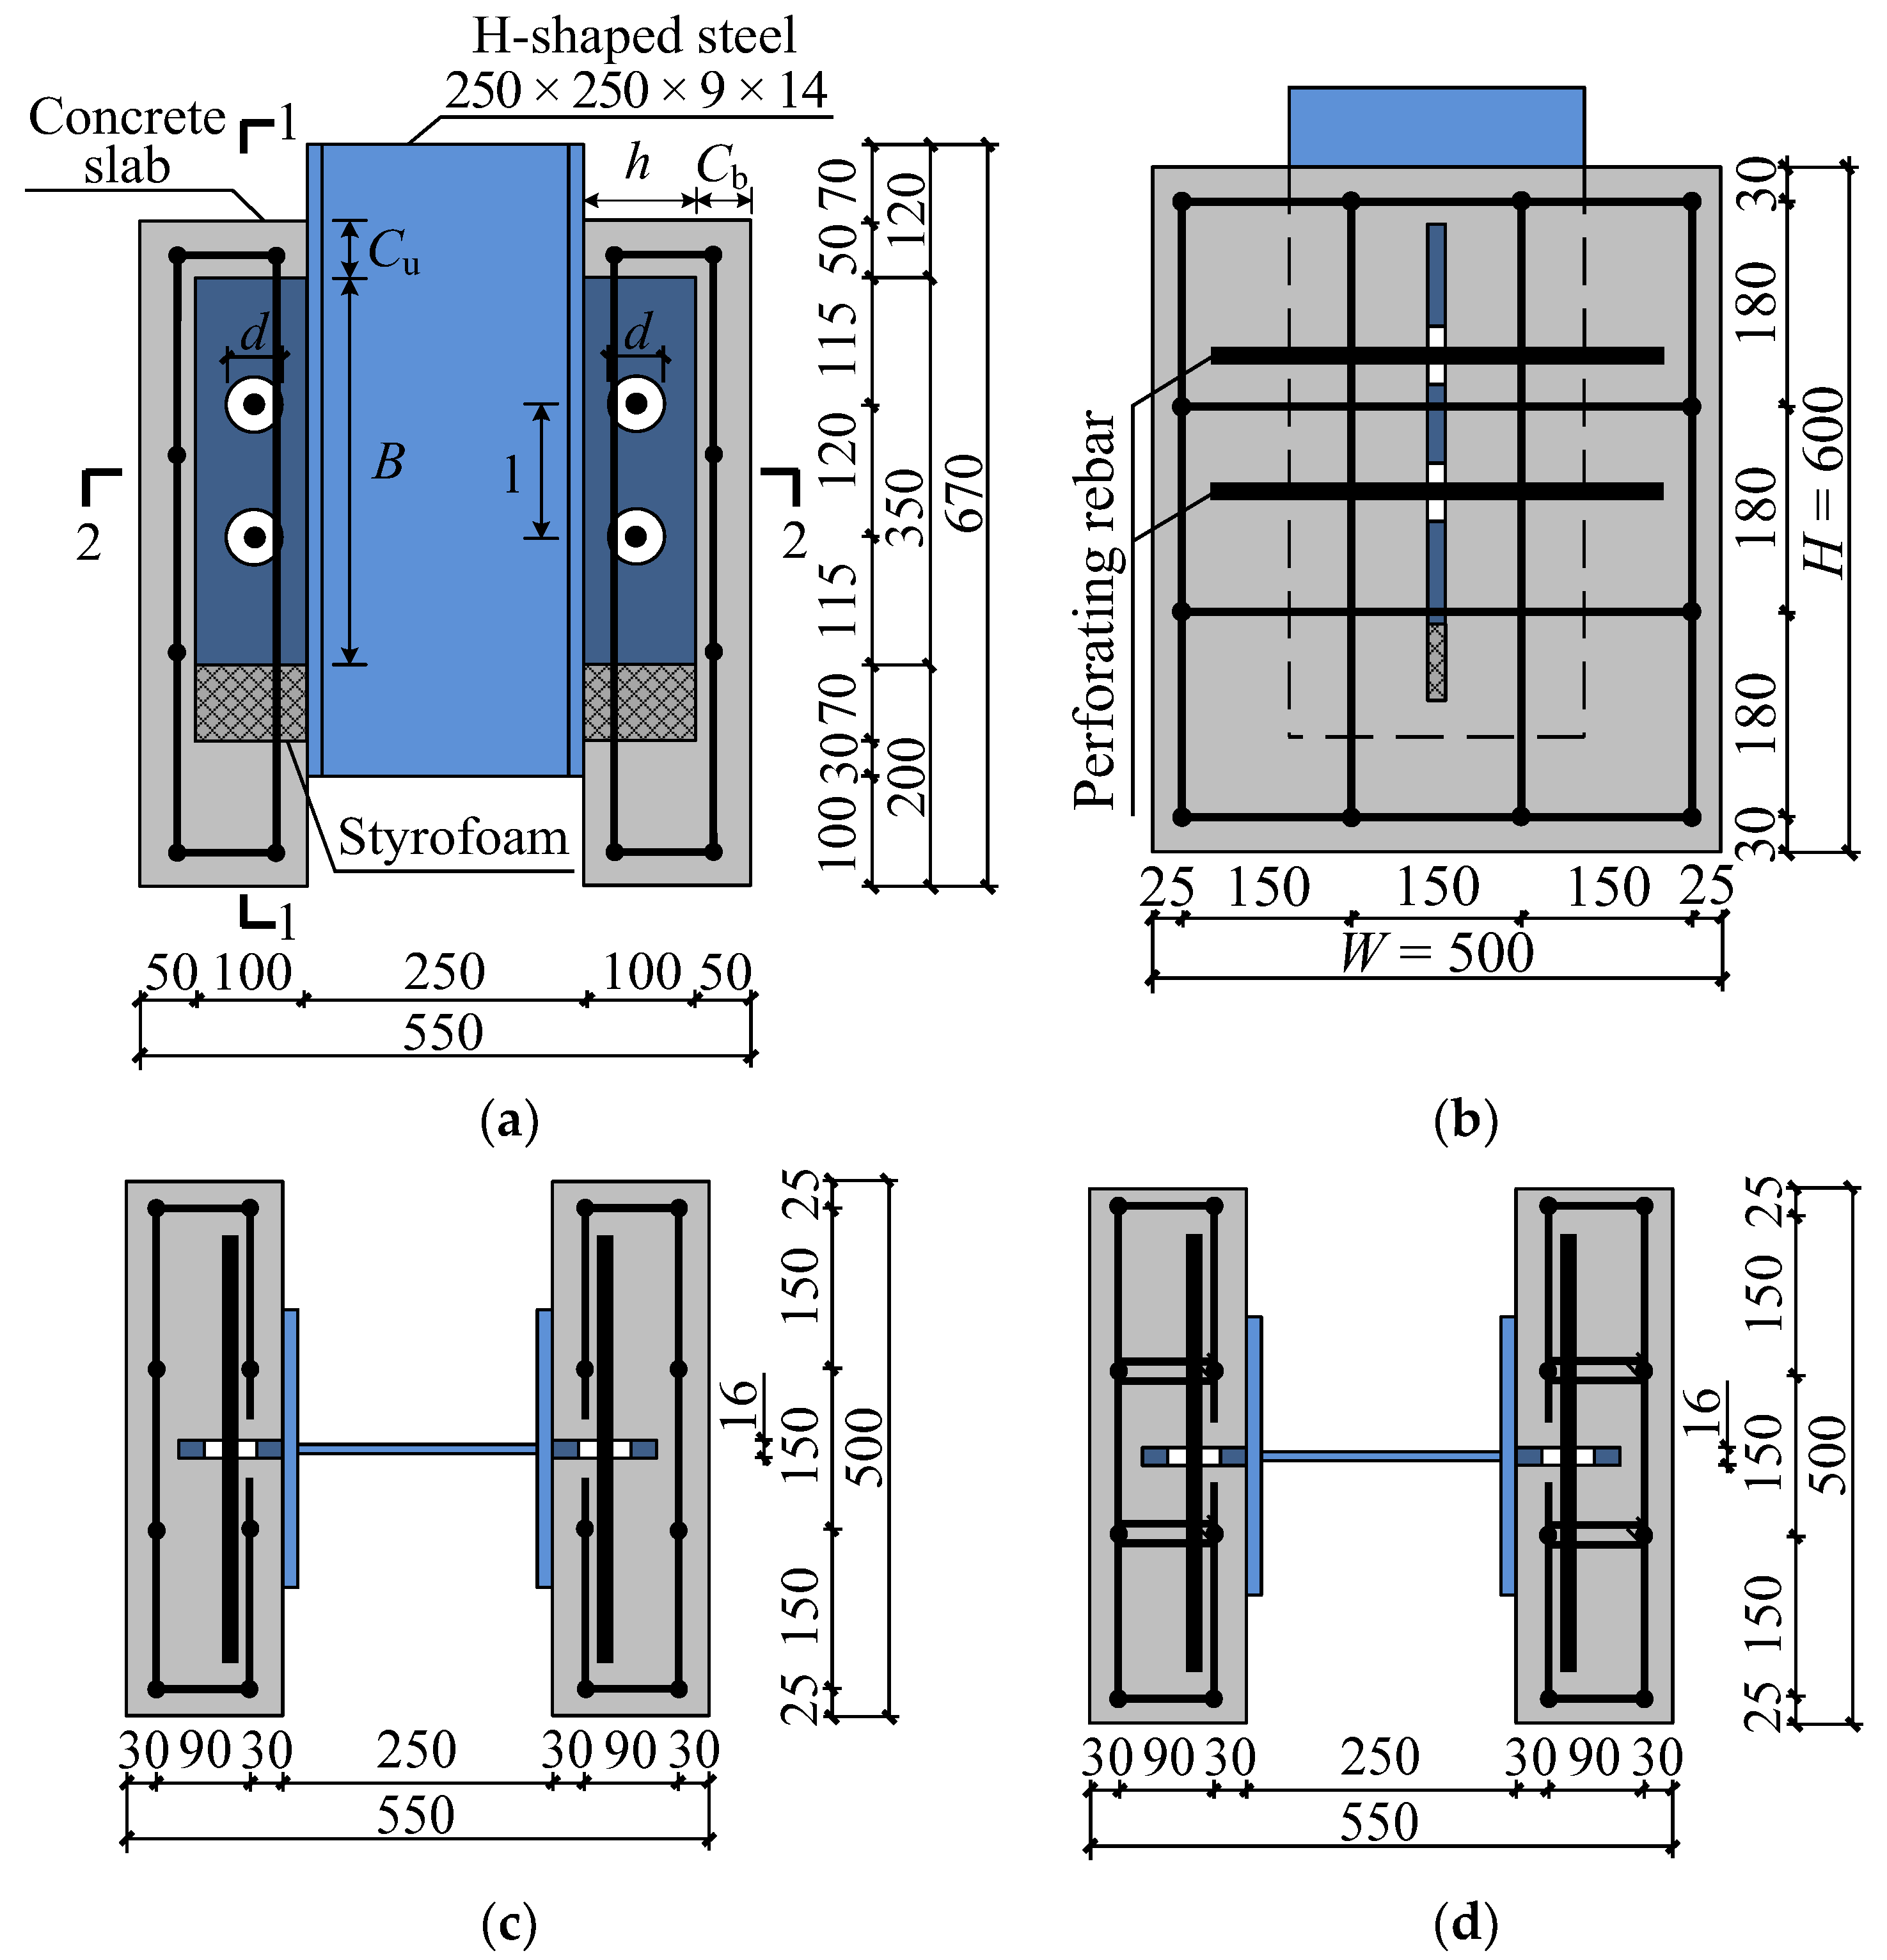
2.1. Push-Out Specimens

In this study, 12 superposed perfobond connectors were designed for push-out testing according to Eurocode 4 [28]. All the specimens were made of Q355 H-shaped steel and HRB400 ribbed bar. The specific parameters are shown in Table 1. Figure 3 shows a schematic diagram of the specimen; the height H, width W, and thickness T of the concrete slab were 600, 500 and 150 mm, respectively. The H-section specification was HW250 × 250 × 9 × 14. The height h, length B and thickness t of the perfobond rib were 100, 350 and 16 mm, respectively. Cu and Cb were the thickness of the concrete wrap at the top and side of the perfobond rib, which were all 50 mm. The main design parameters included the lateral constraints and hole areas of the perfobond rib. The lateral constraints were mainly affected by the concrete compressive strength, diameter of the perforating rebar, and the number of transverse reinforcements. The hole area was changed by varying the hole’s diameter and shape. The design specifications of the perfobond rib are shown in Figure 4 and Table 1, thereinto, d, dl, dh and A were the holes’ diameter, length, height, and the areas of the perfobond rib, and l was the distance between the holes. ds was the diameter of the perforating rebar. The transverse reinforcement number was varied via the stirrup forms of the concrete, which included both conventional (see Figure 3c) and segmental (see Figure 3d) stirrup constraints.
Lubricating oil was applied to the contact surface between the steel and concrete to eliminate the influence of friction therebetween. Moreover, to avoid the concrete end-bearing effect below the perfobond rib a 100 × 70 × 16 mm slot was retained at the bottom of the perfobond rib, to leave space for the styrofoam.

2.2. Materials

Nine 150 mm concrete cubes were set aside during specimen pouring and cured for more than 28 days under the same conditions as the specimens. Before loading, the concrete cubes’ compressive strengths fcu were measured by compressive strength tests of the concrete test blocks, and elastic modulus Ec was calculated according to [29]. The mean yield strength fy, ultimate strength fu, and elastic modulus Es of the Q355 steel and HRB400 rebar were determined by tensile tests. All material properties of the concrete, steel plate, and steel bar are summarized in Table 2 and Table 3.

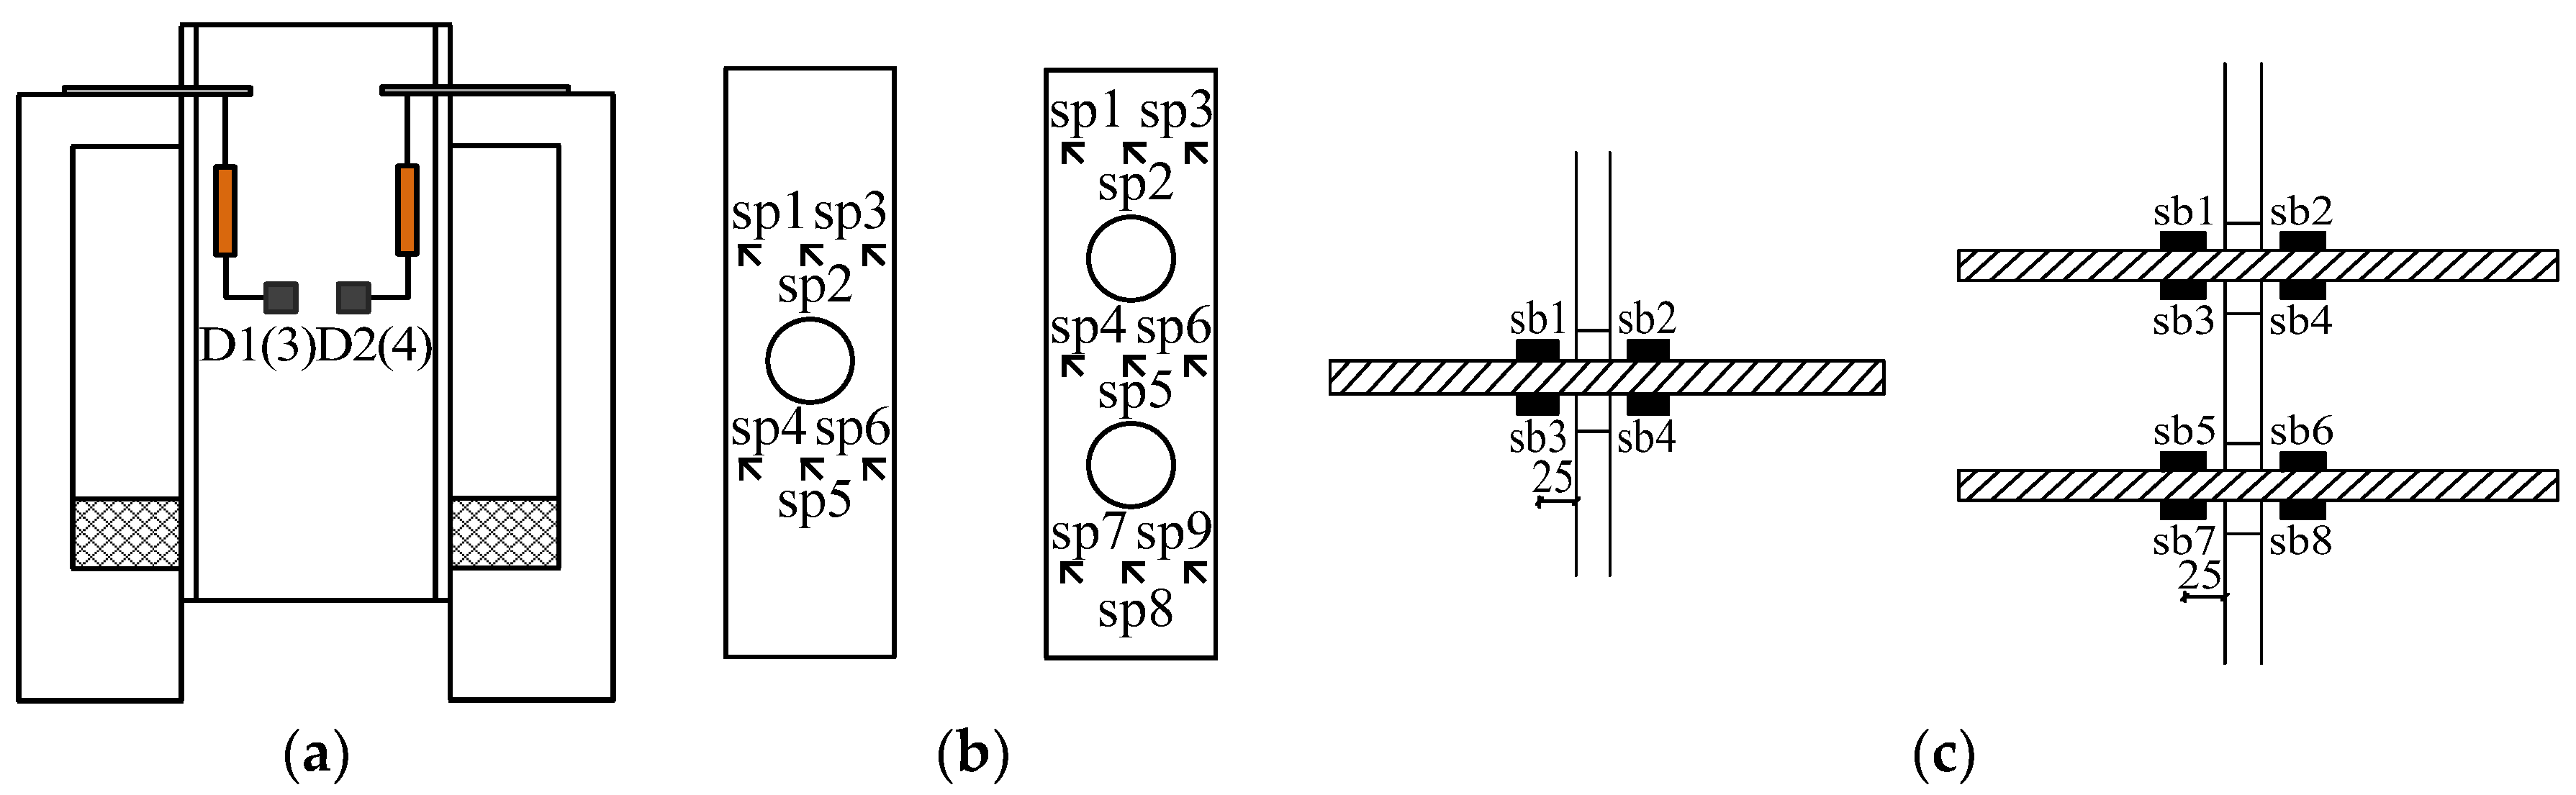
2.3. Test Setup and Instrumentation

The push-out test was performed on a 5000 kN testing machine under monotonic static-loading conditions. The loading device is shown in Figure 5. The vertical load was applied to the upper part of the H-shaped steel beam at the center of the specimen via the displacement loading method, which was specified in Eurocode 4 [28]. As such, the specimen was first preloaded, then uniformly loaded at a rate of 0.2 mm/min. Loading was stopped when the loads fell to less than 80% of the ultimate value or the displacement reached its limit. The entire loading process took no less than 15 min. A thick steel plate was placed on the top of the H-shaped steel beam to ensure a uniform force on the specimens. The data acquisition frequency was about 2 s/datum.
The strain around the hole, relative slip between the steel and concrete, and axial strain through the steel bar were the main measurement focuses of the test. The actual layouts are shown in Figure 6. A force sensor was placed at the top of the specimen to collect the load value during loading. The relative slip between the H-shaped steel and concrete slab was measured by four linear variable displacement transducers arranged symmetrically on the specimen, which were numbered D1–D4 (see Figure 6a). The average value between these four displacement gauges was taken to ensure accuracy. The strain values around the opening of the perfobond rib were measured by the strain rosettes numbered sp1–sp9 (see Figure 6b). The strain of the perforating rebar was measured via the strain gauges arranged on the perforating rebar, which was numbered sb1–sb8 (see Figure 6c).

3. Experimental Results
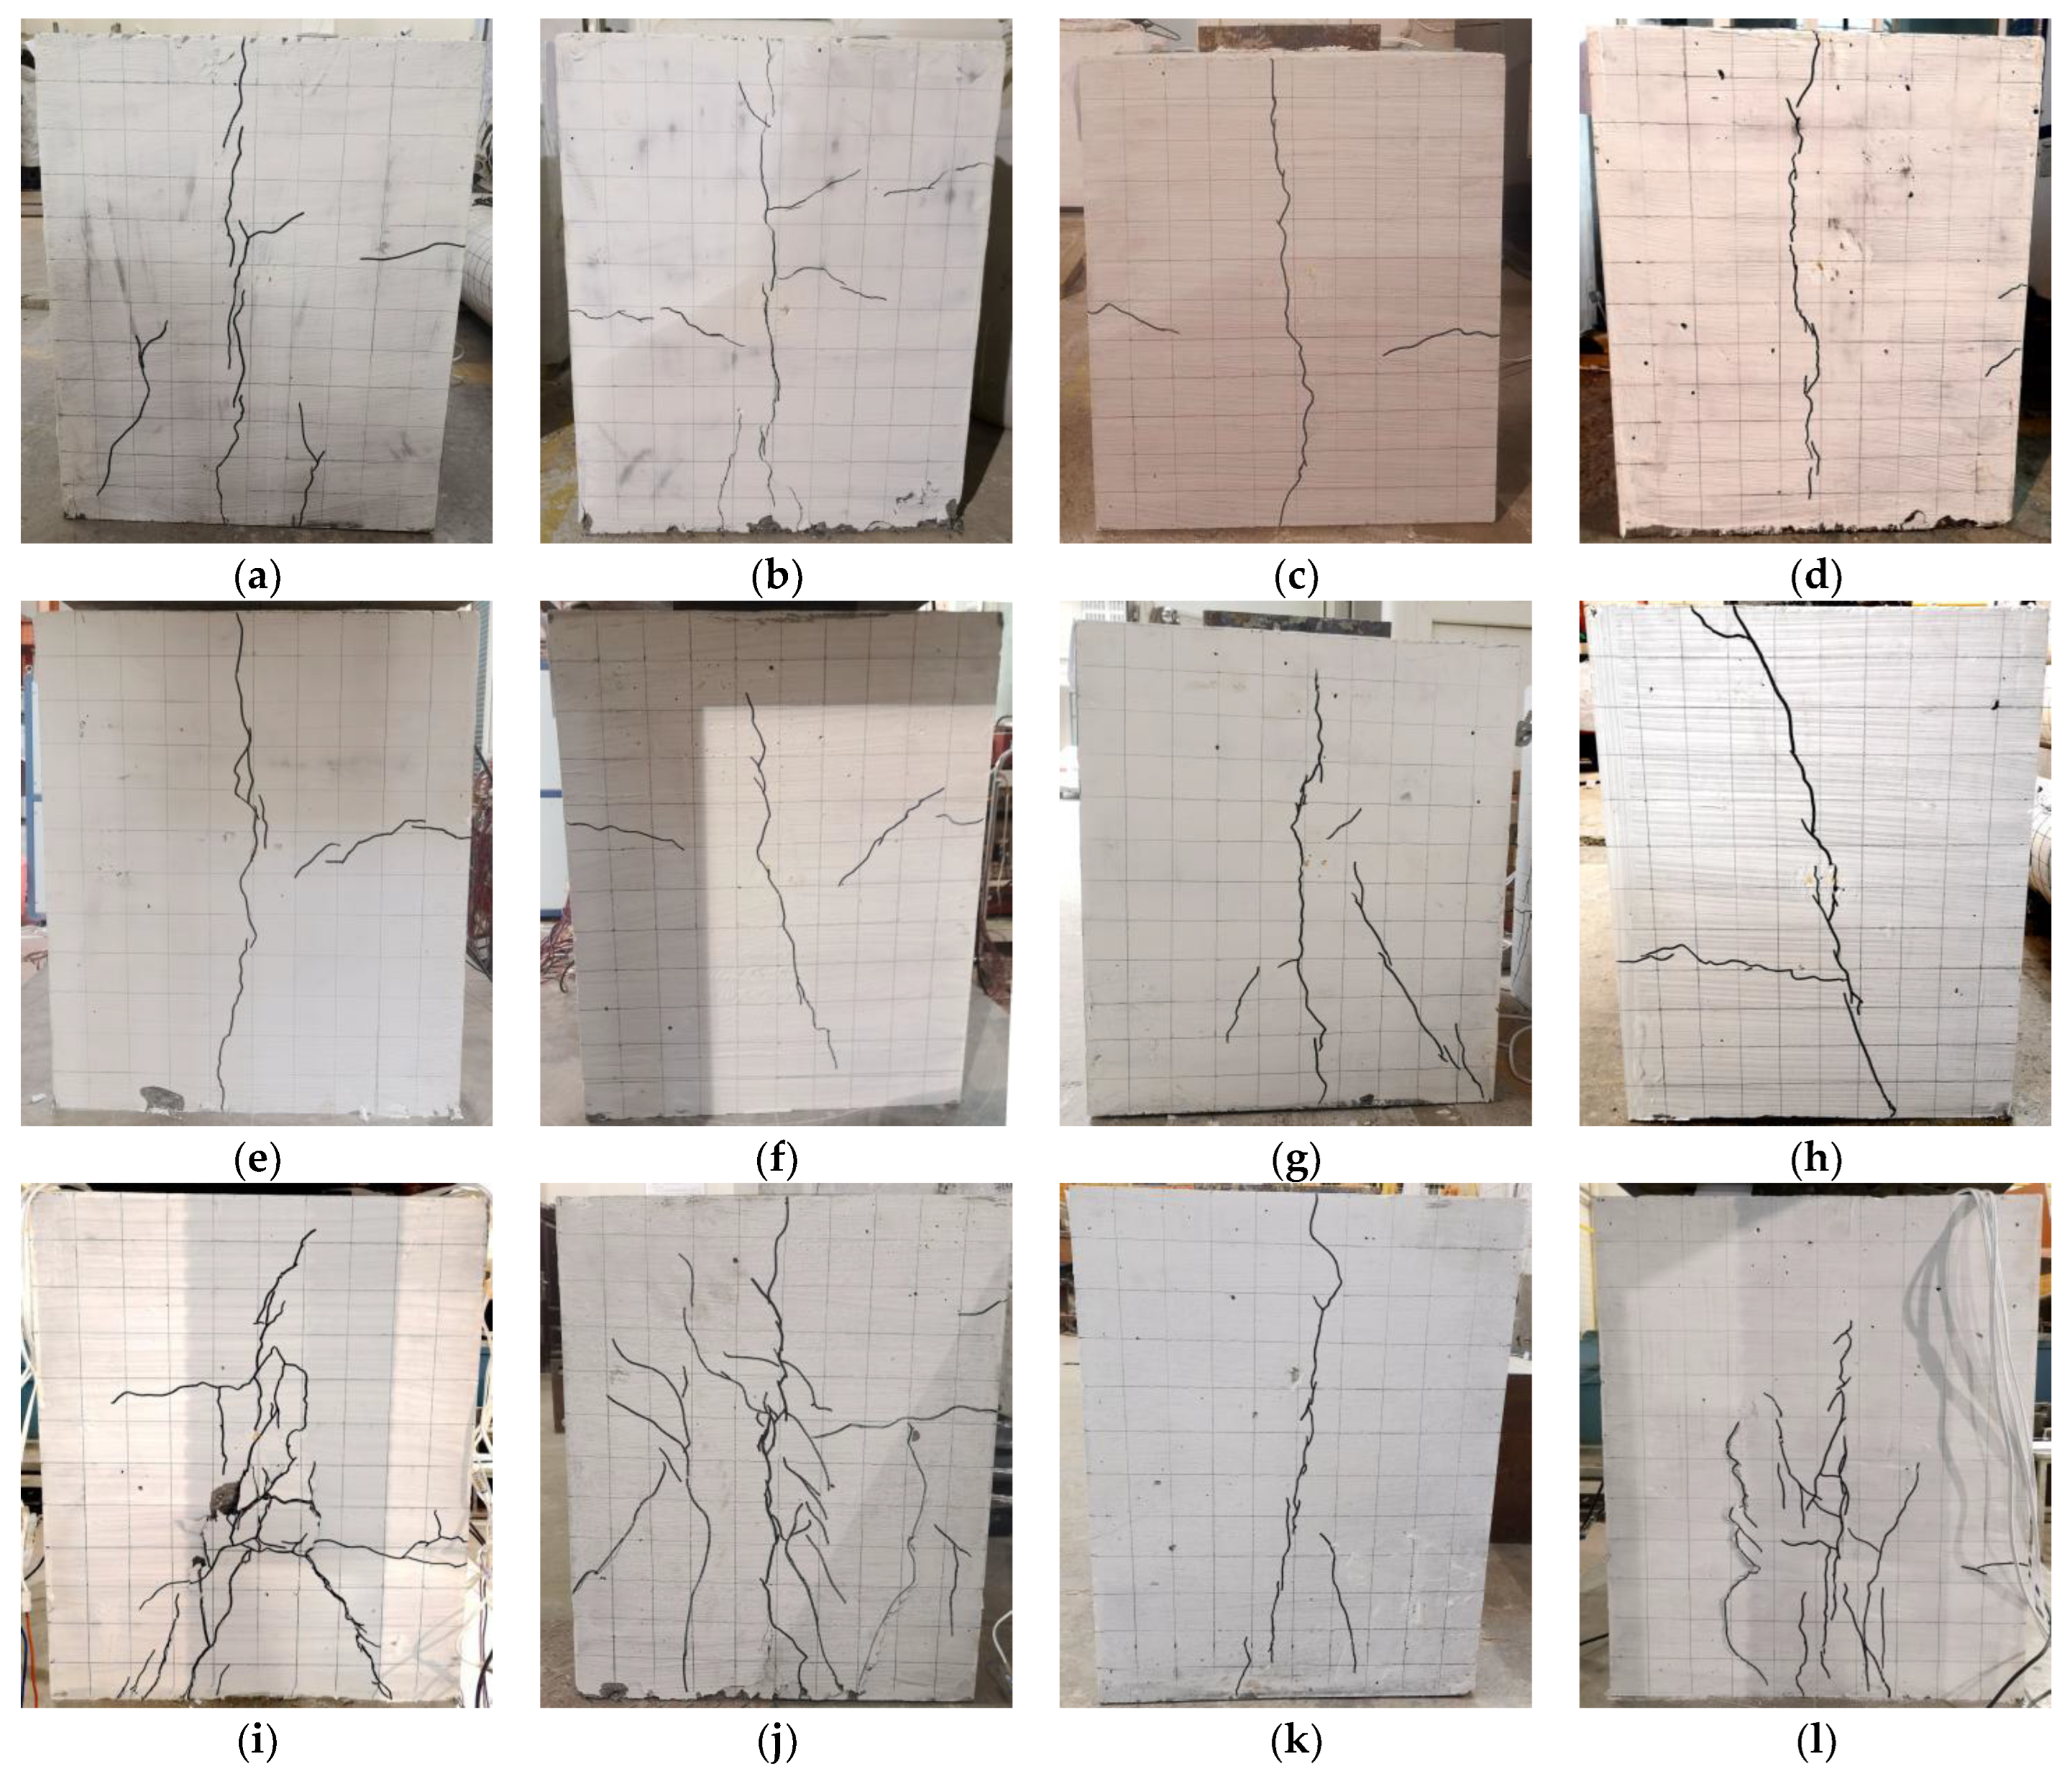
3.1. Failure Modes

The final cracking phenomenon of a concrete slab is shown in Figure 7. During the loading process, all specimens were first cracked vertically along the direction of the steel plate. When the load increased, the cracks gradually extended to the edge of the slab until a main fracture was formed. Meanwhile, transverse cracks centered on the perfobond rib began to appear and develop. For certain specimens, a small number of oblique cracks were observed on the concrete block.
Based on the test results and the previous studies [10,11,25,26], lateral constraints have a significant impact on the failure mode of connectors. As shown in Figure 7a–c,j–l, the increase of the diameter of the perforating rebar can not only provide the vertical force but also enhance the lateral constraints of the concrete dowel, thus limiting the crack width of the concrete slab. Therefore, with the increase of the diameter of the perforating rebar, the number of cracks in the concrete slab increases and the width of the cracks becomes smaller. Compared with Figure 7a,h,i, the existence of transverse reinforcement improved the lateral constraints on the concrete dowel so that the specimens can maintain a high bearing capacity without immediate damage after the peak load, thus allowing more time for concrete slab cracks to fully unfold. Specimen NP-1 with a plain concrete slab had longitudinal splitting failure soon after reaching the ultimate bearing capacity, and the vertical cracks gradually developed and widened until the whole concrete slab was penetrated. Specimen SP-1 with segmental stirrups had the largest number of cracks, most of which were small in width, and several oblique cracks appeared in the concrete blocks. In the case of the same size of specimens, the concrete wrapping force is mainly affected by the strength of concrete. However, by comparing Figure 7a–c,j–l, the failure modes of specimens with different strengths of concrete had little difference, and the crack pattern was similar. It can be seen from Figure 7a,e,g that when the lateral constraints were basically the same, the cracking phenomenon of the concrete slab of P-1 with a small hole area was more obvious than that of Specimens P-5, LP-1 and HP-1 with a large hole area.
To investigate the shear failure mechanisms of perfobond connectors, the specimens were broken to observe the inner failure modes. Figure 8a–c shows the internal failure modes of perfobond connectors with circular, long, and high holes, respectively. The three failure modes differed slightly, though their shear mechanisms remained essentially identical. Connectors featuring a perforating rebar eventually formed a relatively complete shear surface. On the surface, coarse aggregate can be found to be cut off, the top of the concrete dowel was almost squeezed out, the bending and shear deformation occurred through the perforating rebar, and the deformation of perforating rebar in connectors with large hole areas was smaller. As illustrated in Figure 8d, the failure modes of circular hole connectors without transverse reinforcement were similar to those with transverse reinforcement. Meanwhile, the shear failure surface was not as smooth as that of the transversally reinforced connectors, less of the concrete dowel was extruded, and very little deformation occurred in the perforating rebar. As shown in Figure 8e, the single-hole connector formed a fairly smooth shear plane, and the perforating rebar was ultimately cut off. It can be seen from Figure 8f that the concrete dowel without perforating rebar underwent failed shear, its fracture surface was relatively flat, and a white powder was generated by friction after the coarse aggregate was cut off. It can be concluded from Figure 8 that the stronger the lateral constraint, the closer the concrete dowel is to the forced shear failure. Whether the perforating rebar is set does not affect the failure mode of the concrete dowel when in a state of good lateral constraint.

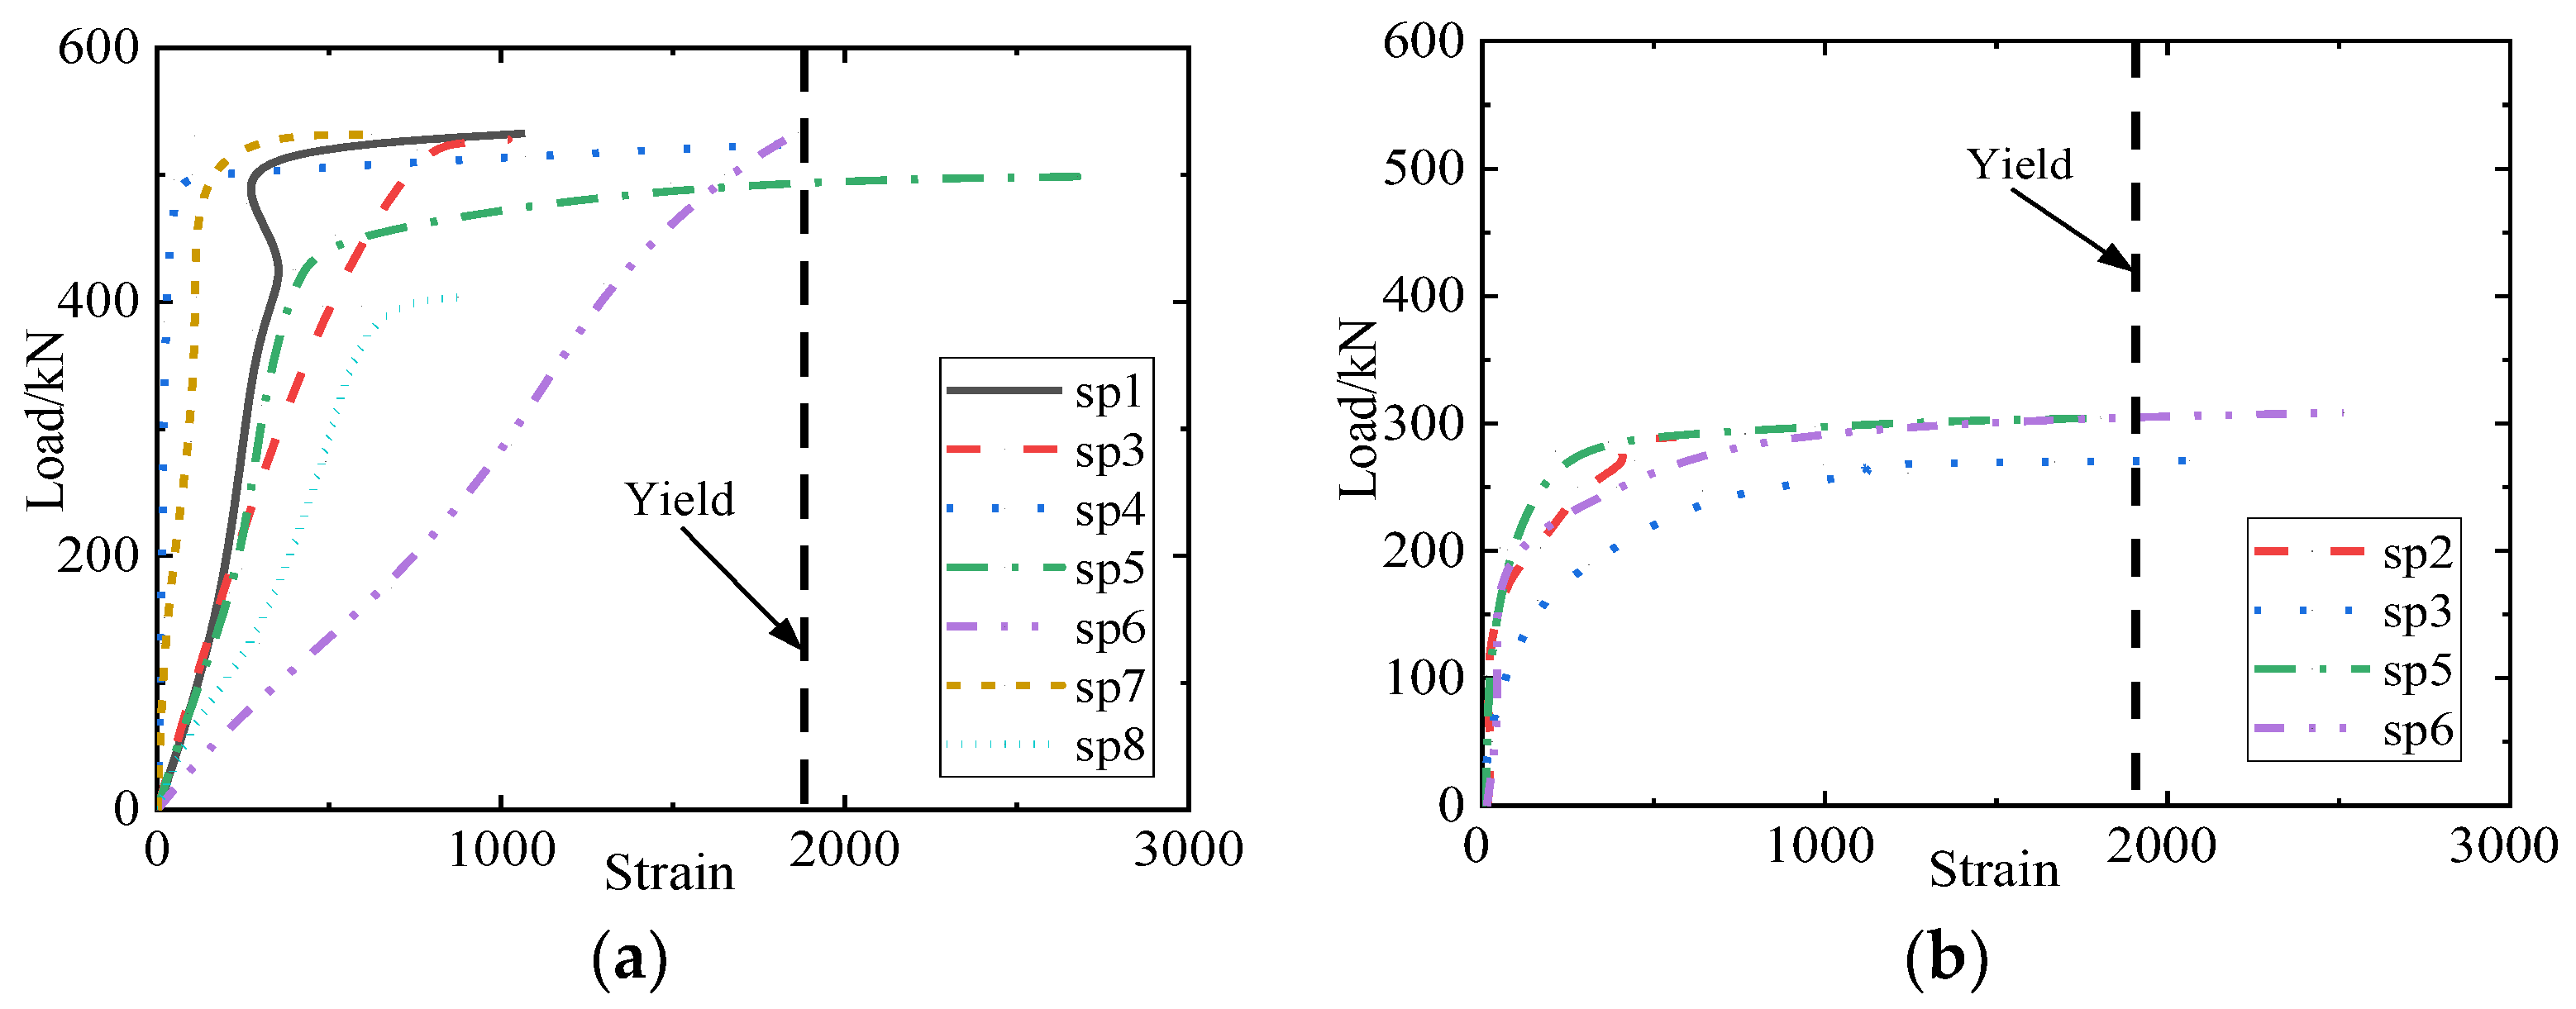
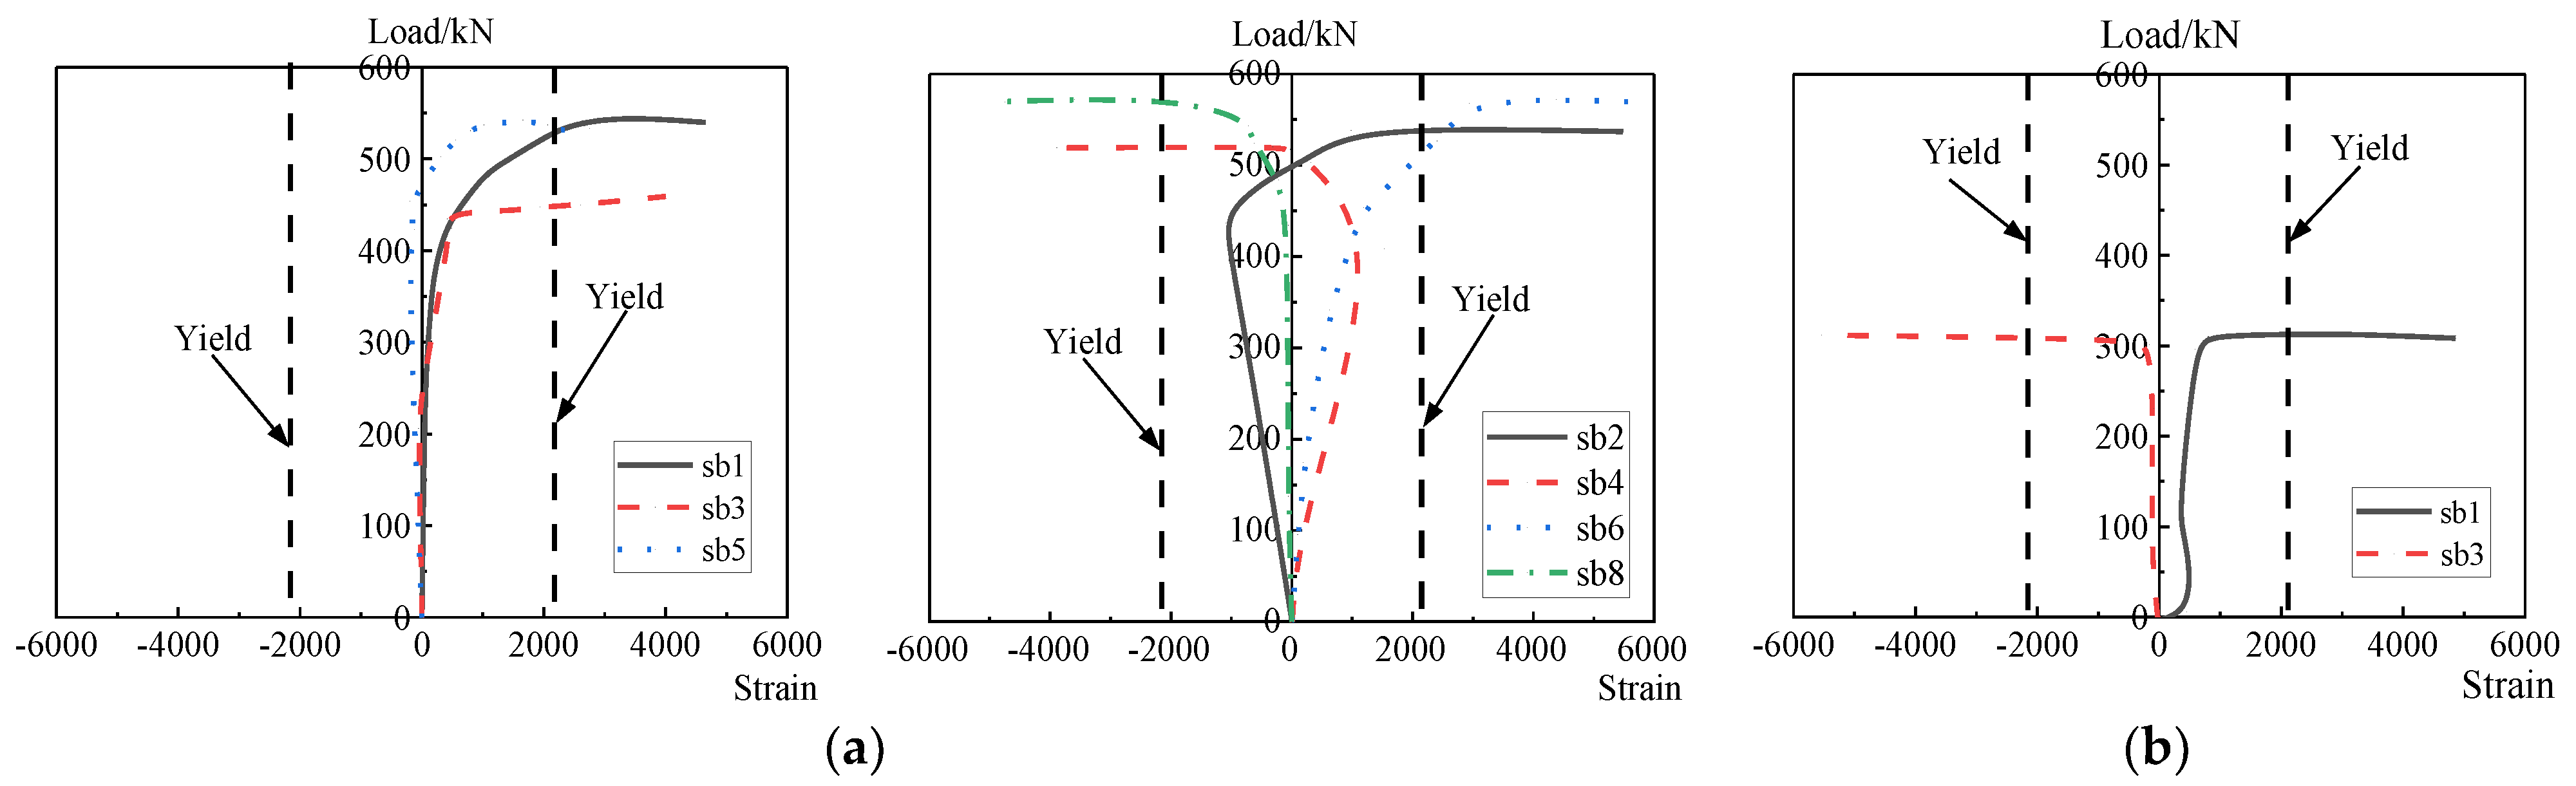
3.2. Strain Analysis of Perfobond Rib and Perforating Rebar

To study the failure mechanisms of the connectors, the strains of the perfobond rib and perforating rebar were analyzed first. Specimens P-1 and P-4 were taken as representatives of double and single-hole connectors, respectively, and their load–strain curves (after removal of the damaged strain rosette) are shown in Figure 9. The strain value of the perfobond rib near the H-shaped flange exceeded that of the outer one. When the specimen reached its ultimate load, each measuring point of the steel plate remained in the elastic region. Under a continuously increasing slip, the concrete dowel gradually lost functionality, whilst the perforating rebar began to make contact with the steel plate, further increasing the stress. Finally, a small principal strain of the perfobond rib produced a yield value of 1890 με, attributable to the thick steel plate used in the test; the perfobond rib exhibited minimal deformation (see Figure 8).
Figure 10 shows the load–strain curves of the perforating rebar for the P-1 and P-4 specimens. The tensile strain is positive, and the compressive strain is negative. It can be seen that in the initial loading stage, the concrete dowel bore the loads. Hence, the rebar strain value was small. When the load increased, the perforating rebar and concrete dowel resisted shear together. Meanwhile, the rebar strain increased rapidly. In contrast, when the specimens reached the ultimate load, many of the reinforcing bars still did not yield, and the strain of the rebar exceeded the yield strain of 2215 με by the end of the loading. Simultaneously, the upper and lower parts of the perforating rebar were seen to be tensioned and compressed, respectively, indicating that the perforating rebar was subject to pull-bending action. Hence, it can be concluded that the perforating rebar in the concrete dowel provided both vertical shear contribution and axial force.

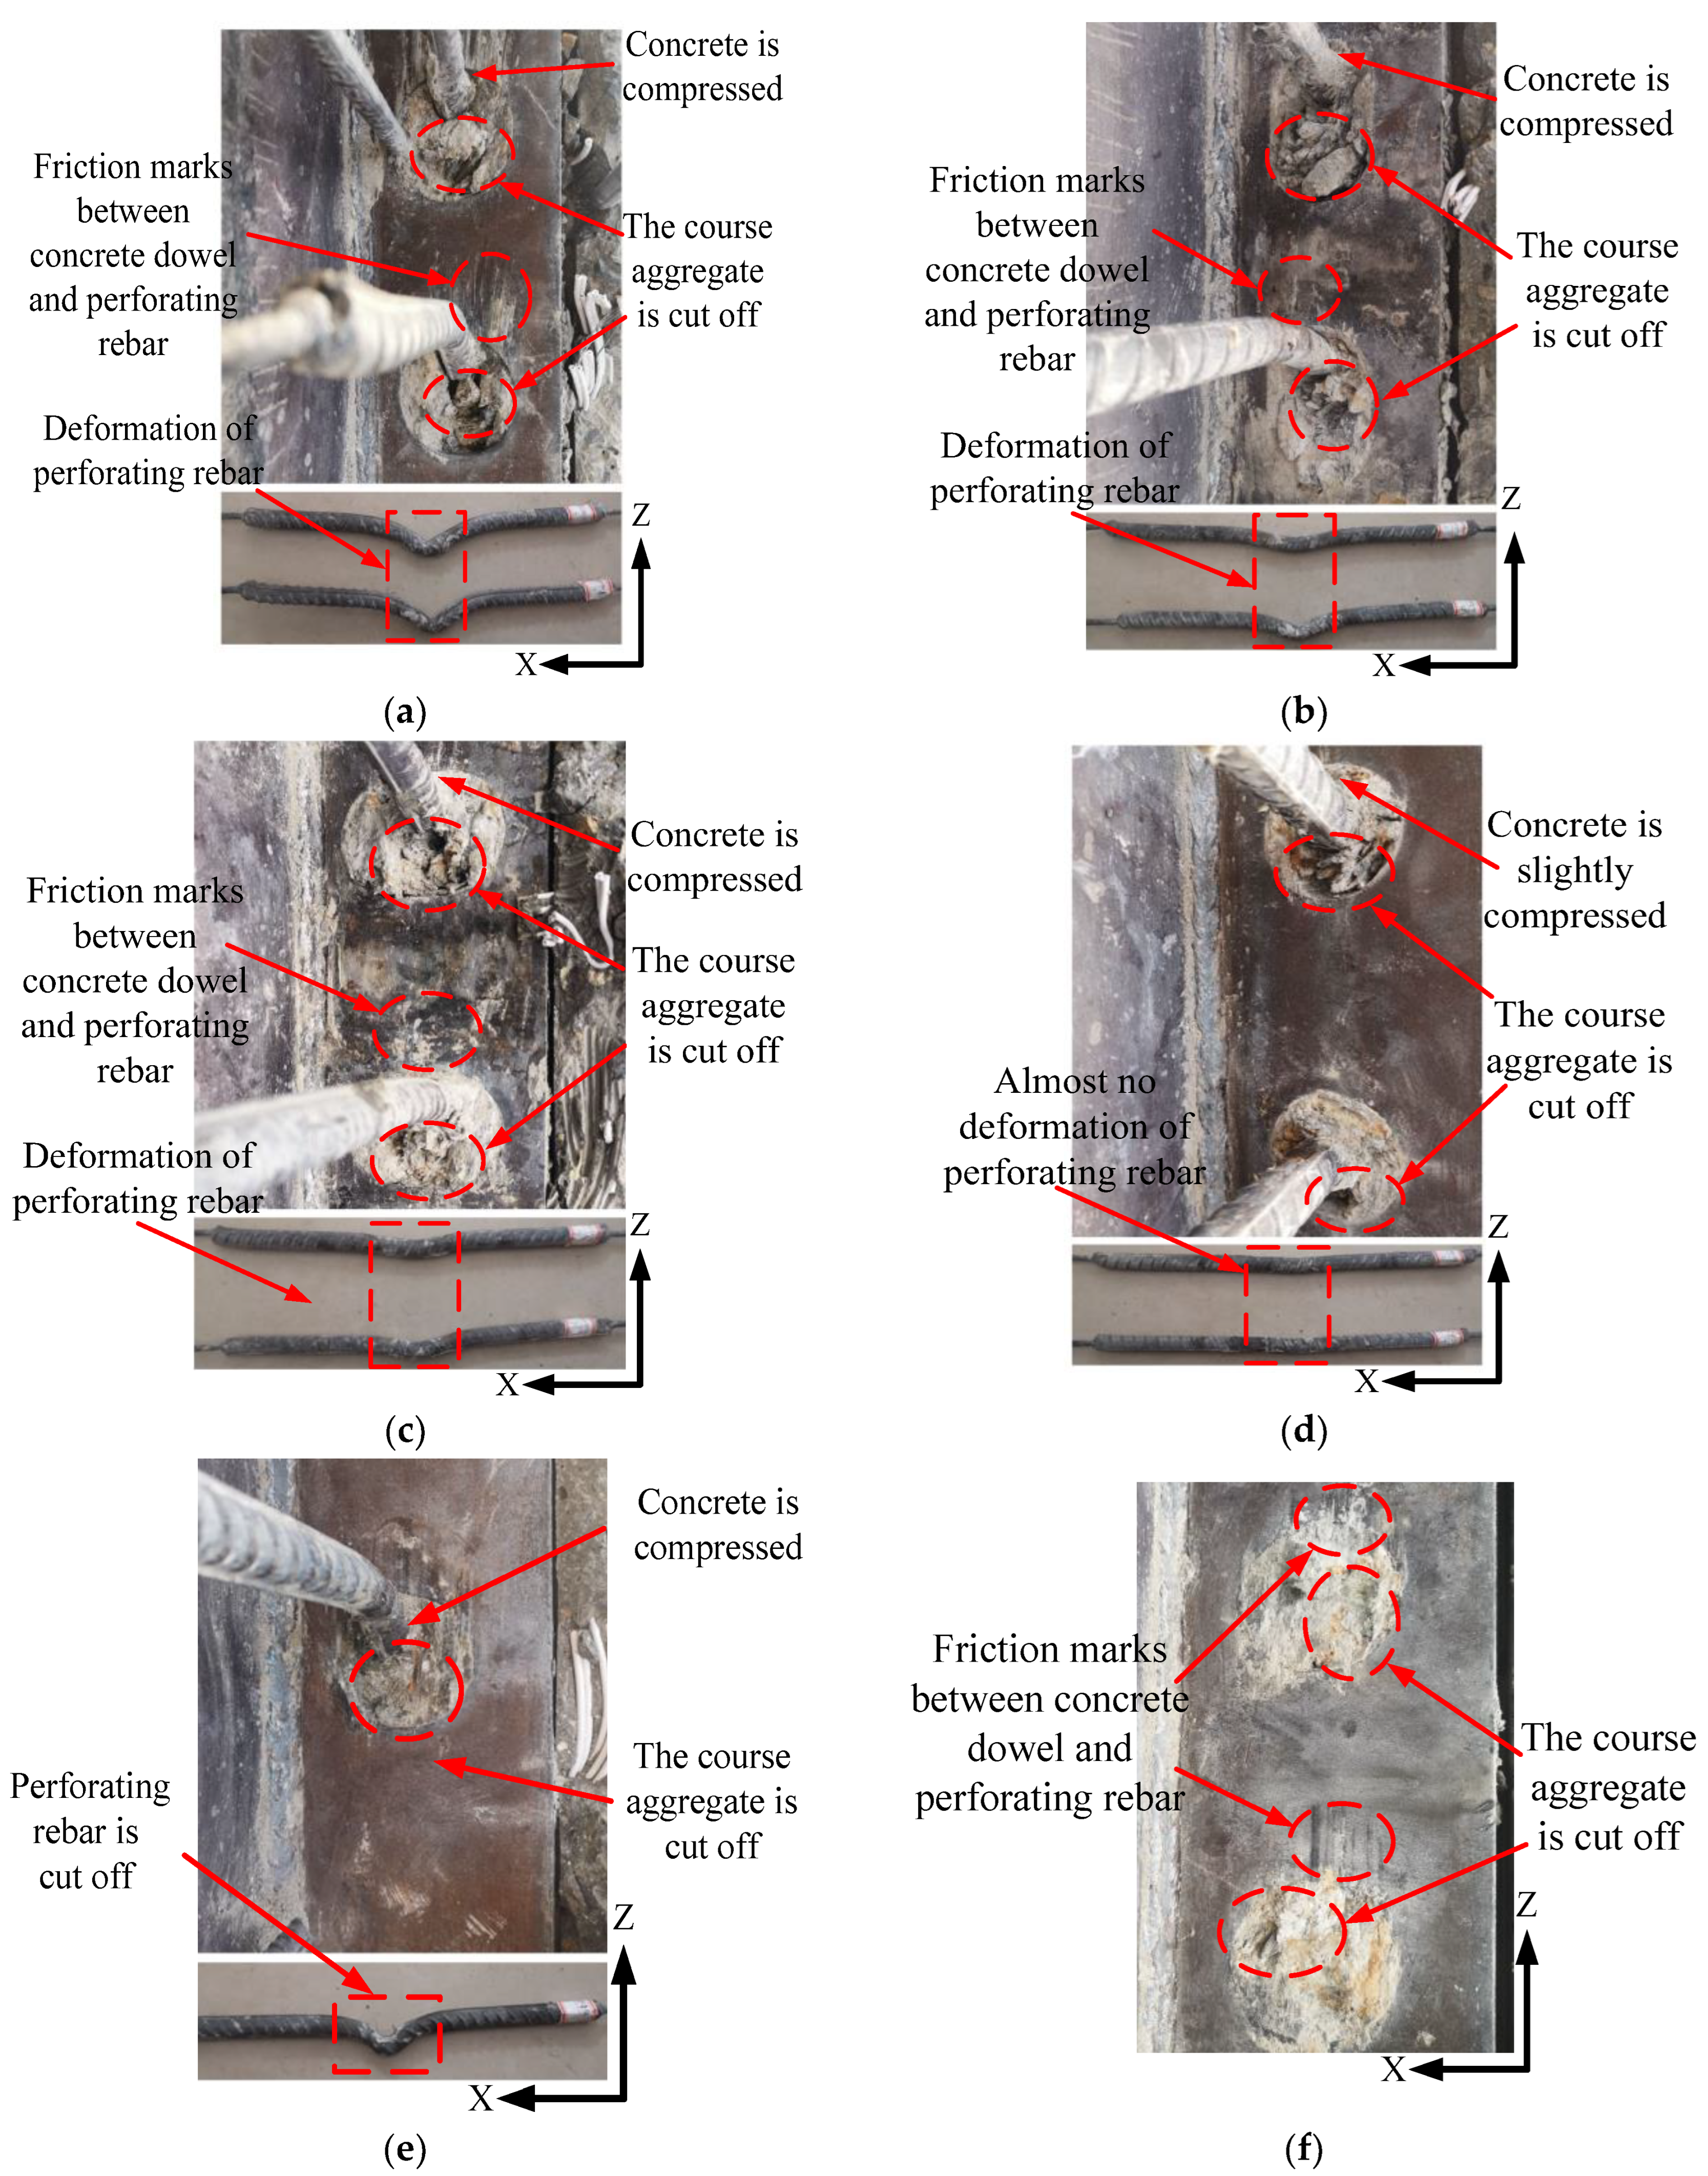
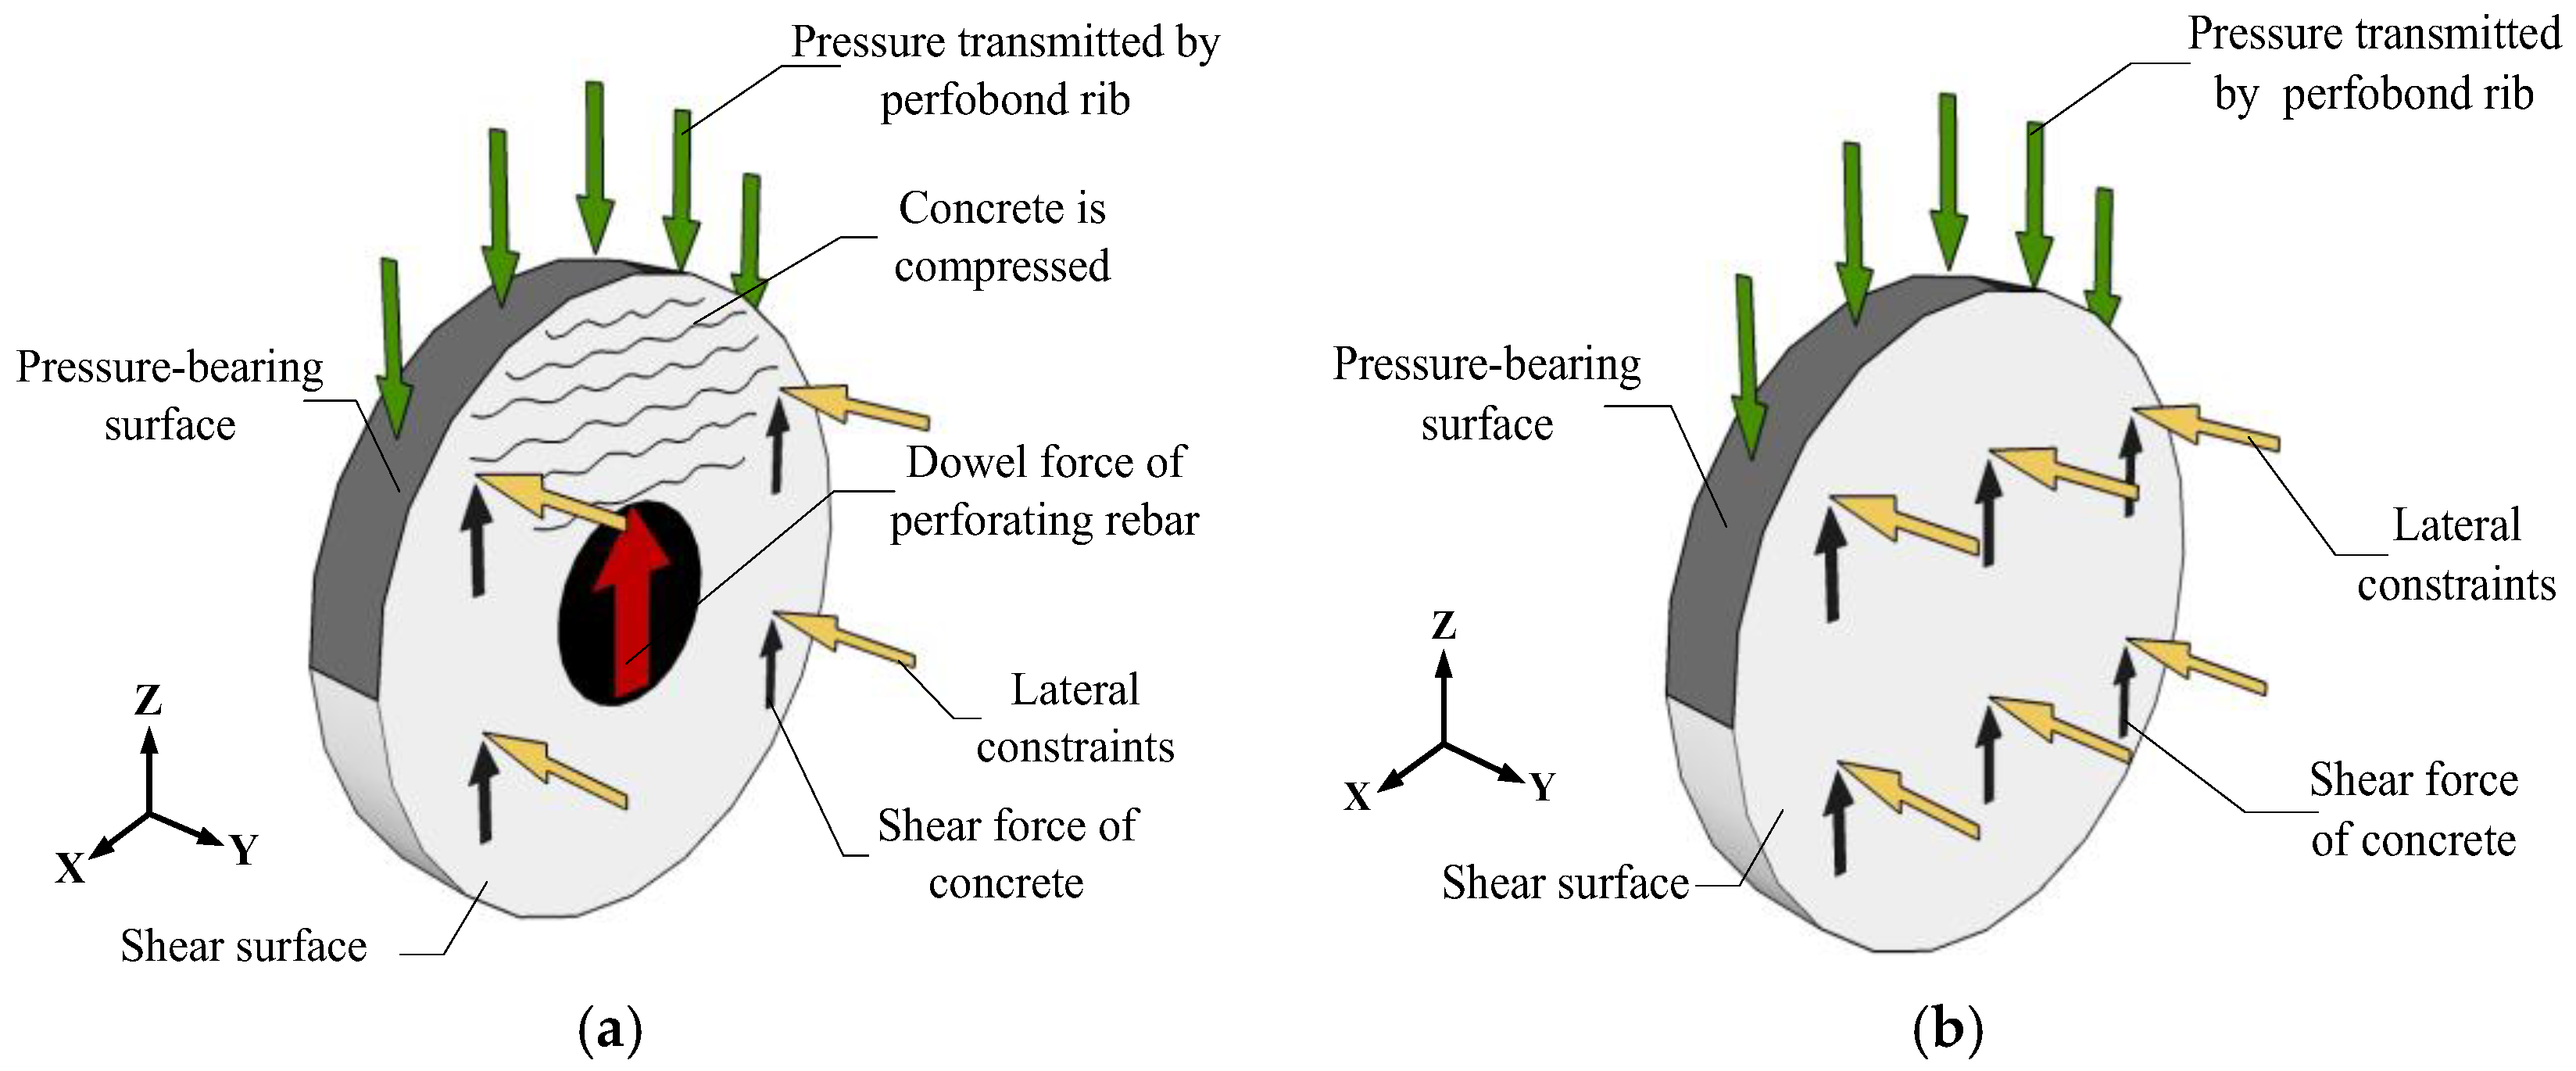
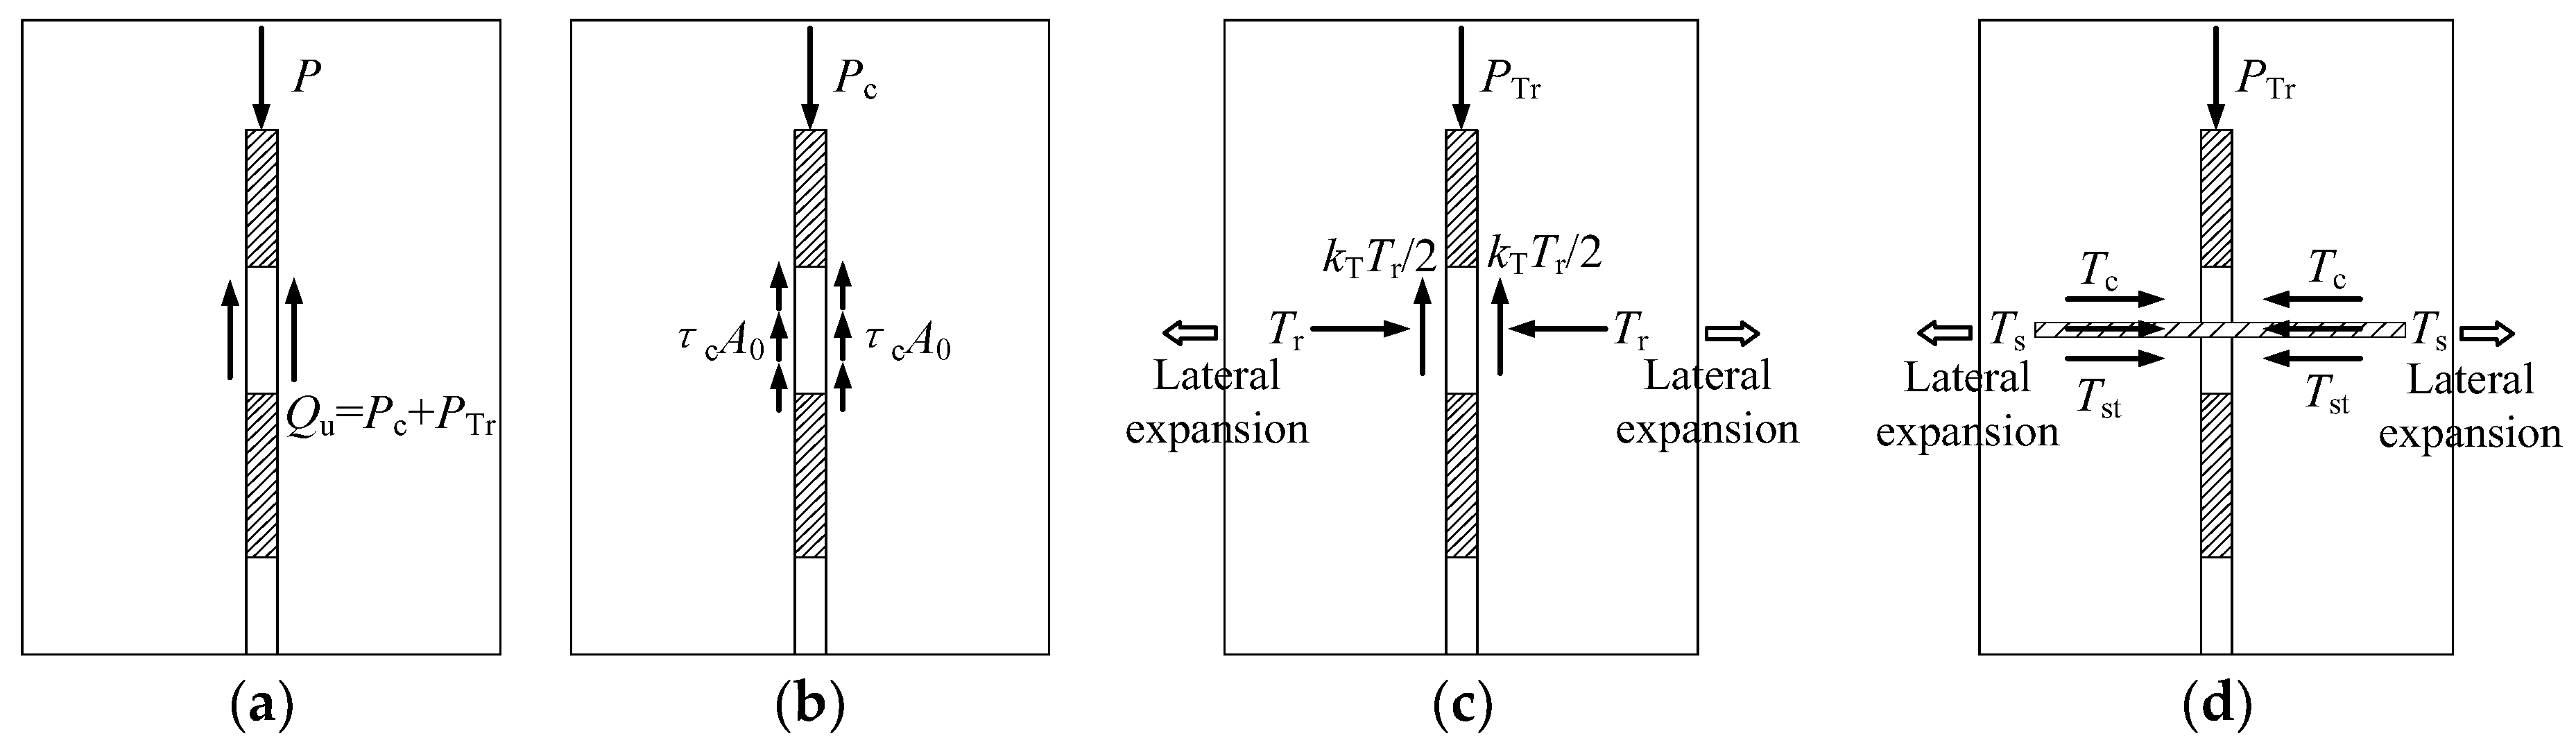
3.3. Shear Failure Mechanism of Connectors

The strain analysis results for the perfobond rib (Figure 9) show that the steel plates underwent no notable deformation; this suggests that the failure modes of the concrete dowels and perfobond rib should be the primary focus when studying the shear mechanism. Using the inner failure states of the connectors in Figure 8 and the data measured in the test, the force-transfer mechanism of the connector was analyzed using a single hole as an example. As shown in Figure 11, the vertical load acting upon the steel was transmitted to the concrete dowel via the local bearing surface between the perfobond rib and concrete, and subsequently transferred to the surrounding concrete through the shear concrete surface and perforating rebar, in the form of shear load. Owing to its dilatancy, concrete not only provides a shear bearing capacity but also produces an additional horizontal dilatancy effect, which is constrained by the surrounding concrete, the rebar in the hole, and the transverse steel bar [11,12], namely “lateral constraints” in this paper. Previous studies have found that lateral constraints significantly determine the bearing capacities and failure modes of connectors [11,12,25,26,30]. Therefore, the shear mechanisms of perfobond connectors can be classified into two categories: those with and without a perforating rebar.
The connectors featuring the three different hole shapes exhibited the same shear failure mode; therefore, the shear failure mechanism can be investigated by using the circular hole as a typical example, as shown in Figure 12a. The load was first transferred to the concrete dowel through the partial bearing surface, and this was associated with compression deformation of the concrete between the perfobond rib and perforating rebar. When an increasing load was transmitted to the rebar, bending and shearing deformation occurred throughout the reinforcement, in response to which the vertical and axial forces of the rebar provided shear resistance and constrained the concrete dowel, respectively. Meanwhile, the load was transferred to the surrounding concrete in the form of a shear load through the shear plane. This indicates that the concrete in the hole undergoes a tri-axial compression through the perforating rebar, the perfobond rib, and the surrounding concrete [20,22]. During cracking, the concrete wrapping and transverse reinforcement produced lateral constraints on the concrete dowel, alongside the axial force through the reinforcement.
It can be seen from Figure 12b that in the connectors without a perforating rebar, the load was initially transferred to the concrete dowel via the steel plate before being shifted to the surrounding concrete through the shear surface. When the shear plane exhibited clear shear-slip deformation, the concrete cracks propagated along the direction of the perfobond rib. The lack of a rebar in the concrete dowel meant that the shear plane of the concrete dowel was confined only by the concrete wrapping and transverse reinforcement.
The findings of Wei and Xiao [31] and Furukawa et al. [32], combined with the shear failure mechanism described in this paper, indicate that double-sided shear failure occurs in the connectors when the thickness of the perfobond rib exceeds 9 mm.

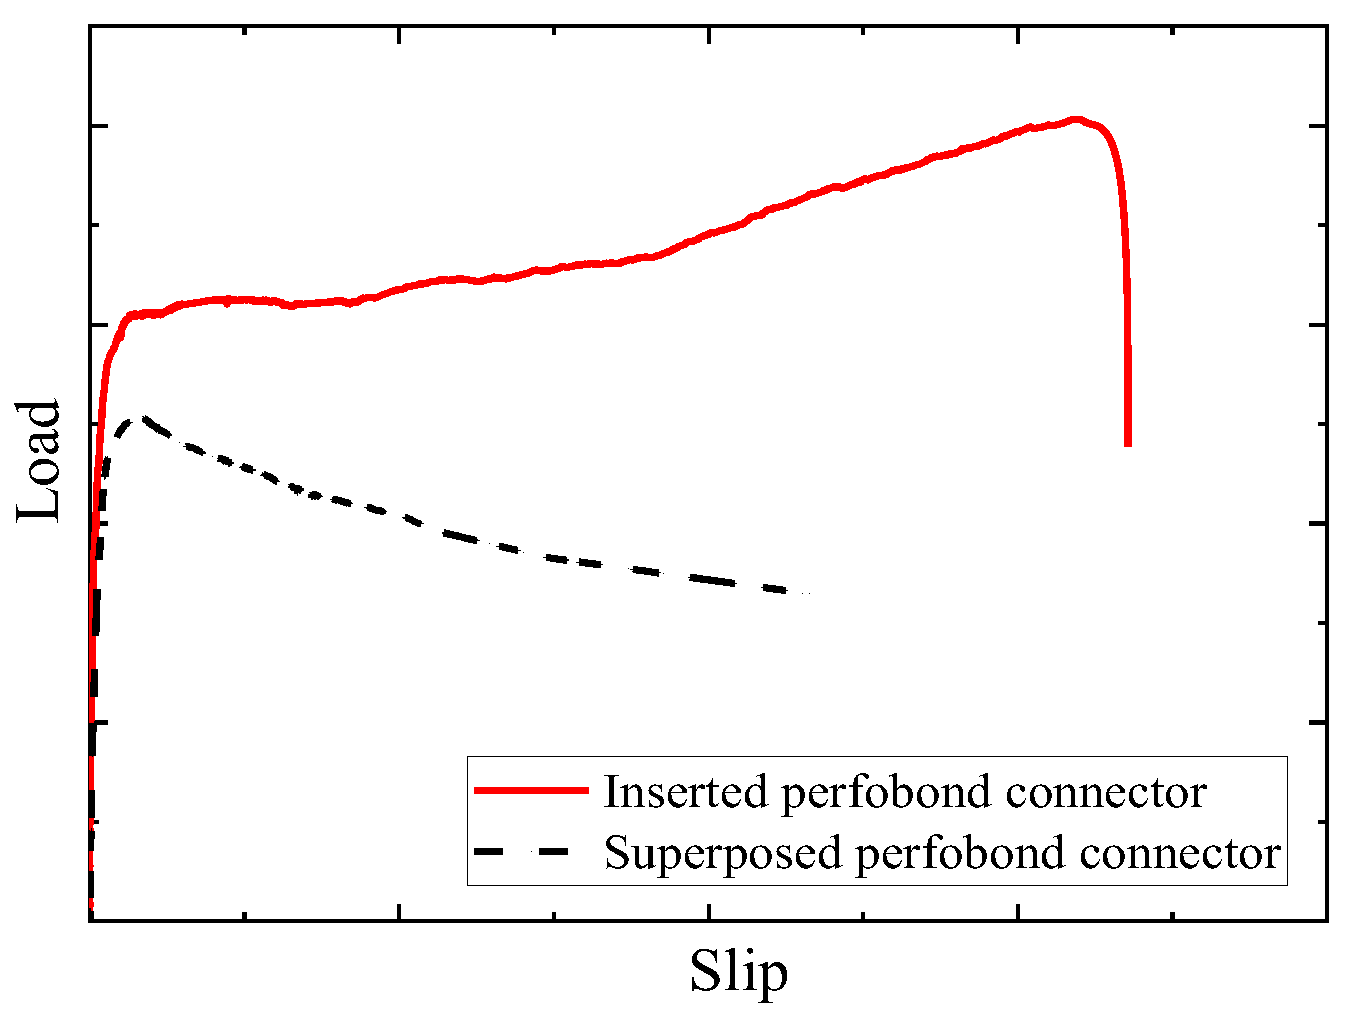
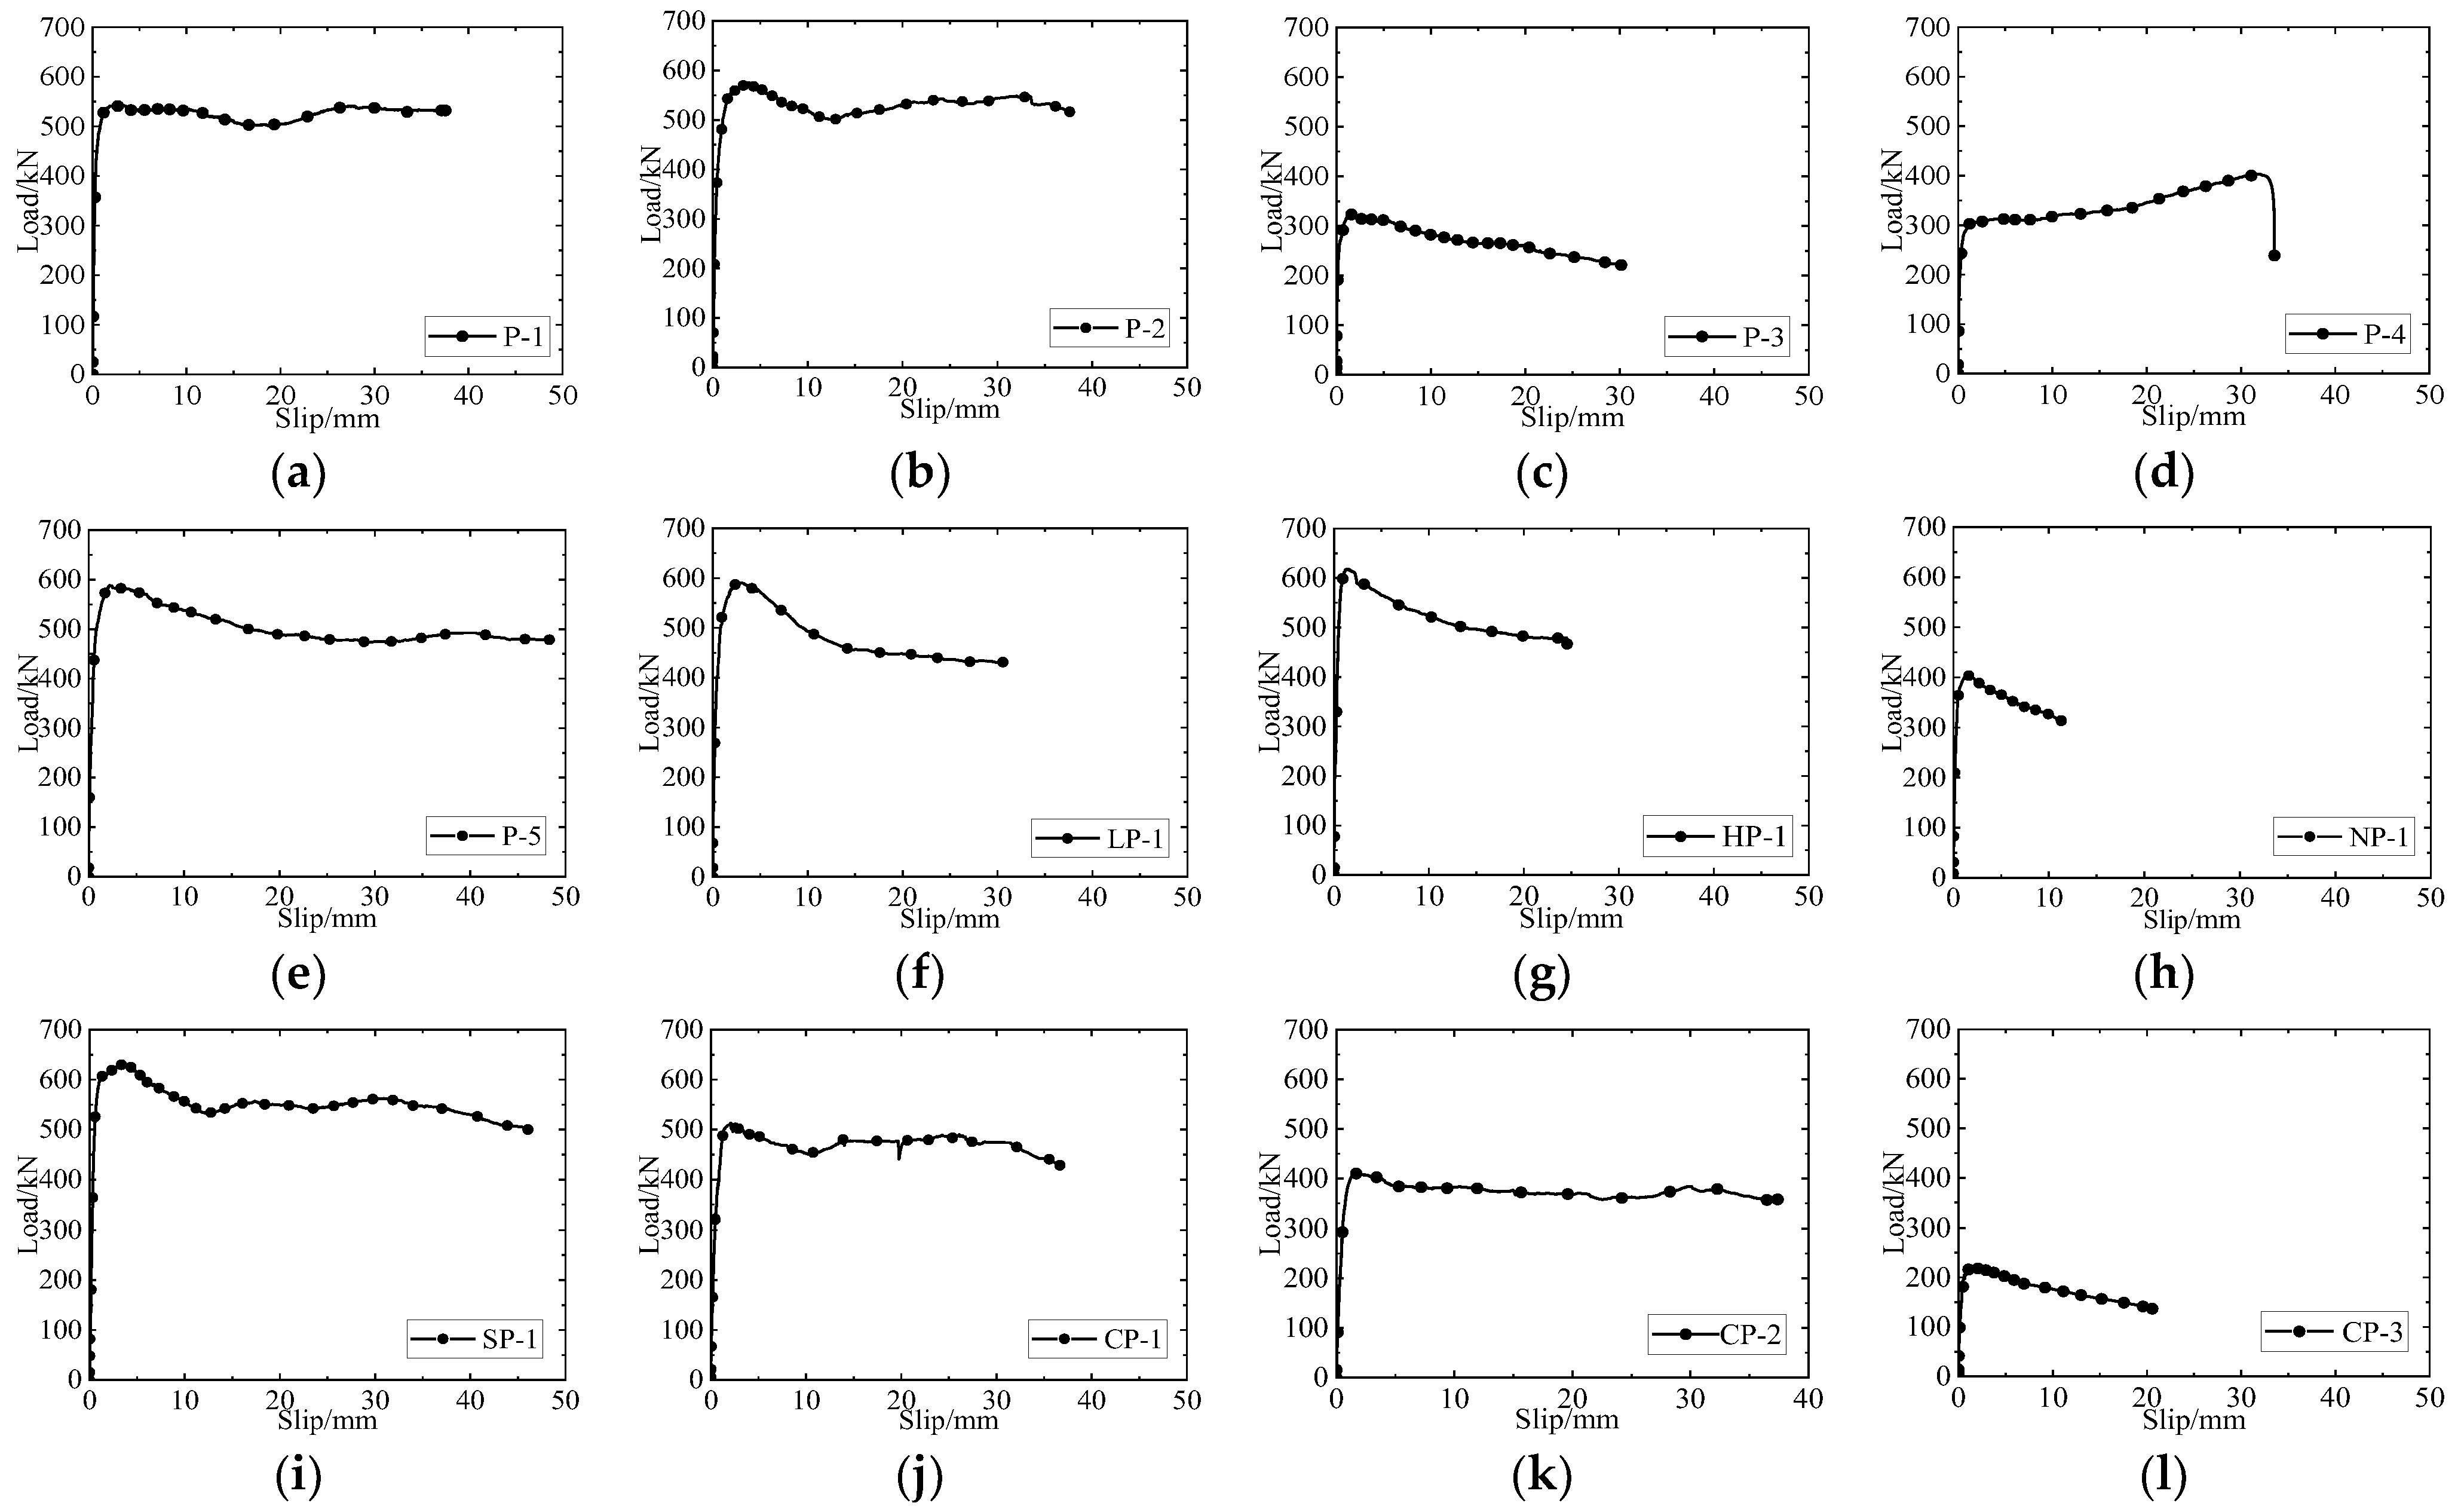
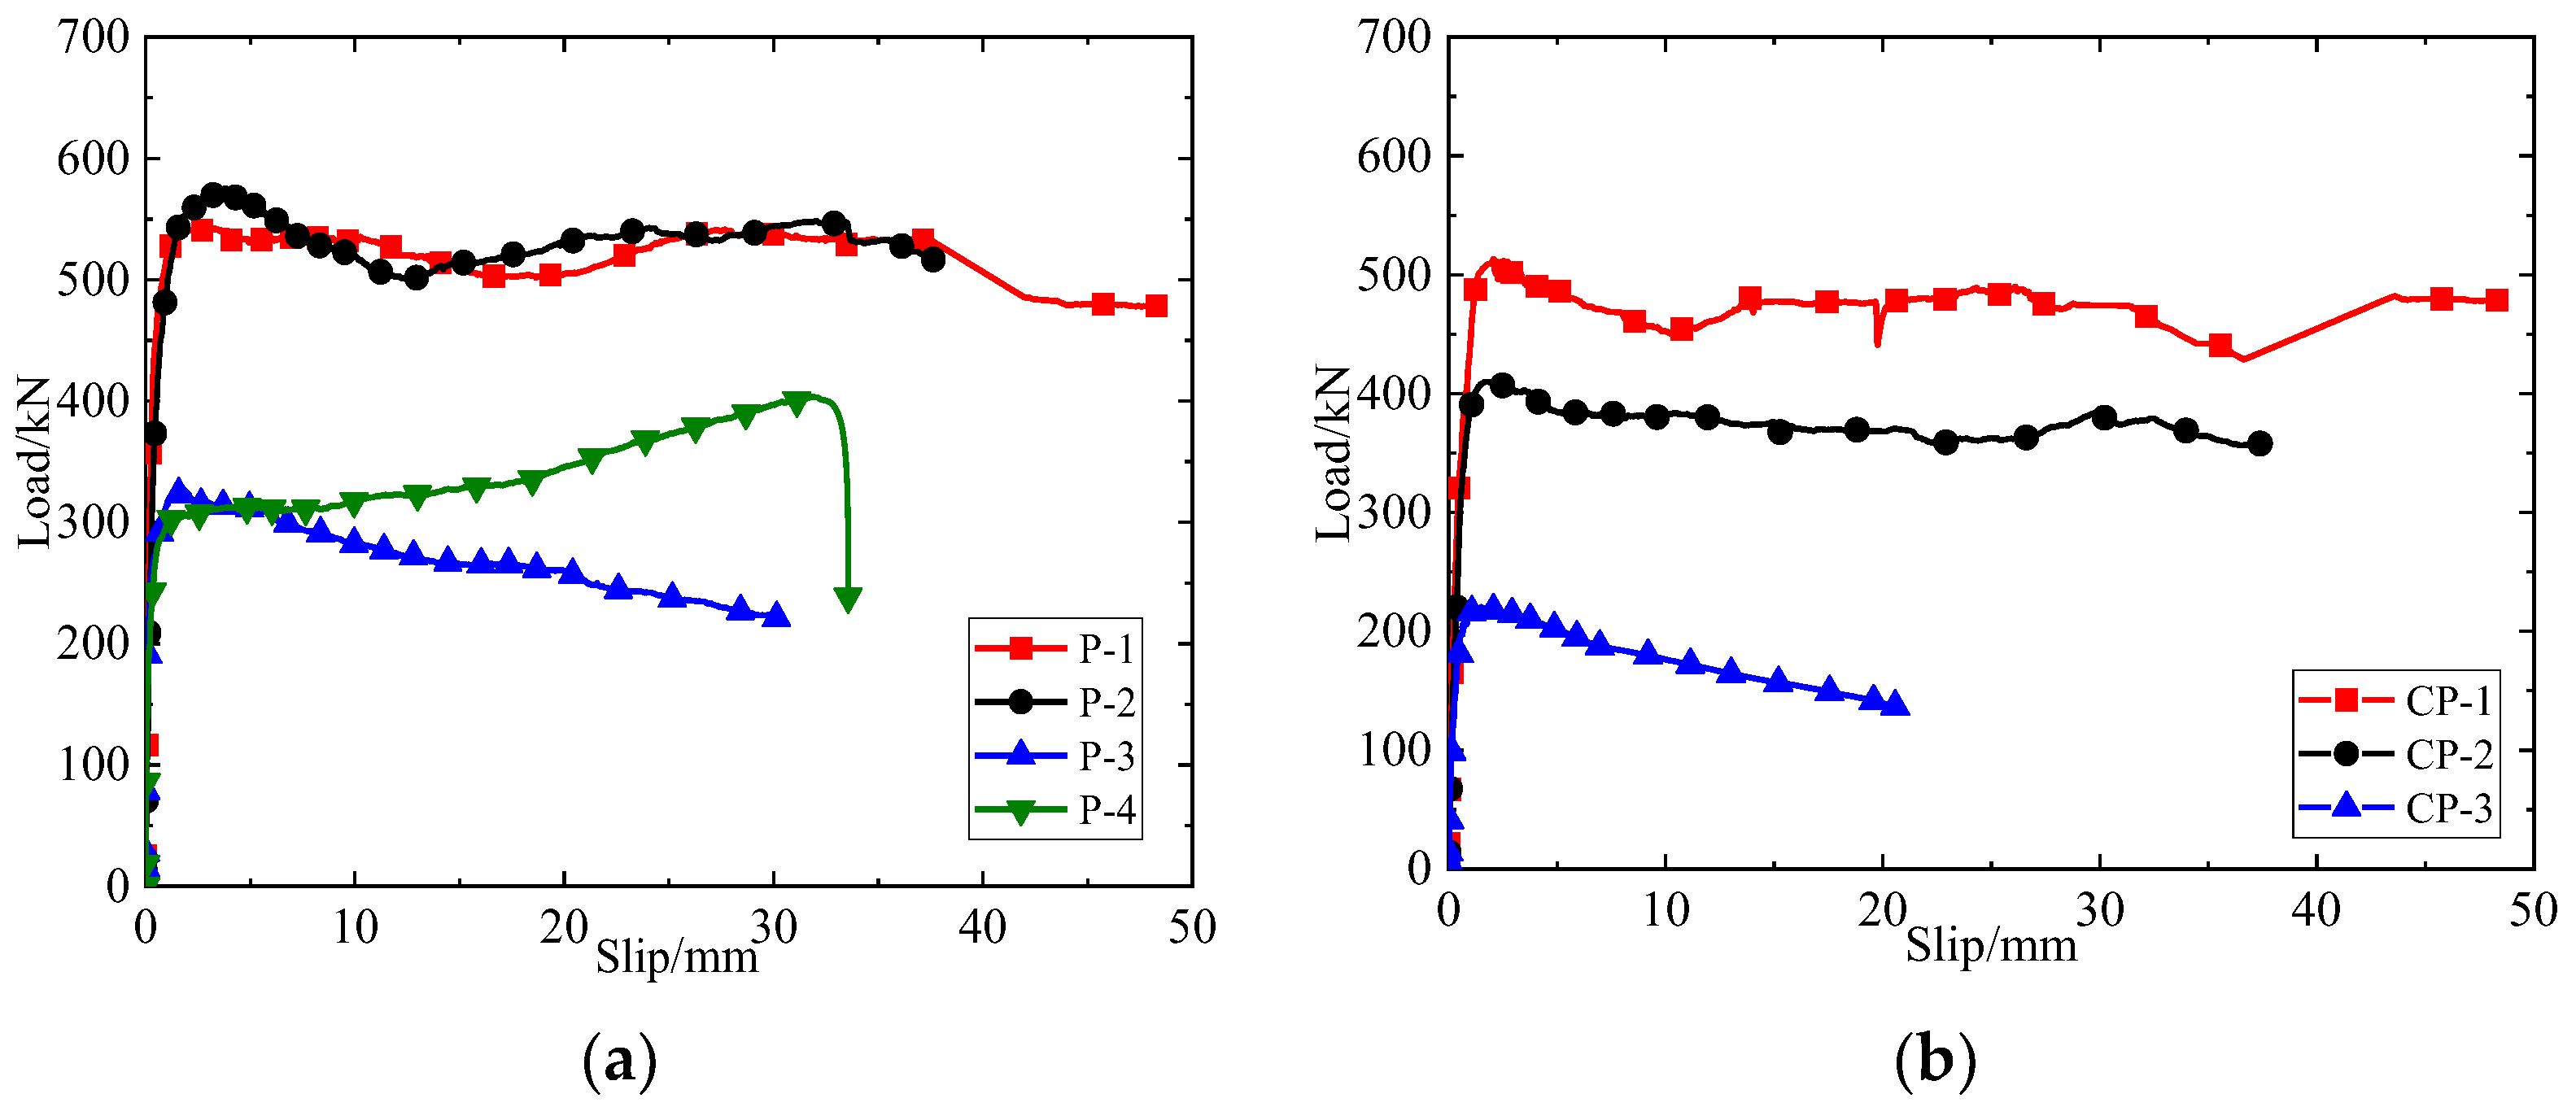
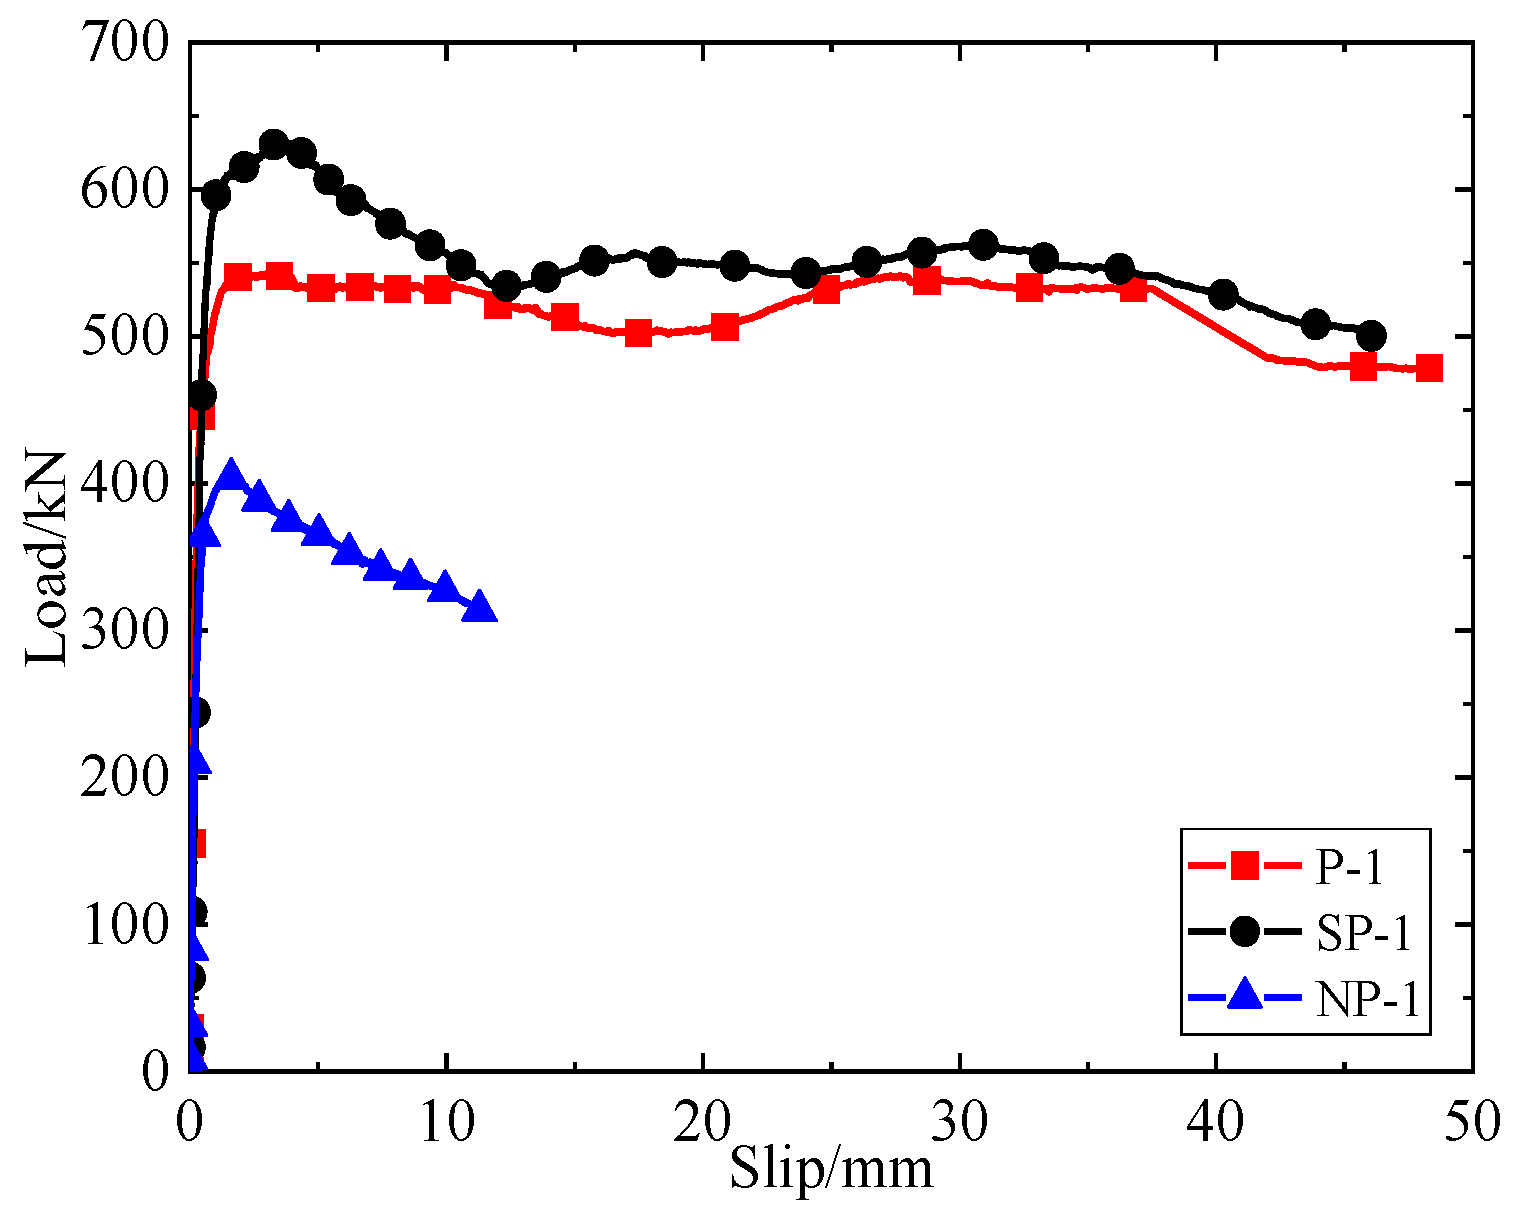
3.4. Load–Slip Curve

Figure 13 shows the load–slip curves of the specimens. The perfobond connectors exhibited considerable shear stiffness in the elastic stage. When the curve reached the evident inflection point, the slippage of specimens was less than 2 mm, which conforms to the design of the rigid connectors. Nevertheless, the load–slip curves show clear distinction at the post-yield stage.
For the single-hole connectors (Specimen P-4), the load–slip curve varied markedly: as shown in Figure 13d, the load–slip curve was similar to that of an inserted perfobond connector with strong constraints. When the specimen was loaded to the yield state, the bearing capacity continued to increase slowly due to the reinforcing effect of perforating rebar. Finally, the perforating rebar was cut off; meanwhile, the capacity fell suddenly at the moment the displacement reached 32 mm. As shown in Figure 7a–c,j–l, the bearing capacity of the connectors without perforating rebar gradually fell to 80% after the peak load (e.g., Specimens P-3 and CP-3). On the contrary, the bearing capacity of perfobond connectors with perforating rebar fell slightly after the peak load. Subsequently, the curve rose again thanks to perforating rebar, showing the phenomenon of secondary reinforcement. Until the termination of loading, the curve stayed stable without a significant decrease (e.g., Specimens P-1, P-2, CP-1 and CP-2). Based on Figure 13a,h,i, even if each specimen has perforating rebar in the hole, Specimen NP-1 had a lower bearing capacity because of no transverse reinforcement in the slab, the capacity attenuation rate was the fastest after the peak load, and soon fell to 80% of the peak value, the specimen did not exert the reinforcing effect of the perforating rebar. However, for the Specimens P-1 and SP-1 with ordinary stirrups and segmental stirrups, respectively, the bearing capacity gradually decreased after the peak load, and then the curve rose again slowly. The load–slip curve shows a secondary strengthening effect. As illustrated in Figure 13a,e–g, Specimens P-1, P-5, LP-1 and HP-1 (featuring different-sized holes) featured a perforating rebar and transverse reinforcement. Hence, the load–slip curves exhibited little difference, and the loads did not attenuate significantly after the peak value, meaning that a good load-holding capacity was maintained. However, there was no secondary strengthening section in the curve of specimens P-5, LP-1 and HP-1 due to the larger hole areas.
According to the characteristics of the load–slip curve, the static performance indexes of each specimen were calculated, as shown in Table 4. Considering the mechanical differences between specimens, the values of the performance indexes were stipulated as follows: the ultimate bearing capacity Pu was the maximum load during the test; for Specimen P-4, which did not exhibit a descending section in its curve, the ultimate bearing capacity Pu was the corresponding load when the slip reached 20 mm [33]; according to EC4 [28], the characteristic value PRk was defined as 0.9Pu; the design value PRd was computed according to
P Rd = f u f ut P Rk γ v P Rk / γ v
where fu is the design ultimate strength of the material, fut is the actual ultimate strength of the material, and γv is the security coefficient, which was set to 1.25 [28]; the shear stiffness K adopted the secant stiffness with a relative slip of 0.2 mm [34] on the curve; the ultimate slip δu was the corresponding slip value when the load reached PRk [28], which was 20 mm [33] for specimens whose loads did not fall to PRk; and the ductility coefficient D was taken as the ratio of the ultimate slip δu to the design slip δd, corresponding to the design value PRd of the bearing capacity.
Table 4 shows that the perfobond connectors in this study generally had a high ultimate bearing capacity, shear stiffness, and ductility, attributable to the high stirrup strength in the specimens. The concrete dowel was subjected to strong lateral constraints; thus, the bearing and load-holding capacities of the connectors were excellent.

3.5. Test Parameter Analysis

3.5.1. Shear Capacity

It can be seen from the comparison between Specimens P-1 and P-4 in Figure 14a and Table 4 that when the number of holes changes from 1 to 2, the shear capacity of the connectors increases by 57.1%. However, the shear capacity of the double-hole connector is not a simple superposition of that of the single-hole one, owing to the stress complexity of multi-hole perfobond connectors.
As shown in Figure 14, by combing this with the data in Table 4, when the concrete strength was increased from 42.82 to 72.20 MPa, the connectors without a perforating rebar and with 16 and 20-mm-diameter perforating rebars exhibited shear capacity increases of 48.0%, 32.0% and 12.0%, respectively. The concrete strength increase not only enhances the shear contribution of the concrete dowel itself but also the concrete wrapping force in the lateral constraint. Therefore, increasing the concrete strength can markedly improve the shear bearing capacities of perfobond connectors.
Figure 14a,b separately depict the effects on the shear strength of the perforating rebar in connectors under two concrete strengths, corresponding to the data in Table 4. For C60 concrete grade perfobond connectors, the diameters of the perforating rebars in groups P-1, P-2 and P-3 were 16, 20 and 0 mm (no rebar), respectively; compared with the results of P-3, the shear capacity of P-1 and P-2 increased by 65.9% and 75.8%, respectively. For C40 concrete grade perfobond connectors, the diameters of the perforating rebars in groups CP-1, CP-2 and CP-3 were 20, 16 and 0 mm (no rebar). When the diameter of the perforating rebar increased from 0 to 16 and 20 mm, the shear capacities of Specimens CP-1 and CP-2 were 85.7% and 132.7% higher than that of CP-3. It can be concluded that increasing the diameter of the perforating steel bar not only enhances the shear pin force but also strengthens the lateral constraints of the concrete dowel along the axial direction, thereby improving the shear capacity.
Figure 15 shows the impact of stirrup forms in the concrete slabs of perfobond connectors. The data in Table 4 indicate that the stirrup forms of Specimens SP-1, P-1 and NP-1 are segmental, conventional, and “no stirrups,” respectively. Compared with the shear capacities of NP-1, the results of SP-1 and P-1 increased by 60% and 34.1%, respectively. Clearly, the presence and increase of transverse reinforcement number enhances the lateral constraints on the concrete dowel, thereby significantly increasing the specimen’s shear capacity.
Figure 16 compares the load–slip curves of connectors with different hole shapes and areas. The hole areas of Specimens P-5, LP-1 and HP-1 were all 2900 mm2, 8.4–13.4% higher than that of Specimen P-1, which had a 1963.5 mm2 hole area. It can be concluded that the shear contribution of the concrete dowel mainly depends on the area of the concrete dowel. Therefore, the larger the opening area, the stronger the bearing capacity of the perfobond connector.

3.5.2. Load-Holding Capacity

According to the test results and load–slip curve analyses of the perfobond connectors, the crucial factors affecting the connectors’ ability to maintain loads after the peak load are the lateral constraints and areas of the concrete dowel and those lateral constraints primarily provided by the perforating rebar, transverse reinforcement, and concrete wrapping.
Figure 14 shows that the increase in the perforating rebar’s diameter not only enhances the shear capacity but also significantly improves the load-holding capacities of the connectors. Specimens P-1 and CP-2 feature connectors with 16 mm-diameter perforating rebars, and Specimens P-2 and CP-1 feature connectors with 20 mm diameter perforating rebars; their capacity decreases slowly after reaching the peak load, and the load–slip curves all remain fairly stable until the end of loading; thus, the load-holding capacity of the connectors is reasonably good. On the other hand, when the bearing capacities of the P-3 and CP-3 connectors (without perforating rebar) reach their peak value, the bearing capacity declines prominently as loading progresses, soon falling to 80% of the peak value. Hence, the load-holding capacity of these connectors is poor.
By comparing Figure 14a,b, the concrete strength can be seen to have little influence on the load-holding capacity of the perfobond connectors. This illustrates that the load-holding capacity of connectors with different concrete strengths is approximately uniform.
As can be seen from Figure 15, when other parameters remain unchanged, the reinforcement of the concrete slab has a distinct effect on the load-holding capacities of perfobond connectors. Beyond the ultimate load, the bearing capacity of the NP-1 specimen (without reinforcement in the concrete slab) decreases rapidly, soon falling to 80% of the peak load. Thus, it has a poor load-holding capacity. Meanwhile, Specimens P-1 and SP-1 (with ordinary and segmental reinforcement, respectively) achieve better load-holding capacities beyond the peak value, and they do not exhibit the fall to 80% of the peak load thereafter. It can be concluded that the lateral constraints provided by the transverse reinforcement markedly enhance the load-holding capacities of the perfobond connectors. On the one hand, the shear contribution of the lateral constraints increases; on the other hand, the concrete dowel and perforating rebar give full play to the vertical shear function.
As shown in Figure 16, the hole shapes of Specimens P-5, LP-1 and HP-1 are circular, long, and high hole, respectively. Owing to the approximate areas and identical lateral constraints, the load-holding capacities of these three types of connectors are similar and promising. However, they all measure lower than that of Specimen P-1, which has a smaller hole area. Therefore, under identical lateral constraints, the load-holding capacity of the perfobond connectors decreases slightly under an increase in opening area.

3.5.3. Shear Stiffness

Based on Table 4 and Figure 14, Figure 15, Figure 16, the crucial factors affecting the shear stiffness of the perfobond connector are found to be the concrete’s strength and bearing area during the initial loading stage. The shear stiffness of the C60 series specimens is 29.7% higher than that of the C40 series ones. The shear stiffnesses of Specimens P-5 and HP-1 (featuring larger holes) in the vertical loading direction are 8.7% and 11.8% higher than that of P-1, respectively. This is because, at loading onset, the external load is first transmitted to the upper concrete dowel through the perfobond rib, which is associated with the gradual compression of the concrete between the perfobond rib and perforating rebar. Then, the load is gradually transmitted to the rebar. Thus, the initial shear stiffness is determined by the concrete strength and the bearing area of the concrete dowel.

3.5.4. Ductility

The ultimate slip and ductility coefficients of perfobond connectors are very high, achieving excellent ductility. The data in Table 4 indicate that the ductility of C60 series specimens exceeds that of the C40 series, and the effects of other factors need further study. As a result, when perfobond connectors are applied in practical engineering, the ductility of the structure can be improved by increasing the concrete strength within a certain range.

4. Equation for Calculating Shear Capacity

4.1. Existing Shear Capacity Equations for the Superposed Perfobond Connectors

The specimens in this study resembled those of Hosaka et al. [6], Xue et al. [22], Zhao and Liu [23], and Zheng et al. [24]. Therefore, Equations (2)–(5) proposed by Hosaka et al., Xue et al., Zhao and Liu, and Zheng et al. were selected to evaluate the shear capacities of superimposed perfobond connectors, respectively. Here, Qhole is the shear capacity of each hole of the perfobond connectors (N); A is the area of the hole (mm2); As is the area of the perforating rebar (mm2); fy and fu are the yield and ultimate strengths of the perforating rebar (MPa); and αA = 3.80 (As/A)2/3. To model different hole shapes, the equations were modified by using A = πd2/4 and As = πds2/4, respectively.
Q h o l e = 1.85 [ ( A A s ) f c u + A s f u ] 26 , 100
Q h o l e = 11.744 ( A A s ) f t + 1.156 A s f y
Q h o l e = 1.76 ( A A s ) f c + 1.58 A s f y
Q h o l e = 1.76 α A ( A A s ) f c + 1.58 A s f y  
Table 5 summarizes the existing experimental results [19,20,22,23,24,35] and research findings of this study. All specimens presented in Table 5 neglected the concrete end-bearing effect and the chemical bond between the steel and concrete. The thickness of the perfobond rib exceeded 9 mm, to ensure that the perfobond connectors produced double-sided shear failures. For holes in the steel plate, the number of holes included single, double, and triple-hole categories, with hole sizes ranging from 35 to 75 mm; the hole shapes included circular, long, and high. The diameter of the perforating rebar ranged from 0 to 25 mm, and the yield strength varied as 335–480 MPa. In terms of the concrete, the compressive strength varied as 32.9–72.2 MPa, the side wrap of the slab Cb varied as 30–350 mm, and the top wrap Cu varied as 50–120 mm. For the transverse reinforcement, the diameters varied as 0–10 mm, and the yield strength ranged from 345 to 508.245 MPa. The parameters varied widely and were representative.
Equations (2)–(5) were applied to compute the shear bearing capacity of the specimens listed in Table 5, with the results compared with the experimental values. As shown in Table 5, Equation (2) significantly overestimated the bearing capacity of the perfobond connectors because the ultimate tensile strength of the perforating rebar was adopted in the analytical model. Equation (3) was too conservative to predict the shear capacity of the perfobond connectors. Equations (4) and (5) slightly overestimated the shear bearing capacity of the connector. In contrast to the test results, the coefficients of standard deviation calculated using Equations (2)–(5) were 0.36, 0.17, 0.23 and 0.24, respectively, indicating a comparatively large discreteness. Therefore, it is necessary to establish a more accurate shear-capacity calculation formula with a clear mechanism.

4.2. Proposed Shear Capacity Equation

Based on the double-sided shear failure mechanisms of perfobond connectors (as shown in Figure 12), the shear calculation model of the perfobond connectors is illustrated in Figure 17. The shear bearing capacity Qu comprises two components: the first is the shear capacity Pc provided by the vertical shear stress of the concrete dowel and perforating rebar, the second is the shear capacity PTr along the shear failure plane, which is provided by the lateral constraints and resembles the frictional force of the lateral constraints along the shear plane. The lateral constraints consist of three components: the perforating rebar, the transverse reinforcement, and the concrete wrapping. The expression for the shear capacity of connectors is
Q u = P c + P Tr
where Qu is the total shear capacity of the connector (N), Pc is the shear capacity of the concrete dowel and perforating rebar (N), and PTr is the shear capacity of the lateral constraints (N).

4.2.1. Concrete Dowel and Perforating Rebar

The shear contributions of the concrete dowel and perforating rebar are shown in Figure 17b. Both suffer from shear action on both sides. Thus, the shear action can be expressed as
P c = 2 τ c A 0
A 0 = A s ( E s E c 1 ) + A
where A is the area of the hole (mm2); As is the area of the perforating rebar (mm2); Es and Ec are the elastic moduli of the perforating rebar and concrete (MPa), respectively; and τc is the shear strength of concrete under multi-directional stress.
The shear strength of concrete in the pure shear state is τp = 0.39fcu0.57, as presented in [36]. However, because the concrete in the hole undergoes tri-axial compression through the perforating rebar, the perfobond rib, and the surrounding concrete [20,22], the concrete strength increased to a certain extent. Hence, the concrete strength improvement coefficient kp was introduced. Thus,
P c = 2 k p τ p A 0 = k 0 f c u 0.57 A 0
The multi-hole perfobond connectors are equivalent to 2n shear surfaces. Hence, the shear capacity of the concrete dowel and perforating rebar Pc is expressed as
P c = k 0 n A 0 f c u 0.57

4.2.2. Lateral Constraint Composition

(1)
Concrete wrapping
Concrete wrapping can provide lateral constraints to connectors. This includes concrete wraps on the sides and tops of the perfobond rib for the superposed perfobond connectors.
Fujii et al. [33] obtained the concrete strain distribution and deformation law by setting strain and displacement measuring points on the surface of the side concrete wrap. That is, the strain distribution of the concrete section passing through the perfobond rib resembled a linear distribution, and its stress and deformation were similar to the cross-section of an eccentric tensile member (see Figure 18a). The binding failure realized by concrete wrapping was due to the crack generated along the edge of the perfobond rib through its concrete section, and it extended to the outer edge of the specimen (see Figure 18b,c). Therefore, the weak point of the section was located near the edge of the perfobond rib, and the lateral constraints provided by the concrete wrapping on the perfobond connector depended on the corresponding load when the concrete was cracked. Based on the above analysis of the concrete wrapping action mechanism, a method for calculating the constraint force realized by the concrete wrapping around the perfobond rib can be obtained. For the superposed perfobond connector, the plate on one side was taken for calculation and analysis, and the lateral constraints provided by the concrete wrapping Tc could be calculated according to
T c = T c b + T c u
T c b = f t e b y b I c b + 1 A c b
T c u = f t e u y u I c u + 1 A c u
where Tcb and Tcu are the lateral constraints provided by the concrete wraps on the side and top of the perfobond rib, respectively (N); eb and eu are the distances from the neutral axis of the side and top concrete wraps to the ends of the perfobond rib (where eb = Cb/2 and eu = Cu/2), respectively; yb and yu are the distances from the neutral axis of the side and top concrete wraps to the hole center (where yb = Cb/2 + h/2 and yu = Cu/2 + B/2), respectively; Icb and Icu are the (independent) moments of inertia of the concrete wrapping on the side and top (for the plain concrete slab, Icb = BCb3/12 and Icu = BCu3/12), respectively; and Acb and Acu are the areas of concrete wrapping on the side and top (for the plain concrete slab, Acb = BCb and Acu = hCu), respectively.
The axial tensile strength of concrete in [36] is ft = 0.395fcu0.55. Meanwhile, by substituting Equations (12) and (13) into Equation (11), the concrete wrapping force Tc can be calculated as
T c = 0.395 ( 1 e b y b I c b + 1 A c b + 1 e u y u I c u + 1 A c u ) f c u 0.55
(2)
Perforating rebar
By analyzing the strain data on the perforating rebar, the axial force of the through-steel bar was found to increase under load increases. When the connectors reached peak load, the perforating rebar essentially did not yield and remained in the elastic state. Figure 10 shows that the constraining force of the perforating rebar exerts an upper limit on the shear-capacity enhancement. Hence, the lateral constraints for perforating rebar Ts were calculated as follows
T s = A s f y
(3)
Transverse reinforcement
The concrete wrapping force was computed for plain concrete without structural reinforcement. When the concrete dowel expanded outwards, the reinforcement in the slab restrained the lateral expansion and deformation of the internal concrete, which enhanced its strength and deformation capacity. An upper limit was found for increasing the bearing capacity of the perforating rebar. A similar principle can be applied to transverse reinforcement. Thus, the lateral constraints of transverse reinforcement Tst can be obtained as
T s t = n s t A s t f y t
where nst is the number of transverse reinforcement bars in each spacing, nst = 1 for the ordinary stirrups, nst = 3 for the segmented stirrups, fyt is the yield strength of transverse reinforcement (MPa), and Ast is the cross-section area of transverse reinforcement.
To summarize, the shear contribution PTr of the lateral constraints was similar to the friction force on the shear plane, and the friction coefficient was defined as kT. Therefore, the shear bearing capacity realized by lateral constraints is calculated by the following equation
P T r = k T T r = k T ( T c + T s + T s t )

4.3. Determining the Shear Capacity Equation

Based on the analysis in Section 4.2, the shear capacity calculation equation of the perfobond connector can be expressed as
Q u = k 0 n A 0 f c u 0.57 + k T ( T c + T s + T s t )
where n is the number of holes in the perfobond rib (i.e., n = 1 for single-hole perfobond connectors).
According to the test results in this study, the coefficients k0 = 4.9 and kT = 0.96 were obtained via the least-squares method. The final calculation equation for the shear capacity of the superposed perfobond connectors is given as follows
Q u = 4.9 n A 0 f c u 0.57 + 0.96 ( T c + T s + T s t )
To further verify the accuracy of the shear capacity equation proposed in this paper, the shear capacity of all specimens listed in Table 5 was calculated using Equation (19) and compared with the calculations of Equations (2)–(5). The overall standard deviation coefficient between the calculation results of Equation (19) and the corresponding experimental results was 0.14, and the mean value was 0.99. As shown in Figure 19, the proposed equation outperformed the existing calculation methods, especially for the shear capacity of multi-hole perfobond connectors. Meanwhile, for Specimens III [22] and PS-22 [23], the deviation remained relatively large. One reason for this is the inconsistent specimen design method. Another is the discreteness of the perfobond connectors lacking a perforating rebar. Therefore, more push-out tests designed with uniform methods are required. To conclude, the shear capacity calculation equation proposed in this paper for multi-hole perfobond connectors under lateral constraints exhibits a smaller error and is more universal than those previously obtained.

5. Conclusions

In this study, the push-out test results for superposed perfobond connectors were obtained. The effects of lateral constraints on the mechanical properties and load–slip curves of the connectors were studied by varying the diameter of the perforating rebar, the stirrup form, and the concrete strength. In addition, the shapes, areas, and numbers of holes, as well as other parameters, were also investigated. Finally, based on the test results, a model for calculating the shear capacity of multi-hole superposed perfobond connectors was proposed. The main conclusions are as follows:
(1) The crucial factors determining the lateral constraints on the concrete dowel are the concrete wrapping force, axial force of the perforating rebar, and transverse reinforcement constraints. When the specimen with a large lateral constraint was destroyed, the number of cracks on the concrete slab was larger, but the width was smaller than other specimens.
(2) The failure mode of perfobond connectors with perfobond rib thicknesses exceeding 9 mm was double-sided shear failure. After the concrete slab was chiseled, the perfobond rib remained intact and exhibited little deformation, the concrete dowel exhibited a comparatively intact shear fracture surface and bending, and shear deformation occurred through the perforating rebar. Furthermore, the stronger the lateral constraints, the more the concrete dowels were prone to forced shear failure.
(3) The shear capacity of the perfobond connector was determined by the hole area, the concrete strength, the perforating rebar diameter, and the number of holes. The shear stiffness depended on the bearing area of the concrete at the initial loading stage. Hence, it was primarily affected by the hole area and concrete strength.
(4) The variation trend of the load–slip curve after the peak value mainly depended on the lateral constraints, areas, and numbers of holes. The stronger the lateral constraints, the smaller the hole areas, and the fewer the numbers of holes, the slower the bearing capacity of the connector decreased after reaching the peak value, and the load-holding capacities of the specimens were better. The load–slip curve of the single-hole connector even showed characteristics consistent with those of inserted perfobond connectors with strong constraints.
(5) An analytical model based on the double shear failure mechanism is proposed to calculate the shear capacity of the superposed perfobond connectors considering the lateral constraints. The equation considers many factors and can more clearly describe the shear mechanism of connectors. Therefore, the equation is valid to predict the shear capacities of multi-hole connectors.
(6) In the actual engineering design, when the construction conditions are limited, such as the height of the concrete slab or the hole spacing of the perfobond rib is limited, the lateral constraints of the concrete dowel can be improved by changing the hole shape or increasing the transverse reinforcement in the slab, so as to improve the bearing capacity of the connector.

Author Contributions

Conceptualization, J.G. and Q.S.; methodology, T.L.; software, J.G.; validation, G.M. and J.G.; formal analysis, T.L.; investigation, J.G.; resources, Q.S.; data curation, J.G. and T.L.; writing—original draft preparation, J.G.; writing—review and editing, Q.S.; visualization, G.M. and T.L.; supervision, Q.S.; project administration, Q.S.; funding acquisition, Q.S. All authors have read and agreed to the published version of the manuscript.

Funding

This research was funded by the National Natural Science Foundation of China, grant number 51878540.

Institutional Review Board Statement

Not applicable.

Informed Consent Statement

Not applicable.

Data Availability Statement

Not applicable.

Acknowledgments

The authors are grateful for the financial support from the National Natural Science Foundation of China (Grant No. 51878540).

Conflicts of Interest

The authors declare no conflict of interest.

References

  1. Lee, P.G.; Shim, C.S.; Chang, S.P. Static and fatigue behavior of large stud shear connectors for steel-concrete composite bridges. J. Constr. Steel Res. 2005, 61, 1270–1285. [Google Scholar] [CrossRef]
  2. Nguyen, H.T.; Kim, S.E. Finite element modeling of push-out tests for large stud shear connectors. J. Constr. Steel Res. 2009, 65, 1909–1920. [Google Scholar] [CrossRef]
  3. Leonhardt, F.; Andra, W.; Andra, H.P.; Harre, W. New, improved bonding means for composite load-bearing structures with high fatigue strength. Int. J. Fatigue 1987, 82, 325–331. [Google Scholar]
  4. Kraus, D.; Wurzer, O. Nonlinear finite-element analysis of concrete dowels. Comput. Struct. 1997, 64, 1271–1279. [Google Scholar] [CrossRef]
  5. Valente, I.; Cruz, P.J. Experimental analysis of Perfobond shear connection between steel and lightweight concrete. J. Constr. Steel Res. 2004, 60, 465–479. [Google Scholar] [CrossRef] [Green Version]
  6. Hosaka, T.; Mitsuki, K.; Hiragi, H.; Ushijima, Y.; Watanabe, H. An experimental study on shear characteristics of perfobond strip and it’s rational strength equations. J. Struct. Eng. 2000, 46, 1593–1604. [Google Scholar]
  7. Xiao, L.; Qiang, S.Z.; Li, X.Z.; Wei, X. Research on mechanical performance of PBL shear connectors considering the perforated plate’s thickness. Eng. Mech. 2012, 29, 282–288. (In Chinese) [Google Scholar] [CrossRef]
  8. Zhang, Q.H.; Li, Q.; Tang, L. Fracture mechanism and ultimate carrying capacity of shear connectors applied for steel-concrete joint segment of bridge pylon. China J. Highw. Transp. 2007, 1, 85–90. (In Chinese) [Google Scholar]
  9. He, S.; Fang, Z.; Fang, Y.; Liu, M.; Liu, L.; Mosallam, A.S. Experimental study on perfobond strip connector in steel–concrete joints of hybrid bridges. J. Constr. Steel Res. 2016, 118, 169–179. [Google Scholar] [CrossRef]
  10. He, S.; Fang, Z.; Mosallam, A.S. Push-out tests for perfobond strip connectors with UHPC grout in the joints of steel-concrete hybrid bridge girders. Eng. Struct. 2017, 135, 177–190. [Google Scholar] [CrossRef]
  11. Di, J.; Zou, Y.; Zhou, X.; Qin, F.; Peng, X. Push-out test of large perfobond connectors in steel–concrete joints of hybrid bridges. J. Constr. Steel Res. 2018, 150, 415–429. [Google Scholar] [CrossRef]
  12. Zou, Y.; Di, J.; Zhou, J.; Zhang, Z.; Li, X.; Zhang, H.; Qin, F. Shear behavior of perfobond connectors in the steel-concrete joints of hybrid bridges. J. Constr. Steel Res. 2020, 172, 106217. [Google Scholar] [CrossRef]
  13. Veldanda, M.R.; Hosain, M.U. Behaviour of perfobond rib shear connectors: Push-out tests. Can. J. Civ. Eng. 1992, 19, 1–10. [Google Scholar] [CrossRef]
  14. Hosain, E. A parametric study of perfobond rib shear connectors. Can. J. Civ. Eng. 1994, 21, 614–625. [Google Scholar] [CrossRef]
  15. Oguejiofor, E.C.; Hosain, M.U. Numerical analysis of push-out specimens with perfobond rib connectors. Comput. Struct. 1997, 62, 617–624. [Google Scholar] [CrossRef]
  16. Veríssimo, G.S.; Paes, J.R.; Valente, I.; Cruz, P.J.; Fakury, R.H. Design and experimental analysis of a new shear connector for steel and concrete composite structures. In Proceedings of the Third International Conference on Bridge Maintenance, Safety and Management, Porto, Portugal, 16–19 July 2006. [Google Scholar]
  17. Al-Darzi, S.Y.K.; Chen, A.R.; Liu, Y.Q. Finite element simulation and parametric studies of perfobond rib connector. Am. J. Appl. Sci. 2007, 4, 122–127. [Google Scholar] [CrossRef] [Green Version]
  18. Ahn, J.H.; Lee, C.G.; Won, J.H.; Kim, S.H. Shear resistance of the perfobond-rib shear connector depending on concrete strength and rib arrangement. J. Constr. Steel Res. 2010, 66, 1295–1307. [Google Scholar] [CrossRef]
  19. Yang, Y.; Chen, Y.; Cai, J.W. Experiment on Static Behavior of Perfobond Shear Connectors. China J. Highw. Transp. 2017, 30, 255–263. (In Chinese) [Google Scholar]
  20. Yang, Y.; Chen, Y. Experimental study on the shear capacity of PBL shear connectors. Eng. Mech. 2018, 35, 89–96. (In Chinese) [Google Scholar] [CrossRef]
  21. Medberry, S.B.; Shahrooz, B.M. Perfobond Shear Connector for Composite Construction. Eng. J. 2002, 39, 2–12. [Google Scholar]
  22. Xue, W.C.; Dai, Y.; Zhou, L.; Lu, Y.C. Experimental studies on shear behavior of perfobond connectors. J. Build. Struct. 2009, 30, 103–111. (In Chinese) [Google Scholar] [CrossRef] [Green Version]
  23. Zhao, C.; Liu, Y.Q. Experimental study of shear capacity of perfobond connector. Eng. Mech. 2012, 29, 349–354. (In Chinese) [Google Scholar] [CrossRef]
  24. Zheng, S.J.; Liu, Y.Q.; Yoda, T.; Lin, W.W. Parametric study on shear capacity of circular-hole and long-hole perfobond shear connector. J. Constr. Steel Res. 2016, 117, 64–80. [Google Scholar] [CrossRef]
  25. Su, Q.T.; Wang, W.; Luan, H.W.; Yang, G.T. Experimental research on bearing mechanism of perfobond rib shear connectors. J. Constr. Steel Res. 2014, 95, 22–31. [Google Scholar] [CrossRef]
  26. Su, Q.T.; Yang, G.T.; Bradford, M.A. Bearing capacity of perfobond rib shear connectors in composite girder bridges. J. Bridge Eng. 2016, 21, 06015009. [Google Scholar] [CrossRef]
  27. Fujii, K.; Dokan, Y.; Iwasaki, H.; Himukai, M.; Yamaguchi, S. Ultimate shear strength of perfobond strip. J. Jpn. Soc. Civ. Eng. Ser A1 2014, 70, 53–68. (In Japanese) [Google Scholar] [CrossRef] [Green Version]
  28. Eurocode 4: Design of Composite Steel and Concrete Structures; European Committee for Standardization: Brussels, Belgium, 2004.
  29. GB 50010-2010; Code for Design of Concrete Structures. China Architecture and Building Press: Beijing, China, 2010.
  30. Nisiumi, K.; Okimoto, M. Shear strength of perfobond rib shear connector under the confinement. Proc. JSCE 1999, 633, 193–203. (In Japanese) [Google Scholar] [CrossRef] [Green Version]
  31. Wei, X.; Xiao, L. Mechanical Behaviour and Failure Mechanism of Perfobond Shear Connectors in Steel-Concrete Hybrid Structure. IABSE Symp. Rep. 2013, 99, 463–468. [Google Scholar]
  32. Furukawa, Y.; Fujii, K.; Doukan, Y.; Yamaguchi, S. On pushes tests slip strength of PBL under dimensional parameters. In Proceedings of the 9th Symposium on Research and Application of Hybrid and Composite Structures, Tokyo Metropolis, Japan Society of Civil Engineers, Tokyo, Japan, November 2011; pp. 58–65. (In Japanese). [Google Scholar]
  33. Xiao, L.; Wei, X.; Qiang, S.Z. Comparative study on two kinds of push-out tests of PBL shear connectors. China Civ. Eng. J. 2013, 46, 70–80. (In Chinese) [Google Scholar]
  34. Zheng, S.J.; Liu, Y.Q. Experiment of initial shear stiffness of perfobond connector. China J. Highw. Transp. 2014, 27, 69–75. (In Chinese) [Google Scholar]
  35. Fujii, K.; Iwasaki, H.; Fukada, K.; Toyota, T.; Fujimura, N. Crack restraint factors in ultimate slip behavior of perfobond strip. Doboku Gakkai Ronbunshuu A 2008, 64, 502–512, In Japanese. [Google Scholar] [CrossRef]
  36. Guo, Z.H. Reinforced Concrete Theory; Tsinghua University Press: Beijing, China, 2013. (In Chinese) [Google Scholar]
Figure 1. Typical perfobond connector specimens: (a) Superposed perfobond connector; (b) Inserted perfobond connector.
Applsci 12 03162 g001
Figure 2. Typical load–slip curves of two connector types.
Applsci 12 03162 g002
Figure 3. Structural diagrams of push-out specimens (units: mm): (a) Front view; (b) Section 1-1; (c) Section 2-2 (conventional stirrups); (d) Section 2-2 (segmented stirrups).
Applsci 12 03162 g003
Figure 4. Diagrams of the perfobond ribs: (a) Perfobond rib with single hole; (b) Perfobond rib with two holes; (c) Perfobond rib with long-holes; (d) Perfobond rib with high-holes.
Applsci 12 03162 g004
Figure 5. Loading equipment.
Applsci 12 03162 g005
Figure 6. Instrumentation arrangement of push-out specimens (units: mm): (a) Layout of dial indicator; (b) Strain-gauge arrangement of perfobond rib; (c) Strain-gauge arrangement of perforating rebar.
Applsci 12 03162 g006
Figure 7. Cracking patterns of the concrete blocks: (a) P-1; (b) P-2; (c) P-3; (d) P-4; (e) P-5; (f) LP-1; (g) HP-1; (h) NP-1; (i) SP-1; (j) CP-1; (k) CP-2; (l) CP-3.
Applsci 12 03162 g007
Figure 8. Inner failure modes of the perfobond connectors: (a) Inner failure mode of specimens with circular hole; (b) Inner failure mode of specimens with long hole; (c) Inner failure mode of specimens with high hole; (d) Inner failure mode of specimens without stirrups; (e) Inner failure mode of specimens with single hole; (f) Inner failure mode of specimens without perforating rebar.
Applsci 12 03162 g008
Figure 9. Load–strain curve of perfobond rib: (a) P-1; (b) P-4.
Applsci 12 03162 g009
Figure 10. Load–strain curve of perforating rebar: (a) P-1; (b) P-4.
Applsci 12 03162 g010
Figure 11. Force-transfer mechanism of the connector.
Applsci 12 03162 g011
Figure 12. Shear-failure mechanism of the perfobond connector: (a) Shear-failure mechanism of perfobond connector with perforating rebar; (b) Shear-failure mechanism of perfobond connector without perforating rebar.
Applsci 12 03162 g012
Figure 13. Load–slip curves: (a) P-1; (b) P-2; (c) P-3; (d) P-4; (e) P-5; (f) LP-1; (g) HP-1; (h) NP-1; (i) SP-1; (j) CP-1; (k) CP-2; (l) CP-3.
Applsci 12 03162 g013
Figure 14. Effect of perforating rebar concrete grade on load–slip curves: (a) C60 concrete; (b) C40 concrete.
Applsci 12 03162 g014
Figure 15. Effect of stirrup form on load–slip curves.
Applsci 12 03162 g015
Figure 16. Effect of hole shape and size on load–slip curves.
Applsci 12 03162 g016
Figure 17. Shear calculation model of perfobond connectors: (a) Total shear capacity; (b) Shear contribution of concrete dowel and perforating rebar; (c) Shear contribution of lateral constraints; (d) Composition of lateral constraints.
Applsci 12 03162 g017
Figure 18. Constraining force calculation of concrete wrap for superposed perfobond connectors: (a) Side concrete wrap [35]; (b) Cracking of side concrete wrap; (c) Cracking of upper concrete wrap.
Applsci 12 03162 g018
Figure 19. Evaluation of the proposed capacity equation [6,22,23,24].
Applsci 12 03162 g019
Table 1. Parameters of push-out specimens.
SpecimenHole ShapeNumber of Holes nd (mm)dl (mm)dh mmA (mm2)l (mm)ds (mm)Concrete GradeStirrups Form
P-1Circular hole25050501963.512016C60Conventional stirrups
P-225050501963.512020C60
P-325050501963.51200C60
P-415050501963.5016C60
P-526060602827.412016C60
CP-125050501963.512020C40
CP-225050501963.512016C40
CP-325050501963.51200C40
LP-1Long hole25070502963.512016C60
HP-1High hole25050702963.512016C60
NP-1Circular hole25050501963.512016C60None
SP-125050501963.512016C60Segmented stirrups
Table 2. Material properties of concrete.
MaterialsConcrete Cube Compressive Strength fcu (MPa)Young’s Modulus of Concrete Ec (MPa)
C4042.833,662.5
C6072.237,635.5
Table 3. Material properties of steel.
MaterialsDiameter of Rebars (mm)Thickness of Steel Plate (mm)Yield Strength of Steel fy (MPa)Ultimate Tensile of Steel fu (MPa)Young’s Modulus of Steel Es (105 MPa)
Q35516378.6513.42.05
HRB40010508.2670.52.06
16443.7640.82.06
20443.2628.32.06
Table 4. Static performance indicators of perfobond connectors.
SpecimenPu/kNPRk/kNPRd/kNK/(kN/mm)δd/mmδu/mmD
P-1542.9488.6390.91215.20.3020.0067.8
P-2575.5518.0414.41205.40.5710.1017.9
P-3327.3294.6235.71005.80.217.3835.5
P-4345.6311.0248.81020.50.2420.0084.4
P-5588.5529.6423.71320.20.5411.3821.2
LP-1591.5532.4425.91271.40.577.4013.1
HP-1615.5554.0443.21358.90.416.1715.1
NP-1404.8364.3291.51212.50.295.0117.1
SP-1631.2568.1454.51217.50.458.6419.3
CP-1513.5462.1369.7929.30.648.2112.9
CP-2410.0369.0295.2714.90.5420.037.2
CP-3220.7198.6158.9594.30.355.4315.7
Table 5. Comparison of equations to predict the shear capacity.
SpecimensnA0/mm2fcu/MPaB/mmh/mmCb/mmCu/mmAs/mm2fy/
MPa
nstAst/
mm
fyt/
MPa
Qu,Exp/
kN
Qu.Pre/Qu,Exp
Equation (2)Equation (3)Equation (4)Equation
(5)
Equation
(19)
Specimens in this studyP-122863.072.23501005050201.1443.7178.5508.2542.91.48 0.66 1.18 1.07 0.84
P-223368.972.23501005050314.2443.7178.5508.2575.51.79 0.81 1.35 1.42 0.97
P-321963.572.235010050500.00.0178.5508.2327.31.12 0.52 1.22 1.22 0.82
P-412863.072.23501005050201.1443.7178.5508.2345.61.16 0.52 0.93 0.84 0.85
P-523726.972.23501005050201.1443.7178.5508.2588.51.67 0.74 1.39 1.07 0.94
LP-123863.072.23501005050201.1443.7178.5508.2591.51.72 0.75 1.43 1.08 0.96
HP-123863.072.23501005050201.1443.7178.5508.2615.01.65 0.72 1.37 1.04 0.92
NP-122863.072.23501005050201.1443.700.00.0404.81.98 0.89 1.58 1.43 1.03
SP-122863.072.23501005050201.1443.7378.5508.2631.21.27 0.57 1.01 0.92 0.84
CP-123571.942.83501005050201.1443.7178.5508.2513.51.73 0.84 1.25 1.29 0.93
CP-222992.842.83501005050201.1443.7178.5508.2408.61.58 0.78 1.21 1.12 0.93
CP-321963.542.835010050500.00.0178.5508.2220.70.89 0.58 1.08 1.08 0.95
Xue [22]I23338.850.635010050100201.1361.7178.5383.3346.01.86 0.99 1.47 1.26 1.19
II23328.741.935010050100201.1361.7178.5383.3332.61.76 0.95 1.36 1.18 1.14
III23547.532.935010050100201.1361.7178.5383.3249.92.06 1.13 1.54 1.38 1.44
IV22520.354.135010050100201.1361.7178.5383.3351.51.56 0.85 1.19 1.16 0.99
V21866.953.335010050100201.1361.7178.5383.3310.41.47 0.77 1.07 1.18 0.91
VI22375.848.7350100501000.00.0178.5383.3290.30.94 0.68 1.07 1.07 0.86
VII24103.748.035010050100314.2488.9178.5383.3421.32.27 1.23 1.78 1.77 1.30
Zhao and Liu [23]PS-313511.043.325015025080314.2373.6178.5382.0316.41.09 0.60 0.90 0.94 1.02
PS-414375.043.325015025080314.2373.6178.5382.0332.11.20 0.66 1.02 0.96 1.08
PS-515965.443.325015025080314.2373.6178.5382.0357.81.40 0.75 1.22 0.97 1.19
PS-613326.870.325015025080314.2381.7178.5382.0394.11.04 0.53 0.90 0.94 0.95
PS-714190.770.325015025080314.2381.7178.5382.0424.01.18 0.58 1.03 0.96 0.99
PS-815781.270.325015025080314.2381.7178.5382.0514.41.29 0.61 1.16 0.88 0.99
PS-913817.943.325015025080201.1373.6178.5382.0289.51.08 0.60 0.96 0.77 1.02
PS-1015245.543.325015025080490.9373.6178.5382.0372.81.44 0.77 1.16 1.23 1.23
PS-1114190.770.325015025080314.2480.0178.5382.0453.31.10 0.62 1.07 1.01 1.00
PS-1214375.043.325010030080314.2373.6178.5382.0329.61.21 0.66 1.03 0.97 1.13
PS-1314375.043.325015025080314.2373.6178.5382.0338.91.18 0.64 1.00 0.94 1.06
PS-1414375.043.325015025080314.2373.6178.5382.0346.61.15 0.63 0.98 0.92 1.04
PS-1514865.943.325021019080314.2373.6178.5382.0393.71.09 0.59 0.94 0.84 0.94
PS-1614865.943.325021019080314.2373.6178.5382.0404.01.07 0.58 0.91 0.82 0.91
PS-1714375.043.325015015080314.2373.6178.5382.0326.71.22 0.67 1.04 0.98 1.05
PS-1815813.263.425015035080314.2335.0178.5382.0495.01.26 0.58 1.08 0.82 1.01
PS-1913411.254.625010010080314.2335.0178.5382.0364.91.02 0.50 0.80 0.85 0.84
PS-2013411.254.625010010080314.2335.0178.5382.0359.31.03 0.51 0.82 0.86 0.86
PS-2113411.254.625010010080314.2335.0178.5382.0358.71.04 0.51 0.82 0.86 0.86
PS-2211963.554.6250100100800.00.0178.5382.0203.00.65 0.36 0.74 0.74 0.72
Zheng [24]CP-113326.670.325015025080314.2382.0178.5382.0388.81.22 0.54 0.93 0.99 0.96
CP-214190.570.325015025080314.2382.0178.5382.0426.21.33 0.58 1.06 0.99 0.99
CP-315780.970.325015025080314.2382.0178.5382.0514.21.45 0.62 1.21 0.91 0.99
LP-114576.670.325015025080314.2382.0178.5382.0473.51.29 0.56 1.04 0.92 0.94
LP-215826.670.325015025080314.2382.0178.5382.0511.11.47 0.63 1.22 0.92 1.00
LP-317076.670.325015025080314.2382.0178.5382.0531.91.67 0.71 1.42 0.94 1.09
HP-115826.670.325015025080314.2382.0178.5382.0505.71.48 0.63 1.23 0.93 1.01
Yang [19,20]P-1-45-14#13746.949.4375804550153.9357.0178.5357.0235.01.27 0.67 1.16 0.80 1.09
P-3-50-45-20#33466.849.0375804550314.2417.0178.5357.0493.22.01 1.19 1.80 1.95 1.27
P-2-50-45-20#23466.849.0375804550314.1417.0178.5357.0448.11.48 0.88 1.32 1.43 1.05
Fujii [35]PS-30-R114037.342.328015030120201.1345.000.00.0233.41.37 0.71 1.14 0.91 1.03
PS-50-R114037.342.328015050120201.1345.000.00.0249.81.28 0.66 1.06 0.85 0.97
PS-75-R114037.342.328015075120201.1345.000.00.0238.31.34 0.69 1.12 0.89 1.03
PS-100-N12827.442.32801501001200.00.000.00.0184.20.82 0.49 0.91 0.91 0.77
PS-100-N-FR12827.442.32801501001200.00.000.00.0287.20.53 0.32 0.59 0.59 0.72
PS-100-R1L-M14037.342.3280150100120201.1345.000.00.0284.31.13 0.58 0.94 0.74 0.87
PS-100-R1M-M14037.342.3280150100120201.1345.000.00.0251.51.27 0.66 1.06 0.84 0.99
PS-100-R1M-U14037.342.3280150100120201.1345.000.00.0247.61.29 0.67 1.07 0.85 1.00
PS-100-R1M-L14037.342.3280150100120201.1345.000.00.0316.21.01 0.52 0.84 0.67 0.79
PS-150-R114037.342.3280150150120201.1345.000.00.0264.21.21 0.62 1.01 0.80 0.97
Average 1.33 0.68 1.12 1.01 0.99
Standard deviation coefficient 0.36 0.17 0.23 0.24 0.14
Publisher’s Note: MDPI stays neutral with regard to jurisdictional claims in published maps and institutional affiliations.

