1. Introduction
The relevance of the research is determined by the increasing need to model and describe the averaged characteristics of waves in heterogeneous media. One of the methods of averaging the properties of a heterogeneous medium is the description of long waves using phononic crystals (PCs). These methods are based on the fact that most heterogeneous media have a periodic or almost periodic structure with a characteristic spatial period. This approach was used by Newton when modeling acoustic waves in the air using a weight-spring chain. It should be noted that all composite materials with a woven reinforcing base have a spatially periodic structure. It is usually assumed that the unit cell of a phononic crystal modeling a two-component inhomogeneous heterogeneous medium contains one component of each of the media; such crystals are, for convenience, considered monodisperse. In this paper, studies of the influence of polydispersity (at the same concentration) on the main characteristics of the propagation of long acoustic waves in phononic crystals are carried out.
A phononic crystal will be called polydisperse if the number of matrix elements and reinforcing material elements in the unit cell is greater than one and there are at least two matrix elements or two reinforcing material elements of different sizes. An element of the matrix material or reinforcing material is the connected part of the corresponding material. Sometimes, the intuitive terminology of “drop” is used for the reinforcing material and “bubble” for the mixture matrix. Using this terminology, polydispersity means that there are either two drops or two bubbles of different sizes in the unit cell.
Phononic crystals take into account the properties of waves, such as scattering, interference and resonant phenomena in one-dimensional periodic chains of inhomogeneities, to form “band-gaps”, that is, ranges of wavelengths or frequencies within which waves cannot propagate through the structure [
1].
Due to its spatial periodicity, the propagation of acoustic waves in phononic crystals has special properties that can later be used in various devices and techniques.
There are several classes of phononic crystals that differ mainly in the physical nature of the inclusions and the matrix. Among them, attention has been paid to solid/solid, liquid/liquid and mixed solid/liquid composite systems. Such media have transmission frequency bands and forbidden frequency bands of transmission spectra for which the propagation of sound or vibration can be strictly prohibited in all directions.
Using the band gap principle, phononic crystals make it possible to regulate the propagation of elastic or acoustic waves [
2]. In other words, they play the role of ideal scatters for elastic or acoustic waves in the band gap frequency range. Thus, phononic band gap can be used to filter, limit or direct acoustic energy and, therefore, can be used in various applications.
Acoustic waves themselves are the object of research in seismology and seismic exploration. There are features and differences of wave propagation in a solid medium and in a porous one (when the medium is inhomogeneous and heterogeneous). The propagation of acoustic waves in porous media is described in [
3]. In [
4,
5,
6,
7,
8,
9], studies of the soundproofing and wind-proofing properties of phononic crystals were carried out. These studies have shown that devices such as filters, resonators, waveguides, switches and other phononic metamaterials can be created on the basis of phononic crystals. Acoustic wave propagation and resonance phenomena in monodisperse phononic crystals are described in [
10].
Modeling of a one-dimensional periodic medium with the help of mechanical analogs of a weight-spring is described in the fundamental work [
11]. This approach can be used for acoustically contrasting heterogeneous one-dimensional periodic media. In fact, the mechanical analogy [
11] is an approximate model of a phononic crystal with contrasting media. The paper [
12] describes integral methods for studying the propagation of acoustic waves in averaged heterogeneous media. The immanent difficulties in dynamic homogenization of the dispersion waves in heterogeneous media are analyzed in [
13,
14].
Direct studies of wave propagation in such media are therefore impossible, so methods of averaging the main characteristics of a heterogeneous medium are almost always used. Modeling heterogeneous media using phononic crystals is one of these methods. This determines the practical importance of the study, since homogeneous media essentially do not exist in nature.
In this paper, studies of the features and specifics of acoustic wave propagation in polydisperse phononic crystals have been carried out, as well as qualitative assessments of the effect of polydispersity of phononic crystals on the propagation velocity of acoustic waves and on the position of the forbidden and transmission frequency bands.
This work is a further development of the methods and approaches described in [
10] and [
15,
16,
17,
18,
19]. The effect of polydispersity on the propagation velocity and on the frequency bands of transmission and locking of waves is described here.
Methods and results of the theory of propagation and resonance of acoustic waves in phononic crystals are widely used in the development and creation of phased receiving and transmitting antenna arrays [
20,
21].
2. Formulation of the Problem
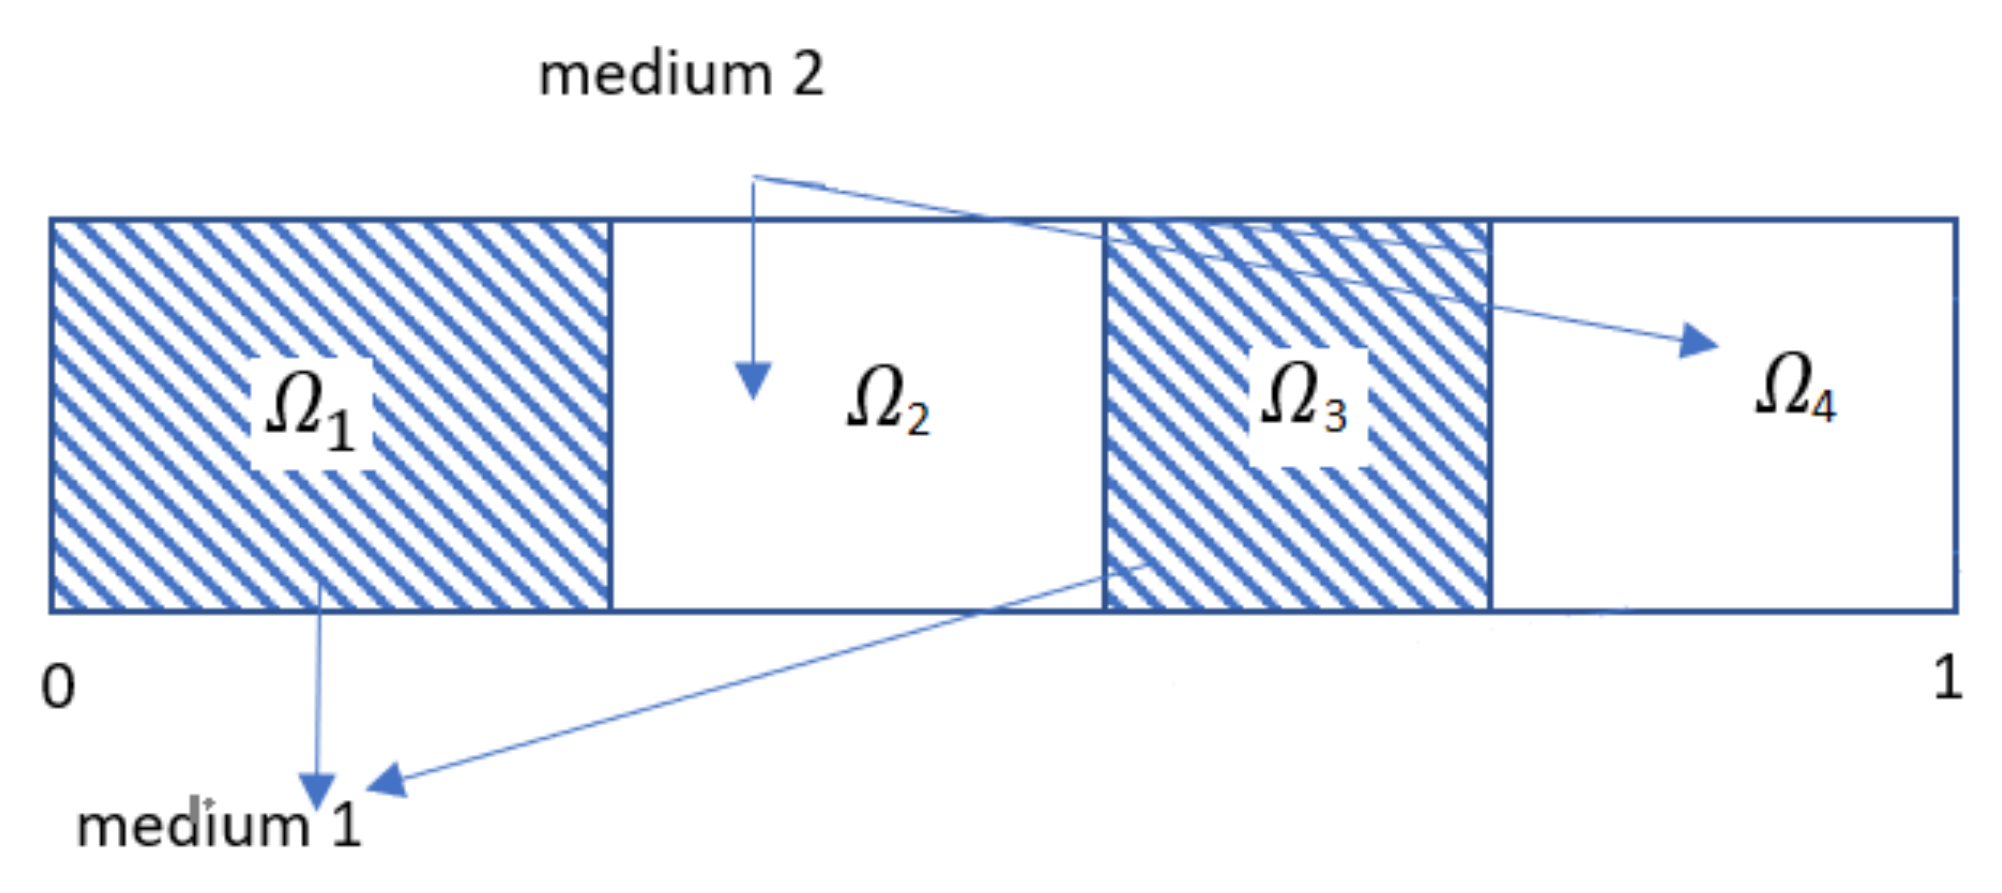
For the purposes of this paper, it is believed that phononic crystals are one-dimensional, heterogeneous, two-component media periodic in space, and the components can be both elastic and liquid or gaseous media.
An inhomogeneous one-dimensional periodic medium consists of two components, medium 1 and medium 2, and the characteristics of these media have an index of 1 or 2, respectively (
Figure 1).
L is the smallest spatial period, X is a dimensional variable, x = X/L is a dimensionless spatial variable, here the period is 1.
The unit cell is a set of such
x that
x* < x < x* + 1 where
x* is any number. Media 1 consists of a chain of drops, and media 2 consists of a chain of bubbles. The unit cell is 0 <
x < 1. The coordinates of the borders of drops and bubbles should be as follows:
—the size of the drop or bubble under the index «i».
Modeling of inhomogeneous media using chains of inclusions of one medium into another is one of the possible approaches for studying wave propagation.
The wave propagation equations are described by an elementary wave packet, in which there is a circular frequency, a wave number and a wave amplitude:
A(x + 1) = A(x) is amplitude factor.
Fluctuations in one spatial period are described by the equations:
where κ =
is the ratio of sound velocities,
is the circular oscillation frequency,
is the spatial frequency, indices 1, 3 and 2, 4—correspond to media 1 and 2, with boundary conditions:
where
is the ratio of the density of air (gas) to the density of water (liquid). ξ is the phase shift of the oscillations in the adjacent cells of the chain.
Sound waves are described by an acoustic pressure disturbance, respectively, in these media. Helmholtz equations are used to solve the equations of elastic and acoustic waves. The general form of the solution of the Helmholtz equation for calculating the pressure in the cells
,
,
,
can be written in the form:
Dynamic and kinematic conditions at the boundary (
x1 =
c1,
x2 =
c1 +
c2,
x3 =
c1 +
c2 +
c3) of media.
Dynamic and kinematic conditions at the boundaries of (
x = 0,
x = 1) media, taking into account the phase shift:
3. Dispersion Relations
The wave motion in the unit cell of a polydisperse phononic crystal (
Figure 1) is described using four equations in the corresponding domains and conditions at the contact boundaries of two (Media1 and Media2) media of continuity of acoustic pressure and acoustic velocity. In addition, the phase shift condition must be met at the boundaries of the unit cell.
These relations can be considered as a system of algebraic equations for unknown coefficients
,
,
,
,
,
,
,
. Since this system of equations is homogeneous, the solution of the system of equations with the matrix
M(
exists if the determinant of the matrix is zero
Det (M (. For all specific phononic crystals with known parameters media of Media1 and Media2, relation
is the dispersion relation in a phononic crystal for elementary wave packets of the form
For example, acoustic waves in a polydisperse phononic crystal made of water and air or polyurethane foam
With the help of dispersion relations (21), taking into account the accepted reference thermodynamic characteristics of water and air, using numerical methods for investigating functions given implicitly, it is possible to graphically describe the dependence of the upper frequency of the first bandwidth on the concentration of water in the air for polydisperse crystals. Since for the first bandwidth, the lowest frequency is 0, the upper value of the bandwidth is the width of this bandwidth.
The dependence of the frequency bandwidth on the linear concentration
k for fixed values of the parameters of two media (water–air) is shown in
Figure 2. Here, the polydispersity of the medium is taken into account using the expressions
k1 + k3 =
k, k3 = 0.2 ∗
k1, k4 = 0.2 ∗
k2. The graph coincides with the case of a monodisperse distribution of media,
k3 =
k4 = 0.
The most significant thing is that when k = 0.5 there is a global minimum of the width of the first frequency band as a function of linear concentration.
For an elementary wave packet (22), the phase velocity of wave propagation in a phononic crystal is determined using the ratio
which is true for mono and polydisperse phononic crystals. Here,
is a dimensionless wave number,
is a dimensionless cyclic oscillation frequency, and k is the concentration of the medium. It should be noted that the waves in any phononic crystal are always dispersing, since the phase velocity depends on the frequency of the wave (or on the wave number).
Figure 3 shows the dependence of the phase velocity on the wave number for equally large volume (linear,
k = 0.5) concentrations of water and air. Graphs are for monodisperse
k1 =
k2 = 0.5;
k3 =
k4 = 0 and polydisperse
k1 =
k2 = 0.4;
k3 =
k4 = 0.1 phononic crystals.
4. The Effect of Polydispersity on the Dispersion Ratio and Bandwidth for Long Waves
The dispersion relation for low-frequency waves (or for small frequency values) is the form
This relation defines the dimensionless frequency as a function of the system parameters and associates it with the parameter wavenumber, which determines the wavelength of an elementary wave packet traveling through a phononic crystal. Here, k = k1 + k3, and the parameter is the ratio of the speed of sound in media 2 (gas or air) to the speed of sound in media 1 (water or polyurethane).
This explicit expression of the dependence of the dimensionless frequency on the wavenumber is obtained by direct calculation from the dispersion relation (22) for low frequencies, . This expression does not depend on the polydispersity of phononic crystals. This means that polydispersity does not affect the propagation of low-frequency waves in phononic crystals. It should be noted that it is assumed here that polydispersity has little or no effect at all on the change in the size (length) of the unit cell of the phononic crystal.
5. Comparative Analysis of Dispersion Ratios of Two-Component Mono and Polydisperse Phononic Crystals at a Fixed Concentration of Media
This section presents the results of numerical and analytical studies of the effect of crystal polydispersity on dispersion relations for acoustic waves in crystals. Throughout, the volume (linear) concentration of the components is constant and equal to 0.5 in fractions or 50% in percent, unless otherwise specified.
Table 1 and
Table 2 describe the quantitative characteristics after crushing the components in the unit cell. The first column contains the phononic crystal number, the second the characteristics (lengths) of alternating connected components of PCs, and the third column, the color of the graph of the corresponding dispersion ratio (as indicated on
Figure 4,
Figure 5 and
Figure 6).
When describing the properties of the dispersion relations shown in
Figure 4, it is necessary to note that perturbation of a monodisperse crystal by crushing its components in the unit cell expands the first bandwidth. The dispersion relations on the interval (0,
) are shown. Waves in the interval (0,
) propagate in the positive direction along the coordinate axis (x). At the interval (
,
), the waves propagate in the negative direction of the coordinate axis (x). For long waves (
), the polydispersity or fragmentation of the components does not affect the dispersion relations for acoustic waves in phononic crystals. This fully confirms and coincides with the analytical, explicit form of dispersion relations for long waves (24).
It should be noted that the graphs of dispersion relations for phononic crystals N4 and N6 coincide well.
We performed comparative analysis of dispersion relations for acoustic waves in polydisperse phononic crystals obtained by crushing components in the unit cell of a monodisperse phononic crystal.
Figure 7 shows graphs of dispersion relations for four phononic crystals, N3–N6, in the wavenumber interval (0, 4
). The appearance of phononic crystals with a smaller unit cell size as a result of crushing significantly changes the dispersion relations for acoustic waves. It should be noted that splitting the phononic crystal components into 2, 3, … N equal parts in the unit cell always leads to a catastrophic rearrangement of the dispersion relations for acoustic waves in these crystals.
6. The Effect of the Fragmentation of Components in the Unit Cell of a Phononic Crystal on the Phase Velocities of Acoustic Waves
Hereafter, the following terminology is used unless otherwise stated:
N5 is a basic monodisperse phononic crystal with an equal volume (linear) concentration of components, and all the others are obtained from it by crushing the components.
N6 is a phononic crystal with a smaller spatial period obtained by crushing the components of crystal N5. This crystal catastrophically changes the dispersion relations for acoustic waves of phononic crystal N5.
Figure 8 shows graphs of the phase velocities of acoustic waves in phononic crystal as functions of the wavenumber for six phononic crystals in the wavenumber interval (0,
). The appearance of phononic crystals with a smaller unit cell size as a result of crushing causes an increase in the velocity of acoustic waves in the phononic crystal. Properties of acoustic velocities in phononic crystals N4 (0.25 + 0.3 + 0.25 + 0.2, coral) and N6 (0.25 + 0.25 + 0.25 + 0.25, violet) (
Table 3) are signs of a catastrophic restructuring of the dispersion properties of these crystals.
7. The Effect of the Fragmentation of Components in the Unit Cell of a Phononic Crystal on the Width of the First Bandwidth
In this section, with the help of precise dispersion relations, studies of the effect of component fragmentation (
Table 4) on the width of the first bandwidth are carried out.
The graphs show the dependence of the upper boundary of the first (lower) band of dimensionless frequencies on the size of one part of the crushing of the second component of a two-component phononic crystal, which is shown in
Figure 1.
The graph of the dependence of the width of the first bandwidth for phononic crystals of type N2 is in good agreement with the appearance of a unit cell with a smaller size as a result of crushing phononic crystals, which significantly changes the dispersion relations for acoustic waves. This means that splitting the corresponding components in half primarily causes (or causes) the greatest expansion of the first bandwidth in comparison with a monodisperse phononic crystal with the same concentration of components.
8. The Effect of the Crushing of Components in the Unit Cell of a Phononic Crystal on the Width of the First Forbidden Band
Graphs of the dependence of the width of the first forbidden frequency band for phononic crystals (
Figure 9) agree well with the graph of the dependence of the width of the first bandwidth for phononic crystals (
Figure 10). Splitting the corresponding components in half primarily causes (or causes) the greatest expansion of the first forbidden frequency band. From the conducted studies, an important conclusion can be drawn that when splitting components, the most significant effect on the bandwidth and locking frequencies is provided by splitting the type “in half”—into equal or almost equal parts. Such splitting of the phononic crystal components significantly expands the first bandwidth and narrows the first forbidden band.
The graphs show the dependence of the upper boundary of the first (lower) band of dimensionless transmission frequencies and the lower boundary of the first blocking frequency band on the size of one part of the crushing of the second component of a two-component phononic crystal, which is shown in
Figure 1.
9. Some Examples
Thus,
Figure 11 shows the dependence of the phase velocity
on the phase shift x for different values of the concentration
k1. This figure shows the effect of polydispersity (at different concentrations) of phononic crystals on the bandwidth and locking.
Next, we give some numerical examples of these results in the case of wave propagation in phononic crystals consisting of other materials.
Figure 12a–c shows comparative graphs of the transmission frequency dependence on the wavenumber for gas water, brick and concrete, respectively, for mono and polydisperse media.
10. Conclusions, Results and Discussions
Monodisperse and polydisperse two-component phononic crystals are models of the corresponding inhomogeneous media. These approximate models of phononic crystals make it possible to develop software applications for visualizing scientific calculations of wave propagation in inhomogeneous media. Using numerical and analytical research methods, it is shown that in two-component phononic crystals, the polydispersity of the components can significantly affect the averaged propagation characteristics of long acoustic waves in phononic crystal, in the case when the polydisperse crystal is close to a monodisperse crystal with a smaller unit cell size. For polydisperse crystals close to monodisperse with the same unit cell size, the averaged characteristics are close and asymptotically coincide in wavelength.
It is shown that splitting the components of phononic crystals into 2, 3, … N equal parts in the unit cell always leads to a catastrophic rearrangement of the dispersion relations for acoustic waves in these crystals.
When splitting components in the unit cell of phononic crystals, the most significant effect on the bandwidth and locking frequencies is provided by splitting the type “in half”—into equal or almost equal parts. Such fragmentation of the phononic crystal component significantly expands the first bandwidth and narrows the first forbidden band.
Author Contributions
S.S., A.Z., G.B.—conceptualization, methodology and validation.; G.B., K.D., Z.A., Z.J.—software, formal analysis, visualization and writing; A.Z., N.G., N.Z., Z.A.—review and editing, and supervision. All authors have read and agreed to the published version of the manuscript.
Funding
The Science Committee of the Ministry of Education and Science of the Republic of Kazakhstan fund this research (The research was carried out as part of the project AP13068064-Design of layered structural impact-resistant materials with piecewise gradient and pseudo-stochastic structure (multilayer armor).
Institutional Review Board Statement
The study did not require ethical approval.
Informed Consent Statement
Informed consent was obtained from all subjects involved in the study.
Data Availability Statement
Data are contained within the article.
Conflicts of Interest
The authors declare no conflict of interest.
References
- Lou, L.-F. Introduction to Phonons and Electrons; World Scientific Publishing Co. Pte. Ltd.: Singapore, 2003. [Google Scholar]
- Torrent, D.; Sanchez-Dehesa, J. Acoustic metamaterials for new two-dimensional sonic devices. New J. Phys. 2007, 9, 323. [Google Scholar] [CrossRef]
- Sitdikova, L.F.; Gimaltdinov, I.K. The problem of the propagation of acoustic waves in a porous environment saturated with bubble liquid. Vestn. Yuzhno-Ural. Gos. Universiteta. Seriya Mat. Mekhanika Fiz. 2021, 13, 59–66. [Google Scholar]
- Kafesaki, M.; Penciu, R.; Economou, E. Air bubbles in water: A strongly multiple scattering medium for acoustic waves. Phys. Rev. Lett. 2000, 84, 6050. [Google Scholar] [CrossRef] [PubMed] [Green Version]
- Krylov, V.V.; Winward, R.E.T.B. Experimental investigation of the acoustic black hole effect for flexural waves in tapered plates. J. Sound Vib. 2007, 300, 43–49. [Google Scholar] [CrossRef] [Green Version]
- Bratu, M.; Dumitrescu, O.; Vasile, O.; Constantin, A.; Muntean, M. Research on the sound-absorbing properties of new composite materials with some wastes. Rom. J. Mater. 2014, 44, 160–168. [Google Scholar]
- Rajappan, S.; Bhaskaran, P.; Ravindran, P. An insight into the composite materials for passive sound absorption. J. Appl. Sci. 2017, 17, 339–356. [Google Scholar] [CrossRef]
- Popa, B.-I.; Cummer, S.A. None-reciprocal and highly nonlinear active acoustic metamaterials. Nat. Commun. 2014, 5, 3398. [Google Scholar] [CrossRef] [PubMed] [Green Version]
- Fleury, R.; Sounas, D.L.; Sieck, C.F.; Haberman, M.R.; Alu, A. Sound isolation and giant linear nonreciprocity in a compact acoustic circulator. Science 2014, 343, 516–519. [Google Scholar] [CrossRef] [PubMed]
- Sukhinin, S.V. Wave propagation and resonant phenomena in inhomogeneous media. PMTF 2001, 42, 32–42. [Google Scholar]
- Brillouin, L.; Parodi, M. Wave Propagation in Periodic Structures; Publishing House of Foreign Lit.: Moscow, Russia, 1959. [Google Scholar]
- Sanchez-Palencia, E. Non homogeneous media and vibration theory. In Lecture notes in Physics; Springer: Berlin, Germany, 1980; Volume 127. [Google Scholar]
- Ilyashenko, A.V.; Kuznetsov, S.V. Pochhammer–Chree waves: Polarization of the axially symmetric modes. Arch. Appl. Mech. 2018, 88, 1385–1394. [Google Scholar] [CrossRef]
- Kuznetsov, S.V. Lamb waves in stratified and functionally graded plates: Discrepancy, similarity, and convergence. Waves Random Complex Media 2021, 31, 1540–1549. [Google Scholar] [CrossRef]
- Sukhinin, S.V.; Kondratenko, D.A. Wave propagation in strongly non homogeneous wave guide. In Proceedings of the 1998 International Conference on Mathematical Methods in Electromagnetic Theory, MMET 98, Kharkov, Ukraine, 2 June 1998; Volume 2, pp. 835–837. [Google Scholar]
- Saimanova, Z.B.; Sukhinin, S.V.; Zhumadillayeva, A.K. Wave transmission and reflection from the boundary of phononic crystal homogeneous medium. Eurasian J. Math. Comput. Appl. 2020, 8, 62–75. [Google Scholar] [CrossRef]
- Garcia-Moliner, F.; Velasco, V.R. Theory of Single and Multiple Interfaces, the Method of Surface Green Function Matching; World Scientific: Singapore, 1992. [Google Scholar]
- Brekhovskikh, L.M. Waves in Layered Media; Academic: New York, NY, USA, 1981. [Google Scholar]
- Baenova, G.; Sukhinin, S.; Zhulamanova, Z.; Zhumadillayeva, A. Effect of polydispersity on the bandwidth of transmission and locking in phonon two-component crystals. J. Mech. Eng. Res. Dev. 2021, 44, 79–88. [Google Scholar]
- Mukhin, N.; Kutia, M.; Oseev, A.; Steinmann, U.; Palis, S. and Lucklum, R. Narrow Band Solid-Liquid Composite Arrangements: Alternative Solutions for Phononic Crystal-Based Liquid Sensors. Sensors 2019, 19, 3743. [Google Scholar] [CrossRef] [PubMed] [Green Version]
- Vasileiadis, T.; Varghese, J.; Babacic, V.; Gomis-Bresco, J.; Urrios, D.; Graczykowski, B. Progress and perspectives on phononic crystals. J. Appl. Phys. 2021, 129, 160901. [Google Scholar] [CrossRef]
Figure 2.
The upper frequency of the bandwidth for the 1st band or the width of this band, depending on the concentration of water in the air. Polydispersity k1 + k3 = k, k3 = 0.2 ∗ k1, k4 = 0.2 ∗ k2 is taken into account here. The graph coincides with the case of a monodisperse distribution of media, k3 = k4 = 0.
Figure 3.
Phase velocity as a function of the wavenumber for monodisperse k1 = k2 = 0.5; k3 = k4 = 0 and polydisperse k1 = k2 = 0.4; k3 = k4 = 0.1 phononic crystals. The graphs match.
Figure 3.
Phase velocity as a function of the wavenumber for monodisperse k1 = k2 = 0.5; k3 = k4 = 0 and polydisperse k1 = k2 = 0.4; k3 = k4 = 0.1 phononic crystals. The graphs match.
Figure 4.
Small perturbations of a monodisperse crystal with a constant concentration of components of the form 0.5 + 0.5 + 0 + 0: N1 crystal of the kind 0.4 + 0.4 + 0.1 + 0.1, color = black; N2 crystal of the form 0.4 + 0.25 + 0.1 + 0.25, color = green; N3 component of the form 0.5 + 0.5 + 0 + 0, color = blue.
Figure 5.
Small perturbations of a monodisperse crystal with a constant concentration of components of the form 0.25 + 0.25 + 0.25 + 0.25. N4: 0.25 + 0.24 + 0.25 + 0.26, color = brown; N5: 0.3 + 0.2 + 0.2 + 0.3, color = red; N6: 0.25 + 0.25 + 0.25 + 0.25, color = yellow.
Figure 5.
Small perturbations of a monodisperse crystal with a constant concentration of components of the form 0.25 + 0.25 + 0.25 + 0.25. N4: 0.25 + 0.24 + 0.25 + 0.26, color = brown; N5: 0.3 + 0.2 + 0.2 + 0.3, color = red; N6: 0.25 + 0.25 + 0.25 + 0.25, color = yellow.
Figure 6.
General view for comparison.
Figure 6.
General view for comparison.
Figure 7.
The appearance of a smaller spatial period during the crushing of the components of a monodisperse crystal with a constant concentration of the form 0.25 + 0.25 + 0.25 + 0.25. Here: N3: 0.5 + 0.5 + 0 + 0, color = blue; N4: 0.25 + 0.24 + 0.25 + 0.26, color = red; N5: 0.3 + 0.2 + 0.2 + 0.3, color = green; N6: 0.25 + 0.25 + 0.25 + 0.25, color = violet. Splitting the components in half, each component is divided into 2 equal parts (two halves).
Figure 8.
Change in the phase acoustic velocity during crushing of the components of a monodisperse crystal N5 with a constant concentration of the form 0.5 + 0.5 + 0 + 0. Here: N1: 0.45 + 0.45 + 0.05 + 0.05, red; N2: 0.49 + 0.49 + 0.01 + 0.01, blue; N3: 0.05 + 0.25 + 0.45 + 0.25, green; N4: 0.25 + 0.3 + 0.25 + 0.2, coral; N5: 0.25 + 0.3 + 0.25 + 0.2, black; N6: 0.25 + 0.25 + 0.25 + 0.25, violet.
Figure 9.
The change in the width of the first bandwidth when crushing the components of a monodisperse crystal with a constant concentration of 50%. The values of the main parameters are described in the table of parametric crushing of the elements of the unit cell. Here: N1—the constant sizes of the two connected parts of the crushing 0.1 and 0.4, red; N2 is 0.2–0.3, blue; N3 is 0.05–0.45, green.
Figure 10.
The change in the width of the first forbidden frequency band when crushing the components of a monodisperse crystal with a constant concentration of 50%. Here: N1—constant sizes of two connected parts of crushing 0.1 and 0.4, red; N2 is 0.2–0.3, blue; N3 is 0.05–0.45, green.
Figure 10.
The change in the width of the first forbidden frequency band when crushing the components of a monodisperse crystal with a constant concentration of 50%. Here: N1—constant sizes of two connected parts of crushing 0.1 and 0.4, red; N2 is 0.2–0.3, blue; N3 is 0.05–0.45, green.
Figure 11.
The change in phase velocity at different concentrations.
Figure 11.
The change in phase velocity at different concentrations.
Figure 12.
Comparative characteristics (a) for gas water, (b) for brick, (c) for concrete. The total concentration for mono and polydisperse media is 0.5.
Figure 12.
Comparative characteristics (a) for gas water, (b) for brick, (c) for concrete. The total concentration for mono and polydisperse media is 0.5.
Table 1.
Small perturbations of a monodisperse crystal. Description of the unit cell [0,1].
Table 1.
Small perturbations of a monodisperse crystal. Description of the unit cell [0,1].
| Cell Number | Component Length | The Color of the Graph |
|---|
| N 1 | 0.4 + 0.4 + 0.1 + 0.1 | Black |
| N 2 | 0.4 + 0.25 + 0.1 + 0.25 | Green |
| N 3 | 0.5 + 0.5 + 0 + 0 | Blue |
Table 2.
Small perturbations of a monodisperse crystal with a period 2 times smaller. Description of the unit cell [0,1].
Table 2.
Small perturbations of a monodisperse crystal with a period 2 times smaller. Description of the unit cell [0,1].
| Cell Number | Component Length | The Color of the Graph |
|---|
| N 4 | 0.25 + 0.24 + 0.25 + 0.26 | Brown |
| N 5 | 0.3 + 0.2 + 0.2 + 0.3 | Red |
| N 6 | 0.25 + 0.25 + 0.25 + 0.25 | Yellow |
Table 3.
Crushing of a phononic crystal.
Table 3.
Crushing of a phononic crystal.
| Crystal Number | Type of Crushing | The Color of the Graph |
|---|
| N1 | 0.45 + 0.45 + 0.05 + 0.05 | Red |
| N2 | 0.49 + 0.49 + 0.01 + 0.01 | Blue |
| N3 | 0.05 + 0.25 + 0.45 + 0.25 | Green |
| N4 | 0.25 + 0.3 + 0.25 + 0.2 | Coral |
| N5 | 0.5 + 0.5 + 0 + 0 | Black |
| N6 | 0.25 + 0.25 + 0.25 + 0.25 | Violet |
Table 4.
Parametric fragmentation of the elements of the unit cell.
Table 4.
Parametric fragmentation of the elements of the unit cell.
| Crystal Number | | | | | The Color of the Graph |
|---|
| N 1 | 0.1 | C2 | 0.4 | 0.5- C2 | Red |
| N 2 | 0.2 | C2 | 0.3 | 0.5- C2 | Blue |
| N 3 | 0.05 | C2 | 0.45 | 0.5- C2 | Green |
| Publisher’s Note: MDPI stays neutral with regard to jurisdictional claims in published maps and institutional affiliations. |
© 2022 by the authors. Licensee MDPI, Basel, Switzerland. This article is an open access article distributed under the terms and conditions of the Creative Commons Attribution (CC BY) license (https://creativecommons.org/licenses/by/4.0/).


 ,
, 


