Featured Application
Authors have provided a concise description of the specific application or a potential application of the work.
Abstract
There are various groundwater data bases and scanty/sketchy groundwater monitoring and information systems. Groundwater monitoring has been difficult in the Southern African region, particularly, the Democratic Republic of Congo (DRC), for the water administrative authorities. Water clients do not submit the required compulsory critical data for effective monitoring of water use. This, combined with the absence of limits to boreholes dug by permit holders to the water authorities, has led to challenges in decision-making and groundwater conservation. In this mixed method research, using an Android telephone, well data (water levels) and climatic related information such as precipitation were assembled and sent to a composed store through a sort code/USSD/Instrument free line in texts (SMS). This is proficient through a 3G/GSM/GPRS module that is part of the sensor equipment to be used for this procedure. Once in the store, requests were used to recuperate data in the required design. Additionally, a cloud framework at the point where a long-lasting file was followed up. Although the experimentation is still on-going for the case of the Kimbanseke catchment in DRC, the preliminary findings are that the Kimbanseke catchment has a fluctuating abstraction rate resulting from no clear monitoring mechanism, and that research on the development of an application and/or MS Excel© monitoring spreadsheet, using the scores, and ranking of the factors, is necessary. Therefore, a study was carried out with the aim of creating an analysis application for groundwater sustainability in the Kimbanseke catchment. An application for monitoring and evaluation of the groundwater level should be considered so that the sustainable yield is routinely adjusted for the Kimbanseke catchment.
1. Introduction
Despite its enormous surface and groundwater resources, the Democratic Republic of Congo (DRC) has been experiencing a growing shortage of safe drinking water in recent decades [1]. Overcrowding, particularly in metropolitan areas, failure of the government to implement water master plans, and a continued low-intensity war in the eastern part of the country with its ramifications on the economy of the country, are all factors contributing to this predicament [2]. As a result, the collection of groundwater is a growing business for many local organizations such as the National Service of Rural Hydraulics (NSRH), private companies and Environmental Non-Governmental Organizations (ENGO). Therefore, the need to provide high-quality drinking water in urban, semi-urban and rural areas, is paramount in DRC [3,4].
Groundwater is the world’s most abundant freshwater resource providing about half of all drinking water, about 40% of water for irrigated agriculture, and roughly one-third of the water necessary for industry [5]. In addition to this, it helps preserve the ecosystem and the river’s baseflow [6]. Groundwater is an important source of storage for climate change adaptation because it reduces land subsidence and ocean intrusion [7]. However, aquifers are frequently misunderstood and inadequately managed due to their invisibility [8]. Groundwater levels, abstraction rates, spring discharge and groundwater quality are all measured around the world [9]. However, because of insufficient monitoring and limited access to monitoring data/outcomes, there is insufficient understanding regarding the state and trends of groundwater resources globally [8]. Groundwater level and quality monitoring in an aquifer can operate as an early warning system in preventing infinite groundwater exploitation and pollution, which is becoming increasingly important due to rising concerns about groundwater exploitation and pollution [10]. Most of the current research focuses on the exchange of surface and groundwater, as well as groundwater system models [11], and little is known about monitoring of this resource both in quantity and quality. Since the cost of installing and maintaining a groundwater monitoring network is so high, it is necessary to create an optimal monitoring network, which necessitates the study of effective network design approaches [12]. Borehole information such as water levels is critical to regulators [13]. For example, [14] suggested that a permit for the abstraction of 1.6 million cubic meters of water by a water consumer from the nearby aquifer could take 5, 10 or 20 boreholes. It should be noted that it is possible to convey this volume of water from an aquifer that has been assessed to reasonably yield an adequate volume for this allotment. It is the volume that has been authorized, not the number of boreholes [15]. With this volume, there should be challenges in investigating the amount of groundwater withdrawn [16] because there are not many non-hydrological methodologies behind how this volume may be investigated [5]. In addition, some questions must be answered: how do regulators ascertain that groundwater use does not exceed the approved water license? [14].
The advantages of using information and communications technology (ICT) are that it makes use of the Internet of Things in real time (Figure 1). For example, 3D innovation can deal with substantial informational indexes, and it is current and stylish. ICT is a cutting-edge data-gathering system for use by groundwater user clients or groundwater specialist organizations. Furthermore, the system provides real-time updates and early warning signals to groundwater management. According to a recent study by [17], this reinforces good behavioral practices on water abstraction and effective water use. The information from the proposed/exploratory system may be used in evaluating the sustainability of groundwater systems in various catchments throughout DRC and the Southern African region. This will in turn support behavioral changes and practices among groundwater consumers and municipalities [17].
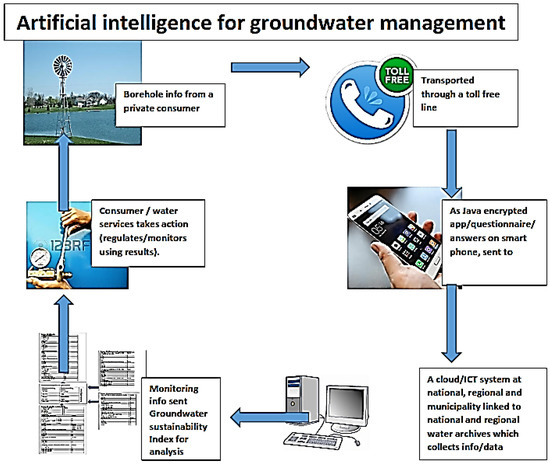
Figure 1.
Proposed App architecture.
The innovative element of technology, its primary output and potential commercial value, are that they will contribute to new knowledge in the development of a groundwater sustainability framework that supports an ICT improved groundwater monitoring system [18]. The sustainability framework uses physical and subjective techniques [19]. The sustainability index evaluates variables easily [20]. The solution takes the form of a generic early warning system (EWS) consisting of four components, namely: (1) gathering of the risk knowledge; (2) monitoring and predicting the situation; (3) communicating the warning messages and (4) responding to the warning [21]. To incorporate the various ICTs (artificial intelligence (AI), wireless sensor networks, mobile phones, etc.) in the three elements’ EWS, the ISDR’s model was adapted as was the case in the ITIKI framework by [22]. The design features are supported by Android technology and Java programming. Figure 2 and Figure 3 represent the application’s architecture.
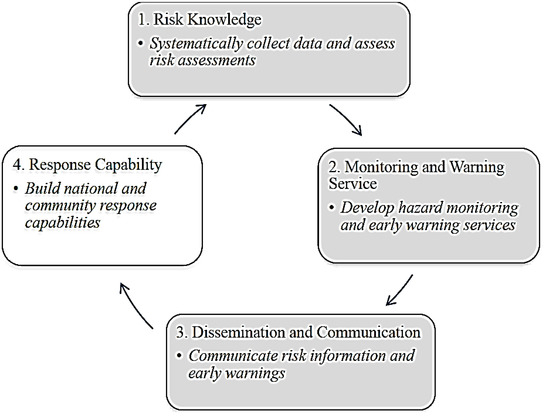
Figure 2.
Elements of an Early Warning System.
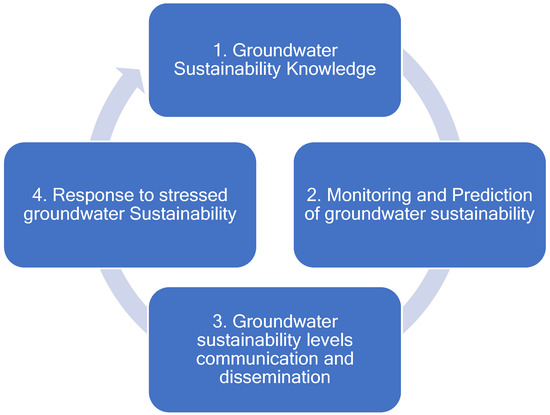
Figure 3.
Groundwater Sustainability Early Warning System.
The advanced components of innovation, its essential yield and potential business esteem should add to new information and improvement of a groundwater sustainability structure that backs an ICT enhanced groundwater monitoring framework [23]. The sustainability structure uses physical and cognitive strategies [24]. The purpose of AI in groundwater administration is to increase groundwater protection and sustainability through an observing framework that advances constant updates and early warning signs to water administration and strengthens positive conduct on water abstraction and viable water use [25]. Groundwater users will have the capacity to check excessive use of water and any regional government will have the capacity to measure if a catchment is over-exploited [15]. The net pick-up or effect will be water investment funds, cost reserve funds and better execution of water administration in regions and offices. The application will collect real-time information posed as questions reviewing the knowledge attitude and practices of the water consumers about water consumption [26]. Cell phone use/mobile internet is seen as one of the most extensively used methods of connectivity worldwide and for many people, cell phones are the vehicle for mobile internet [27]. This is owing to technological advancements that have allowed mobile phones to take the place of desktop or laptop computers in locations where internet connectivity is still relatively new [28]. Because of the smartphone era, citizen science has also grown in popularity because of the emergence of mobile communication devices such as smartphones [29]. With the introduction of the iPhone in 2007, Apple paved the way for this disruptive technology [30]. Consumers and scientists alike have embraced this new technology and a world without smartphones is unthinkable today [31]. Therefore, this article attempts to put the following three aspects into perspective: (1) Smart groundwater monitoring using apps with linkages to groundwater lithology. (2) Issues with groundwater over abstraction in DRC in the context of land use and land cover. (3) The role of apps and technology in citizen engagement and science.
2. Materials and Methods
2.1. Overview of the Adapted Mixed Method Approach
To establish an app monitoring system for groundwater management status, a variety of sources of material of the study area were required and examined. This includes data mined using the GIS-based analytical and numerical modelling technique to build a groundwater flow model that took into consideration muddled urbanization of Kimbanseke, in the Democratic Republic of Congo, and their implications on groundwater in the Capital City, Kinshasa. The model was also used to anticipate how different development scenarios would affect groundwater supply and management. Because of the era and advance of the fourth industrial revolution (4IR), the researchers used an artificial neural network (ANN) and not an RF. In addition, ANNs are innovative and easy to adapt [23]. The purpose of AI in groundwater management is also to increase groundwater conservation and sustainability through a monitoring system that promotes real-time updates and early warning signals to water management, and reinforces positive, acceptable behavioral practices on water abstraction and effective water use [32]. Groundwater consumers will be able to gauge when their water usage is too high, and municipalities will be able to gauge if a catchment is over-abstracted [33]. The net gain or impact will be water savings, cost savings and the better performance of provinces, municipalities and departments that manage water [34].
2.2. Study Area
The community of Kimbanseke is located between 4°15″ and 4°30″ south latitude, 15°20″ and 15°30″ east longitude (see Figure 4) [35]. With reference to Figure 4, the main study area is 23,780 km2. The municipality of Kimbanseke is ranked third after the municipality of Mont-Ngafula and, in population, is close to about 1,400,000 inhabitants. Iannt is the most populous municipality of the city of Kinshasa [31]. It is inhabited mainly by nationals of the provinces of Bandundu and followed by Bas–Congo [36].
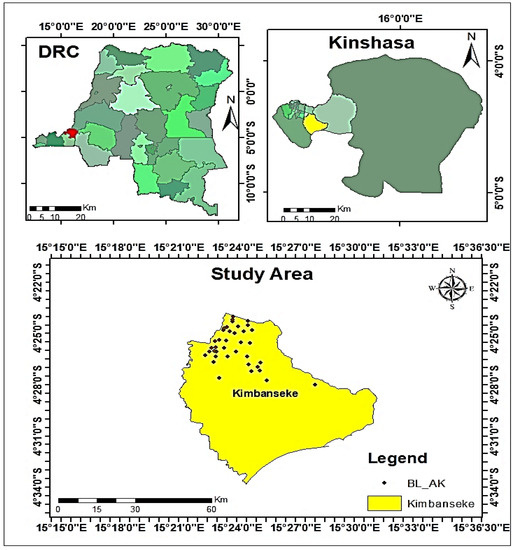
Figure 4.
The Study area of Kimbanseke.
The municipality of Kimbanseke (formerly the municipality of Tshangu) was created by ministerial decree No. 68-026 of 30 March 1968, establishing the name of the new communes of the city of Kinshasa [32]. Additionally, with the construction of the cemetery and the paving of the road leading to it, Kimbanseke has become a real agglomeration bringing together groups of people such as Humbu, natives and Zombo, as well as Congolese from other provinces in search of a piece of land, and this has resulted in overpopulation of the area, and many commercial activities have sprung up as a result [37]. The demand for water is increasing because of the population rise combined with industrialization and globalization [38]. Furthermore, while surface water has been intensively exploited in the developing countries, its quality and quantity have deteriorated [39]. Water well interferences, chaotic urbanization-related soil erosion and sedimentation, household and industrial wastewater effluents, and solid waste damping are all examples of anthropogenic causes [40]. Due to the paucity of good quality raw fresh surface water in many parts of the world, people have turned to groundwater as an alternative [41]. A company called Regideso is responsible for suppling water for the urban and semi-urban area, and it is experiencing major infrastructural and maintenance issues with its production equipment [42]. Thus, this has impacted on the Kimbanseke water crisis and has been exacerbated by obsolete, inadequate infrastructure and a lack of reliable electricity [43]. Groundwater, as well as water quality monitoring, needs to be implemented, integrated and brought more frequently into projects, aided by simple low-cost new testing equipment and technology [44]. Failure of safe initiatives directly targeting water quality, such as point-of-use treatment, may help relieve health impacts among the most vulnerable until reliable infrastructure is in place [45].
2.3. Conceptual Framework
Figure 5 illustrates the study’s overall conceptual framework including the data obtained and used, such as urban dynamic data and boreholes, as well as the various models used to analyze the various data collected, without ignoring the various procedures conducted for each model used. The study started with catchment delineation using ArcGIS, which included a description of the study area, land use and land cover, pumping scenarios and groundwater flow. Furthermore, as shown in Figure 5 below, Rockworks 16 was used to process borehole data for illustration in 3D view, as well as the geological aspect of the boreholes. The app was developed using ArcGIS app studio, which included the input of borehole data for deployment and, subsequently, distribution to users.
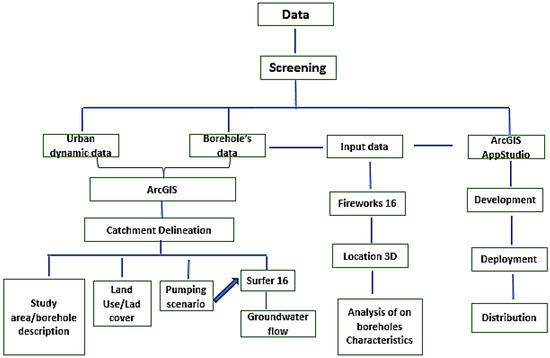
Figure 5.
Methodology framework.
2.4. Data Collection
The collection of data relating to the issue being studied is the initial step in groundwater research. Data from 39 exploration boreholes were collected from the Regideso company to conduct the study and this includes, among other things, all data relevant to the research area’s spatial analysis, environmental geology, pumping system and stream flows.
2.5. Software Used
The following software was utilized to complete this study satisfactorily: (1) A geographic information system (GIS), a system for creating, managing, analyzing and mapping various types of data. As such, GIS was used to process spatial data to represent geological models of the study area, as well as to show hydrogeological conceptual models. (2) Rockworks supports a variety of data types, for geological and hydrogeological analysis, such as visualization in 3D, interpretation and presentation, including borehole location, lithology diagram and stratigraphy diagram which will aid in the creation of the geological and hydrogeological conceptual model. Hence, Rockworks 16 software was utilized. Surfer 16 software was used to create representations of terrain surfaces by clearly expressing information about geology, hydrology, the environment and building among other things. AppStudio is a full set of productivity tools that make app development, testing, deployment, and distribution, simple and efficient.
2.6. Spatial Analysis Approach Aspect of the Study
2.6.1. Land Use and Land Cover
To achieve the research objectives, three land cover maps for 2010, 2015 and 2020 were created, comparing the growth or decline of criteria such as vegetation, urban planning, agriculture, and other factors to determine the impact of urbanization on Kimbanseke. The land cover maps for 2010, 2015 and 2020 were created using Landscapes 2010, 2015 and 2020. Using ArcGIS 10.5 software, the research region in Kimbanseke was retrieved from a Landsat picture and projected in the UTM 33 South zone for further examination and classification of the data.
2.6.2. Pumping Scenario
Four pumping scenarios were simulated in ArcGIS to determine the impact of increasing the pumping rate on the head (water level) of the groundwater. This effect was presented by the creation of visible maps that showed the affected future sustainable use of groundwater. The remaining three scenarios were simulated by raising the initial pumping rate by 15%, 30% and 60%, respectively, starting from 0% as the baseline data. This supported the illustrations of groundwater flow based on exported baseline in Surfer 16 software.
2.7. Software Solution Choice
The choice between custom software development and an off-the-shelf solution could jeopardize the success of the implementation. Both strategies have advantages and disadvantages to consider. In the context of the solution type, Table 1 compares the essential features that were evaluated.

Table 1.
Comparison of custom software development vs. off-the shelf solution.
When comparing the options in Table 1, the ESRI app studio for ArcGIS is a better option for the following reasons: (1) App studio provides mobile development that integrates directly with current data and maps, which is ENSRI’s core business. (2) Studio allows developers to create a completely custom app, use templates or modify existing apps (such as survey123) to the developer’s specifications using a vast library of proven source code, significantly reducing development time. (3) The mobile app will require an online database to show users with existing borehole placements and related data. Program studio also allows the app to be deployed to various mobile (and desktop) devices. The ESRI solution already has the capability and allows for easy integration with the studio solution in the app.
2.8. Steps Taken in the Development of the Groundwater Monitoring App Development
The diagram below (Figure 6) depicts the general stages for creating an app in AppStudio.
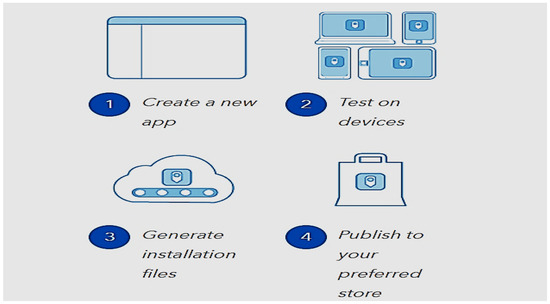
Figure 6.
General stages for creating an app in AppStudio.
2.8.1. Creation of a New App
Using AppStudio, the app was made by combining features from other apps and samples.
- ➢
- The begin button was clicked for using ArcGIS AppStudio.
- ➢
- In the toolbar, select New App was chosen.
- ➢
- Selection from Starter/the category list was made.
- ➢
- OK button was clicked.
2.8.2. Testing App on Major Devices
The following steps were completed to test the app on a different device:
- ➢
- In the gallery, the new app was situated there.
- ➢
- The app was uploaded to ArcGIS by clicking Upload on the side panel.
- ➢
- AppStudio Player was installed on a mobile phone.
- ➢
- ArcGIS was accessed using AppStudio Player.
- ➢
- The app was installed and run on the mobile/smart phone.
2.9. Licensing App
A developer subscription to ArcGIS is required to use this feature (Builder level and above). In the ArcGIS organization, the user must have an add-on license activated. Perceive ArcGIS Online’s Manage Licenses or ArcGIS Enterprise’s Manage Licenses for more information. All ArcGIS AppStudio features are included. The researchers created a standalone executable file for the software, ready for app marketplaces or Mobile Device Management (MDM). Furthermore, ArcGIS app studio allows a free 14-day trial for development, deployment, and distributions [46].
3. Results and Discussion
3.1. Systems Based on Mobile Architecture Used for Monitoring and Manage Municipal Waters
A case of the Sandspruit catchment in south Africa is added here for the purposes of deepening and widening the analysis of the papers discussions, fundings/results. In the study of the Sandspruit catchment, data from the National Groundwater Archives were used. Actions were taken to fill monitoring gaps in the Sandspruit catchment; data for groundwater flow and quality measurement were being collected using a hydrometer for the 24 boreholes that were drilled along three cross-sectional transects. As regards the result from this case study, it was found that the hydrological cycle is influenced by atmospheric conditions. Weather factors must be monitored to estimate evapotranspiration and, subsequently, groundwater recharge. Within the Sandspruit catchment, three weather stations were established at Zwavelberg farm (upper reaches) and Oranjeskraal farm (mid-reaches). Rainfall in the Sandspruit basin tends to decrease from the upper levels downstream (from 494 to 321 mm a−1). Temperatures in the air were rising daily. Solinst loggers in the boreholes were used to track groundwater levels and temperatures for two years. In terms of future work, it also determined that more boreholes were required for a comprehensive monitoring program in the Sandspruit catchment because:
- Borehole data (groundwater levels and chemistry) were erratic and rarely provided a time series.
- No geological or geophysical borehole log data were found, and the vertical extent of aquifers, non-aquifers and their hydraulic properties were not defined.
- A negative trend regarding rising water levels over time was discovered.
- Near fresh water, brackish groundwater was discovered.
- Inconsistencies existed in the existing data (e.g., the same data had been measured at different times and locations, appeared in more than one borehole., meaning the data was duplicated).
In terms of another case of systems based on mobile architecture used for monitoring and managing municipal waters, an ICT project was carried out in Uganda in the districts of Amuria and Masindi, where mobile phones were used to update information of the water coverage status and repair of broken-down water points. Hand pump mechanics where deployment with Java enabled phones in a project called Mobile phones for water (M4W), this has led to an additional 8000 water points being functional and serving these districts with over 430,000 people in total. In Uganda, through apps and general smart monitoring, the municipalities of Amuria and Masindi were able to identify non-functional water points and have them rehabilitated to increase access to equitable water and sanitation. Apps provide a sustainable updating mechanism for water atlases in real time. Such cases have been the motivation for this type of action research.
3.2. Land Use and Land Cover
From 2010 to 2020, the geographic dynamics of land use/land cover (LU/LC) for the study area are depicted in Figure 7; in support, Table 2 below summarizes the percentage of land use/cover according to the supervised classification for the LU/LC 2010, 2015 and 2020.
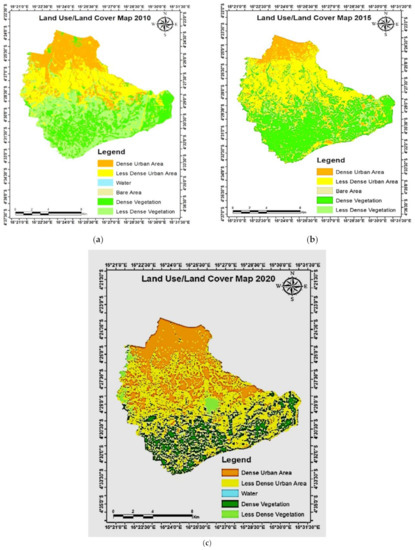
Figure 7.
(a,b) Land used/cover for (2010, 2015). (c). Land used/cover for 2020.
Table 2.
Land used/cover summary.
Due to population growth, an increase in an urban area was noticed, which increased from 40.7% to 74.4% percent (Table 2). However, there was a decline in dense and less dense vegetation, agricultural areas, and aquatic bodies because of driving forces exerting pressure on the environment. These driving forces include uncontrollable drilling and water abstraction, human made activity impacting climate change, pollution not being handled sustainably, increases in fertilizer and pesticide consumption, as well as the quantity of animals and intensification, which have all contributed to an increase in greenhouse gas emissions from agriculture (see Figure 8, Figure 9 and Figure 10).
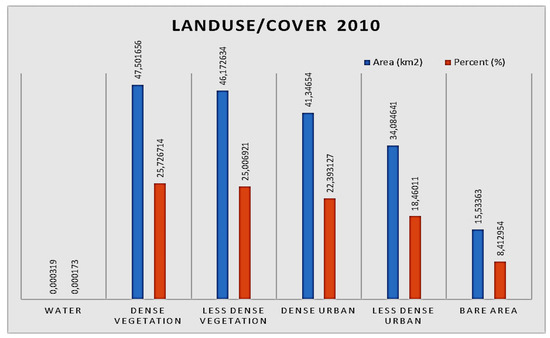
Figure 8.
Land used/cover for 2010.
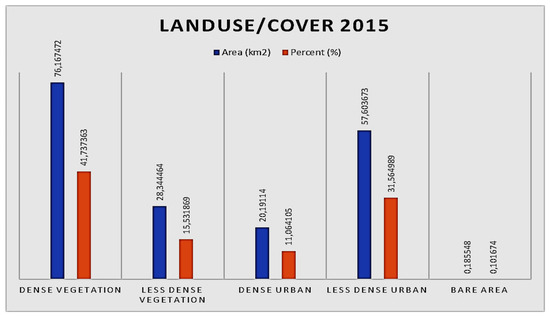
Figure 9.
Land used/cover for 2015.
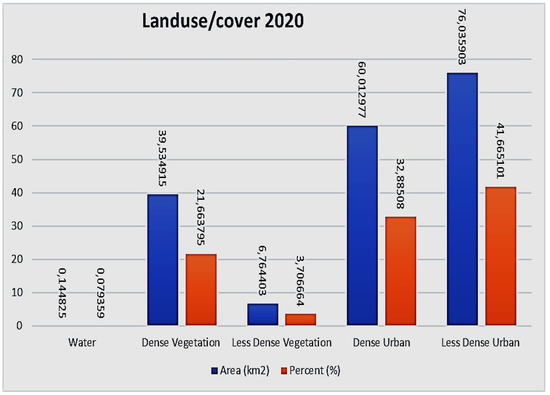
Figure 10.
Land used/cover for 2020.
3.3. Processes That Influence Groundwater Movement and Storage
Except where discharge is concentrated at springs or replenishment enters sinkholes, the dynamic aspect of groundwater is not easily apparent. Groundwater flow and storage on the other hand, are constantly being altered because of human and climatic stressors. A better knowledge of these changes in flow and storage, as well as their consequences on the terrestrial environment and a variety of surface-water features and their biota is required for wise groundwater resource development [47].
3.3.1. 3D Position of Boreholes
Building 3D drilling locations (see Figure 11) were achieved using Rockworks 16. The drilling site in 3D was created using lithological data from 39 drillings allowing us to gain a deeper understanding of the physical properties of each borehole before correlating them to create a block diagram.
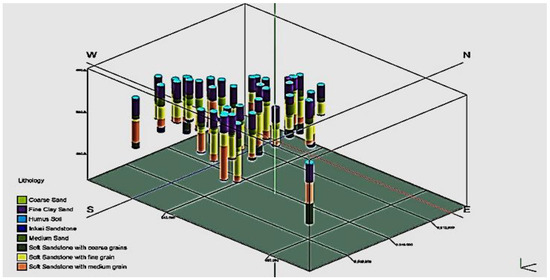
Figure 11.
3D Borehole location.
3.3.2. Stratigraphy Diagram
This 3D model (Figure 11) depicts a stratigraphy made-up primarily of three geological units. Firstly, the superficial soft sediments such as river alluvium and Lemba Sands. Secondly, underlying consolidated formations such as Soft Sandstones, and thirdly, the Schisto–Sandstone base of the inkisi, which serves as the foundation for all superimposed deposits and groundwater. The 3D stratigraphical model of the research region is shown in Figure 12.
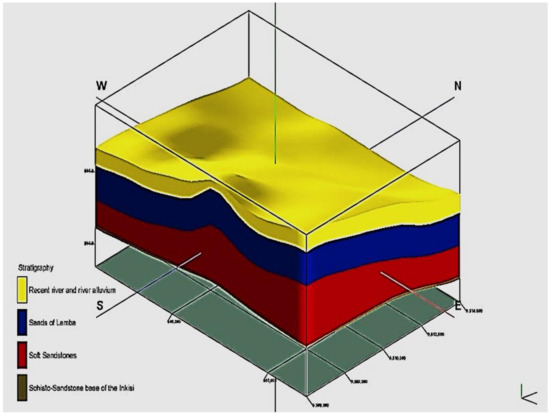
Figure 12.
Stratigraphy diagram.
Furthermore, the fence diagram of the stratigraphy components has been illustrated below to show the continuity and discontinuity of the geological layers (Figure 13).
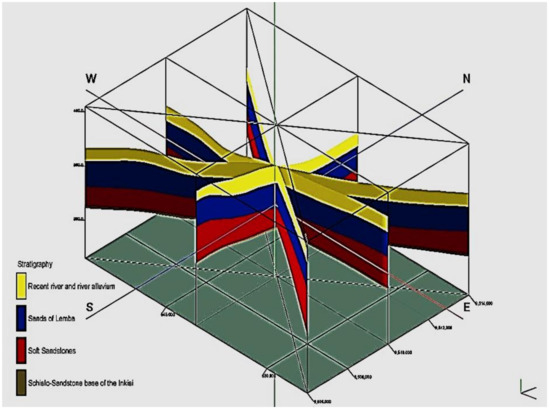
Figure 13.
Stratigraphy fence diagram.
This is crucial in groundwater research because each layer has hydraulic conductivity, which is linked to the characteristics that influence groundwater movement.
3.3.3. Lithology Diagram
Using lithological data from 39 boreholes in the study area, a lithological diagram was created using Rockworks 16 software. Figure 14 is a three-dimensional lithological diagram depicting various types of soils and rocks as seen vertically and horizontally. Coarse Sand, Fine Clay Sand, Humus Soils, inkisi sandstone, medium sand, Soft Sandstone with coarse grains, Soft Sandstone with fine grain and Soft Sandstone with medium grain are shown in this 3D model below.
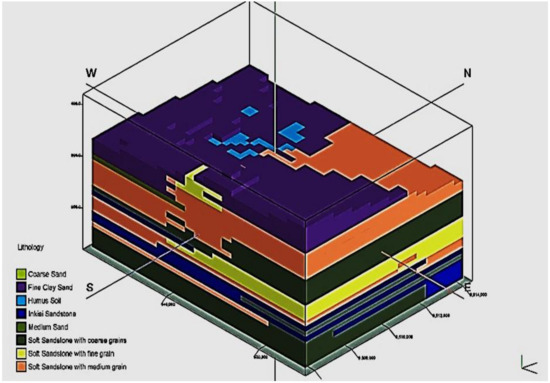
Figure 14.
Lithology of the Boreholes.
Moreover, the fence diagram of the lithology components is illustrated below to show the continuity and discontinuity of the geological layers, which help us generate the stratigraphy of the study area as is the synthesis of lithology (Figure 15).
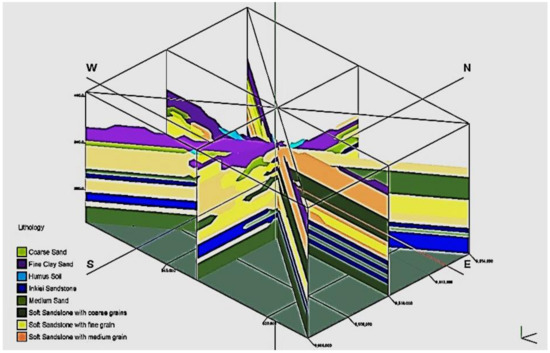
Figure 15.
Lithology fence diagram.
Figure 16 illustrates two boreholes’ monthly yield, f1 and f3, which are the main source of water to the population, as the Kimbanseke community relies on large-scale water extraction from springs through a distribution network. In addition, hand and mechanical pumps are used to extract the groundwater, which is estimated to account for around 10% of the drinking water supply. Due to load shedding, water was not extracted for the full 24 h. As can be seen in the figures above, the yield for the f1 and f3 boreholes varied for both July and August, and the intensity of the engine was ranged between 48–47, which links directly to the current voltage not being beyond 400 kw but above 360 kw for it to function properly. The highest abstraction happened on f1, with a volume of 3140 m3, as compared to f3, with an abstraction of 2900 m3 and both with a monthly July volume of 66,501 m3 and 66,850 m3, respectively. Furthermore, there has been a slight increase in the volume of abstraction for the month of August, with 76,596 m3 for f1 and 71,425 m3 for f2. This is due to no boundary limit put in place for water that can be extracted monthly, and this shows that there is a greater potential to extract a lot more water in the near future than what is currently being extracted.
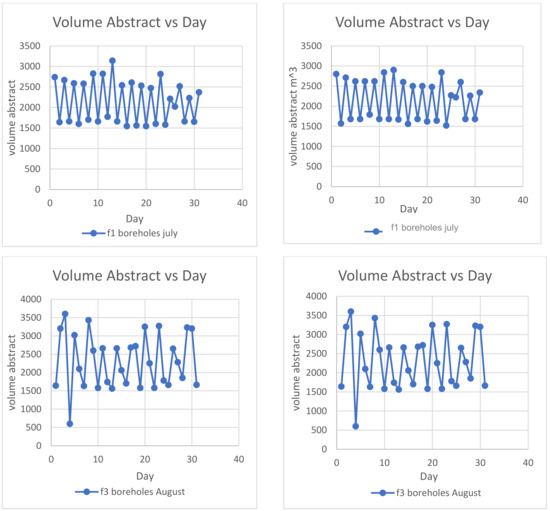
Figure 16.
Volume abstracted daily in Regideso.
Figure 17 illustrates global water withdrawal through time, in addition to the water withdrawal by the three major sectors—agricultural (including irrigation, livestock watering and cleaning, and aquaculture), industries and municipalities. Reservoir evaporation occurs in artificial lakes generated when a dam is built and takes place when water evaporates from their surface area. While this is not a water withdrawal per se, it should be considered as anthropogenic consumptive water use because evaporation would not have occurred without human intervention in the form of constructing a dam to store freshwater resources for various human related purposes, such as withdrawal for electricity generation.
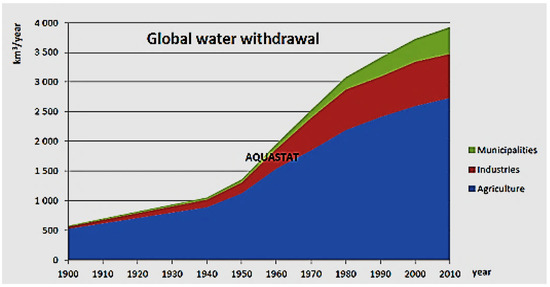
Figure 17.
Global water withdrawal over time.
As can be seen in Figure 17 above, FAO Aquastat projected total water withdrawals in 2000 to be 356 million m3, which represents only 0.04 percent of DRC’s internal renewable water resources. Similarly, water availability per capita in 2008 was predicted to be 19,967 m3. This is significantly higher than the internationally acknowledged water sufficiency criterion of 1700 m3 [48]. This clearly demonstrates the low level of national water resource mobilization and how the economic water constraints in DRC are impeding growth. Simultaneously, numerous places in Kimbanseke are at risk of physical water shortages soon. Surprisingly, crucial recharging zones such as the steeply sloping areas along the Congo–Nile watershed divide in eastern DRC are included in this study. For example, the Njili and Masina communities are the two emerging hotspots (where increased demand from a dense and fast-growing population is putting a strain on water resources). Drought-prone zones in the Kinshasa and savanna environments are also vulnerable to seasonal water shortages. Due to the low physical abstraction, hydropower generations are typically excluded from water use accounting. Given current trends, water withdrawal is projected to grow significantly in the future. Based on the year 2000 baseline, domestic water consumption is expected to expand by 470 percent, agriculture by 375 percent and industry by 225 percent as shown in Table 3 below.
Table 3.
Evolution of water withdrawal by section in DRC (million m3).
The remainder of the population mainly relies on shallow wells using both hand and machine pumps. Furthermore, the population is still aiming at expanding the boreholes drilling without any prior concern for water difficulties, regulations or challenges, and this shows no sign of preserving water and sustainable use of water. Thus, a monitoring system will be required for managing water sustainably.
3.4. Various Pumping Scenarios from the Well Field/Boreholes Assessment
Groundwater withdrawals without an appropriate aquifer management policy in Kimbanseke for the supply of water for various uses can result in a huge regional depression on the aquifer system’s potentiometric surface. Groundwater levels may be lowered as the pace of groundwater pumping increases. Moreover, to simulate anticipated changes in groundwater flow and groundwater levels in the Kimbanseke region, four groundwater prediction management scenarios were devised. These four scenarios included baseline data as initially with 0%, then with increases of 15%, 30%, and 60% in the initial pumping rate. The pumping scenarios are based on the forecasts from the planning authority. In addition to this, a groundwater flow model was also adapted as explained in Section 2 and Section 3 of this paper. Data were mined using GIS-based analytical and numerical modelling technique to build a groundwater flow model that took into consideration urbanization of Kimbanseke and their implications on groundwater within the region of the city of Kinshasa. Thus, the model was also used to anticipate how different development scenarios would affect groundwater supply and management.
3.4.1. Borehole’s Assessment from Baseline Information
The result of simulations in GIS over the period 2015 to 2020 revealed that the maximum and minimum simulated groundwater levels were 376.227 m and 253.925 m, respectively, as shown in Figure 18 below. This was in relation to the baseline information, which for this study was referred to as Scenario 1.
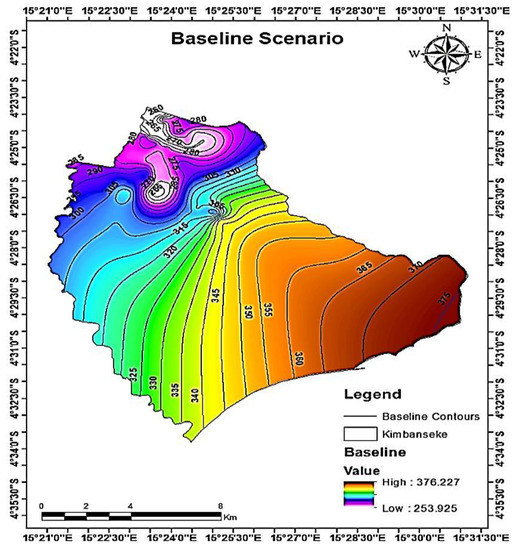
Figure 18.
Baseline scenario. (Source: Authors).
3.4.2. Borehole’s Assessment Scenario 1
For 5 years of simulated water consumption (from 2015 to 2020), an average decline of around 0.57 m in groundwater levels was seen when the consumption rate increased by 15%. Figure 19 depicts the reduction in headcount when the consumption rate rises by 15%.
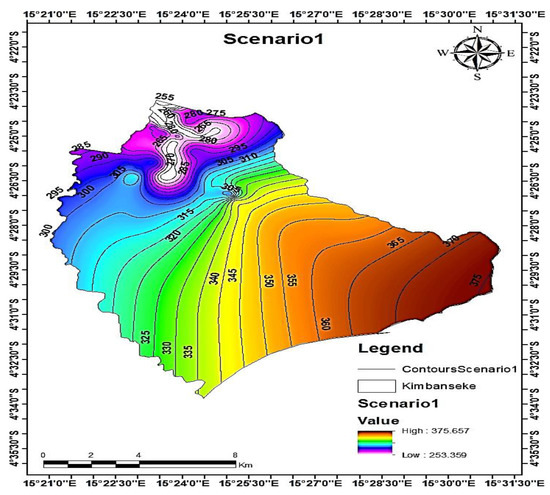
Figure 19.
Scenario 1.
3.4.3. Borehole’s Assessment Scenario 2
If the consumption rate increases by 30% for the 5-year modelling of consumption (i.e., from 2015 to 2020), an average reduction of around 1.131 m in groundwater levels was detected, as shown in Figure 20 below.
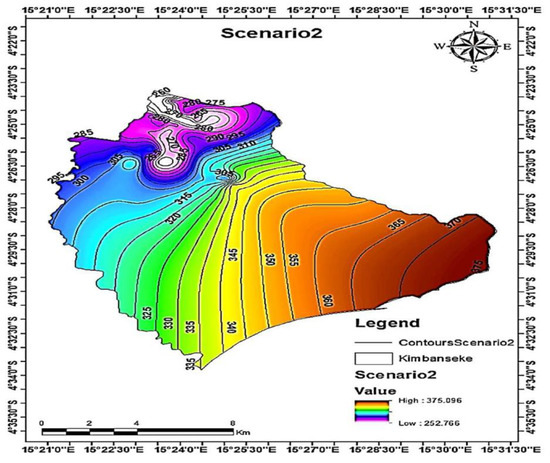
Figure 20.
Scenario 2.
3.4.4. Borehole’s Assessment Scenario 3
The simulation result of scenario 3 indicates a 2.267 m decrease in groundwater level from the control or baseline information, in which the initial groundwater level was 376,227 and 253,925 m for the maximum and minimum, respectively. From Figure 21, the 60% groundwater pumping rate resulted in the increase of water level to 375.096 m for the maximum and 252.766 m for the minimum, giving that difference of 2.267 m, as shown in Figure 21 below.
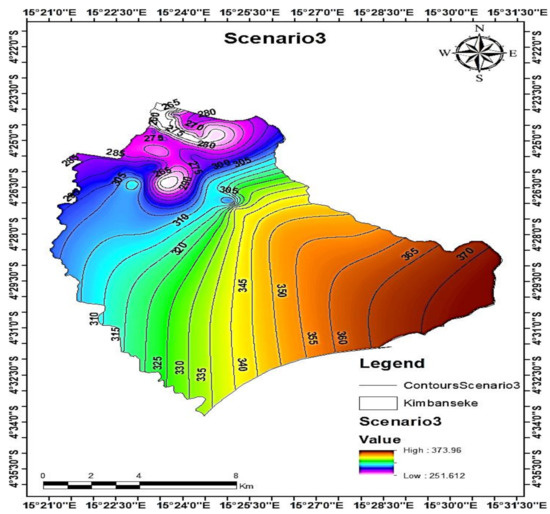
Figure 21.
Scenario 3.
Table 4 shows the determined predicted groundwater fluctuations resulting from the increase of the pumping rate from zero to 15%, 30% and 60% in GIS, respectively, with related standard deviations varied from zero to 0.57 m, 1.131 m and 2.267 m.
Table 4.
Pumping scenario.
3.5. Groundwater Flow Direction Map
To evaluate groundwater flow direction, the generated and assessed results in ArcGIS were exported and analysed in Surfer 16. The flow regime of the groundwater, its geomorphology-induced surface drainage system, as observed by some authors, e.g., [49], is compatible with the observed/predicted groundwater flow regime and the geomorphology-induced surface drainage system of the study area. Furthermore, groundwater flows primarily northward from the southern highlands, where the Congo River is located, as can be seen in Figure 22 below.
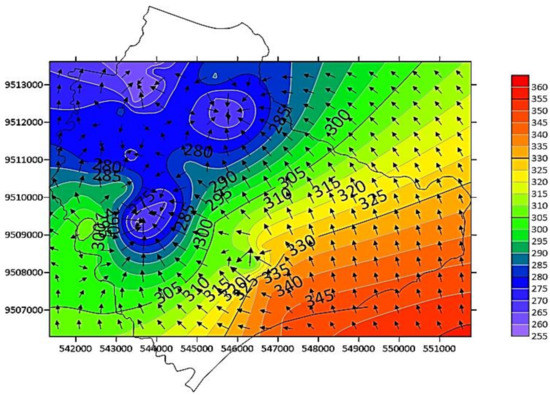
Figure 22.
Groundwater production map.
Additionally, from the hydrological concept, water flows from higher potential energy (elevations) to lower potential energy (elevations) and in reference to Figure 22 (the map illustrates where most of the groundwater is situated), which is highlighted by the blue part. Thus, this can also serve as a guiding tool or advice for the community and policy makers regarding where to drill and conserve the land. However, it does not imply that there is no groundwater potential in other parts. For instance, for the area highlighted in red, deeper drilling would be required compared to the blue parts.
3.6. Implementation of the App
Figure 23 shows the high-level implementation design of the mobile app which distinguishes between two user types: “general public” and “professionals”. The ability to do accurate borehole measurement, analysis and interpretation is the main difference between these two user categories. Users can see all the data collection fields available. Users who have registered as professionals will be able to capture all fields, but basic public users will only be able to submit data by going through a selection list that must be filled.
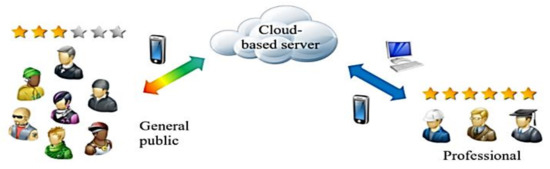
Figure 23.
App Implementation.
With regards to the app interface features, Figure 24a–f below shows the running procedure of the app from a smart/mobile phone.
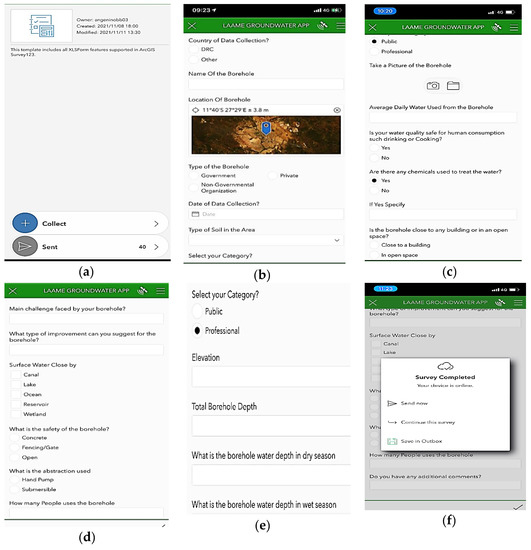
Figure 24.
(a–f) Running procedure of the developed app on a mobile phone. (Source: Authors).
The mobile phone app was tested using Kimbanseke available boreholes data that added up to 39, analysis was performed, and the map was generated illustrating the location of each borehole. Professionals, on the other hand, can export the submitted data in a preferable format such as CSV, Excel, KML, shapefile and file Geodatabase among others. The exported data from the laptop can be processed to conduct further analysis, data stored for future research and investigations. Figure 25 and Figure 26 below shows a list of collected data and the generated map achieved in the app.
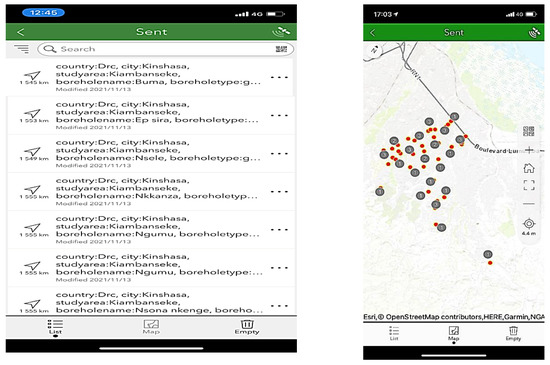
Figure 25.
User Interface. (Source: Authors).
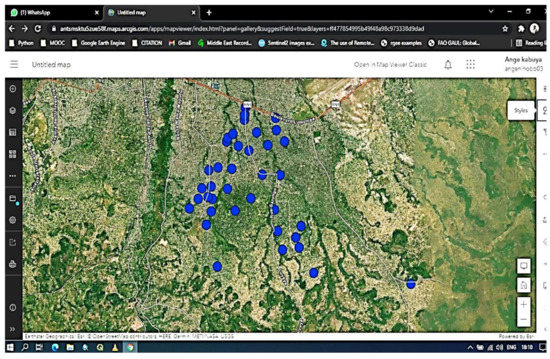
Figure 26.
Map generated using qGis (Professional interface). (Source: Authors).
Furthermore, the professional interface also has statistical features such as bar chart and pie chart that summarise the collection process of data: for example, which country used the app recently, or which questions were answered the most, etc. The app includes a feature that allows users to verify each other’s information. With registrations, each user is given a user rating and a one-star rating. The star rating of a particular user rises because of many verifications.
The challenge with a borehole is that special equipment is required for measurement. The public, however, can obtain the GPS locations, take a photo and answer some basic questions in the form of a selection list or comment. Furthermore, this aligns public awareness framework, engaging population into decision-making, educating them of environmental issues and implementing them into the engineering world. Moreover, this will promote successful citizen science (see Figure 27); as such, together we can overcome global groundwater challenges by monitoring them regularly, by contributing positively to the future management of water resources, as well as land management. Finally, such information will empower citizens, allowing them to address local districts and stakeholders, and from there, further analysis/decision might be taken.
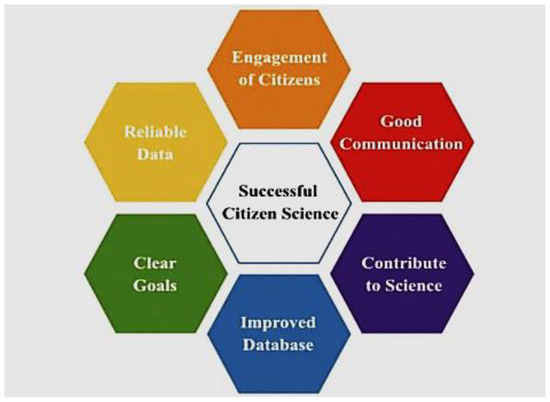
Figure 27.
Successful citizen engagement.
4. Conclusions and Recommendations
The approach to this study aids in the review of the Congo River basin. It focuses, to some extent, on the delineation of the Kimbanseke catchment, its geology, hydrology, hydrogeological conditions, topography, formations, soil types, as well as understanding the catchment’s water bearing capacity. Thus, this approach was deemed suitable to enable the understanding and analyzing of the Kimbanseke catchment muddled with the impact of urbanization on groundwater. It also provided solutions by designing and implementing an app to monitor groundwater in the capital city (Kinshasa), as well as engaging citizens in the decision-making process. The GIS tool was used to compile spatial analysis by producing maps such as LU/LC Map, description of the Kimbanseke area, which then aided in the development of a conceptual geological model. Additionally, Rockworks 16 was used in terms of the processes that influence groundwater movement and storage. It is necessary to note that the design of this 3D aquifer model allowed us to determine the extension and geometry of each sedimentary unit, indicating that the aquifer system of the Kimbanseke is made up of a system of multilayered aquifers subdivided into separate aquifer units by aquitards of sandy clay or clay sand, as well as polymorphic sandstone. Furthermore, the results of the four scenarios simulated by increasing groundwater pumping rates by 15, 30 and 60%, with 0% as control information or baseline information, considered as the beginning scenario, showed a further reduction in water subterranean levels of 0.57, 1.131 and 2.267 m, respectively. These findings suggest that if the pumping rate is increased by 60%, the volume of water stored in the Kimbanseke region’s aquifer system will fall by 2.267 m compared to the groundwater level simulated from 2015 to 2020. Surfer 16 was used to generate the groundwater flow direction from exporting the pumping scenario from GIS which serves as a guiding tool to policy makers. Lastly, the app was designed using the ArcGIS AppStudio and tested on the Kimbanseke catchment where a map of the 39 boreholes was generated.
The advantages of using information and communications technology, as it makes use of the Internet of Things in real time, is limitless. For example, 3D innovation can deal with substantial informational indexes. It is current and stylish and is a cutting-edge data-gathering system for use by groundwater user clients or groundwater specialist organizations. Furthermore, the system provides real-time updates and early warning signals to groundwater management. The innovative element of technology’s primary output and potential commercial value is that they will contribute to new knowledge in the development of a groundwater sustainability framework that supports an ICT improved groundwater monitoring system. The sustainability framework uses physical and subjective techniques, and the sustainability framework/index evaluates variables easily. The solution takes the form of a generic early warning system (EWS) consisting of four components: namely, (1) gathering the risk knowledge; (2) monitoring and predicting the situation; (3) communicating the warning messages; and (4) responding to the warning. The research aim was, therefore, to develop an app to improve our understanding of groundwater based hydrological and ecosystem processes that will enable efficient management and decision-making in groundwater resources management. The plan and methodology are bolstered by Android innovation and Java programming. Man-made consciousness (such as AI) was used to depict the figuring worldview of an ICT-based framework, whose arrangements mirror human learning, recognition and dissuading the point of taking care of complex issues. Going forward, two primary AI procedures that influence everything in this groundwater monitoring framework, ANNs and canny specialists, were used.
Based on the findings of this study, several recommendations have been suggested, some of which include the following: (1) To avoid production wells interfering with groundwater mining and pumps draining will require the development of a guideline for water well owners to keep the pumping rate within specified limits, operating at an enforced level based on the outcomes of scenarios found in Table 4. (2) Create and implement source protection plans based on watersheds. (3) The government of the Democratic Republic of Congo should consider implementing a policy to install piezometers to track the changes in the groundwater regime. (4) Create a national water policy, sectoral water strategies and legal requirements. (5) Establish a field monitoring program to ensure that Water, Sanitation and Hygiene (WASH) actors in humanitarian projects urgently adhere to drinking water standards. (6) Develop and conduct pilot initiatives to promote rainwater harvesting systems to individuals and communities. Such initiatives should result in finding practical rainwater collection techniques—for both rural and urban regions—to assist in meeting home water consumption needs such as irrigation of small household plots. The pilot project can also include components for training and public awareness to highlight and spread information on the country’s untapped rainwater collection potential.
The yearning for a better life has resulted in tremendous population growth in Kimbanseke. Rapid uncontrolled urbanization, with noticeable changes in land use/land cover and high demand for drinking water, are some of the results of this rapid population expansion. The National Water Supply Company, REGIDESO, has failed to anticipate and prepare for the increased demand of water in Kimbanseke. This might have been because of inadequate monitoring of resources such as groundwater. Groundwater is perceived as a potential solution to this water shortage. However, unmanaged groundwater exploitation causes aquifer depletion and climate change may exacerbate the situation. Thus, a monitoring app called LAAME groundwater was necessary to assist with monitor groundwater in DRC and globally.
Author Contributions
A.K.K., R.A. and G.K.N. contributed to conceptualization, methodology, validation, formal analysis, and writing—original draft preparation. All authors have read and agreed to the published version of the manuscript.
Funding
This research was funded by University of Johannesburg and HCI foundation. The APC was funded by University of Johannesburg.
Data Availability Statement
Acknowledgments
The authors would like to express their deep and sincere gratitude to Kabila Wa Ngoie, Production Manager and Electromechanical Engineer for allowing data for this study to be collected at the Regideso and Patchen. They are also indebted to HCI foundation for financially supporting the research. Finally, many thanks to the University of Johannesburg for all the support rendered during the study.
Conflicts of Interest
The authors declare no conflict of interest.
Appendix A

Figure A1.
Daily yield on Kimbanseke for July.
Figure A1.
Daily yield on Kimbanseke for July.

Appendix B

Figure A2.
Daily yield on Kimbanseke for August.
Figure A2.
Daily yield on Kimbanseke for August.

Appendix C

Figure A3.
Borehole data.
Figure A3.
Borehole data.

References
- Xiaolan, T.; Adesina, J.A. Integrated Watershed Management Framework and Groundwater Resources in Africa—A Review of West Africa Sub-region. Water 2022, 14, 288. [Google Scholar]
- Clement, T.; Johnson, C.D.; Sun, Y.; Klecka, G.M.; Bartlett, C. Natural attenuation of chlorinated ethene compounds: Model development and field-scale application at the Dover site. J. Contam. Hydrol. 2000, 42, 113–140. [Google Scholar] [CrossRef]
- Malembaka, E.B. Measuring and Understanding Individual and Community Health Status in Eastern Democratic Republic of Congo from a Person-Centered Perspective. Doctoral Dissertation, Université Catholique de Louvain, Ottignies-Louvain-la-Neuve, Belgium, 2021. [Google Scholar]
- Kasargod, C.; Barker, B.; Bayles, M.; Porter, G.F. Catch Me if You Can! Heart Lung Circ. 2016, 25, S24–S25. [Google Scholar] [CrossRef][Green Version]
- Swatuk, L.A. Water for agriculture. In Handbook of Critical Agrarian Studies; Edward Elgar Publishing: Cheltenham, UK, 2021. [Google Scholar]
- Zhou, Z.; Cartwright, I. Using geochemistry to identify and quantify the sources, distribution, and fluxes of baseflow to an intermittent river impacted by climate change: The upper Wimmera River, southeast Australia. Sci. Total Environ. 2021, 801, 149725. [Google Scholar] [CrossRef]
- Pramita, A.W.; Syafrudin, S.; Sugianto, D.N. Effect of seawater intrusion on groundwater in the Demak coastal area Indonesia: A review. IOP Conf. Ser. Earth Environ. Sci. 2021, 896, 012070. [Google Scholar] [CrossRef]
- De Fraiture, C.; Wichelns, D. Satisfying future water demands for agriculture. Agric. Water Manag. 2010, 97, 502–511. [Google Scholar] [CrossRef]
- Lam, Q.; Meon, G.; Pätsch, M. Coupled modelling approach to assess effects of climate change on a coastal groundwater system. Groundw. Sustain. Dev. 2021, 14, 100633. [Google Scholar] [CrossRef]
- Jarvis, T.; Wiley, J. Collective Aquifer Governance: Dispute Prevention for Groundwater and Aquifers through Unitization; Cambridge University Press: Cambridge, UK, 2022. [Google Scholar]
- Cao, T.; Han, D.; Song, X. Past, present, and future of global seawater intrusion research: A bibliometric analysis. J. Hydrol. 2021, 603, 126844. [Google Scholar] [CrossRef]
- Yang, J.; Liu, K.; Wang, Z.; Du, Y.; Zhang, J. Water-Saving and High-Yielding Irrigation for Lowland Rice by Controlling Limiting Values of Soil Water Potential. J. Integr. Plant Biol. 2007, 49, 1445–1454. [Google Scholar] [CrossRef]
- Cripps, C.; Kehinde, M.; Lewis, M.; Garcia-Bajo, M.; Panteleit, B.; Seiter, K. Application Theme 4–Regulatory Support. In Applied Multidimensional Geological Modeling: Informing Sustainable Human Interactions with the Shallow Subsurface; Wiley: Hoboken, NJ, USA, 2021; pp. 501–517. [Google Scholar]
- MacDonald, A.M.; Bonsor, H.C.; Dochartaigh, B.É.Ó.; Taylor, R.G. Quantitative Maps of Groundwater Resources in Africa. Environ. Res. Lett. 2012, 7, 024009. [Google Scholar] [CrossRef]
- Mohan, S.; Kuipally, N. Groundwater and Conjunctive Use Management. In Handbook of Water Resources Management: Discourses, Concepts and Examples; Springer: Cham, Switzerland, 2021; pp. 735–775. [Google Scholar]
- Bagheri-Gavkosh, M.; Hosseini, S.M.; Ataie-Ashtiani, B.; Sohani, Y.; Ebrahimian, H.; Morovat, F.; Ashrafi, S. Land subsidence: A global challenge. Sci. Total Environ. 2021, 778, 146193. [Google Scholar] [CrossRef] [PubMed]
- Oke, S.A.; Alowo, R.; Masinde, M. Using Internet of Things for sustainable groundwater drought management in the Modder River catchment of South Africa. In Proceedings of the 2019 Open Innovations (OI), Cape Town, South Africa, 2–4 October 2019; pp. 63–70. [Google Scholar] [CrossRef]
- Van Ginkel, M.; Biradar, C. Drought Early Warning in Agri-Food Systems. Climate 2021, 9, 134. [Google Scholar] [CrossRef]
- Bavaresco, M.V.; Ghisi, E.; D’Oca, S.; Pisello, A.L. Triggering occupant behaviour for energy sustainability: Exploring subjective and comfort-related drivers in Brazilian offices. Energy Res. Soc. Sci. 2021, 74, 101959. [Google Scholar] [CrossRef]
- Smith, L.; Ibn-Mohammed, T.; Reaney, I.M.; Koh, S.C.L. A Chemical Element Sustainability Index. Resour. Conserv. Recycl. 2020, 166, 105317. [Google Scholar] [CrossRef]
- Masinde, E.M. ITIKI: Bridge between African Indigenous Knowledge and Modern Science on Drought Prediction. Doctoral Dissertation, University of Cape Town, Cape Town, South Africa, 2012. [Google Scholar]
- Masinde, M.; Mwagha, M.; Tadesse, T. Downscaling Africa’s Drought Forecasts through Integration of Indigenous and Scientific Drought Forecasts Using Fuzzy Cognitive Maps. Geosciences 2018, 8, 135. [Google Scholar] [CrossRef]
- Behera, J.K. Digital Transformation and Its Impact: An Analytical Study. In Digitization of Economy and Society; Apple Academic Press: Candor, NY, USA, 2021; pp. 27–49. [Google Scholar] [CrossRef]
- Mvulirwenande, S.; When, U. Promoting Smart Water Systems in Developing Countries through Innovation Partnerships: Evidence from VIA Water-Supported Projects in Africa. In ICT for Smart Water Systems: Measurements and Data Science; Springer: Cham, Switzerland, 2019; pp. 167–207. [Google Scholar]
- Sinha, B.B.; Dhanalakshmi, R. Recent advancements and challenges of Internet of Things in smart agriculture: A survey. Futur. Gener. Comput. Syst. 2021, 126, 169–184. [Google Scholar] [CrossRef]
- Kumar, M.; Sharma, A.; Tabhani, N.; Otaki, Y. Indoor water end-use pattern and its prospective determinants in the twin cities of Gujarat, India: Enabling targeted urban water management strategies. J. Environ. Manag. 2021, 288, 112403. [Google Scholar] [CrossRef]
- Caceres, N.; Wideberg, J.; Benitez, F. Deriving origin–destination data from a mobile phone network. IET Intell. Transp. Syst. 2007, 1, 15–26. [Google Scholar] [CrossRef]
- Boulos, M.N.K.; Wheeler, S. The emerging Web 2.0 social software: An enabling suite of sociable technologies in health and health care education. Health Inf. Libr. J. 2007, 24, 2–23. [Google Scholar] [CrossRef]
- Mishra, P.; Suresh, Y. Datafied body projects in India: Femtech and the rise of reproductive surveillance in the digital era. Asian J. Women’s Stud. 2021, 27, 597–606. [Google Scholar] [CrossRef]
- Wolff, E.; French, M.; Ilhamsyah, N.; Sawailau, M.J.; Ramírez-Lovering, D. Collaborating with Communities: Citizen Science Flood Monitoring in Urban Informal Settlements. arXiv 2021, arXiv:2112.07128. [Google Scholar] [CrossRef]
- Heinz, D.; Hunke, F.; Breitschopf, G.F. Organizing for Digital Innovation and Transformation: Bridging between Organizational Resilience and Innovation Management. In Proceedings of the 16th International Conference on Wirtschaftsinformatik (WI), Essen, Germany, 9–11 March 2021; pp. 548–564. [Google Scholar] [CrossRef]
- Tshimanga, R.M.; Hughes, D.A. Basin-scale performance of a semidistributed rainfall-runoff model for hydrological predictions and water resources assessment of large rivers: The Congo River. Water Resour. Res. 2014, 50, 1174–1188. [Google Scholar] [CrossRef]
- Marivoet, W. Decentralizing the challenges of poverty reduction in the DRC. Perspectives 2002, 6, 185. [Google Scholar]
- Kapembo, M.L.; Mukeba, F.B.; Sivalingam, P.; Mukoko, J.B.; Bokolo, M.K.; Mulaji, C.K.; Mpiana, P.T.; Poté, J.W. Survey of water supply and assessment of groundwater quality in the suburban communes of Selembao and Kimbanseke, Kinshasa in Democratic Republic of the Congo. Sustain. Water Resour. Manag. 2021, 8, 1–13. [Google Scholar] [CrossRef]
- Yang, B.; Usman, M. Do industrialization, economic growth and globalization processes influence the ecological footprint and healthcare expenditures? Fresh insights based on the STIRPAT model for countries with the highest healthcare expenditures. Sustain. Prod. Consum. 2021, 28, 893–910. [Google Scholar] [CrossRef]
- Candido, L.A.; Coêlho, G.A.G.; de Moraes, M.M.G.A.; Florêncio, L. Review of Decision Support Systems and Allocation Models for Integrated Water Resources Management Focusing on Joint Water Quantity-Quality. J. Water Resour. Plan. Manag. 2022, 148, 03121001. [Google Scholar] [CrossRef]
- Varma, K.; Srivastava, V.; Singhal, A.; Jha, P.K. Urban and Environmental Hazards. In Recent Technologies for Disaster Management and Risk Reduction; Springer: Cham, Switzerland, 2021; pp. 319–362. [Google Scholar]
- Cedrick, M.M.; Alexander, A.; Nobert, J.; Mbudi, C.N. Modeling groundwater flow under chaotic urbanization constraints in Kinshasa Capital Region (D.R. Congo). Phys. Chem. Earth Parts A/B/C 2021, 124, 102985. [Google Scholar] [CrossRef]
- Ilito-Boozi, J.-P.; Moretto, L. Motivations to Co-produce Water, Hygiene and Sanitation Services in the Peri-urban Area of Kinshasa. In African Cities through Local Eyes; Springer: Cham, Switzerland, 2021; pp. 265–286. [Google Scholar] [CrossRef]
- Xinhua, M.; Youxiang, Q. On the vegatative measures of soil and water conservation in the Loess Plateau. Sci. Soil Water Conserv. 2007, 4, 112. [Google Scholar]
- Paepae, T.; Bokoro, P.N.; Kyamakya, K. From Fully Physical to Virtual Sensing for Water Quality Assessment: A Comprehensive Review of the Relevant State-of-the-Art. Sensors 2021, 21, 6971. [Google Scholar] [CrossRef]
- Mulhern, R.; Grubbs, B.; Gray, K.; Gibson, J.M. User experience of point-of-use water treatment for private wells in North Carolina: Implications for outreach and well stewardship. Sci. Total, Environ. 2021, 806, 150448. [Google Scholar] [CrossRef]
- Palomares, I.; Martínez-Cámara, E.; Montes, R.; García-Moral, P.; Chiachio, M.; Chiachio, J.; Alonso, S.; Melero, F.J.; Molina, D.; Fernández, B.; et al. A panoramic view and swot analysis of artificial intelligence for achieving the sustainable development goals by 2030: Progress and prospects. Appl. Intell. 2021, 51, 6497–6527. [Google Scholar] [CrossRef] [PubMed]
- Nyero, E. Water Footprint: Application of Different Methods to the Case Study of the Beneficiation Process of Manganese Ores. Master’s Thesis, Politecnico Di Milano, Milan, Italy, 28 April 2021. [Google Scholar]
- Atkinson, D. Preparing for the worst: South African municipalities’ readiness to manage disasters related to potential shale gas mining. Int. J. Disaster Risk Reduct. 2021, 65, 102537. [Google Scholar] [CrossRef]
- IPCC. Climate Change 2014: Synthesis Report. Contribution of Working Groups I, II and III to the Fifth Assessment Report of the Intergovernmental Panel on Climate Change. Intergovernmental Panel on Climate Change, Geneva, Switzerland. 2014. Available online: https://www.ipcc.ch/report/ar5/syr/ (accessed on 26 January 2022).
- William, J.K.M.; Ponmani, S.; Samuel, R.; Nagarajan, R.; Sangwai, J.S. Effect of CuO and ZnO nanofluids in xanthan gum on thermal, electrical and high-pressure rheology of water-based drilling fluids. J. Pet. Sci. Eng. 2014, 117, 15–27. [Google Scholar] [CrossRef]
- Partow, H. Water Issues in the Democratic Republic of the Congo and Challenges and Opportunities. Appl. Theme Regul. Support 2011, 11, 501–517. [Google Scholar]
- Lateef, F. Post exercise ice water immersion: Is it a form of active recovery? J. Emergencies Trauma Shock 2010, 3, 302. [Google Scholar] [CrossRef]


Publisher’s Note: MDPI stays neutral with regard to jurisdictional claims in published maps and institutional affiliations. |
© 2022 by the authors. Licensee MDPI, Basel, Switzerland. This article is an open access article distributed under the terms and conditions of the Creative Commons Attribution (CC BY) license (https://creativecommons.org/licenses/by/4.0/).