Article

Numerical Investigation of the Hydrodynamic Characteristics of 3-Fin Surfboard Configurations

1
School of Engineering, Deakin University, Geelong 3216, Australia
2
Centre for Sport Research, Deakin University, Geelong 3216, Australia
*
Author to whom correspondence should be addressed.
Appl. Sci. 2022, 12(7), 3297; https://doi.org/10.3390/app12073297
Submission received: 17 February 2022 / Revised: 21 March 2022 / Accepted: 22 March 2022 / Published: 24 March 2022
(This article belongs to the Special Issue Sports Fluid Mechanics)

Abstract

:

Featured Application

This study builds on the fundamental understanding of surfboard fin design. This research identifies quantitative performance differences between the fin parameters used by surfers. These results aim to help both fin designers and surfers tailor fin choices to specific surfing styles/waves.

Abstract

Surfing is a popular sport, with the associated market forecast to reach 2.6 billion US dollars by 2027. In the published literature, there is a range of investigations into the performance of surfboard fins. Some studies model a single fin or review the performance of different fin layouts and surface designs. However, the effects of individual fin design features on flow dynamics are not well understood. This study provides numerical analysis into the thruster fin aspects (rake, depth, and base length) and resultant key performance indicators (i) lift and drag coefficients, and (ii) turbulent kinetic energy. The models were simulated in Ansys Fluent R19.1, solving steady Reynolds-averaged Navier–Stokes equations using the SST k−ω turbulence model at a velocity of 7 m/s. The results indicate the performance of fins varies more post-stall. The variations in rake showed the biggest impact on the turbulence intensity at an angle ≥20°. The variations in base length exhibited coefficient trends with greater lift at small angles but significant lift losses at high angles of attack. The variations in depth affected the forces on the fins rather than the performance indicators. Based on these simulations, a proposed fin set was developed that presented the lowest lift losses after the stall point.

1. Introduction

Surfboard fins are one of the major performance drivers in modern surfing. Their performance relies on their construction material and the fin template (outline) used. In recent years, fin companies have worked closely with professional surfers and surfboard shapers to test different designs and gain a competitive edge. A variety of different fins on the market is convenient for those who can trial different fins, but it makes it difficult for the average surfer to determine the differences between sets based exclusively on opinions and promotional content.
In the past 20 years, computational fluid dynamics (CFD) has become an advanced tool used in many sports, including surfing. An early study by Lavery et al. presented a comparison of the drag forces from filleted and un-filleted board connections [1]. This study uses a laminar flow model to find the fin drag. Despite producing similar trends to turbulent models, Lavery et al. recognised this model under-predicts drag forces due to slower velocity conditions. More recent studies use steady Reynolds-averaged Navier–Stokes (RANS) equations to solve the flow. A study by El-Atm et al. is the first to present multiple fins simulated using a turbulence model [2]. This study compared the performance of three- and four-fin configurations. The CFD simulations utilised the k-ε turbulence model to solve flow across the angles of attack (AOA) 0 to 45°. The results presented used the lift and drag coefficients to identify significant performance differences between the configurations and linked these coefficients to surfing terminology. It found the three-fin configuration to be more beneficial in regular surfing, stating higher lift would provide greater manoeuvrability, while the four-fin configuration would be more suited to big-wave surfing, where stability is the focus.
Recent studies have refined both the computer-aided design (CAD) models and CFD methods to accurately represent real-world parameters. A study from Falk et al. assessed a typical thruster fin configuration in detail [3]. This study reviewed the performance of all three fins individually and as a system. The simulation uses the k-ω shear-stress transport (SST) turbulence model to solve a flow of 5 m/s across the fins at 0 to 45°. A similar study from Falk et al. investigated the fin positioning of a four-fin configuration using a similar k-ω SST turbulence model [4]. Both these studies investigated not only steady-state flow but also presented transient flow field data, identifying vortex shedding phenomena at high angles and the wake interaction between fins.
There are limited studies where experimental data are used to validate CFD results; the only two experimental studies to the authors’ knowledge have been on single fins due to size, speed, and lab limitations with appropriate flumes. MacNeill presented the lift and drag force measurements from flow tank testing on various bio-inspired fin designs [5]. The predicted CFD results show less variation between templates compared to the experimental data; however, both datasets produced similar trends for lift and drag. Brander and Walker also studied the effect of the Reynolds number on the lift and drag coefficients of a simplified fin using cavitation tunnel testing [6]. The fin template in this study was adopted into CFD simulation by Sakellariou, Rana, and Jenkins [7]. These CFD simulations produced lift and drag coefficient trends that closely match with the experimental results presented by Brandner and Walker at small AOAs. Due to the variety of fin profiles used in the literature, the results from studies often have different coefficient magnitudes but similar trends. Many of the recent numerical studies have used a combination of these experimental results and other numerical studies to validate their results by recognising the similarities in lift and drag trends across multiple AOAs [2,3,4].
To date, there is no numerical investigation into thruster fin parameters and how these design variations can relate to surfing performance measures. This study is the first to present the performance impacts of three specific fin design parameters (rake, depth, and base length) as well as using mixed fin designs on the surfboard. This study aimed at quantitatively outlining the performance impacts of fin parameters using the lift and drag coefficients and used the turbulent kinetic energy of the wake region to identify the effects on the flow interactions between fins. The next stage of this research uses the numerical results to provide a design direction and produce an optimised fin set for a chosen wave condition. The objective is to obtain performance improvements in fundamental surfing manoeuvres performed in the chosen wave conditions.

2. Materials and Methods
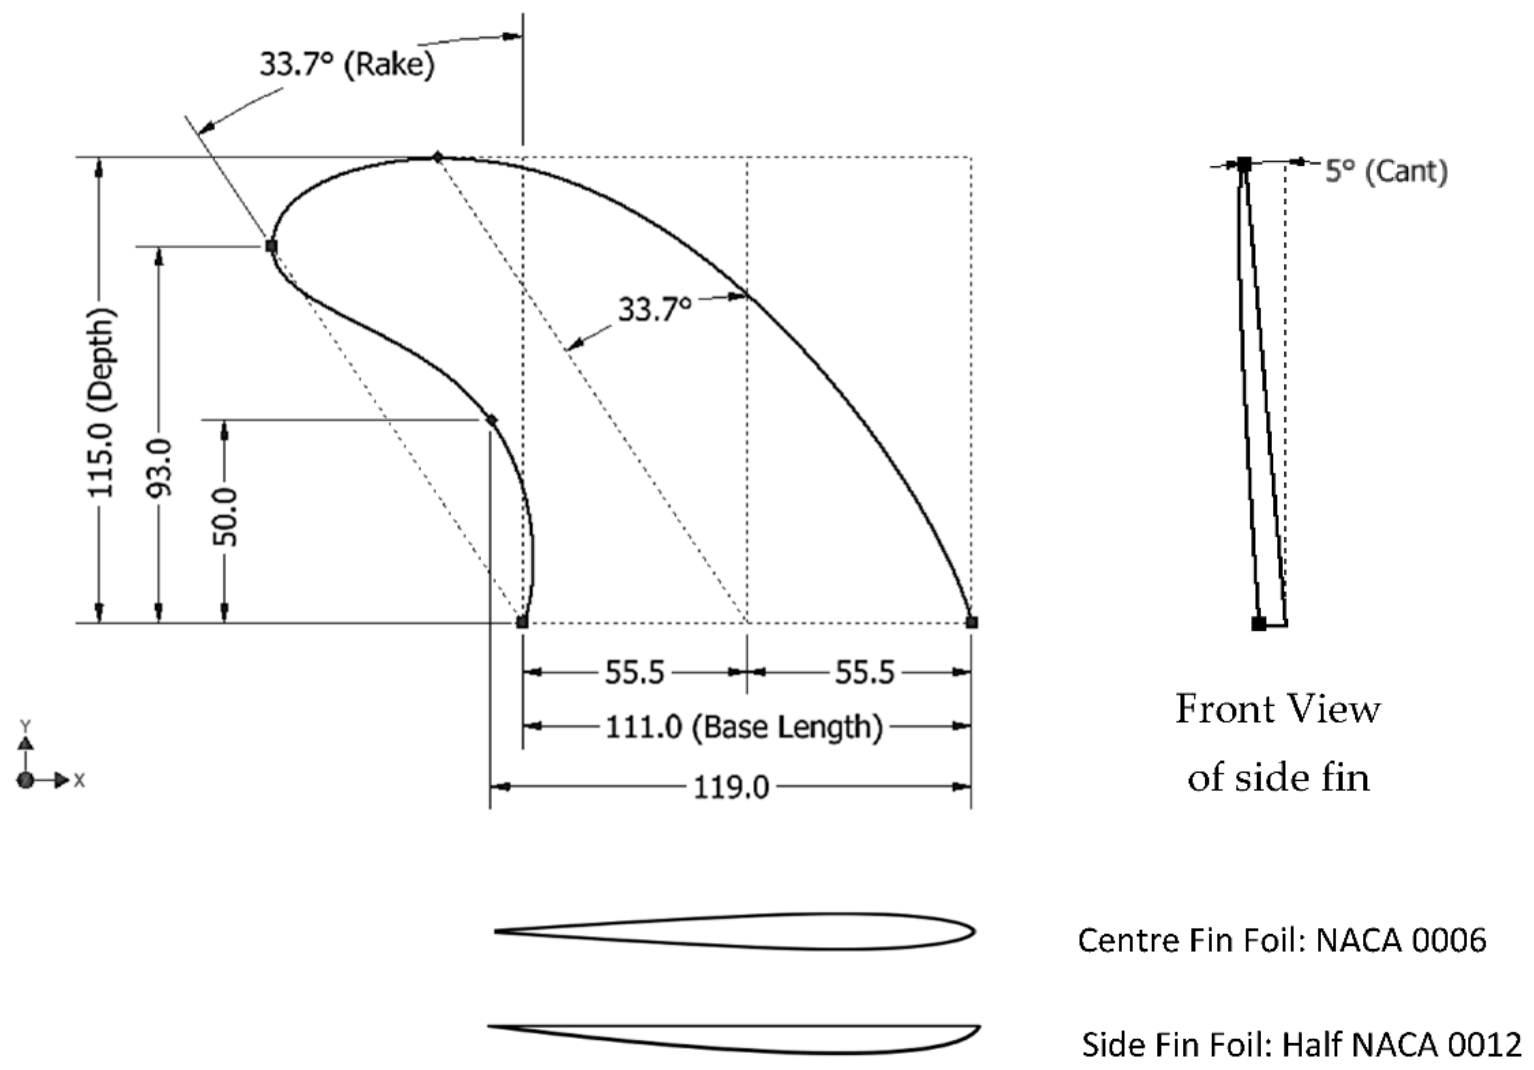
2.1. Fin Design

To ensure all simulations are comparable, a baseline fin template was produced. This neutral template will mimic a popular commercial fin, which is described as having all-rounded and balanced performance [8]. Normally produced using injection moulding, these fins can be produced using other means, such as additive manufacturing [9] or hand shaping. This baseline fin has a rake of 33.7°, a depth of 115 mm, a base length of 111 mm, and a cant of 5° (Figure 1). Autodesk Inventor 2020 was used to produce the CAD models.
Each of the parameters in this study (rake, depth, base length) had a large and small template simulated. In total, seven fin templates were simulated (one baseline + three parameters × two variations). The only dimensional change between each template and the baseline design is the named parameter. The change for these maximum and minimum templates was: 37° and 28° for the rake, 121 mm and 105 mm for the depth, 119 mm and 100 mm for the base length, listed in Table 1. Each of these dimensions is the maximum and minimum values listed in the thruster fin product range of a commercial fin manufacturer [8].

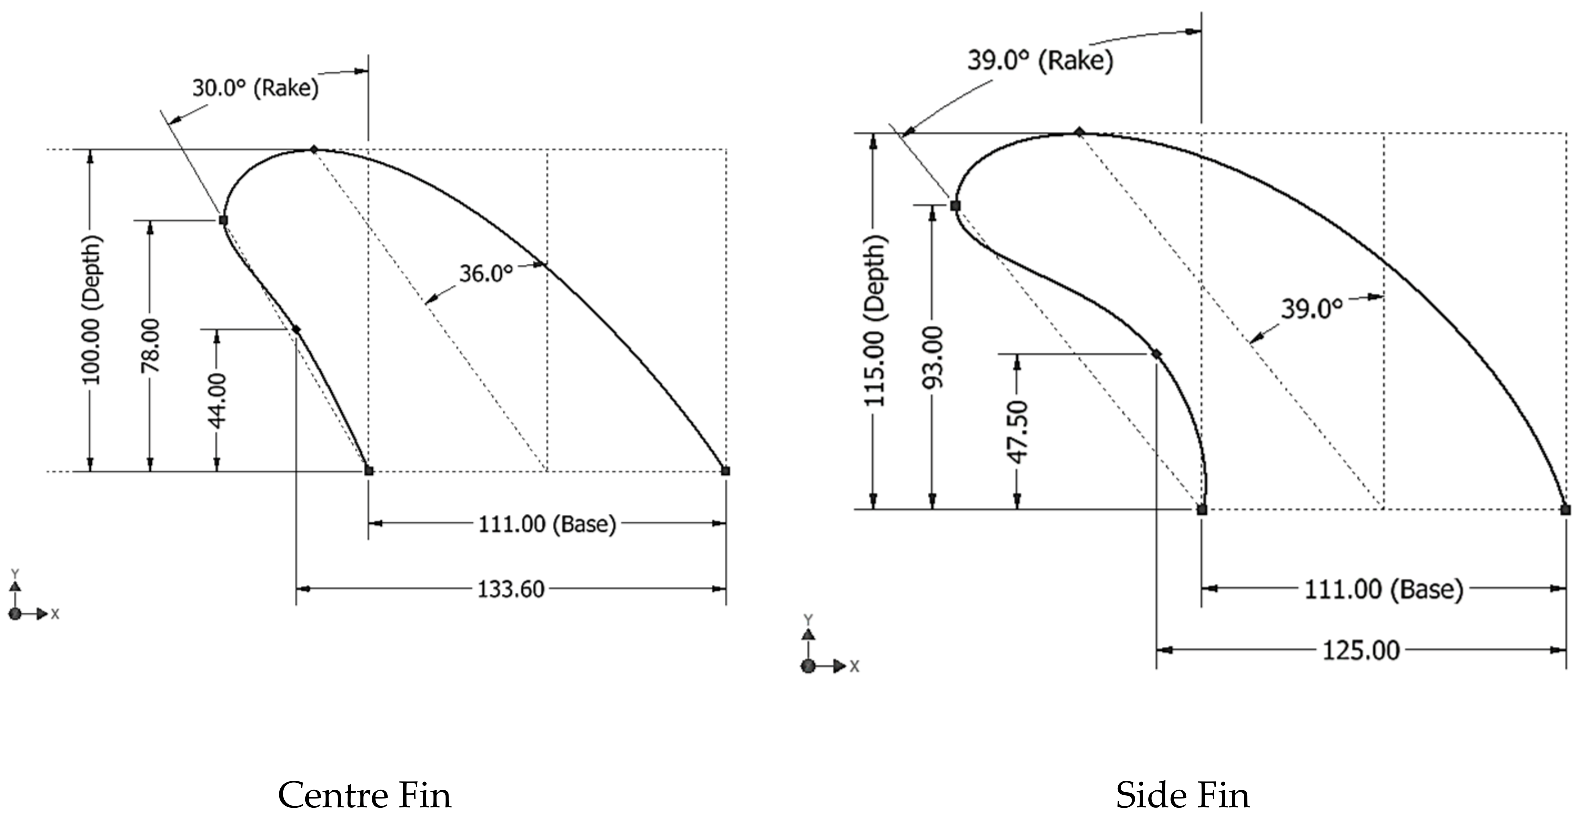
2.2. Optimised Design (Wave Condition)

The optimised fin was designed for surfing the reef break known as Winkipop in Victoria, Australia. This wave is a fast-breaking, 400-m-long, right-handed point break. The wave will break at most swell sizes (0.6–6.1 m). However, this study nominated a swell size of approximately 1–1.5 m. At this height, the wave is optimal for intermediate to advanced surfers [10]. The most common manoeuvres surfers perform on waves such as these include high speed carves and cutbacks. These manoeuvres involve surfers drawing wide arcs on the face, focusing on driving through the turn and maintaining speed down the line. The fin designs preferable for this style of surfing are stable at high angles when the surfer is applying large forces to the board. The geometry developed for this proposed condition is shown in Figure 2 and is designed from the results of the template comparison shown below.

2.3. Numerical Methods
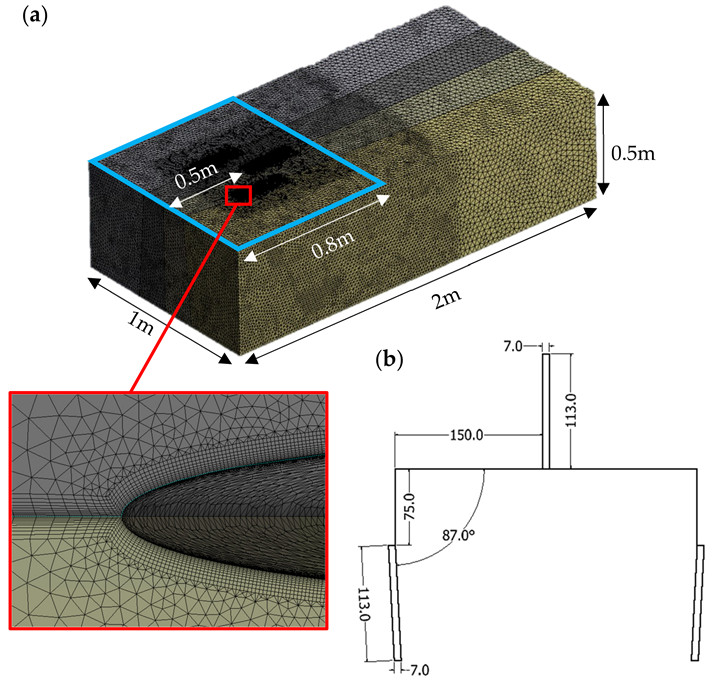
The ANSYS R19.1 Fluent simulation software was used for all CFD simulations. These simulations were solved at an angle of attack (AOA) of 0, 5, 10, 15, 20, 30, and 45° to simulate the various stages of a critical turn on a surfboard. For all simulations, the steady RANS equations have been solved using the two-equation k-ω SST turbulence model. The COUPLED algorithm was used for pressure–velocity coupling with second-order discretisation schemes, and all residuals were set at 1 × 10⁻³.
The lift and drag forces on the solid fin surfaces were computed from the simulation. The lift forces were taken perpendicular to fluid flow and the fin surface, whilst the drag forces were calculated parallel to flow direction (Figure 3b). These forces were then converted to dimensionless coefficients, C L and C D , respectively,
C L = L 1 2 · ρ · v 2 · A
C D = D 1 2 · ρ · v 2 · A
where L and D are the lift and drag, respectively, ρ is the density, ν is the free stream velocity, and A is the reference surface area (total plan area of the 3 fins; see Table 1), as seen in airfoil theory [11]. To create a profile of the fin’s performance through a turn, the coefficients were graphed against the AOA.

2.4. Fluid Domain

Figure 3a displays the 2 m × 0.5 m × 1 m rectangular domain used for the simulations and is a similar domain to those used in previous studies [1,2,3,4,7]. A domain of this size includes all details of the flow and wake whilst maintaining minimal computational power. Within this domain, the fins were set on a 1 m × 2 m face with spacing to mimic the plugs of a standard performance surfboard, with the side fins having a toe angle of 3° (Figure 3b). The fins were placed with the centre fin 0.5 m from the inlet. The domain was set to have double inlets/outlets to avoid changing the mesh across different cases. The face closest to the leading edge and one of the lateral faces was set as the velocity inlets and the trailing edge face and the opposite lateral face were set as pressure outlets. The velocity was then set using the components in the x and z directions to reproduce the AOAs on the fins and remove any pressure gradients on the domain’s lateral faces. The fin walls were set to no-slip conditions, as was the 1 m × 0.8 m blue area around the fin plugs in Figure 3a. This area generates the boundary layer influence from the “surfboard” the fins are attached to. A surfboard shape would change how the flow approaches the fins as concaves and tail shapes affect the flow, as seen in studies by Oggiano and Pierella [12,13]. This research ignored the true effect of the surfboard to simplify the study. The final two faces were set as symmetry walls and were classified as far-field flow.
The fluid was defined as water with a density of 998.2 kg/m3 and viscosity of 0.001003 kg/(m.s). There is a wide range of speeds a surfer can reach on a wave; however, speeds recorded using an inertial sensor in a study by Gately et al. show the average speed during standard manoeuvres (cutback/bottom turn) of 6.8 ± 1.7 m/s [9]. Therefore, the flow velocity at the inlet was set at 7 m/s. In water, flow is incompressible for low-speed applications. The effects of water chop have been ignored and ideal conditions were assumed to simplify each simulation. The Reynolds number, Re, is 7.73 × 10⁵ and calculated using
R e = ρ · V · L μ
where ρ is density (kg/m3), V is the free stream velocity (ms−1), L is reference length (m), μ is dynamic viscosity (kg/ms). The reference length (L) is the chord length of the foil at the base of the fin. For external fluid flow, the critical Reynolds number is (Recr = 5 × 10⁵); therefore, the flow is turbulent [14].

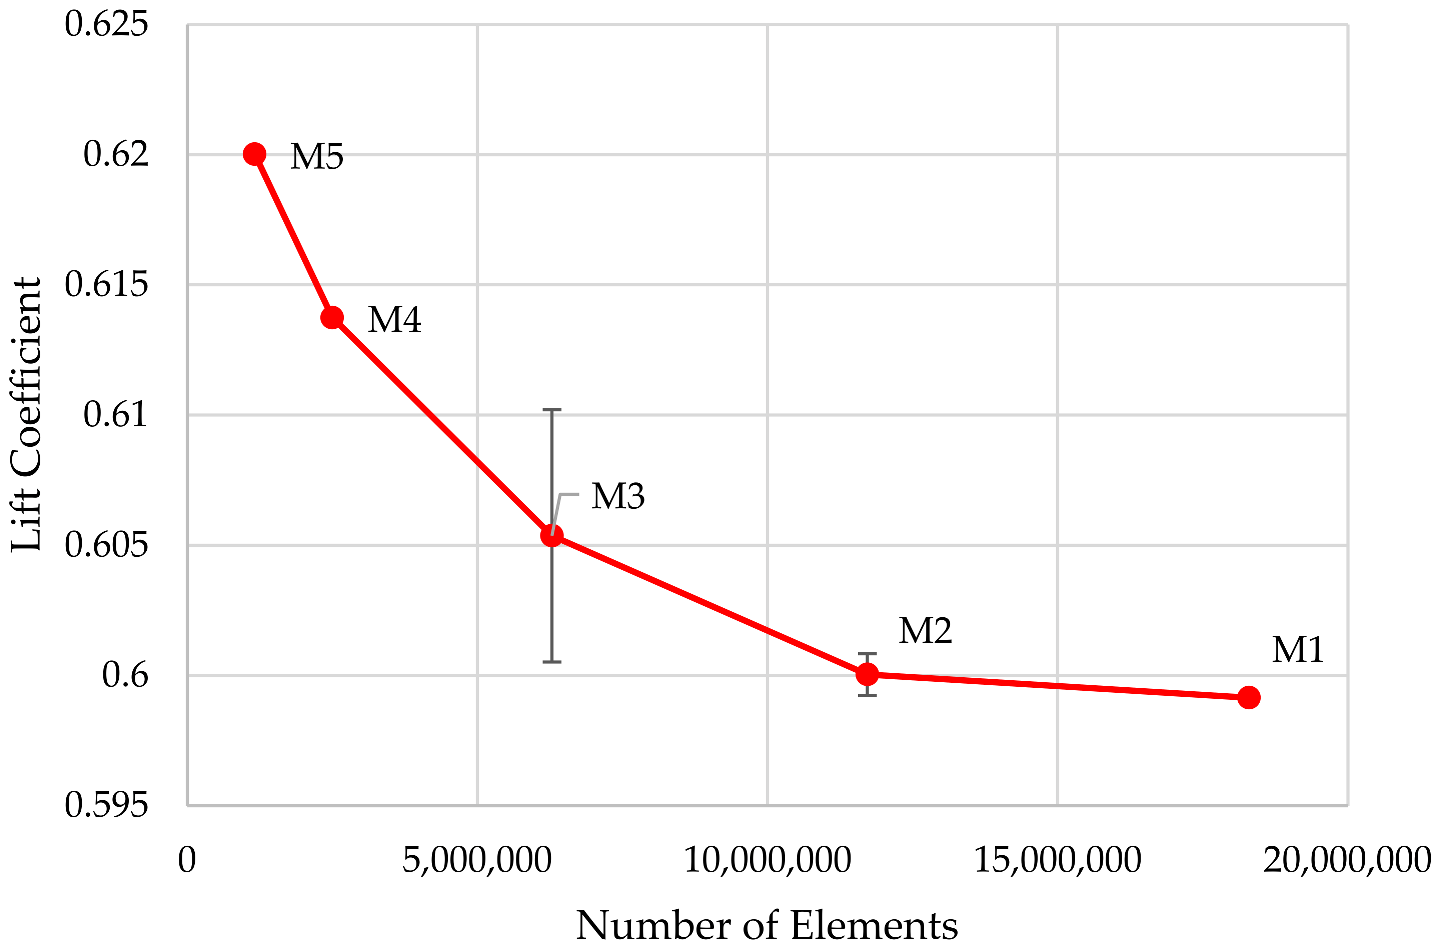
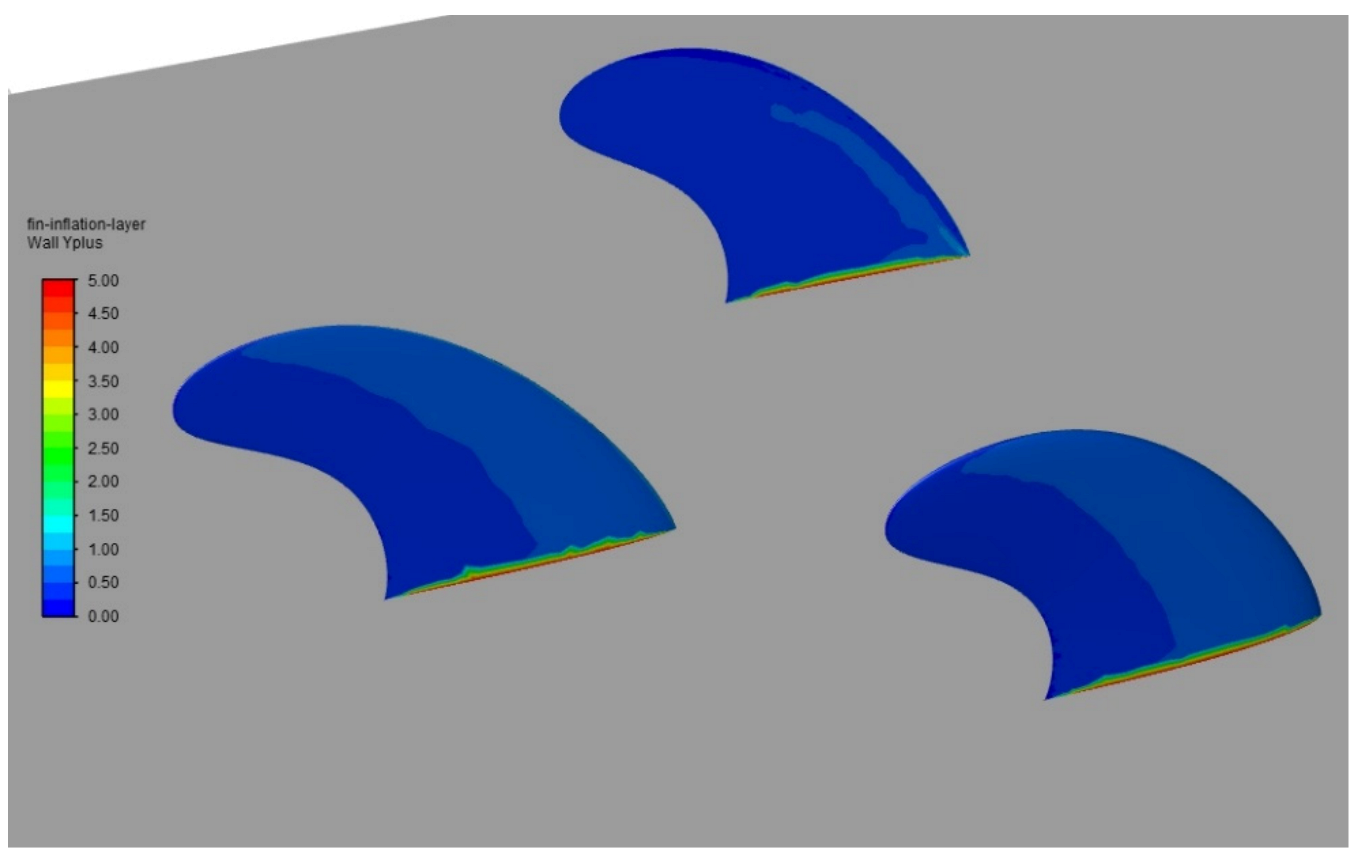
2.5. Mesh Generation

The domain uses tetrahedral meshing with inflation layers along the fin wall. The k-ω turbulence model requires the first layer height to be within the viscous sub-layer of the flow. Y+ represents the non-dimensional distance from the wall to the first node layer. This distance is required to be Y+ ≈ 1–5 for the first layer to be within the viscous sublayer and ensure the most accurate solution at the wall [14]. Y+ was computed from the mesh for a first layer height of 3.2 × 10⁻⁶ m or 0.0032 mm, with 20 layers at a growth rate of 1.2. The calculated Y+ on the fin surface is shown in Figure 4; the maximum value on the fin wall is 1.37 and the minimum is 0.025. The area of red in the contour originates from the surfboard wall, not the fin wall itself.
Finally, a mesh-sensitivity study was conducted using the grid resolution method to determine the most applicable element size for each of the bodies of influence surrounding the fins. The study comprised five grid densities (Table 2), each decreasing the overall element size for each body by half across the domain, resulting in a grid refinement ratio ( r ) of 2. The mesh resolutions were all simulated with an inlet velocity of 7 m/s at an AOA 15°. The difference in C L between M2 and M1 is approximately 0.15%; however, the computational expense increases by 60%.

2.6. Numerical Error and Uncertainty Estimation
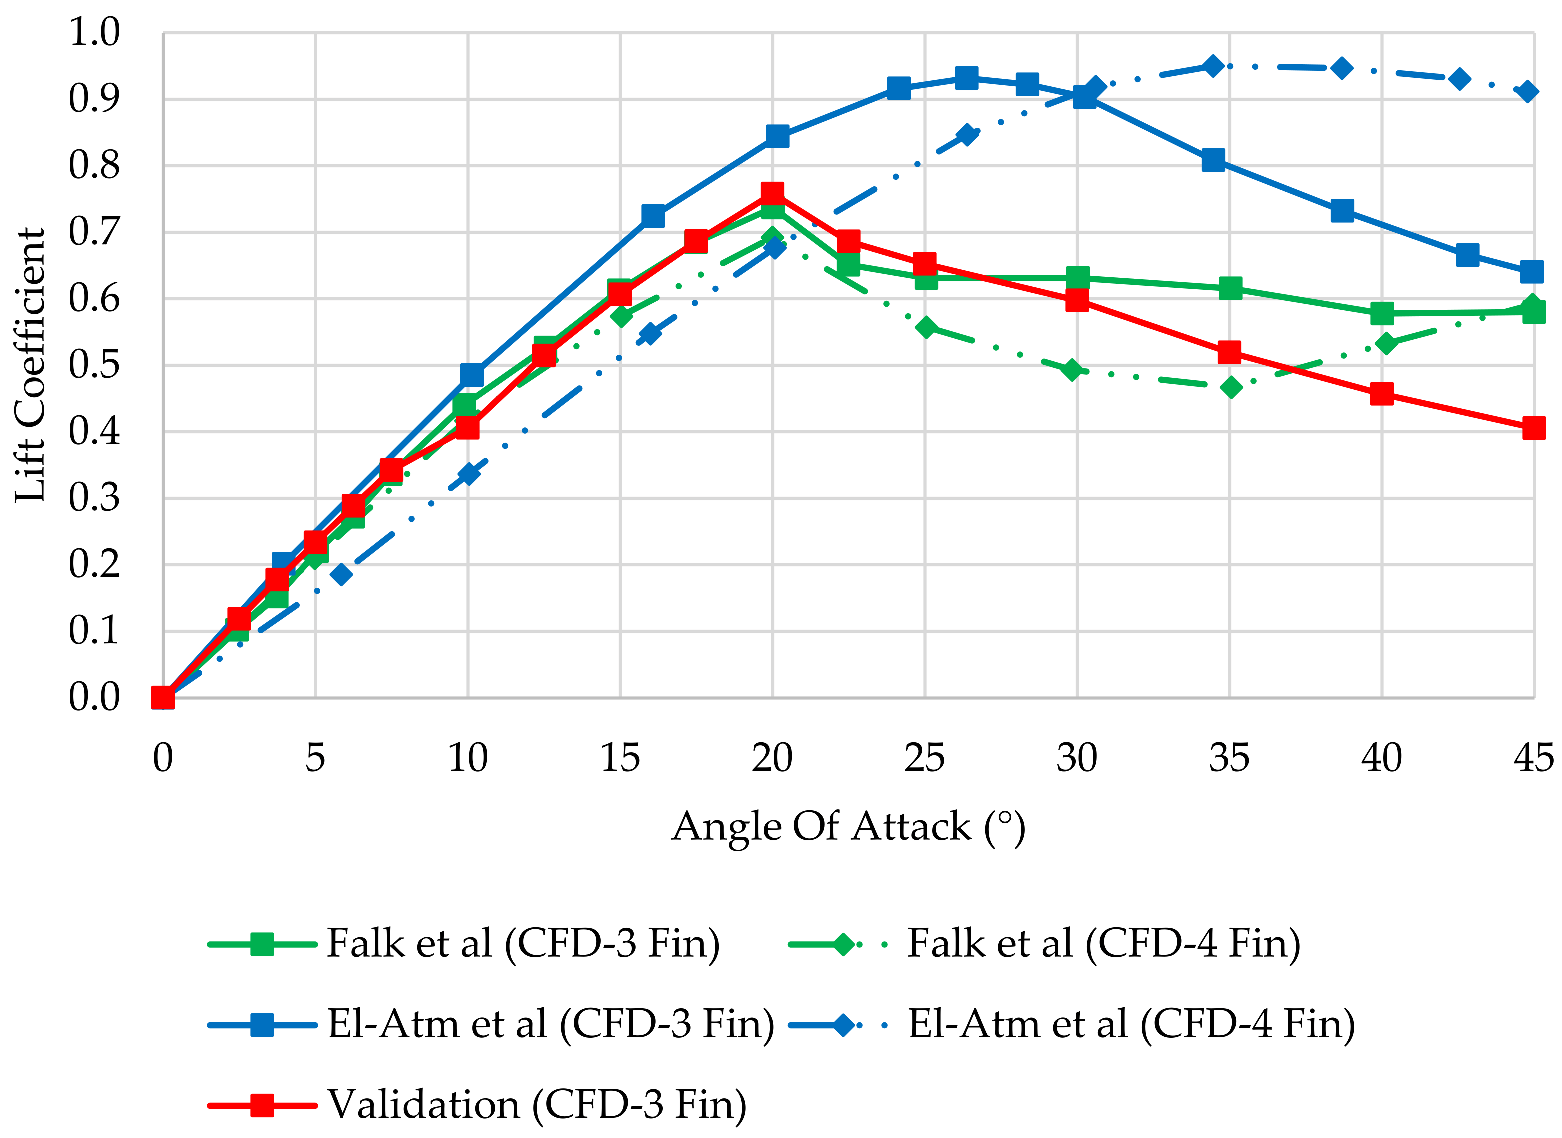
The error in the results can be estimated using Richardson extrapolation (RE) method for mesh refinements with equal grid refinement ratios [15]. For these calculations, only three mesh resolutions were used (M1, M2, and M3). The convergence ratio, R, for a set of three solutions is defined by:
R = 2 1 3 2 = 0.167
Here, 1 is the C L for M1, 2 is the C L for M2, and 3 is the C L for M3. The solution is deemed monotonically converging for 0 < R < 1 . For this condition, generalised RE can be used to estimate error ( E n ) and order of accuracy ( p ); p is found using:
p = ln 3 2 / 2 1 ln ( r ) = 2.58
For accurate error estimates, p 0.5 as error approaches infinity for p 0 . Error ( E n ) can be found for each mesh using:
E 1 = 2 1 1 r p  
E 2 = 3 2 1 r p  
E 3 = r p 3 2 1 r p  
For grid convergence studies using three or more solutions, the numerical uncertainty is estimated using the grid convergence index (GCI) established by Roache [16]:
G C I n = F s E n  
G C I 1 = F s E n
Here, F s is the factor of safety. For studies with more than two grid resolutions, a value of F s = 1.25 is deemed adequately conservative. The error and GCI for each mesh are shown in Table 3.
The estimated uncertainty in the mesh resolutions is implemented as error bars in Figure 5. From this figure, it can be seen there is very little error associated with both the M1 and M2 mesh resolutions. Due to the computational expense of the M1 resolution, the M2 mesh size was preferred for this study as the solution can be deemed converged with no effective reduction in error at this point.

2.7. Validation

In fin literature, there are limited experimental data on single fins available, and, currently, there are no experimental studies on multi-fin configurations. As this study is based on a multi-fin configuration, it is important to compare the initial baseline results with other 3-fin simulations. Figure 6 compares multi-fin C L results from two Falk et al. studies and El-Atm et al. with extended 3-fin baseline results [2,3,4].
The strongest comparison here is the Falk et al. results as the methodology in that study is very similar to this study. Up to 25°, the validation results closely match with 3-fin results, with the validation underreporting lift by 7.8% at 10°. At angles higher than 25°, Falk et al. found significant fluctuations in lift coefficient using URANS simulations, and this is the main contributor to the differences seen at the highest angles. The El-Atm et al. results, also displayed in Figure 6, have a different trend. The stall point is not only much higher in these results but is also at a later angle. The major differences in this study may be attributed to the use of the k-ε turbulent model to solve the flow or the different fin geometries. Despite the higher magnitudes seen in the El-Atm et al. results, there is still strong confidence in the methodology used in this study. The extremely close relationship to the Falk et al. results shows the simulations performed in this study produce results in line with similar literature both in trend and magnitude.

3. Results and Discussion
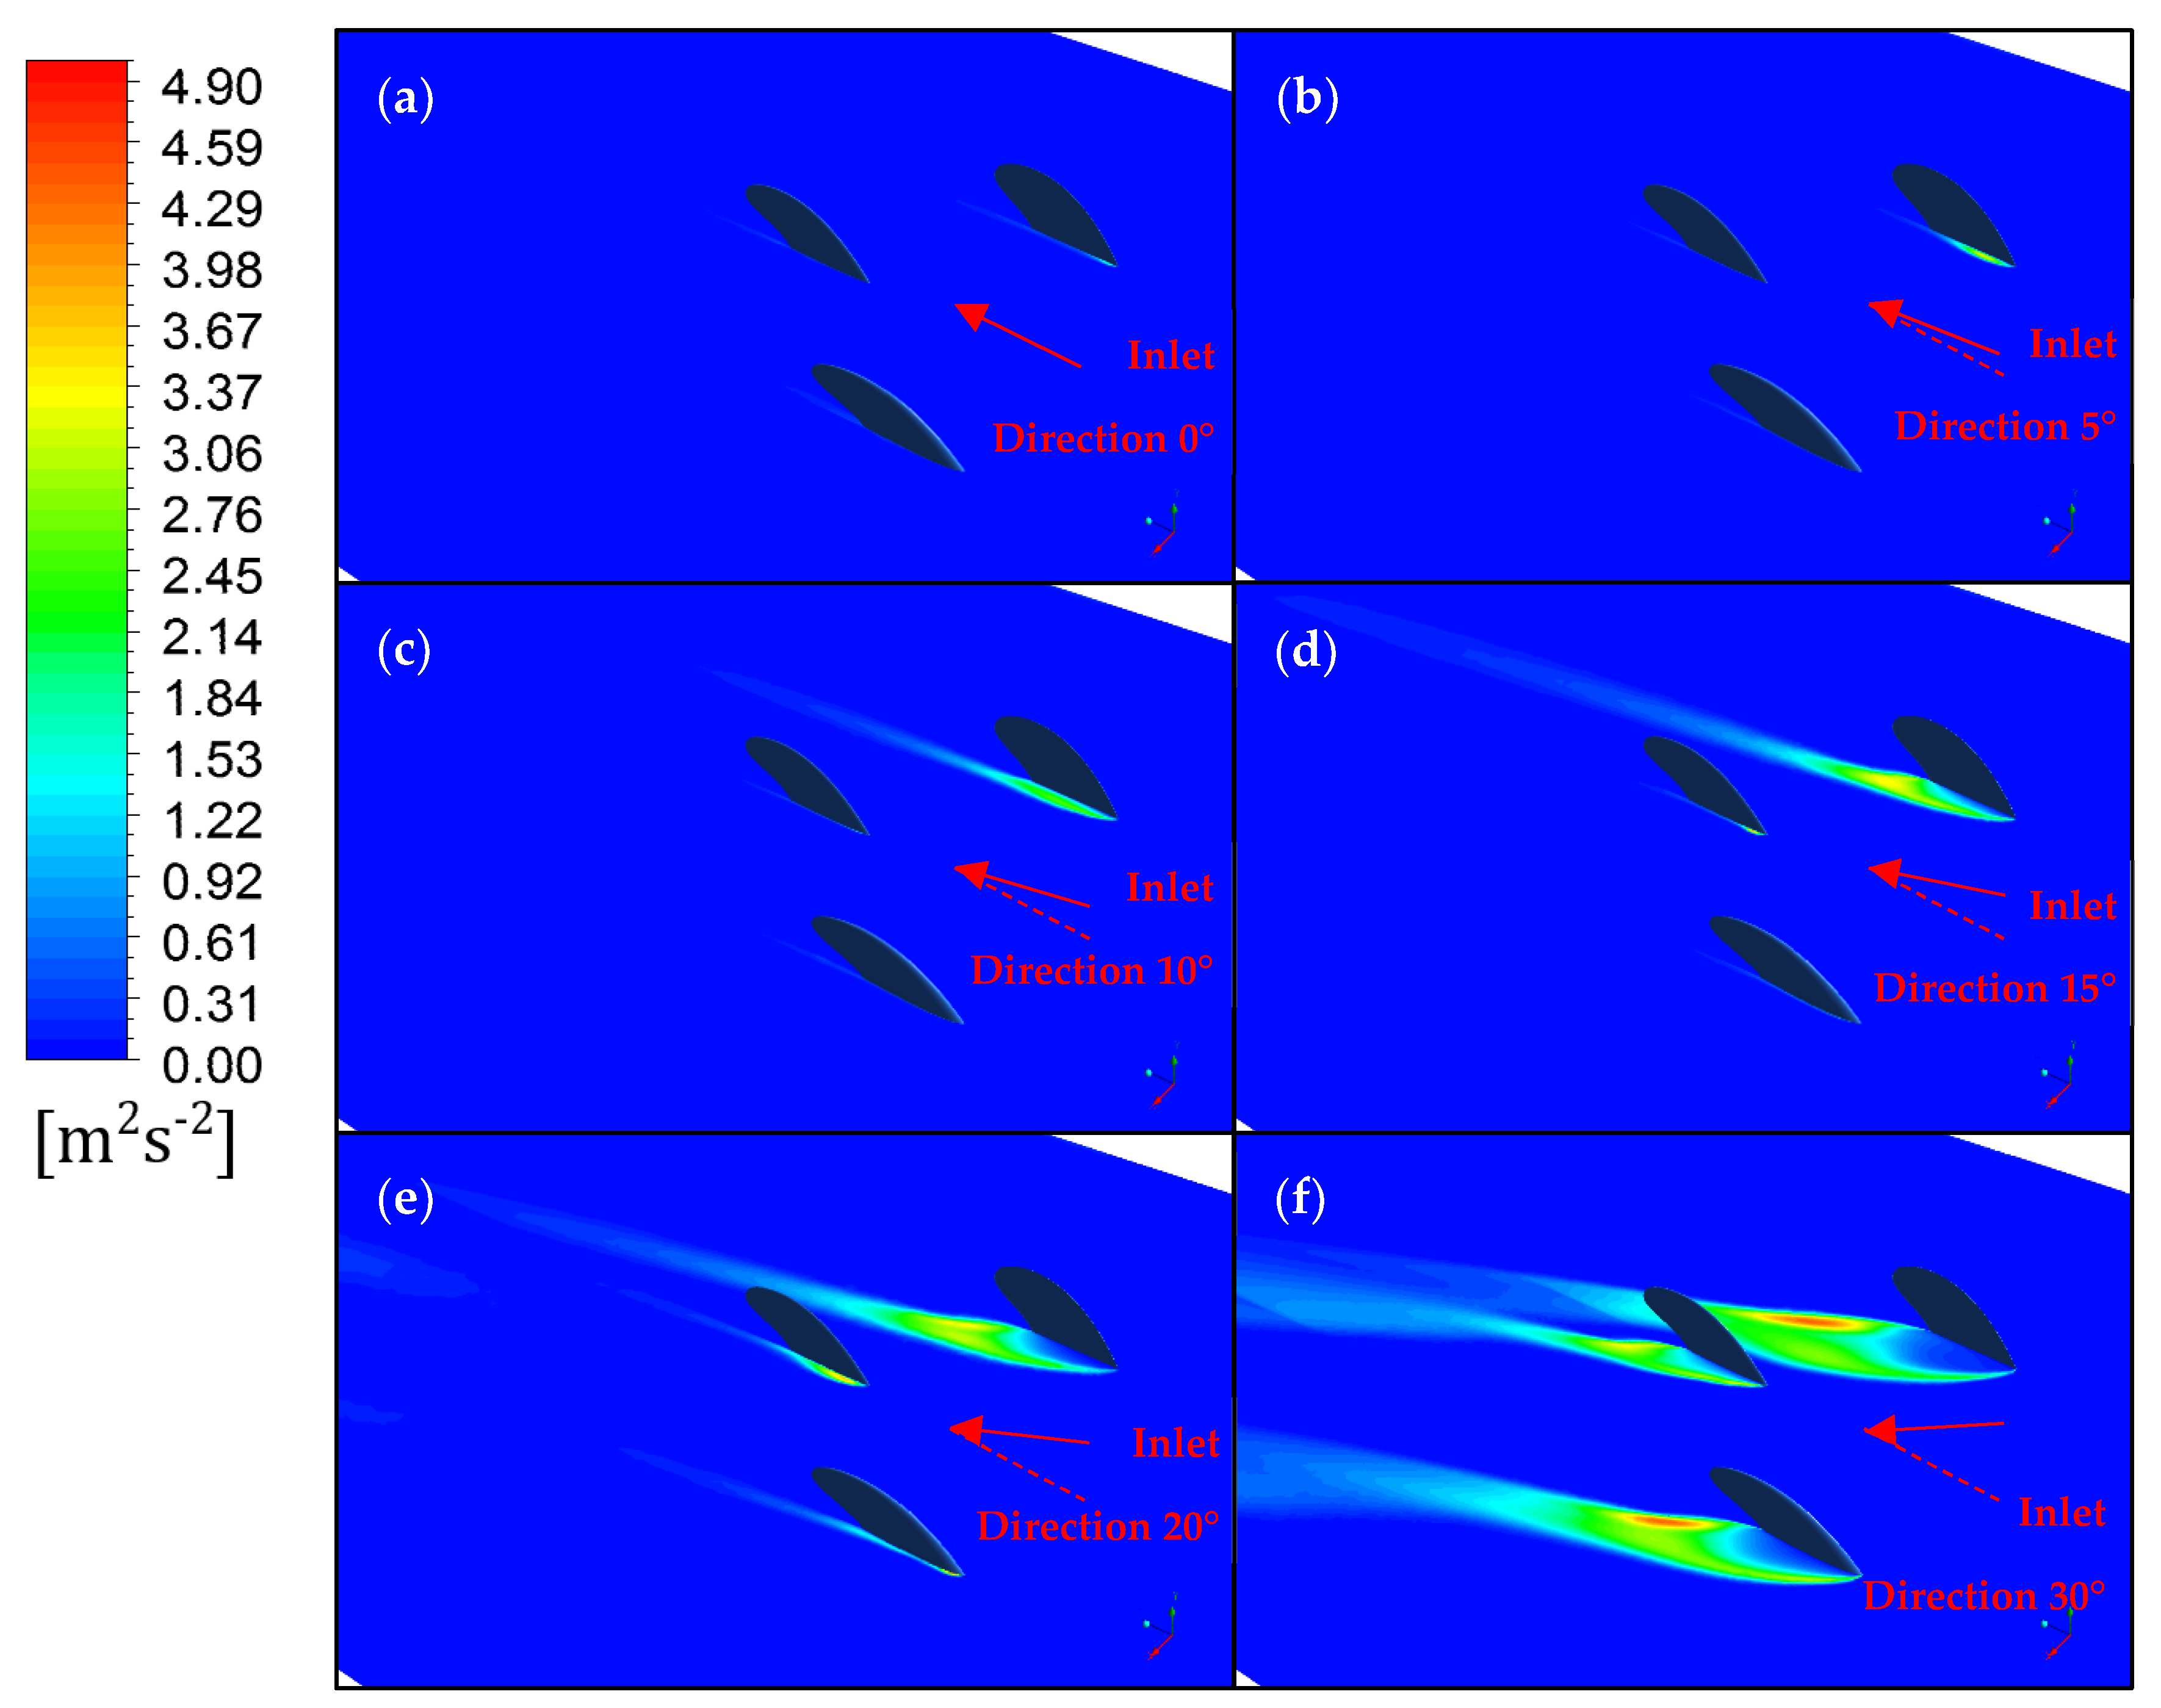
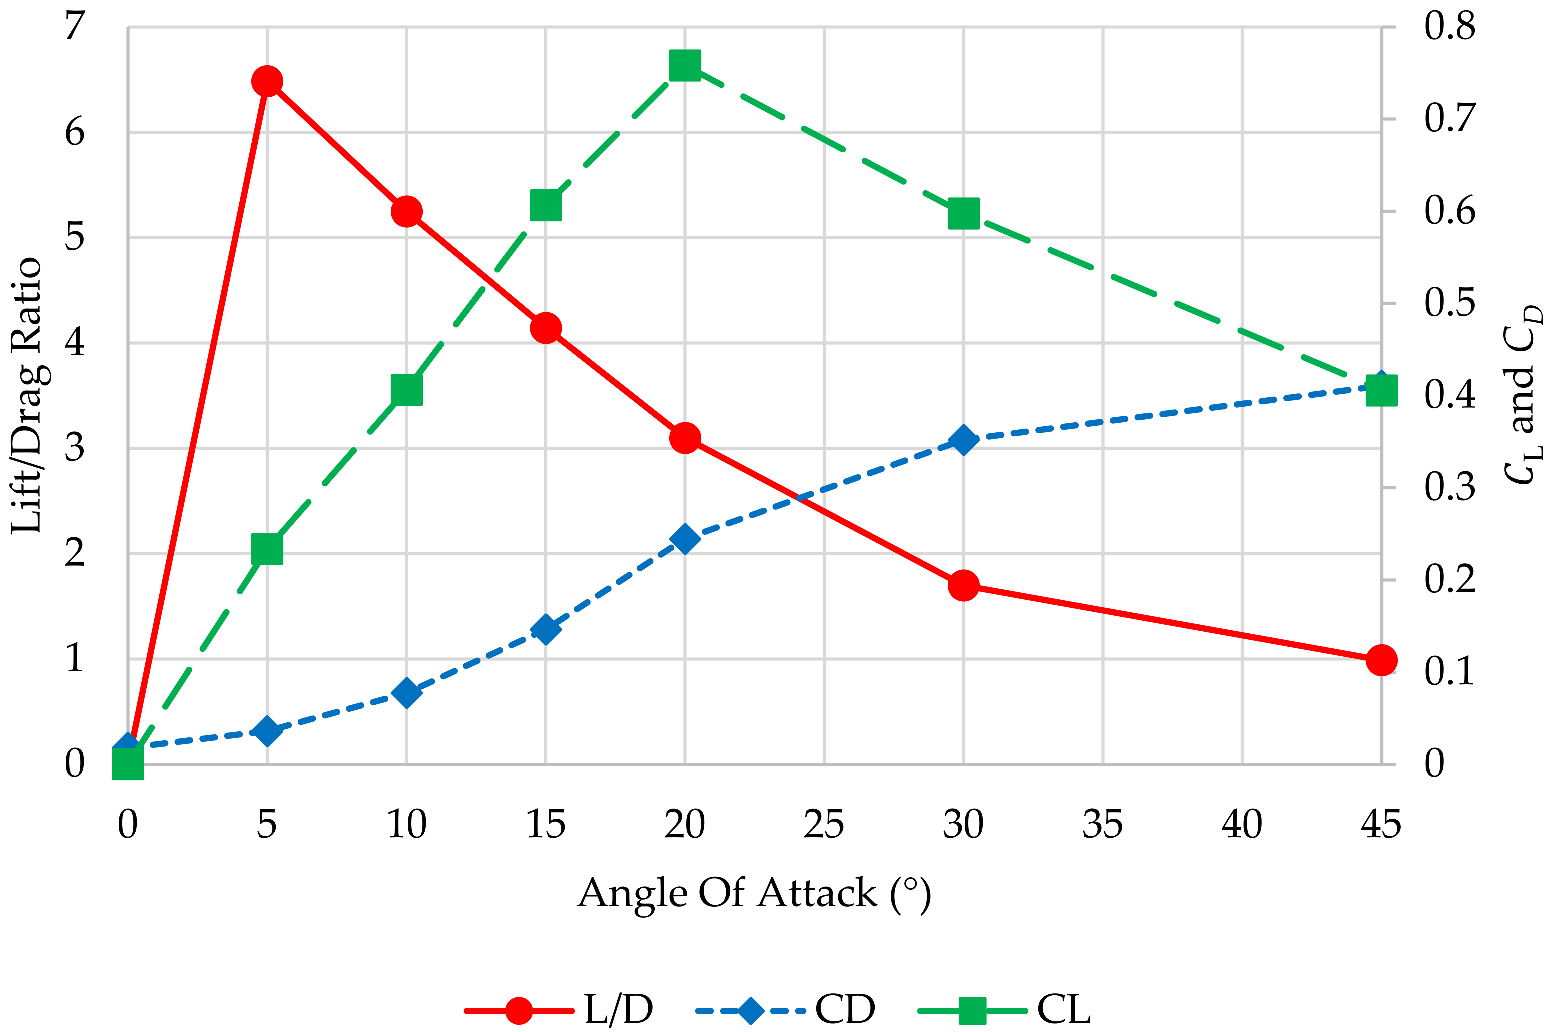
3.1. Baseline Fin

Figure 7 displays the C L and C D results for the baseline fin model. The C L follows a linear trend as the angle is increased until it reaches a maximum value of 0.76 at 20°, where stall behaviour is exhibited. The C D shows an exponentially increasing trend up to the stall point at 20°, where this trend is broken, but the C D continues to increase to a maximum of 0.35 at 30°. The L/D has a steep initial increase to a maximum of 6.48 at 5°, which slowly decreases to 1.70 at 30°.
Figure 8 is a view of a region of the fin wake 50 mm above the surfboard surface. The turbulence generated by the fins is very low until it reaches an AOA ≥ 20° (Figure 8e). At this AOA, the turbulence in the wake of the inside fin begins to generate large vortices from the tip of the fin, and flow separation can be seen on the flat side of the foil. At the highest angle, the turbulence of both side fins indicates intense vortices and large separation (Figure 8f). At this angle, the lift loss is severe and there is an upstream impact from the side fins. In the areas of high kinetic energy in the wake regions, it is likely strong eddy currents and reversed flow will be generated downstream of the side fins, resulting in an interruption of flow onto the leading edge of the centre fin.

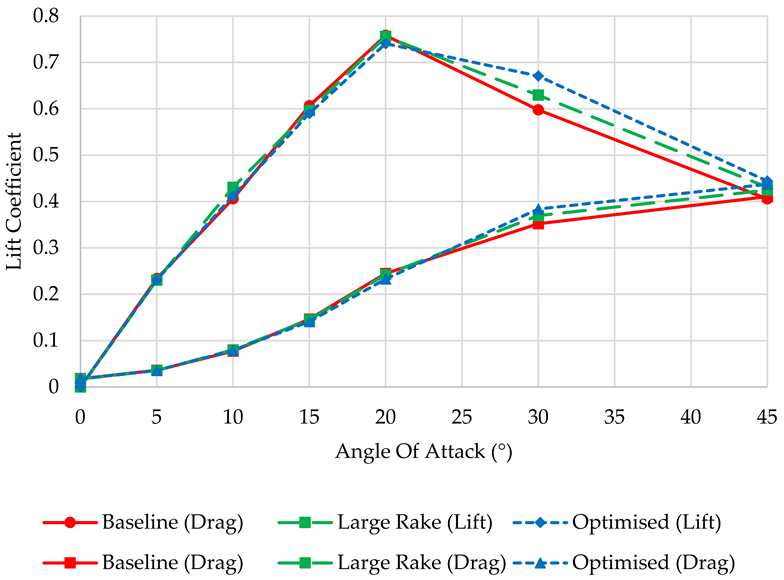
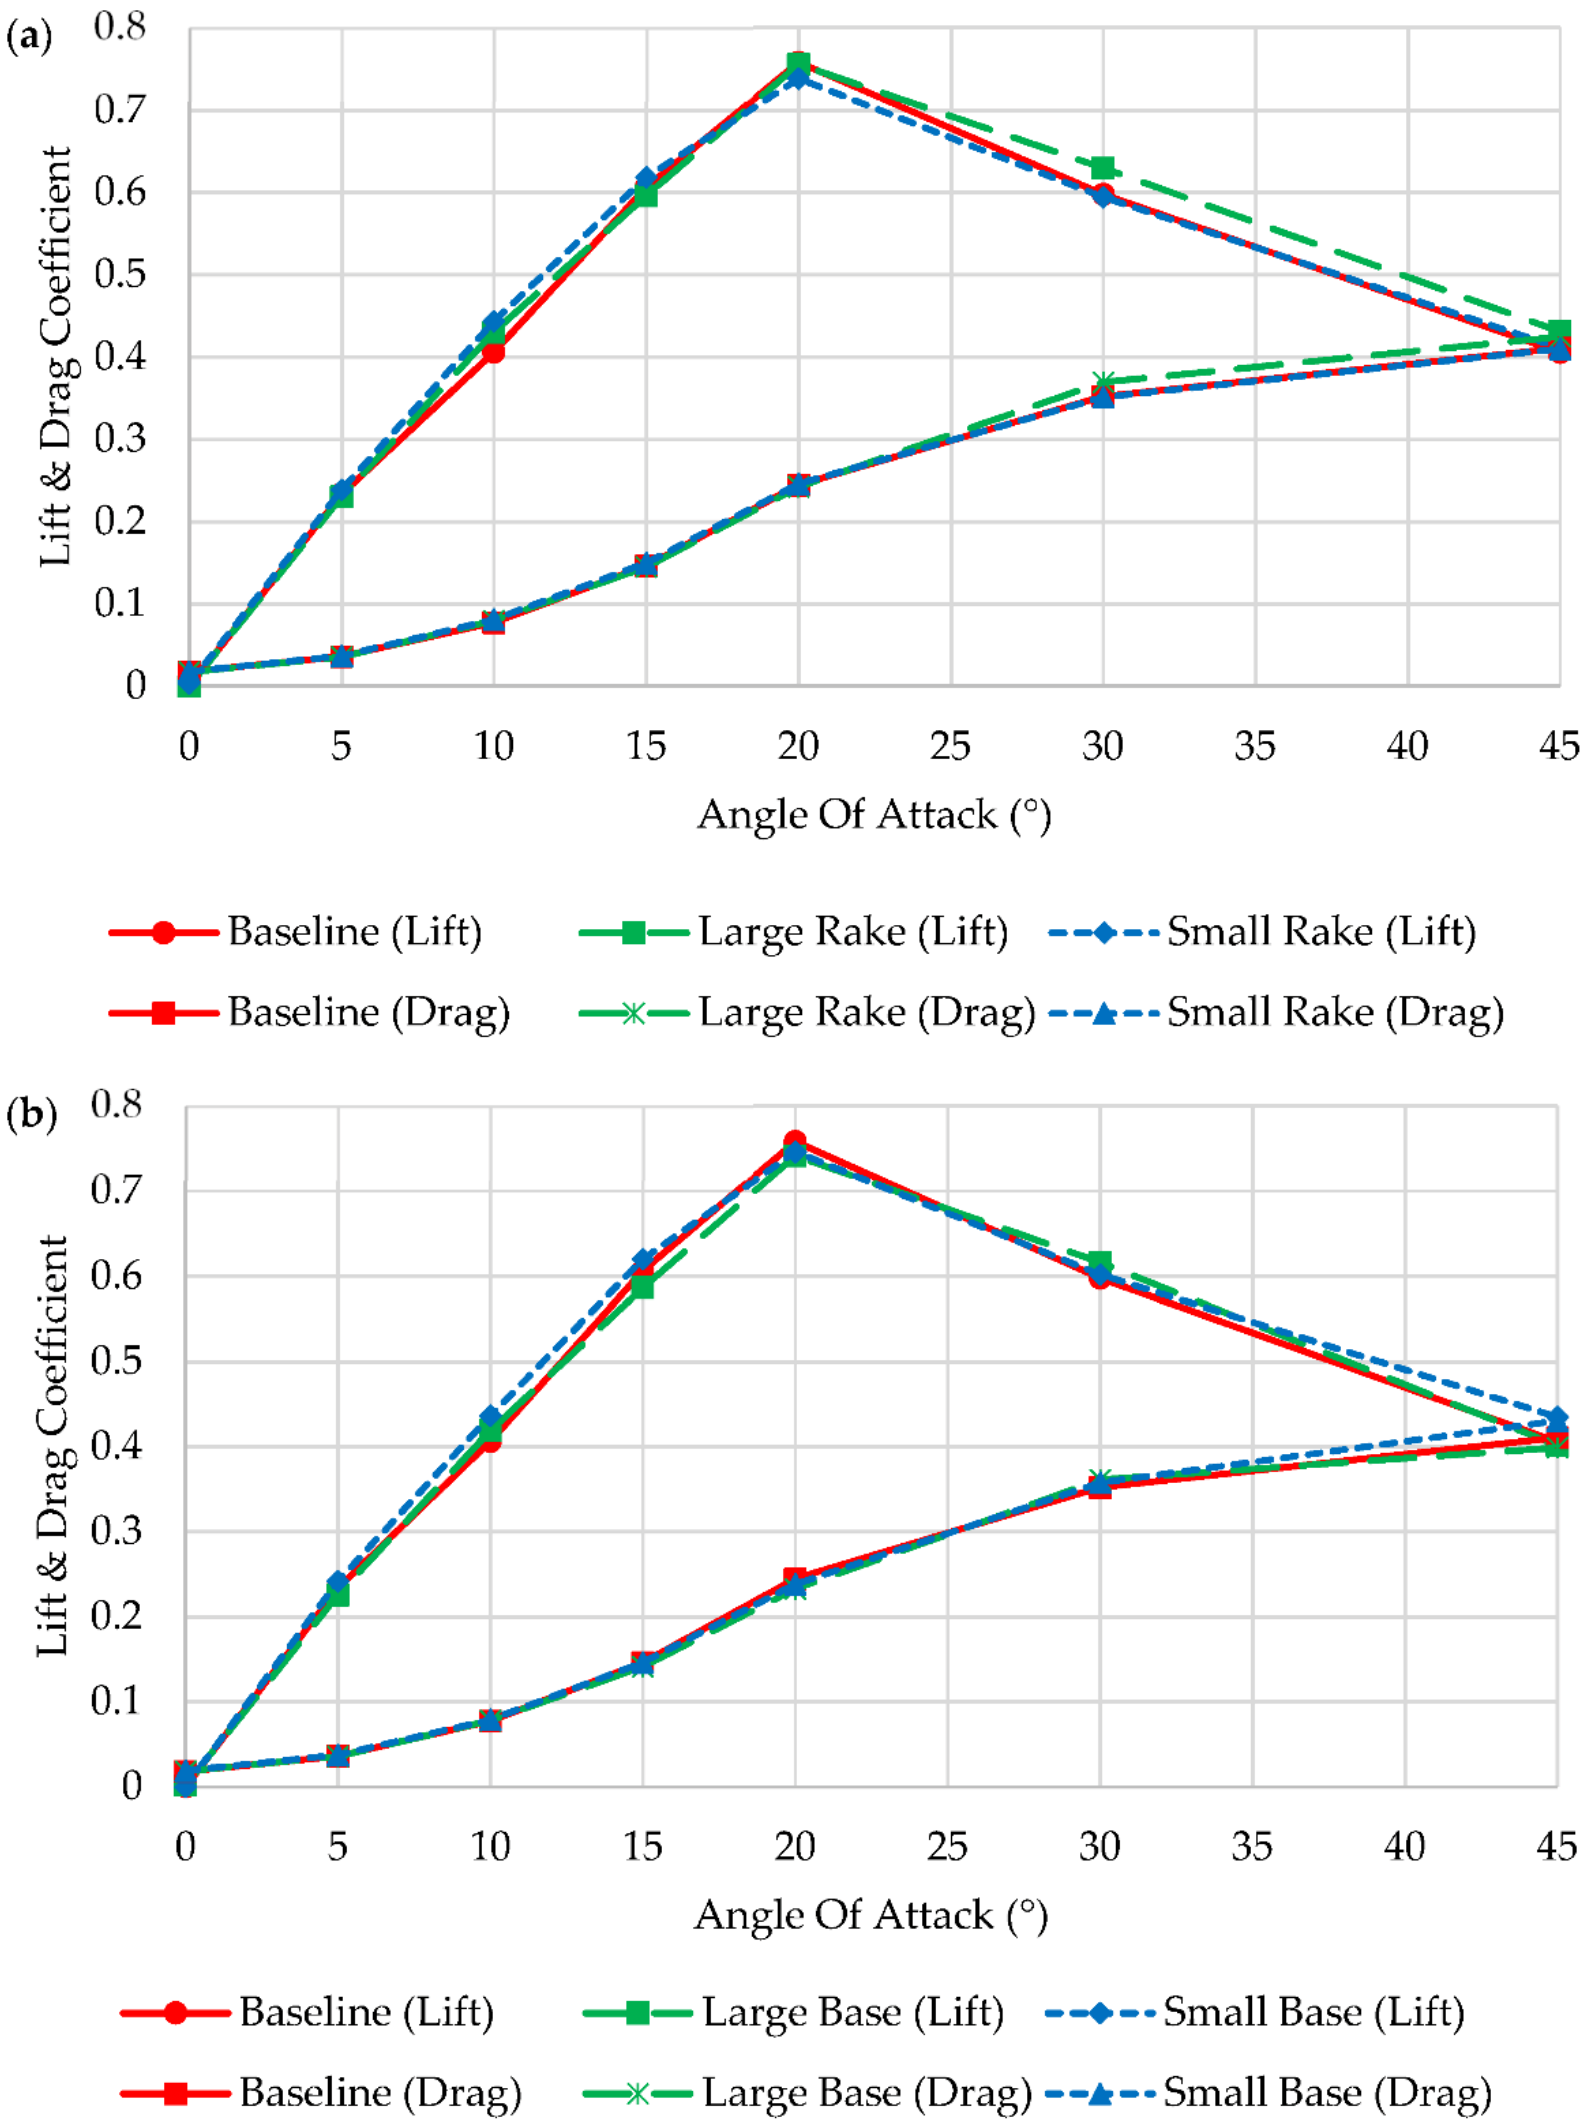
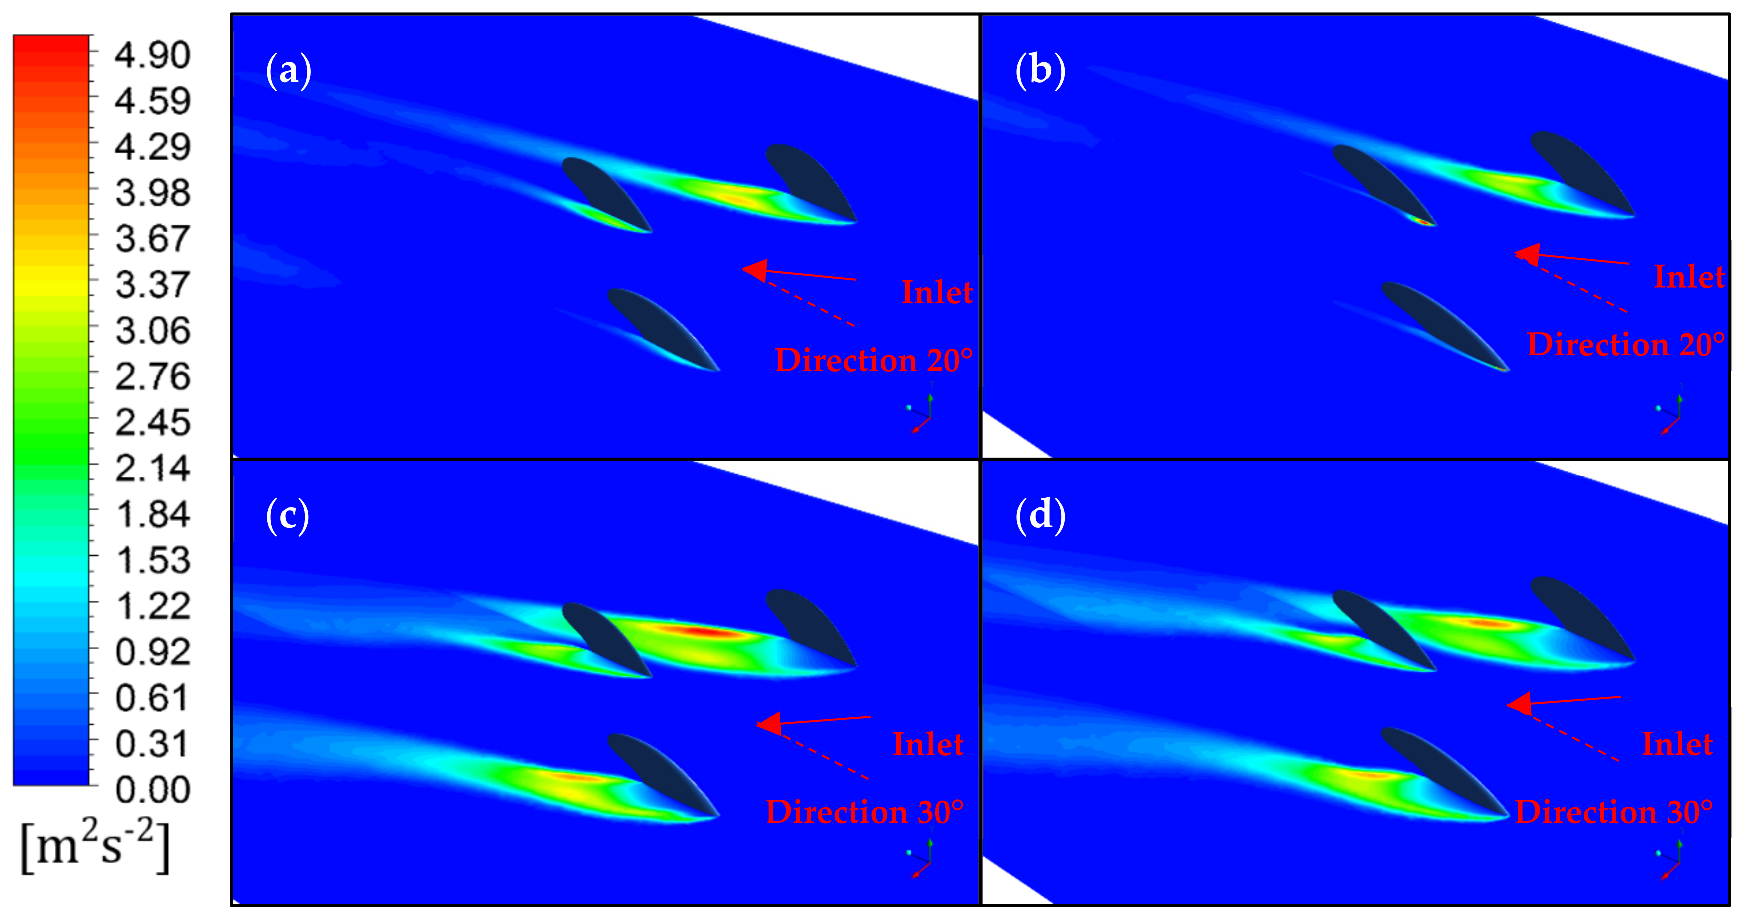
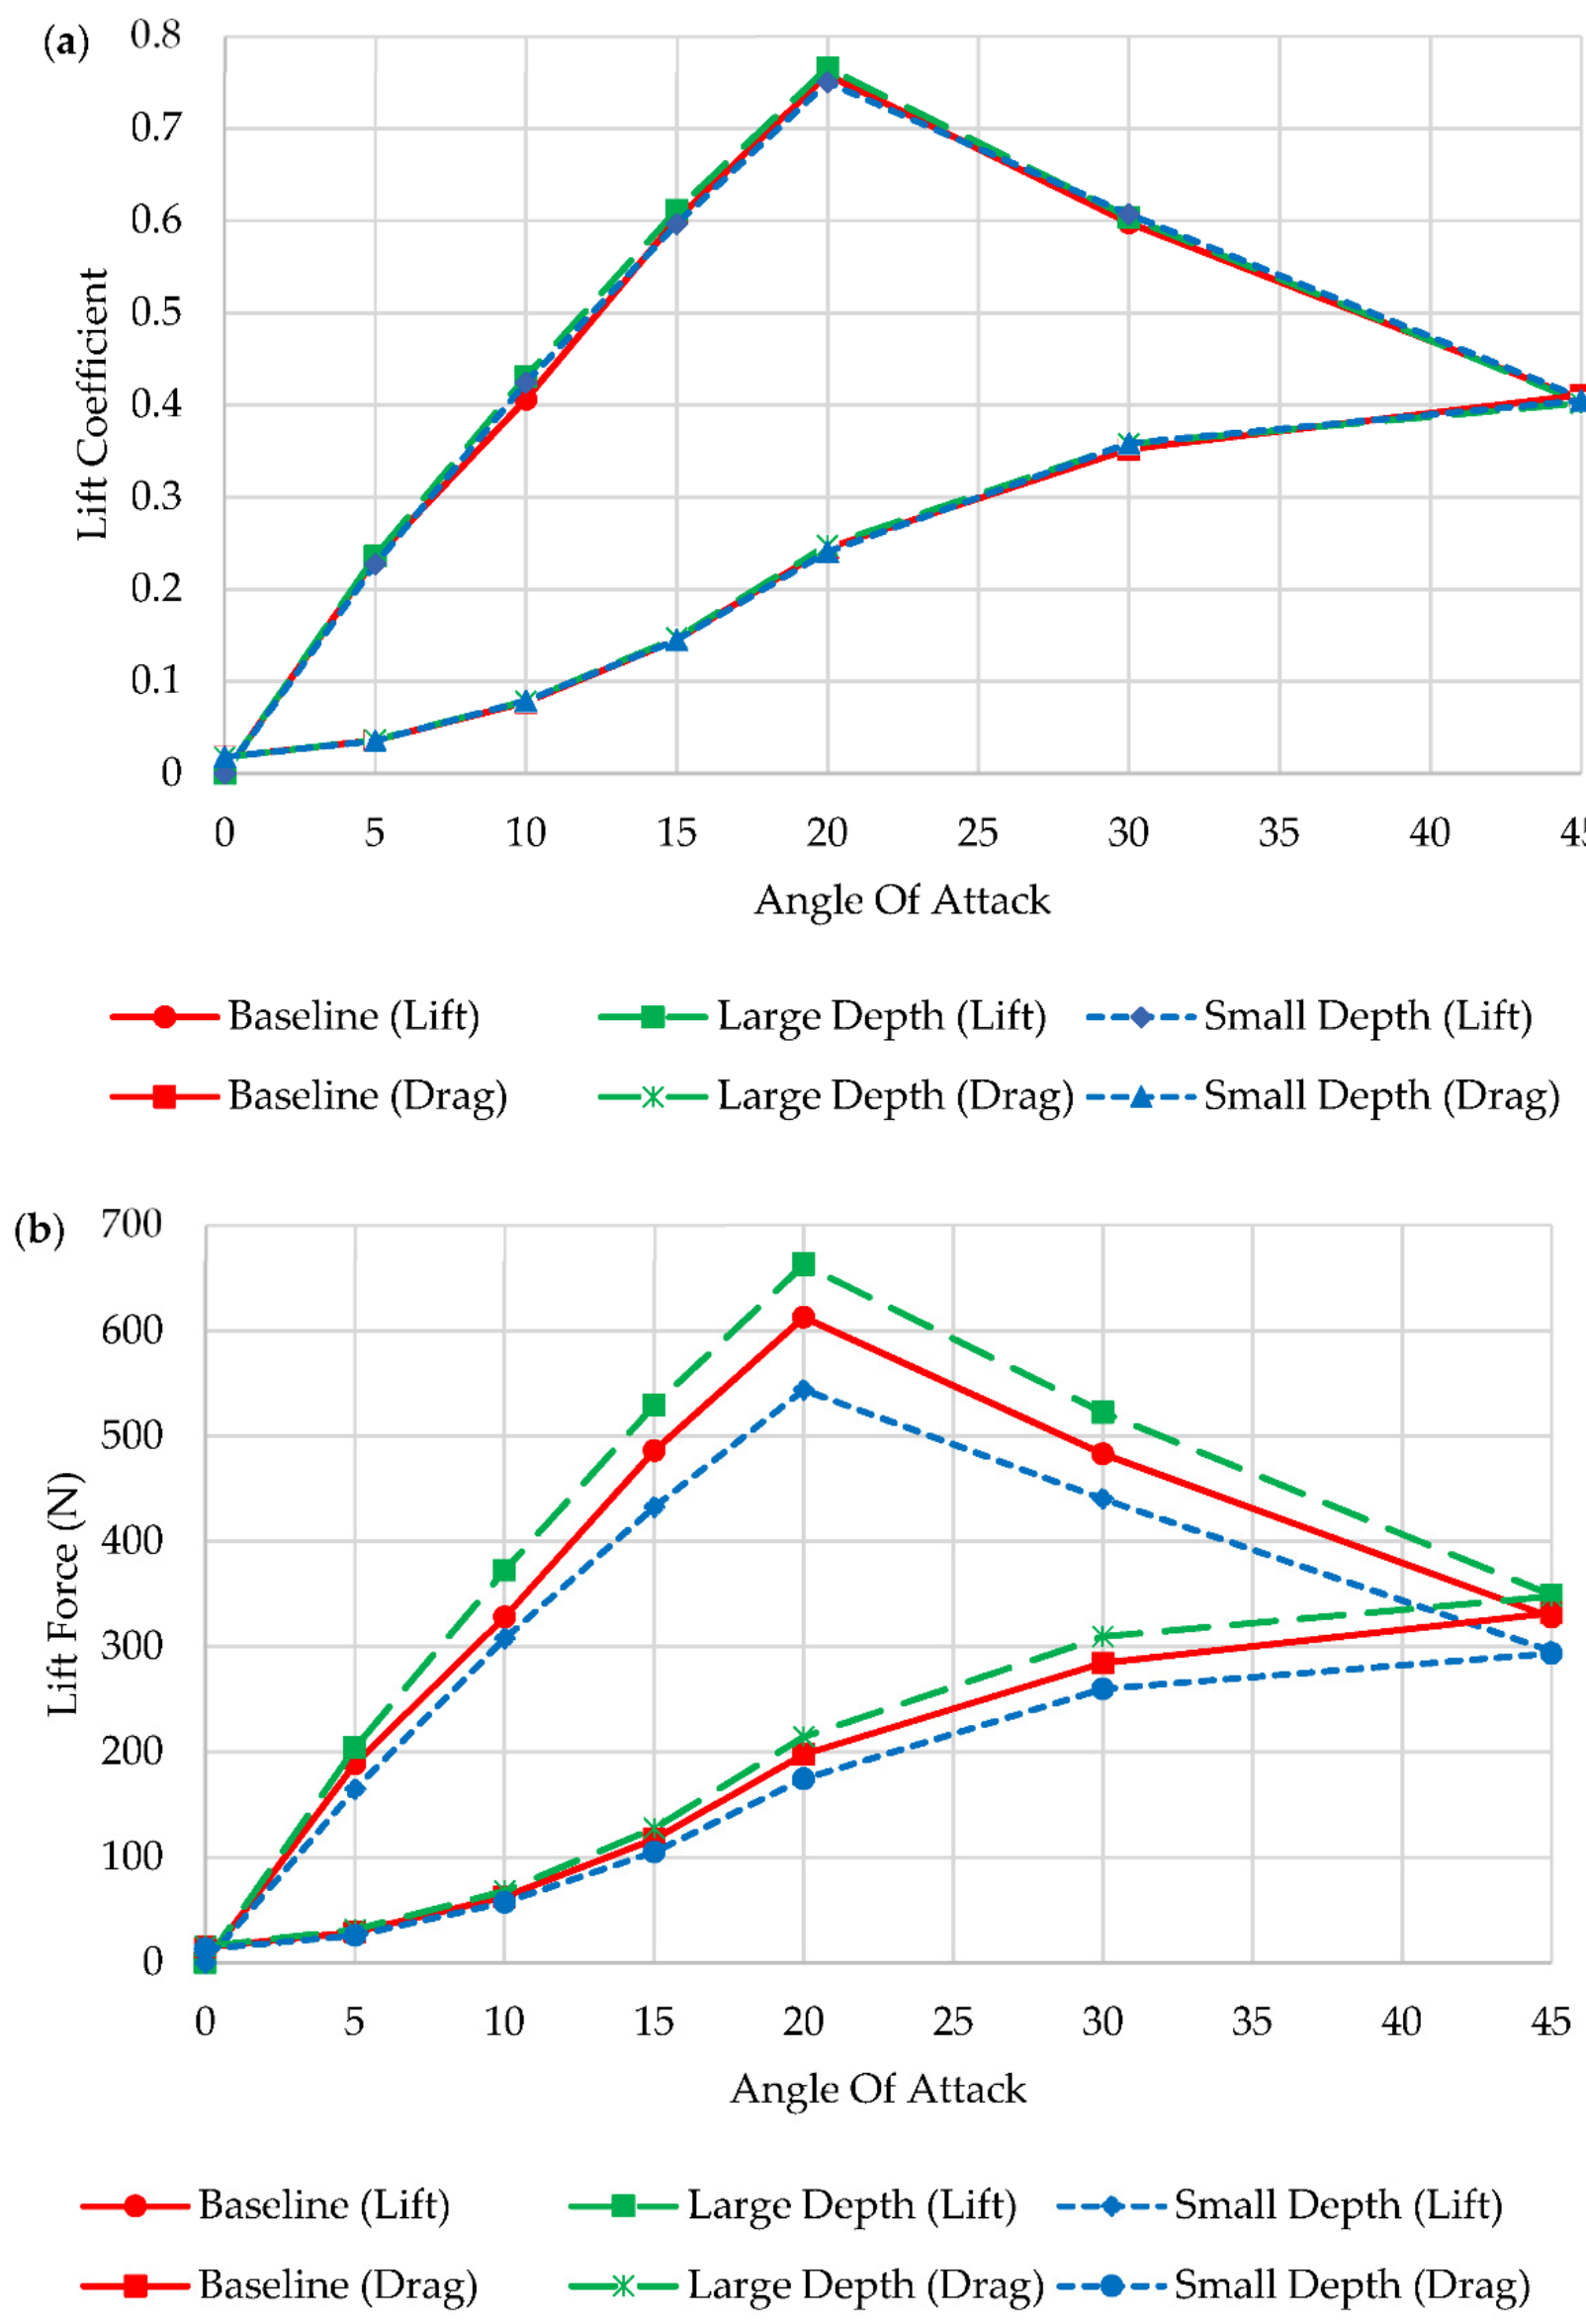
3.2. Template Comparison

Figure 9 compares the coefficient data of the baseline template with the two rake templates (a) and the two base templates (b). The small-rake produces a 9.2% increase in the lift at 10°, whilst the large-rake design has only a 6% increase at the same angle. As the AOA reaches the stall point at 20°, the small-rake design reaches a smaller lift peak. Beyond the stall angle (20°), the large-rake template has a steadier lift drop when compared to the baseline model. The baseline fin stalls at a similar lift peak as the large-rake design; however, at 30°, the C L drops to a value closer to the small-rake design. This is a loss of around 21.2%, whereas the large-rake only drops by 16.7%. The large-rake design has a higher C D after the stall (Figure 9a). All the designs have very similar drag until the stall, where both the small-rake and baseline designs differ from the exponential trend with an increase of 42.7% and 43.8%, respectively, whilst the large-rake design has a greater increase of 52.5% from 20°.
Figure 9b has a similar trend for the base templates, as was seen in the rake. The small-base is more efficient in the early AOAs, but the large-base has a softer drop in the lift. Despite having similar trends, the base design’s performance benefits are smaller. At each AOA, the
C L results are smaller than those presented in the rake results, most significantly at the stall point. Although the C L is smaller, a similar lift loss after stall is evident with a drop of 16.9% for the large-base design.
Figure 10c reveals a large area of intense turbulence from the trailing edge of the small-rake inside the fin, where, comparably, the large-rake design (Figure 10d) has a much smaller and much less intense wake region. The flow reaching the centre fin of the small-rake design would be unpredictable, and this upstream effect is causing the centre fin to exhibit less force as a result.
The depth templates exhibited little difference in the C L and C D across the designs, as can be seen in Figure 11a. However, there is a significant impact on the magnitude of the lift force exerted on the fin surface. From the force data given in Figure 11b, the large-depth design has the highest force output, with a maximum of 662.8 N at 20°, and the small-depth design only has a maximum of 544 N. The baseline has a maximum of 612.9 N.
The lift and drag results presented suggest the fin parameters investigated are critical factors to consider when fine-tuning surf equipment. It is important to note these simulations simplify the turning of a surfboard in yaw movement, whereas real-world turning involves a complex combination of yaw, pitch, and roll [13]. Shormann et al. [17] mentioned higher resultant forces opposing the surfer are an indication of a surfer binding with the wave face and speed increases, or, in surfing terminology, greater “hold” and “drive”. They also note the benefits of lower forces for a surfer as it decreases the amount of power required to perform manoeuvres or improve the “pivot” of fins. It is important to recognise the smaller templates for both rake and base length present higher C L at the angles before stall, whereas the large templates present higher C L after the stall (Figure 5). The small templates of rake and base length may provide greater speed generation at the lower angles due to higher lift and lower drag. The lower peak lift can also be considered an indication of higher manoeuvrability or “pivot” during turns. The large template results of rake and base length suggest these fins have greater “hold” at angles after the stall as the resultant force would be greater due to higher C L and C D . The higher C D these templates report after stall is also an indication of more intense drops in velocity after stall.
Shormann et al. [18] also discuss the potential board control and recovery benefits of fins with gradual stall behaviour and turbulence damping between the side and centre fins. This observation was also investigated by El-Atm et al. [2] when comparing different fin configurations. Comparing the turbulent kinetic energy contours for the large and small-rake templates (Figure 10), there is less turbulence to the centre fin for the large-rake templates. These fins recorded the most gradual lift stall of those measured, and the turbulence dampening is likely a key contributing factor.

3.3. Optimisation Results

Figure 12 demonstrates the optimised fin design successfully delays the major lift loss to a later AOA. For the optimised set, the lift loss between 30 to 40° is similar to the baseline template’s drop between 20 and 30°. The overall maximum C L is lower for the optimised design, but the lift drop has been reduced from the already improved 16.7% for the large-rake template to only 9.4% across 20 to 30°. As with the C L , the optimised set has pushed the C D trend breakpoint to the later 30° mark.
As the optimised design includes these large-rake side fins, the wake turbulence from the side fins in the optimised set in Figure 13c is closely comparable to the full set (b). However, at the interaction between the centre fin and the side fin, the turbulence from the optimised design has a lower intensity compared to the large-rake and baseline designs. The turbulence from the baseline and large-rake designs also indicates the centre fin has fully separated flow across the low-pressure face of the fin. However, the optimised centre fin exhibits on-body flow at the same point.
As shown in the template results, a turbulence reduction would decrease the lift loss and, therefore, improve the hold and control of the fins. The large-rake template produced the most gradual lift loss after the stall point, making it the clear choice of template for this goal. However, the interaction between the side fin turbulence and the centre fin seemed to cause issues with this design. To improve the performance of the centre fin, the trailing edge curvature was decreased. This was done as the large-base results indicated this template had much lower areas of separation on the centre fin near the board connection (where the area was at maximum) but similar separation towards the tip. Another change to the centre fin was slightly lowered depth. This aimed to keep the centre fin out of the intense upstream tip vortices produced by the side fins. The success of the design can be seen in the results for both coefficient plots and turbulence contours as the fins successfully reduced the turbulence (Figure 13) and had a significantly reduced lift loss after the stall point (Figure 12). However, the drag of the fins has also been increased, meaning there could be greater losses in velocity should the surfer remain in these angle ranges for longer periods.

3.4. Shortcoming

It is important to note this study looks at only the yaw motion of a turning surfboard, whereas real-world turning involves a combination of yaw, pitch, and roll [18]. During turns, it is also possible for the fins to not be fully immersed in water, which would affect the forces involved.
The impact of unsteady flow phenomena, such as vortex shedding and separation, must also be recognised. Falk et al. showed that both C L and C D see increasingly significant fluctuations after 25° due to vortex shedding on the side and centre fin interaction [3]. The results presented above were limited to RANS simulations to decrease the computational expense of the research. The post-stall performance benefits, seen in the results above, should be investigated further in URANS simulations. URANS simulations are needed to confirm the performance impacts that have been identified in these steady simulations.
As mentioned, the lack of multi-fin experimental results makes it difficult to fully validate the study. The current validation proves the methodology used provides accurate solutions, with similar trends and magnitudes to other state of the art simulations with similar parameters. However, custom flow channel testing is needed to improve confidence in the findings.

4. Conclusions

The research presented has given a detailed analysis of various thruster fin design parameters. The rake, depth, and base length of fin sets show specific performance characteristics. This is the first presentation of the effect each of these design parameters has on the coefficient trends, providing further insight into the current surfing knowledge of fins. Of these template aspects, the rake produced the most significant lift advantages to high angle turns performed on a surfboard. The base length was seen to have a similar effect to the rake but to a lesser extent, whereas the depth of the fin seemed to be more closely linked with the balance of forces than the performance profile.
When a specific wave condition is presented, individual analysis of each of these fin parameters can provide options for improvements on a base design. The research revealed a combination of different fin designs may provide a greater performance advantage rather than the same design across all three fins. An optimised design confirmed this by producing a preferable lift performance profile for higher angles than an all-rounded design.

Author Contributions

Conceptualization, S.C., P.K.C. and S.G.; methodology, S.C. and S.G.; validation, S.C., P.K.C. and S.G.; formal analysis, S.C.; investigation, S.C.; resources, S.G.; data curation, S.C.; writing—original draft preparation, S.C.; writing—review and editing, S.C., P.K.C. and S.G.; visualization, S.C.; supervision, P.K.C. and S.G.; project administration, P.K.C. and S.G. All authors have read and agreed to the published version of the manuscript.

Funding

This research received no external funding.

Conflicts of Interest

The authors declare no conflict of interest.

References

  1. Lavery, N.; Foster, G.; Carswell, D.; Brown, S. CFD modeling of the effect of fillets on fin drag. Reef J. 2009, 1, 93–111. [Google Scholar]
  2. El-Atm, B.; Kelson, N.; Gudimetla, P. A finite element analysis of the hydrodynamic performance of 3- and 4- fin surfboard configurations. In Proceedings of the 9th Global Congress on Manufacturing & Management, Gold Coast, Australia, 12–14 November 2008; pp. 1–6. [Google Scholar]
  3. Falk, S.; Kniesburges, S.; Janka, R.; Grosso, R.; Becker, S.; Semmler, M.; Döllinger, M. Computational hydrodynamics of a typical 3-fin surfboard setup. J. Fluids Struct. 2019, 90, 297–314. [Google Scholar] [CrossRef]
  4. Falk, S.; Kniesburges, S.; Janka, R.; O’Keefe, T.; Grosso, R.; Döllinger, M. Numerical Investigation of the Hydrodynamics of Changing Fin Positions within a 4-Fin Surfboard Configuration. Appl. Sci. 2020, 10, 816. [Google Scholar] [CrossRef] [Green Version]
  5. MacNeill, M.S. Bio-Inspired Optimal fin Shape and Angle for Maximum Surfboard Stability. Master’s Thesis, Michigan Technological University, Civil and Environmental Engineering Commons, Houghton, MI, USA, 2015. [Google Scholar]
  6. Brandner, P.A.; Walker, G.J. Hydrodynamic performance of a surfboard fin. In Proceedings of the 15th Australasian Fluid Mechanics Conference, Sydney, Australia, 13–17 December 2004; p. 4. [Google Scholar]
  7. Sakellariou, K.; Rana, Z.A.; Jenkins, K.W. Optimisation of the surfboard fin shape using computational fluid dynamics and genetic algorithms. Proc. Inst. Mech. Eng. Part P J. Sports Eng. Technol. 2017, 231, 344–354. [Google Scholar]
  8. FCS Fin Data. Fin Control Systems. 2020. Available online: https://www.surffcs.com.au/pages/fcs-fin-data (accessed on 6 October 2020).
  9. Gately, R.D.; Beirne, S.; Latimer, G.; Shirlaw, M.; Kosasih, B.; Warren, A.; Steele, J.R.; in het Panhuis, M. Additive Manufacturing, Modeling and Performance Evaluation of 3D Printed Fins for Surfboards. MRS Adv. 2017, 2, 913–920. [Google Scholar] [CrossRef]
  10. Forbes, S.M., Jr.; Sweeney, B. Global Surfaris; Running Press Book Publishers: Philadelphia, PA, USA, 2007. [Google Scholar]
  11. Glauert, H. The Elements of Aerofoil and Airscrew Theory; Cambridge University Press: Cambridge, UK, 1983. [Google Scholar]
  12. Oggiano, L. Numerical Comparison between a Modern Surfboard and an Alaia Board using Computational Fluid Dynamics (CFD). In Proceedings of the 5th International Congress on Sport Sciences Research and Technology Support, Funchal, Portugal, 30–31 October 2017. [Google Scholar]
  13. Oggiano, L.; Pierella, F. CFD for Surfboards: Comparison between Three Different Designs in Static and Maneuvering Conditions. Proceedings 2018, 2, 309. [Google Scholar] [CrossRef] [Green Version]
  14. Ngo, C.; Gramoll, K. Boundary Layer Theory-Flow Past a Flat Plate. Multimedia Engineering Fluid Mechanics. Available online: https://ecourses.ou.edu/cgi-bin/eBook.cgi?topic=fl&chap_sec=09.3&page=theory (accessed on 25 March 2021).
  15. Phillips, T.S.; Roy, C.J. Richardson Extrapolation-Based Discretization Uncertainty Estimation for Computational Fluid Dynamics. J. Fluids Eng. 2014, 136, 121401. [Google Scholar] [CrossRef]
  16. Roache, P.J. Quantification of Uncertainty in Computational Fluid Dynamics. Annu. Rev. Fluid Mech. 1997, 29, 123–160. [Google Scholar] [CrossRef] [Green Version]
  17. Shormann, D.; Oggiano, L.; Panhuis, M.I.H. Numerical CFD Investigation of Shortboard Surfing: Fin Design vs. Cutback Turn Performance. Proceedings 2020, 49, 132. [Google Scholar] [CrossRef]
  18. Shormann, D.; Panhuis, M.I.H.; Oggiano, L. Field Research and Numerical CFD Analysis of Humpback Whale-Inspired Shortboard Fins. Proceedings 2020, 49, 158. [Google Scholar]
Figure 1. Baseline fin dimensions (dimensions are mm unless otherwise stated).
Applsci 12 03297 g001
Figure 2. Optimised fin set for Winkipop, Victoria, Australia.
Applsci 12 03297 g002
Figure 3. (a) Computation surface grid. Inset: fin wall and surrounding inflation layers; (b) standard surfboard fin plug configuration, showing lift and drag directions (dimensions in mm unless otherwise stated).
Applsci 12 03297 g003
Figure 4. Contour of Y+ on fin surface.
Applsci 12 03297 g004
Figure 5. Grid convergence study.
Applsci 12 03297 g005
Figure 6. Multi-fin configuration CFD literature validation.
Applsci 12 03297 g006
Figure 7. Baseline performance, primary axis: L/D ratio; secondary axis: C L and C D ; X-axis: AOA.
Applsci 12 03297 g007
Figure 8. Turbulent kinetic energy in the wake region of baseline set (y = 50 mm) at various A0A. (a) 0°; (b) 5°; (c) 10°; (d) 15°; (e) 20°; (f) 30°.
Applsci 12 03297 g008
Figure 9. Lift and drag coefficient versus AOA. (a) Baseline vs. large-rake vs. small-rake; (b) baseline vs. large-base vs. small-base.
Applsci 12 03297 g009
Figure 10. Turbulent kinetic energy in the wake region of rake fin designs (y = 50 mm). (a) Small-rake at 20°; (b) large-rake at 20°; (c) small-rake at 30°; (d) large-rake at 30°.
Applsci 12 03297 g010
Figure 11. Baseline vs. large-depth vs. small-depth. (a) Lift and drag coefficients; (b) lift and drag forces.
Applsci 12 03297 g011
Figure 12. Lift and drag coefficient versus AOA; baseline vs. final design vs. large-rake.
Applsci 12 03297 g012
Figure 13. Turbulent kinetic energy in the wake region of fin designs at AOA 30 (y = 50 mm). (a) Baseline; (b) large-rake; (c) final design.
Applsci 12 03297 g013
Table 1. Fin template dimensions.
Template NameRake (°)Base Length (mm)Depth (mm)Foil CentreFoil Side3-Fin Reference Area (mm2)
Baseline33.7111115NACA 0006Half NACA 001221,994.9
Large-Rake37111115NACA 0006Half NACA 001222,804.8
Small-Rake28111115NACA 0006Half NACA 001221,268.3
Large-Base33.7119115NACA 0005 *Half NACA 0005 *23,453.7
Small-Base33.7100115NACA 0014 *Half NACA 0014 *20,039.9
Large-Depth33.7111121NACA 0006Half NACA 001223,617.5
Small-Depth33.7111105NACA 0006Half NACA 001219,788.5
Optimised(Side: 39) (Centre: 30)111(Side: 115) (Centre: 100)NACA 0006Half NACA 001220,388.2
* The chord length has been changed. Therefore, the foil has been changed, so the chord/thickness ratio remains constant.
Table 2. Grid sensitivity results.
MeshNumber of ElementsTime (h)Lift Force (N) C L
Coarse (M5)1,164,0300.19501.15280.6200
M42,500,3290.60496.08120.6137
Medium (M3)6,284,6622.55489.30980.6054
M211,720,1654.96485.00500.6000
Fine (M1)18,296,9327.93484.28510.5991
Table 3. Error and uncertainty estimations mesh resolutions.
Mesh Error     E n GCI
M36.40 × 10−37.99 × 10⁻³
M21.07 × 10−31.34 × 10⁻³
M11.79 × 10−42.24 × 10⁻⁴
Publisher’s Note: MDPI stays neutral with regard to jurisdictional claims in published maps and institutional affiliations.

