Article

Mechanical Performance of Curved Link-Slab of Simply Supported Bridge Beam

1
College of Civil Engineering, Zhejiang University of Technology, Hangzhou 310014, China
2
Department of Civil Engineering, Ryerson University, Toronto, ON M5B 2K3, Canada
3
School of Engineering, Zhejiang University City College, No. 48 Huzhou Street, Hangzhou 310015, China
*
Author to whom correspondence should be addressed.
Appl. Sci. 2022, 12(7), 3344; https://doi.org/10.3390/app12073344
Submission received: 23 February 2022 / Revised: 18 March 2022 / Accepted: 20 March 2022 / Published: 25 March 2022
(This article belongs to the Topic Advances on Structural Engineering)

Abstract

:
This paper proposes a curved link-slab (CLS) structure, simplified into a hingeless arch model, to address the current cracking phenomenon of CLS concrete. The stress formula of the hingeless arch under various loads is derived based on the classical mechanic’s method. Based on an actual bridge example, the mechanical properties of CLS are analyzed under different loads and load combinations. The results show that: (1) the CLS stress is significantly lower than that of the flat link-slab structure (FLS), (2) its stress values are less than the concrete tensile limit, and (3) the CLS can effectively solve the concrete cracking phenomenon on the link-slab. The rationality of the stress formula derived from the simplified model of the hingeless arch is verified using the finite element method (FEM). The parametric sensitivity analysis shows that variation of the reinforcement ratio of the CLS has a limited impact on it. Considering both the concrete tensile and compressive limit, the thickness of the CLS should be 15 cm to 20 cm, and its design span should be about 5% to 7.5% of the main beam length.

1. Introduction

The flat link-slab (FLS) application at the top of the pier for a multi-span bridge is common, but it is easy to crack [1,2,3]. Due to the FLS location, the stress and deformation are complex, and the engineering quality is difficult to guarantee. The concrete on the FLS can easily crack, and the cracks aggravate the bridge deck damage, the formation of potholes, rainwater infiltration, and corrosion of the steel bars. This distress would seriously affect the strength and durability of the FLS structure and reduce the life cycle of the bridge [4,5].
To solve the existing problems of the FLS, researchers worldwide have put forward practical solutions for different issues of bridge decks through long-term experimental research and engineering practice. Caner and Zia [6] conducted experiments on the FLS of simply supported beams (SSB), analyzed the mechanical properties of the longitudinal main beams with different spans and proposed a theoretical FLS design method based on the three-moment equation. Charuchaimontri and Senjuntichai [7] studied the influence of various boundary conditions on the FLS, which are usually constructed in Thailand using a three-dimensional nonlinear finite element code based on the microplane model, and obtained the load–deflection curve of the FLS. A design standard for the FLS was formulated based on the internal forces and cracks.
Au and Lam [8] applied the debonding link-slab system to repair the FLS, replaced the expansion device, and conducted a long-term cyclic loading test. The test results show that the system meets bridge design requirements under the (service) limit state. Chen and Abu-Farsakh [9] proposed a new bridge end-slab design method that can increase the flexural rigidity of the slab. Then, the authors showed that the newly designed slab has better performance than the traditional design through the static loading tests. Kim and Fischer [10] proposed a ductile engineered cementitious composite (ECC) bridge deck connecting plate. The deflection and fatigue properties of the ECC connecting plate were experimentally studied. The research showed that the deflection ability of the ECC connecting plate and the crack width control ability could effectively extend the continuous service life of the bridge deck. Ahn and Yoon [11] put forward a simplified model of a monolithic jointless bridge, calculated the internal force of the FLS under temperature load through FEM, and simplified the theoretical model. The mechanical properties of the integral jointless bridge under the static load were obtained.
Kendall and Keoleian [12] applied a new composite-concrete material to the FLS. The results showed that the material has the advantage of not being easily damaged and can increase the FLS life cycle. Saber and Aleti [13] applied a new fiber-reinforced composite plastic material to the FLS. It was found that the composite plastic could reduce the corners at both ends of the main beam. The structure of the composite plastic link-slab has the advantages of being resistant to damage and easy to repair. Wang and Xie [14] proposed a new arched link-slab device for bridge decks over piers, which changed the FLS internal force transmission method. Through loading tests, the authors showed that the structure could improve the anti-cracking damage of the bridge deck. Wang and Shen [15] proposed an arched link-slab structure suitable for the deck of hollow slab girder bridges. The numerical simulation was modeled to analyze the mechanical characteristics of the arched link-slab. Proper parameters of the arch span and rise were obtained using theory deduction and numerical calculations. This study verified the effectiveness of the structure of the hollow slab girder arch link-slab to prevent concrete from cracking. Zhuang and Xu [16] conducted a theoretical analysis of the FLS. The authors also used numerical analysis to study the effect of the slab thickness, surface pavement material, and length of the debonded section on the FLS.
Many experimental studies and engineering practices have shown that various existing improvement measures can solve the structural defects of the FLS during the operation of the bridge to a certain extent. Given the macroscopic force characteristics of the FLS, the present paper proposes a new type of cast-in-place curved link-slab (CLS). Based on the theoretical derivation and numerical method, the mechanical properties of the CLS and FLS were analyzed and compared. Furthermore, the design parameters of the CLS were optimized using parametric sensitivity analysis.

2. Theoretical Analysis

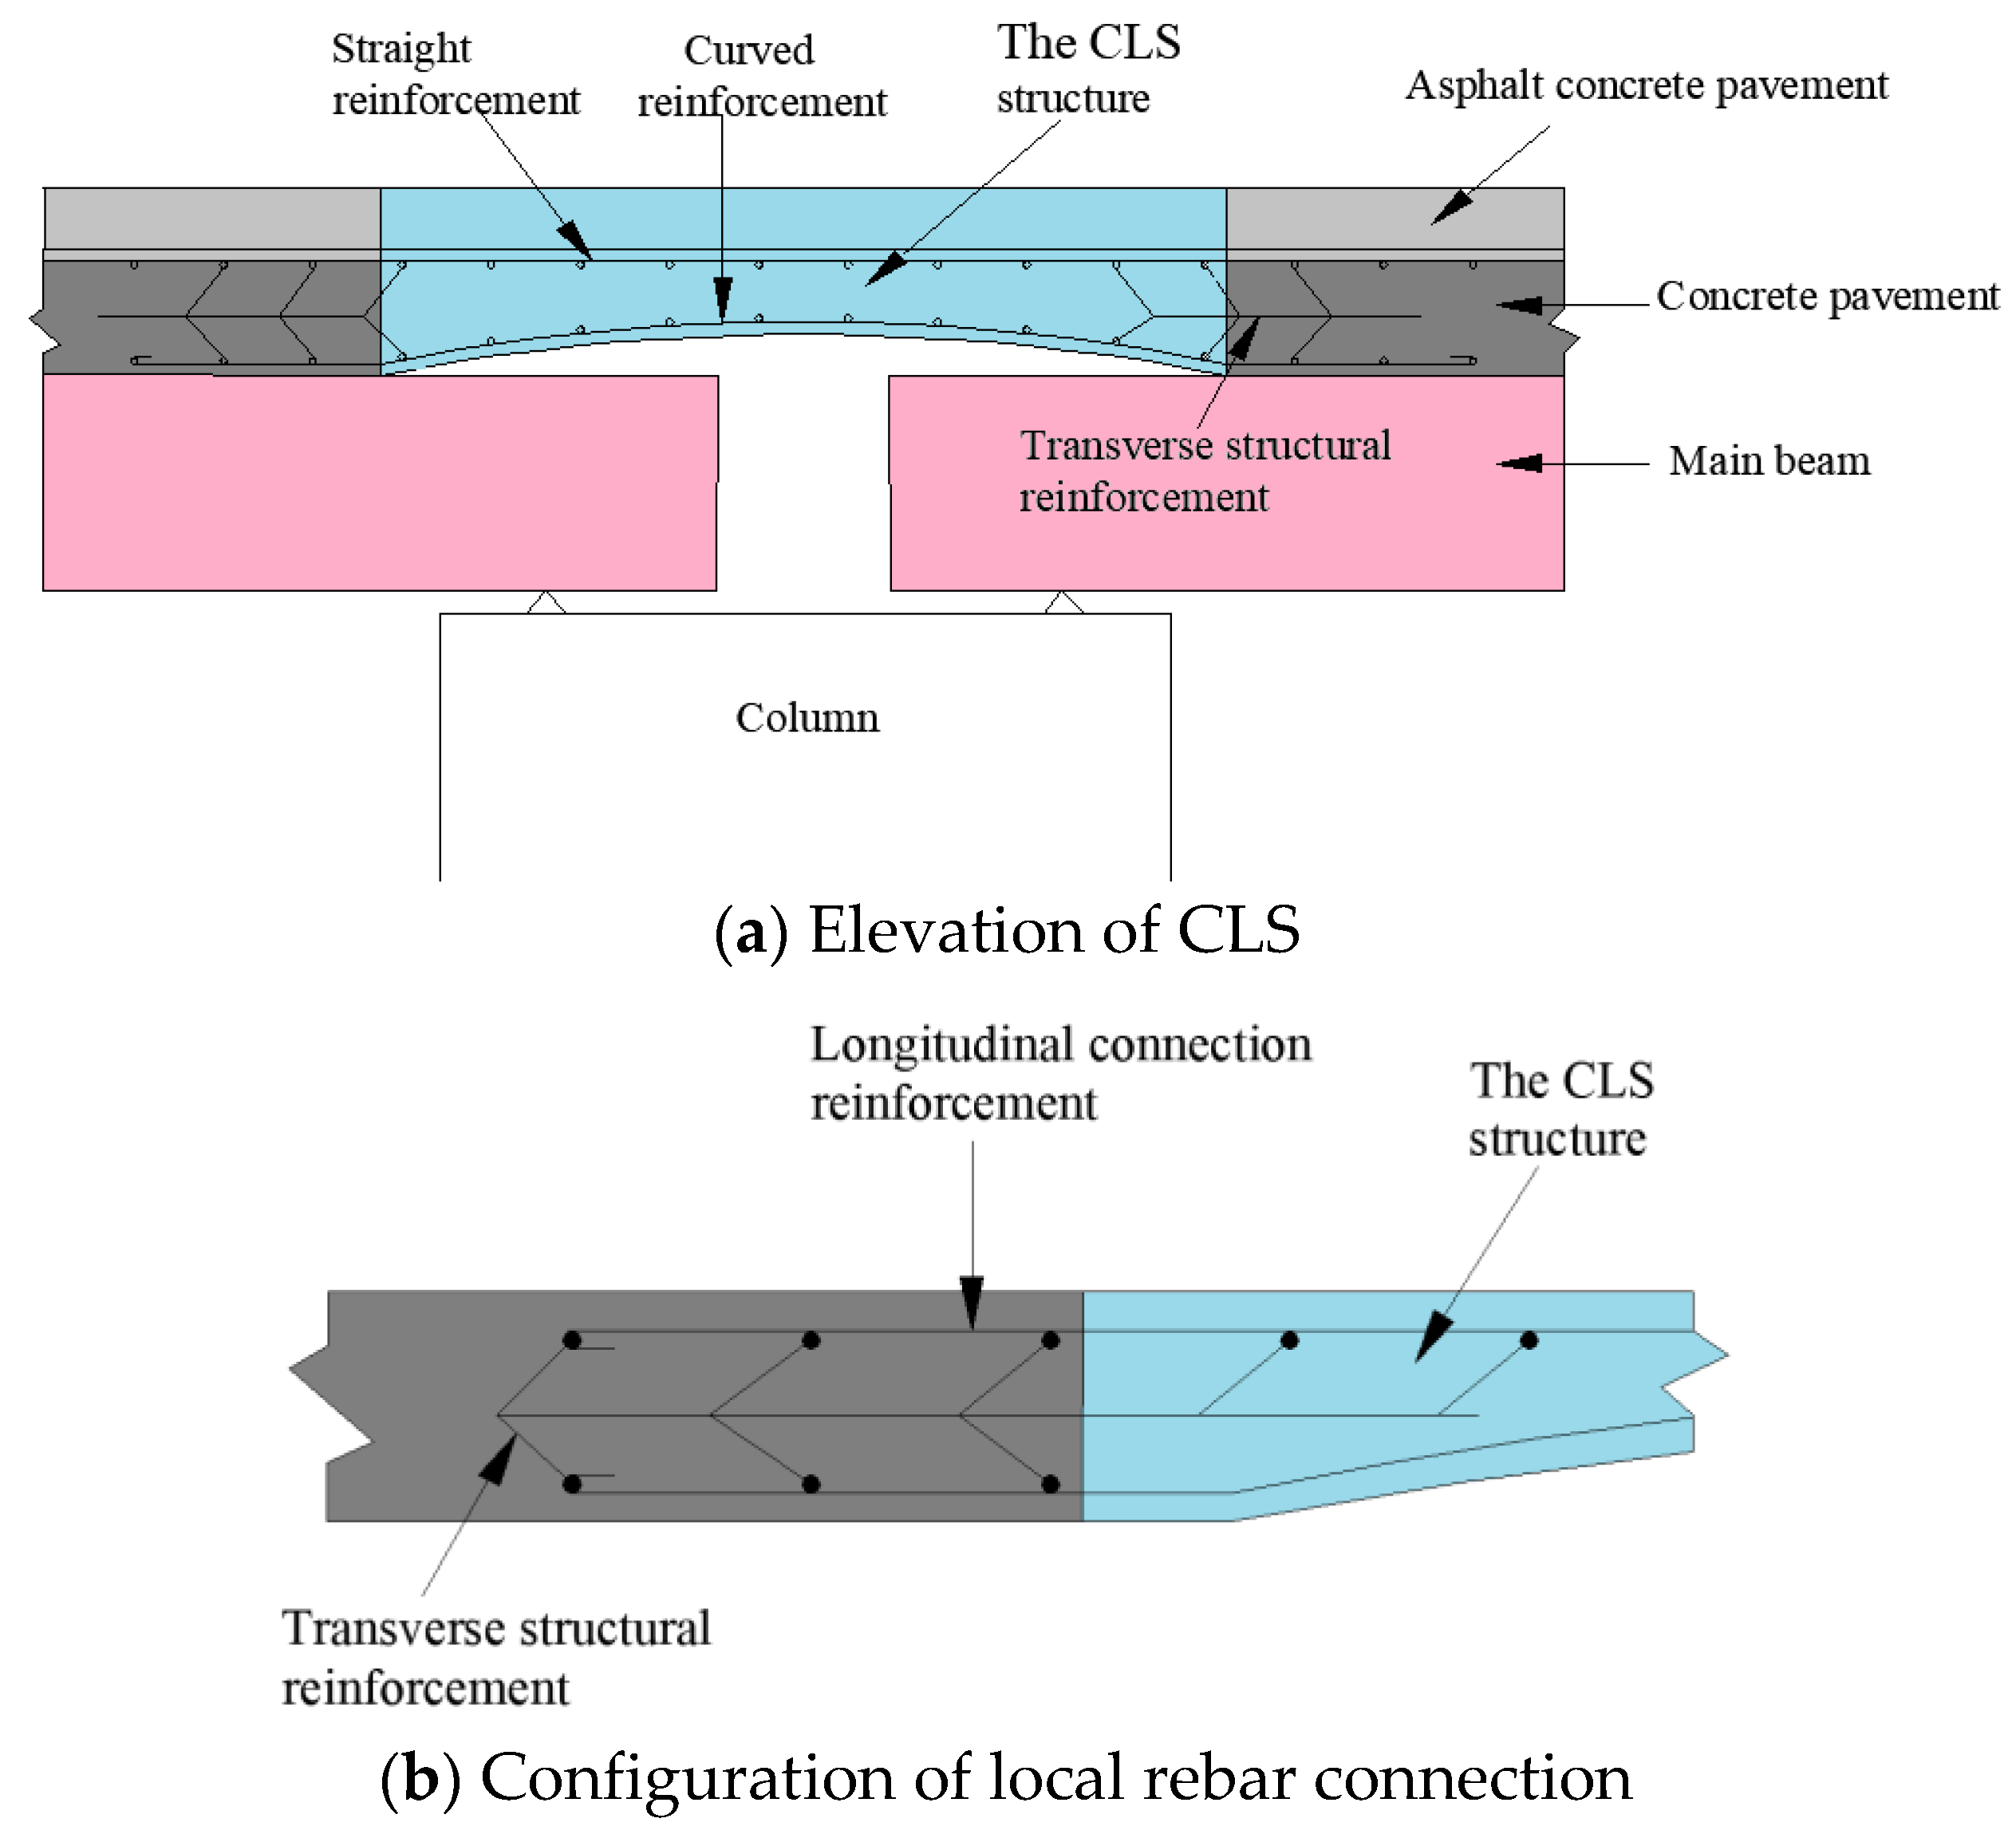
2.1. Overview of CLS

The structure of reinforced concrete CLS is shown in Figure 1, which is mainly composed of longitudinally connecting steel bars, concrete pavement, and asphalt concrete surface layer. The longitudinal connecting steel bars are distributed on the upper and lower edges of the concrete pavement. The upper layer has a straight reinforcement, and the lower layer has curved support. The longitudinal steel bars at the upper and lower edges connect the bridge deck and the link-slab. As shown in Figure 1, the ends of the two adjacent SSBs are connected to achieve continuity and a no-joint deck.

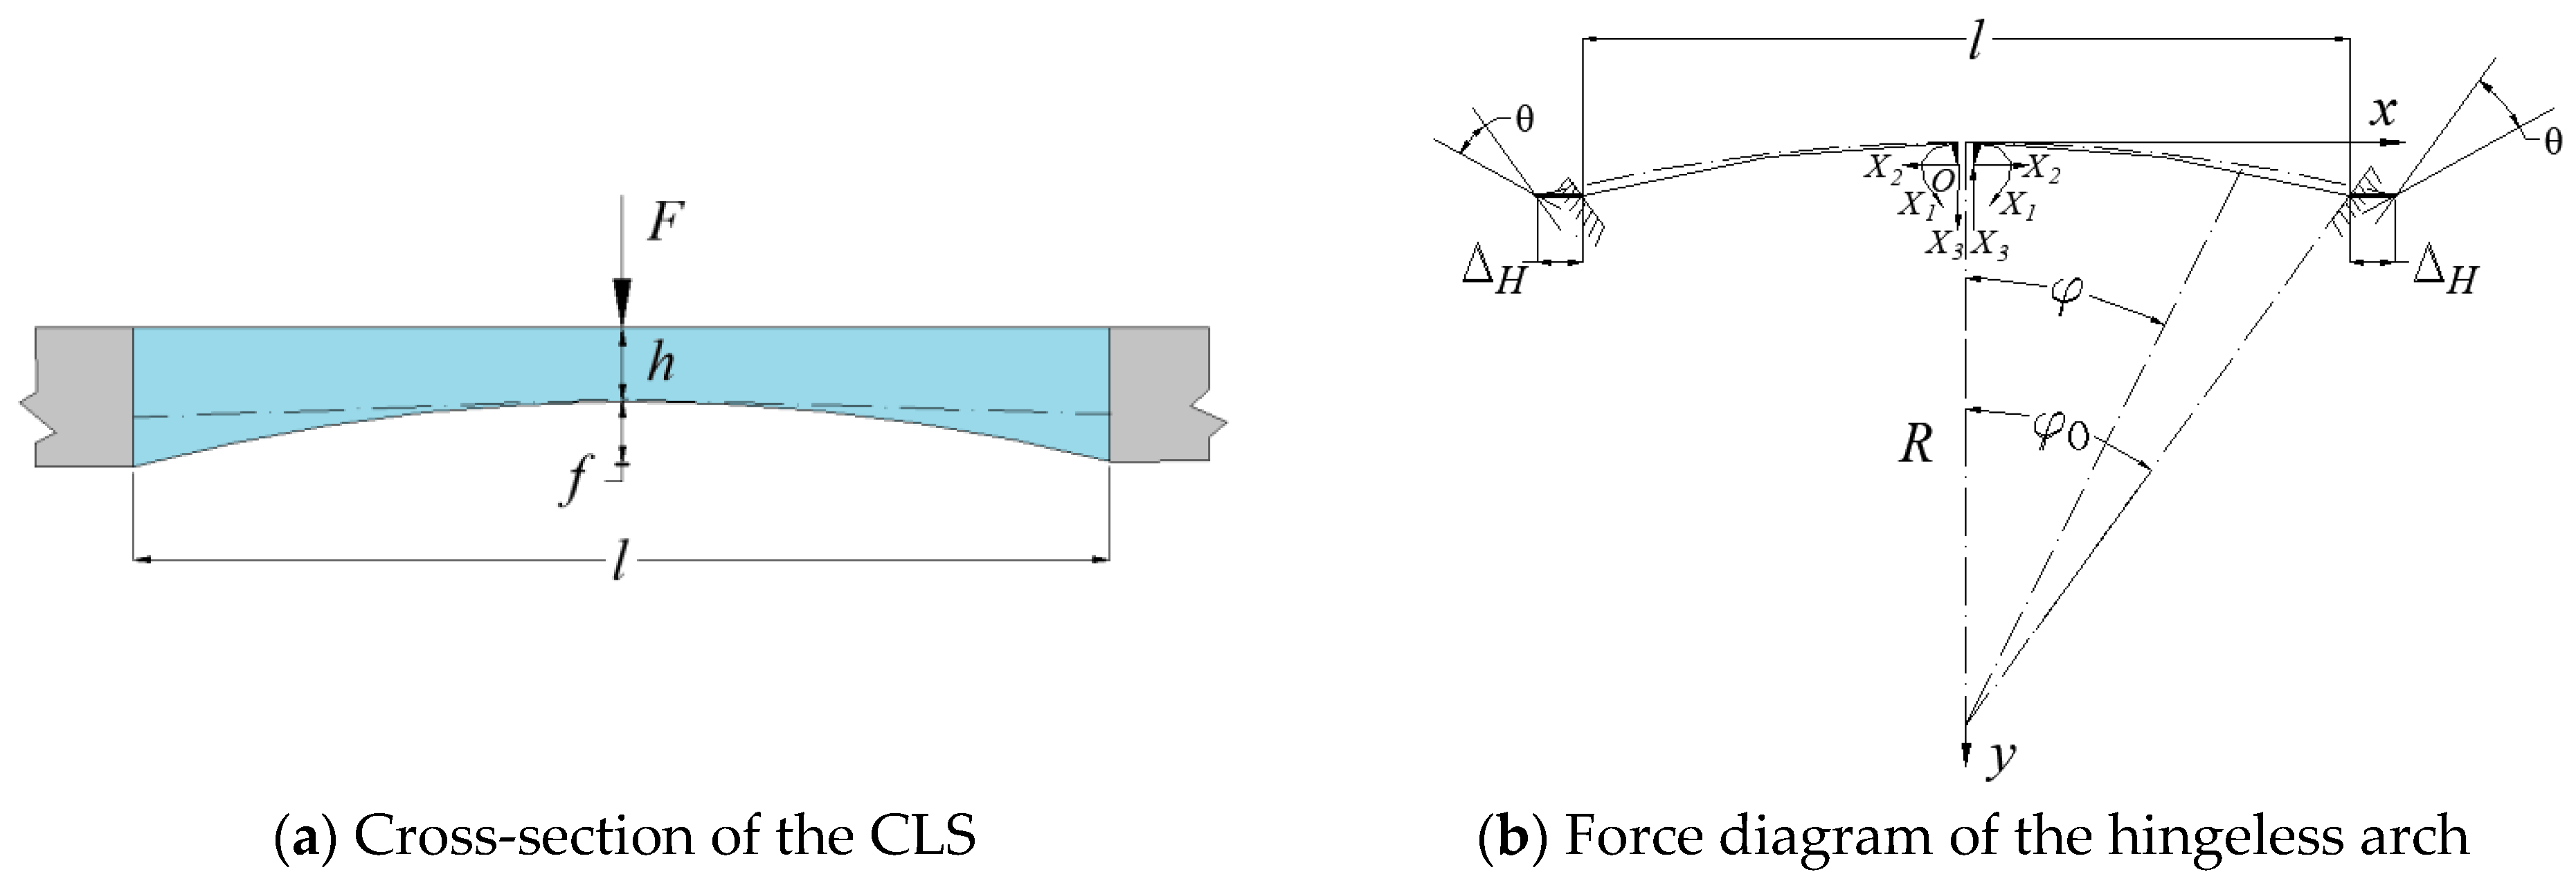
2.1.1. Simplified Hingeless Arch Model

The two ends of the CLS are consolidated with the adjacent SSBs. As a result, the cross-section of the curve structure increases from the dome to the curve foot. The law is consistent with the change in the internal force of the main curve ring so that each cross-section of the primary curve ring can exert maximum strength. Due to the relatively thin thickness of the bridge deck connection and the relatively small sagittal CLS span, the CLS variable cross-section is simplified to a hingeless arch model for mechanical analysis (see Figure 2).

2.1.2. Hingeless Arch Section Characteristics

The CLS cross-section is composed of longitudinally stressed steel bars and concrete. Since the CLS section height varies, the section thickness has its smallest value in the middle of the span. Consider the mid-span section, as shown in Figure 3, where Oc is the neutral axis of the combined cross-section, Osa and Osb are the neutral axes of the upper and lower edges of the steel bar, and B is the calculated width of the section. Let a and b refer to the CLS upper and lower surfaces, respectively. Then, the combined sectional moment of inertia for the CLS mid-span, I, is given by
I = I c + A c ( h 2 h c ) 2 + I s a α E + A s a α E ( h a h c ) 2 + I s b α E + A s b α E ( h b h c ) 2
where   I c = moment of inertia of the concrete section, A c = area of the concrete section, h = height of the mid-span section, hc = distance from the neutral axis of the combined cross-section to the bottom of the cross-section, I s a , I s b = moments of inertia for steel bar section at the upper and lower edge, respectively, Asa, Asb = total area of upper and lower edge steel bars, α E = ratio of the coefficient of the elastic modulus of steel bar to that of the concrete, and ha, hb = distances from the neutral axis of the upper and lower longitudinal bars to the bottom edge of the cross-section, respectively.

2.2. Mechanical Analysis of CLS

2.2.1. Vehicle Loading

As the lower part of the CLS is vacant, the extrusion of the beam end displacement on the link-slab is avoided. Therefore, when the main beam undergoes an angular displacement under vehicle load, due to the restraint between the beam end structures, the CLS will also produce the same angular displacement, as shown in Figure 4. In the figure, L1 is the calculated span of the main beam, H is the height of the main beam, θ is the angular displacement at the main beam end, ΔH is the longitudinal displacement of the CLS due to the corner of the beam end, and l is the CLS span length, e is the distance from the bridge support to the beam end, C is the gap between the adjacent main beams, and d is the distance between the arch foot and the support.
As the CLS has less restraint on the main girder, the CLS’s restraint on the main girder can be ignored and a single-span SSB bridge approximated. The structural mechanic’s diagram multiplication method is used to calculate the maximum angular displacement of the beam end as
θ = L 1 6 E 1 I P i ( L 1 l i ) { 1 ( L 1 l i ) 2 L 1 2 }
where E1 = elastic modulus of the main beam at the left end, I = moment of inertia of the main beam section, Pi = vehicle axle load, and li = distance between vehicle axle load Pi and the beam end A.
As the angular displacement θ of the beam end is small when the vehicle is loaded, the longitudinal displacement value of the CLS is approximated as the arc length ΔH of the angular displacement, namely:
Δ H = θ 180 π H 2 + ( e l c 2 ) 2
The distance ys from the elastic center to the vault can be calculated by the elastic center method as
y s = y E I d s 1 E I d s = 2 0 φ 0 R ( 1 cos φ ) R d φ 2 0 φ 0 R d φ = R ( φ 0 sin φ 0 ) φ 0
When the hingeless arch feet produce relative displacements, as shown in Figure 2b, the corresponding angular displacement Δ1c, horizontal displacement Δ2c, and vertical displacement Δ3c will occur at the elastic center O. Solving the unknown force at the center of elasticity, then
      { X 1 = 2 θ 2 0 φ 0 1 E I R d φ X 2 = 2 ( f y s ) + 2 Δ H 2 M ¯ 2 2 E I d s + 2 F ¯ N 2 2 E A d s X 3 = l θ 2 0 φ 0 x 2 E I R d φ
where X1 is the bending moment, X2 is the horizontal force, and X3 is the vertical force. The bending moment of the CLS’s vault section and the stress at the upper and lower surfaces are given by
{ M = X 1 X 2 ( y s + h c h 2 ) σ a = M W o a = M I t / ( h h c ) σ b = M W o b = M I t / h c
The stress σs produced by the axial force X2 is given by
σ s = X 2 A 0
Therefore, the stresses at points a and b under a load of a mid-span vehicle are given by
{ σ q a = σ a + σ s σ q b = σ b σ s            

2.2.2. Vehicle Braking Force

An SSB bridge can be regarded as a continuous structural system when the longitudinal horizontal force acts on it. In addition to the stress caused by the overall temperature change, the longitudinal horizontal external force also influences the vehicle braking force on the safety of the bridge superstructure piers and supports. The braking force of each car on the continuous SSB bridge is given by
      F z = F i × K i K i
where Fz = vehicle braking force, Fi = braking force of each abutment, and Ki = integrated thrust stiffness of the i-th bearing and abutment.
Since the longitudinal horizontal force at the beam end is transmitted through the CLS and the bearing, the CLS will deform longitudinally under the vehicle braking force. When the vehicle braking force acts on the right span of the main beam, it can be regarded as adding a horizontal elongation displacement ΔL at the right end of the hingeless arch. That is,
Δ L = F z K i
where   Δ L = horizontal displacement of CLS under braking force. The unknown force at the center of elasticity is solved as
{ X 1 = 0 X 2 = Δ L R 3 E I ( φ 0 2 sin 2 φ 0 φ 0 + sin φ 0 cos φ 0 ) + R E A ( φ 0 + sin φ 0 cos φ 0 ) X 3 = 0
Substituting Equation (11) into Equations (7) and (8), the stresses at points a and b on the CLS’s upper and lower surfaces under the vehicle braking force on the right span are given by
{ σ y k a ( σ z k a ) = σ a + σ s σ y k b ( σ z k b ) = σ b σ s        
Note that under the vehicle braking force on the left span, the CLS’s deformation is opposite to that of the right-span vehicle.

2.2.3. Temperature Gradient

Under a positive temperature gradient, the main beam is thermally expanded and elongated, arched upward, and deflected downward at its end, resulting in a clockwise angular displacement θz. In contrast, the structural deformation is the opposite under a negative temperature gradient, resulting in a counterclockwise angular displacement θf.
The main girder changes linearly along the girder height under the temperature gradient and uniformly along the longitudinal and transverse bridge directions. According to the flat section’s assumption, the main beam’s neutral axis curvature after bending and deformation under the temperature gradient remains unchanged along the longitudinal direction, and the neutral axis curvature is β (Shao et al., 2019). Thus, the beam end angular displacement θ can be obtained:
θ = L 1 2 α I H T ( H ) b ( H ) ( H H c ) d H
where α = linear expansion coefficient of concrete, which is taken as 1.05 × 10⁻⁵/C, I = moment of inertia of the main beam section, T(H) = temperature change function of the main beam section, b(H) = function of the width of the main beam section along the beam height, Hc = distance from the center of the main beam section to the bottom of the beam, and H = height of the main beam section.
The force law equation is established, and the unknown force at the center of elasticity is solved as:
{ X 1 = E I θ R φ 0 X 2 = 2 ( y s f ) 2 Δ H R 3 E I ( φ 0 2 sin 2 φ 0 φ 0 + sin φ 0 cos φ 0 ) + R E A ( φ 0 + sin φ 0 cos φ 0 ) X 3 = l θ R 3 E I ( φ 0 sin φ 0 cos φ 0 )
Substituting Equation (14) into Equations (7) and (8), the stresses at points a and b on the CLS upper and lower surfaces under the positive (negative) temperature gradient are obtained as
    { σ z w a ( σ f w a ) = σ a + σ s σ z w b ( σ f w b ) = σ b σ s      

2.2.4. Overall Temperature Change

The overall temperature difference of the environment also has a prominent effect on the deformation of the bridge structure. The bridge deforms uniformly under the effect of the overall temperature change. When the overall temperature is higher than the closing temperature of the bridge deck, the beams elongate, and when the temperature is lower than the closing temperature, the beams shrink. For a single-span simply supported girder bridge, when the overall temperature changes uniformly, the deformation of the CLS ΔH is twice the shrinkage deformation of the single-span main girder, namely:
Δ H = 2 Δ L = 2 α Δ t L
where Δt = difference between the calculated and ambient temperatures when the bridge is closed, and L = span of the SSB. Then, the unknown force at the center of elasticity is solved as
{ X 1 = 0 X 2 = 2 α Δ t L R 3 E I ( φ 0 2 sin 2 φ 0 φ 0 + sin φ 0 cos φ 0 ) + R E A ( φ 0 + sin φ 0 cos φ 0 ) X 3 = 0
Substituting Equation (17) into Equations (7) and (8), the stresses at points a and b on the CLS’s upper and lower surfaces are given by
{ σ j a ( σ s a ) = σ a + σ s σ j b ( σ s b ) = σ b σ s                          
Note that when the beam is heated as a whole, the bridge deck has a continuous deformation.

2.3. Stress Combination on CLS

The stress formulas of the CLS under vehicle loading, vehicle braking force, temperature gradient, and overall temperature change were previously derived, and the stresses under the critical load conditions were combined (MTPRC, 2015) as shown in Table 1 [17,18].

3. Numerical Analysis of CLS and FLS

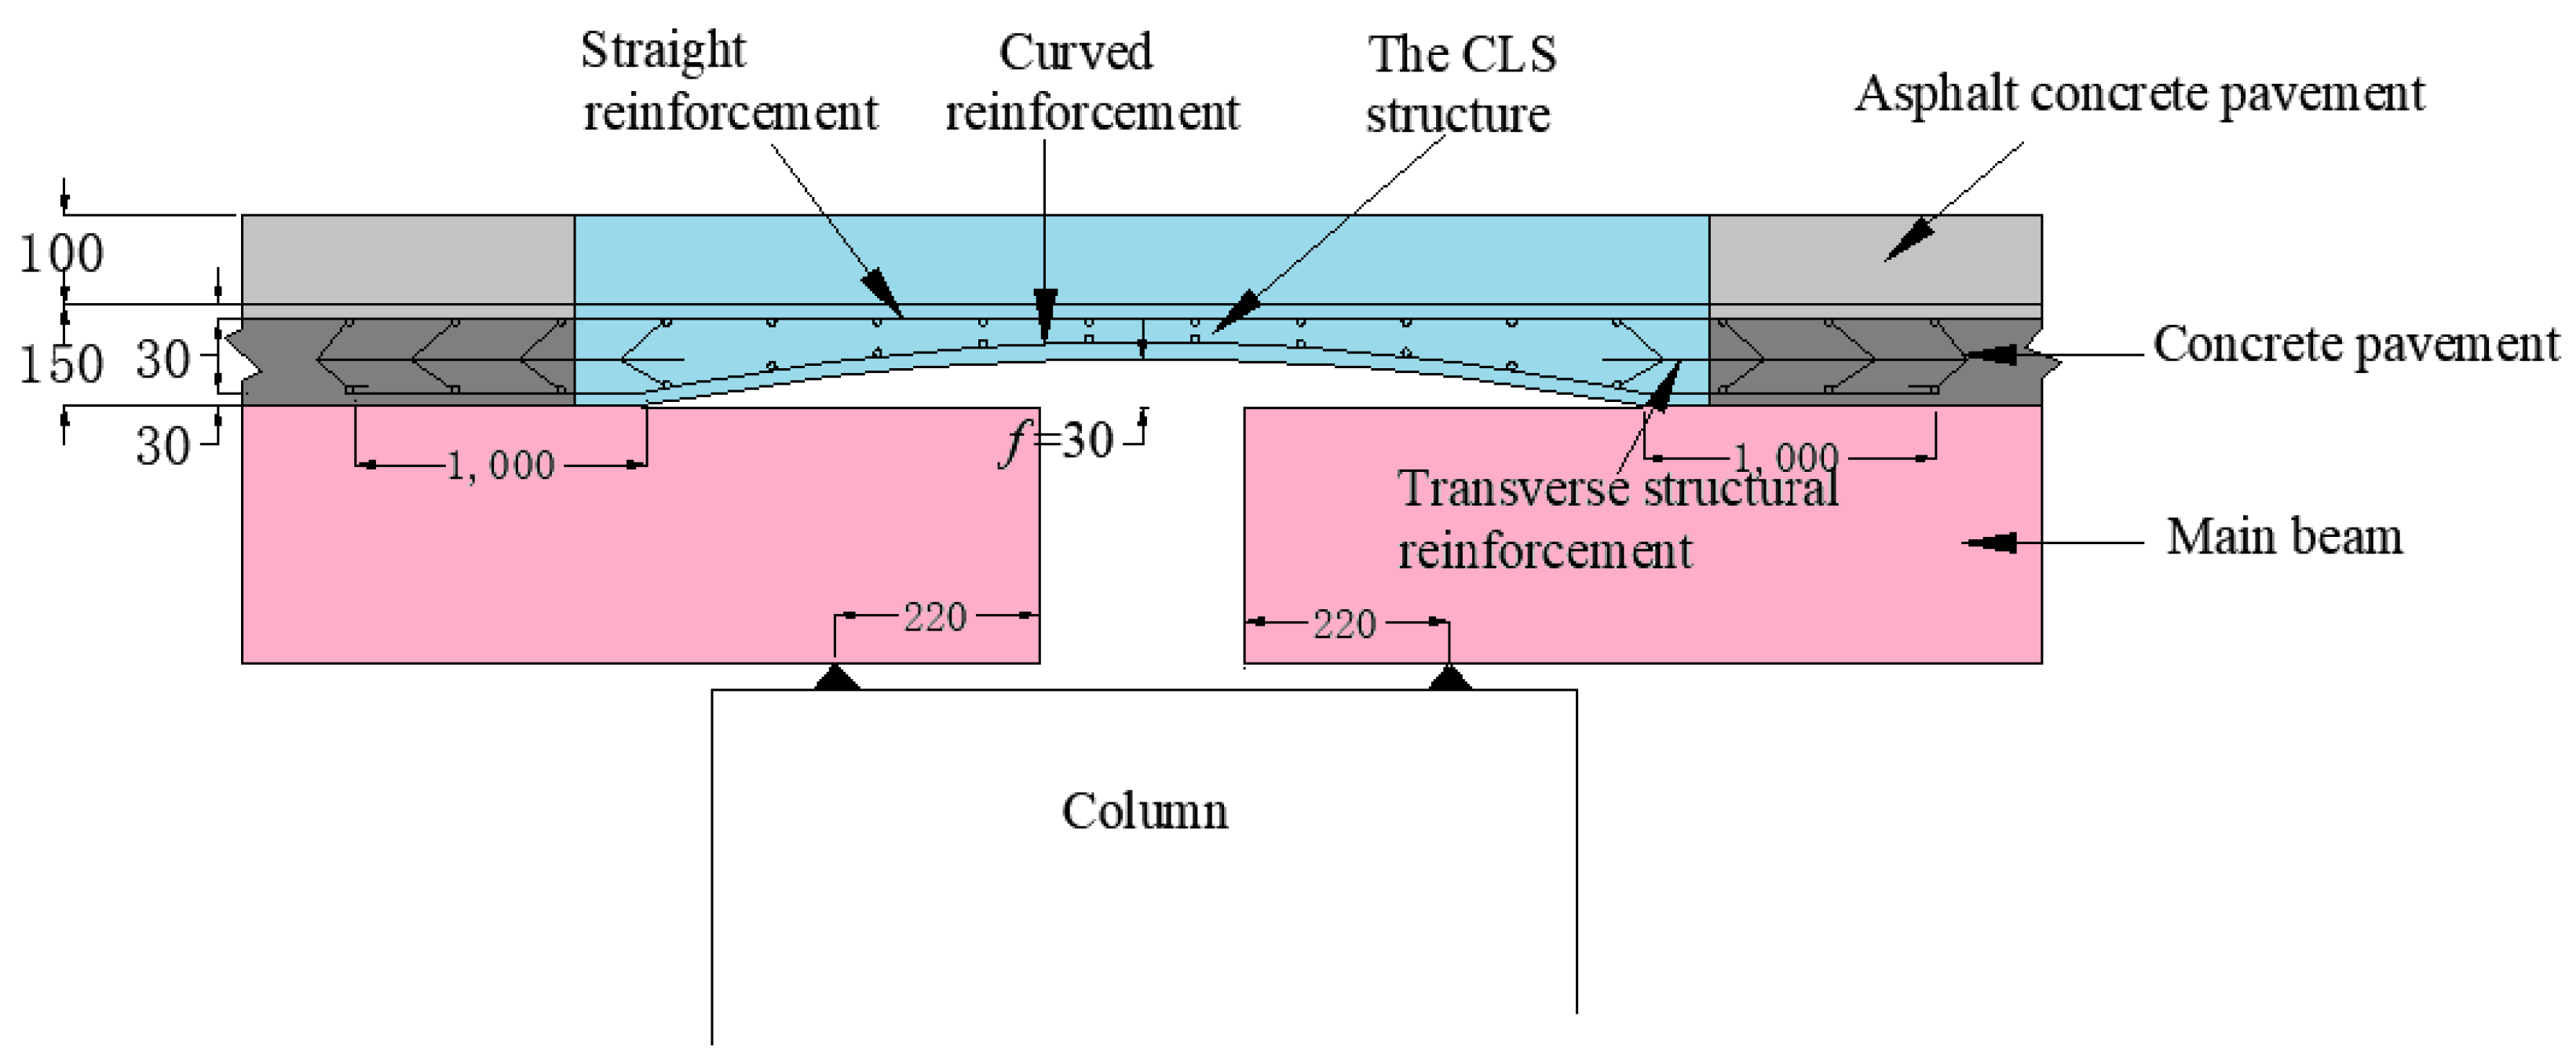
3.1. Project Overview

A two-span prestressed concrete T-shaped simply supported girder bridge was selected as the engineering support background to compare the mechanical characteristics of the CLS and FLS. The bridge has a span of 20 m in a particular area of China. The actual engineering bridge with FLS and the bridge with the CLS structure were modeled, the numerical analysis was performed, and the two link-slab structures were compared. The longitudinal bridge section and mid-span cross-sectional views are shown in Figure 5. The CLS is set at Pier 1, and the distance between the adjacent main girder beam ends is 8 cm. The middle beam is 1.7 m wide, the side beams are 2.025 m wide, and the beam height is 1.5 m. The single bridge deck comprises 7 T-beams, and each main girder is equipped with two plate rubber bearings. The distance between the center of the support and the edge of the beam end is 0.22 m. The CLS is shown in Figure 6. The section of the bridge link-slab is densely arranged with steel bars. The steel bars are HRB335 steel bars with a diameter of 16 mm, and the spacing between the bars is 100 mm.

3.2. Finite Element Modeling
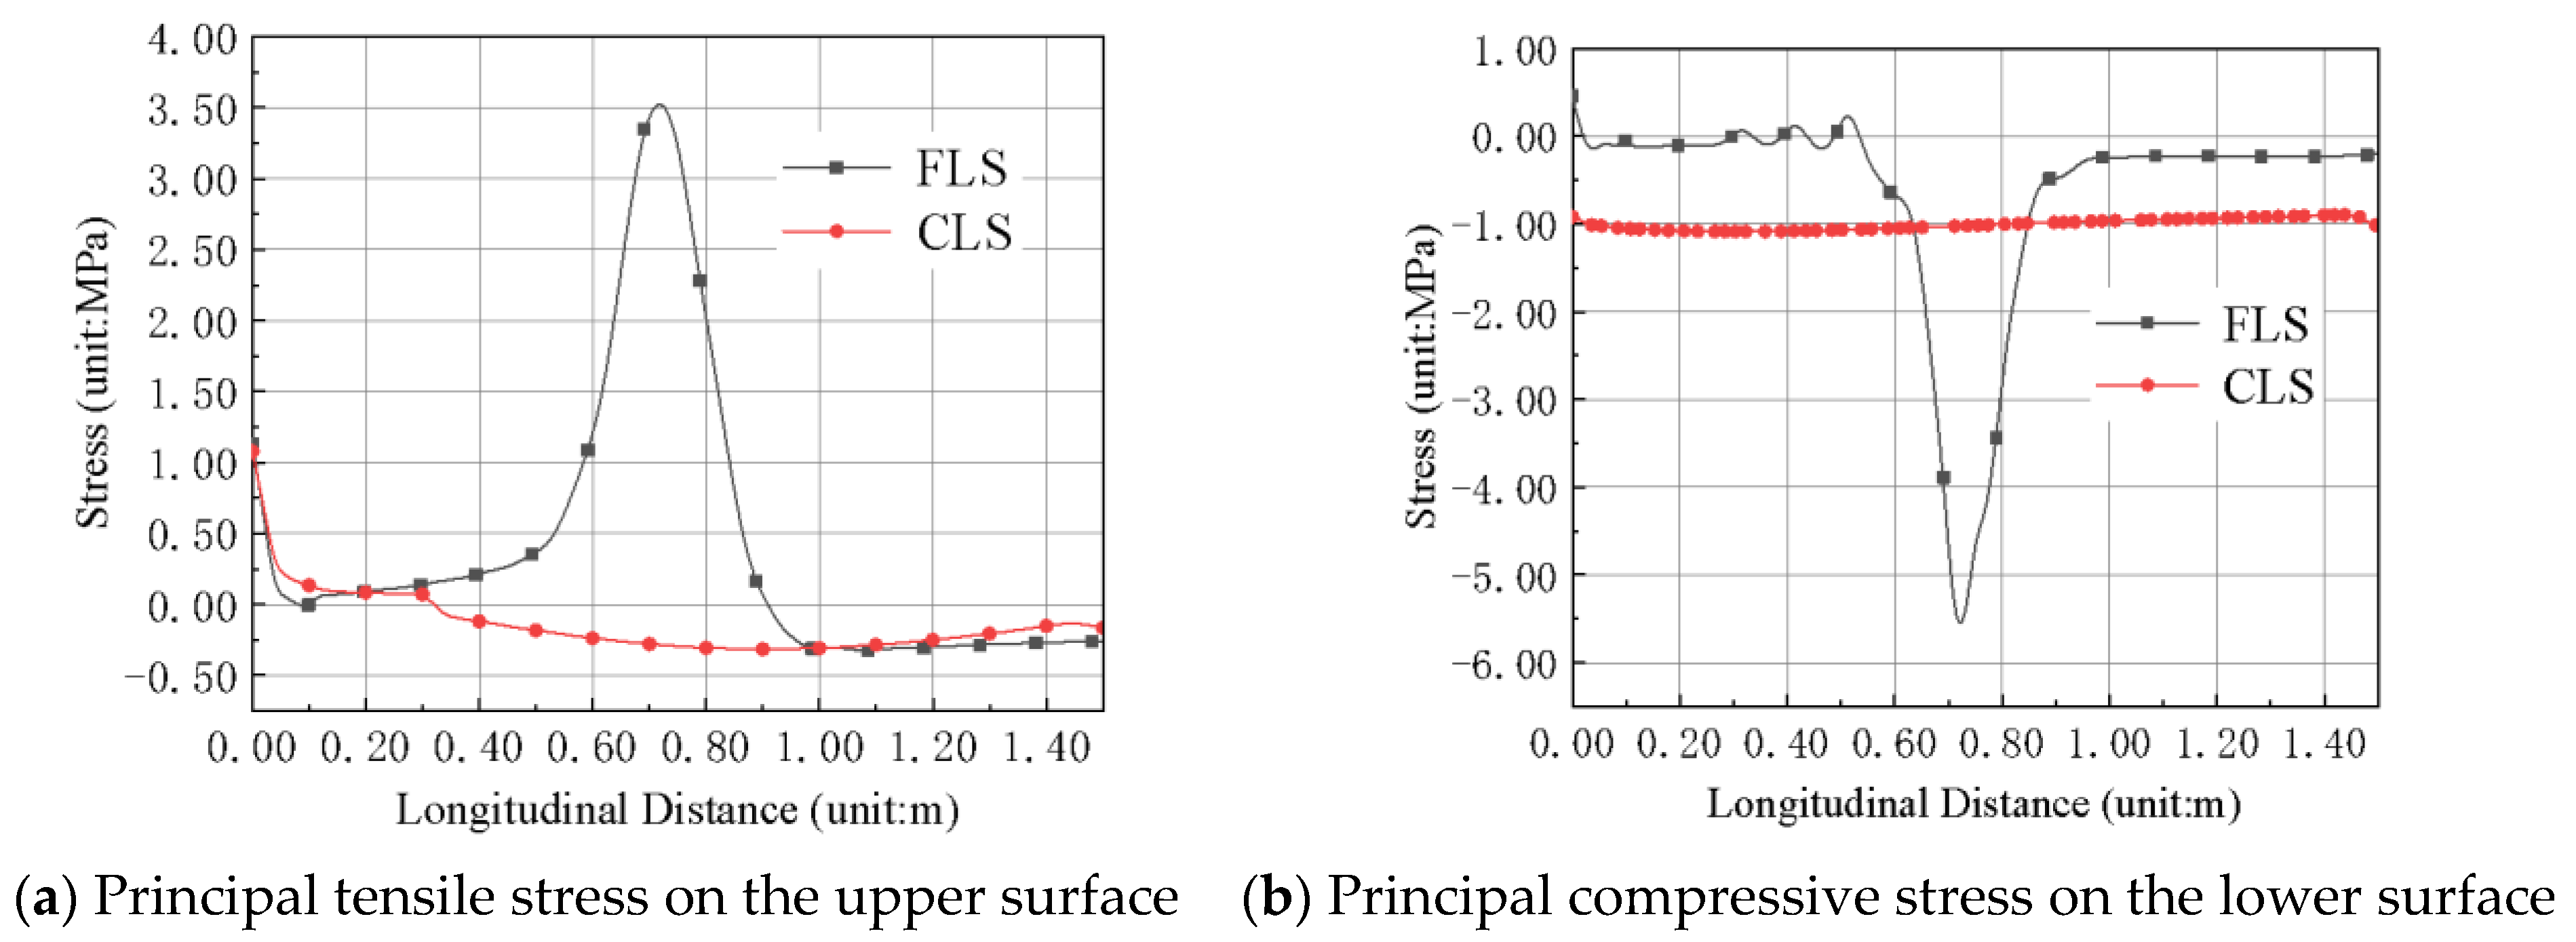
The bridge substructure is of little significance in analyzing the mechanical performance of the link-slab structure. Therefore, the model bridge only establishes the FLS and CLS structures. The model numerically analyzes the mechanical performance of the link-slab under different load conditions. ABAQUS was used to model the single middle beam of the superstructure of the SSB bridge. The model was divided into a total of 91,173 elements.
In the overall coordinate system of the model, the X-axis direction is the longitudinal bridge direction, and the Y-axis direction is the beam height direction. The Z-axis direction is the transverse bridge direction, Since the main objective of this paper was the concrete pavement layer of the link-slab, the main girder end of the link-slab was refined when the main girder was gridded so that the analysis of the structure of the link-slab could be more accurate. The mesh size was 0.4 m along the non-link-slab section, 0.05 m along the link-slab, 0.05 m in the cross-section of the main beam. The grid division results are shown in Figure 7. The concrete structure was simulated by a hexahedral linear reduction integral unit (C3D8R). The element type used for prestressed steel strands and steel bars was a two-node three-dimensional truss element (T3D2). The beam end support of the main beam was a plate rubber support. The support was simulated using a three-way grounding spring element.
ABAQUS needs to give the corresponding intrinsic model for different materials to reflect the stress–strain relationship between various materials when performing finite element calculations. In this study, the C50 concrete plastic damage model was used for the CLS in the calculation model, and the values of the intrinsic model parameters are shown in Table 2. The ideal elastic-plastic principal structure model shown in Table 3 was used for the prestressed and common steel bars.
The bearing at the end of the main beam was a plate rubber bearing, and the bearing was simulated using a three-way grounded spring unit. The thrust stiffness of the bearing in the transverse and longitudinal directions was calculated as 1429 kN/m, and the vertical compressive stiffness was 457.6 MN/m.

3.3. Data Analysis

Since only the elastic analysis was performed on this study’s FLS and CLS structures, only the materials’ elastic modulus, density, and linear expansion coefficient are defined when setting the material properties in the modeling process. The yield of the steel bar and the stress–strain relationship of the material change linearly. The elastic analysis process considers the FLS and CLS results under loading conditions, such as the second phase dead load, highway class I lane load, vehicle braking force, overall temperature change, and temperature gradient. Additionally, the comparison and analysis of the FLS and CLS numerical results are carried out. Given the length of the space, when the vehicle braking force is on the left span of the main girder, the overall cooling change and the positive temperature gradient and other load conditions can be used for similar analysis.

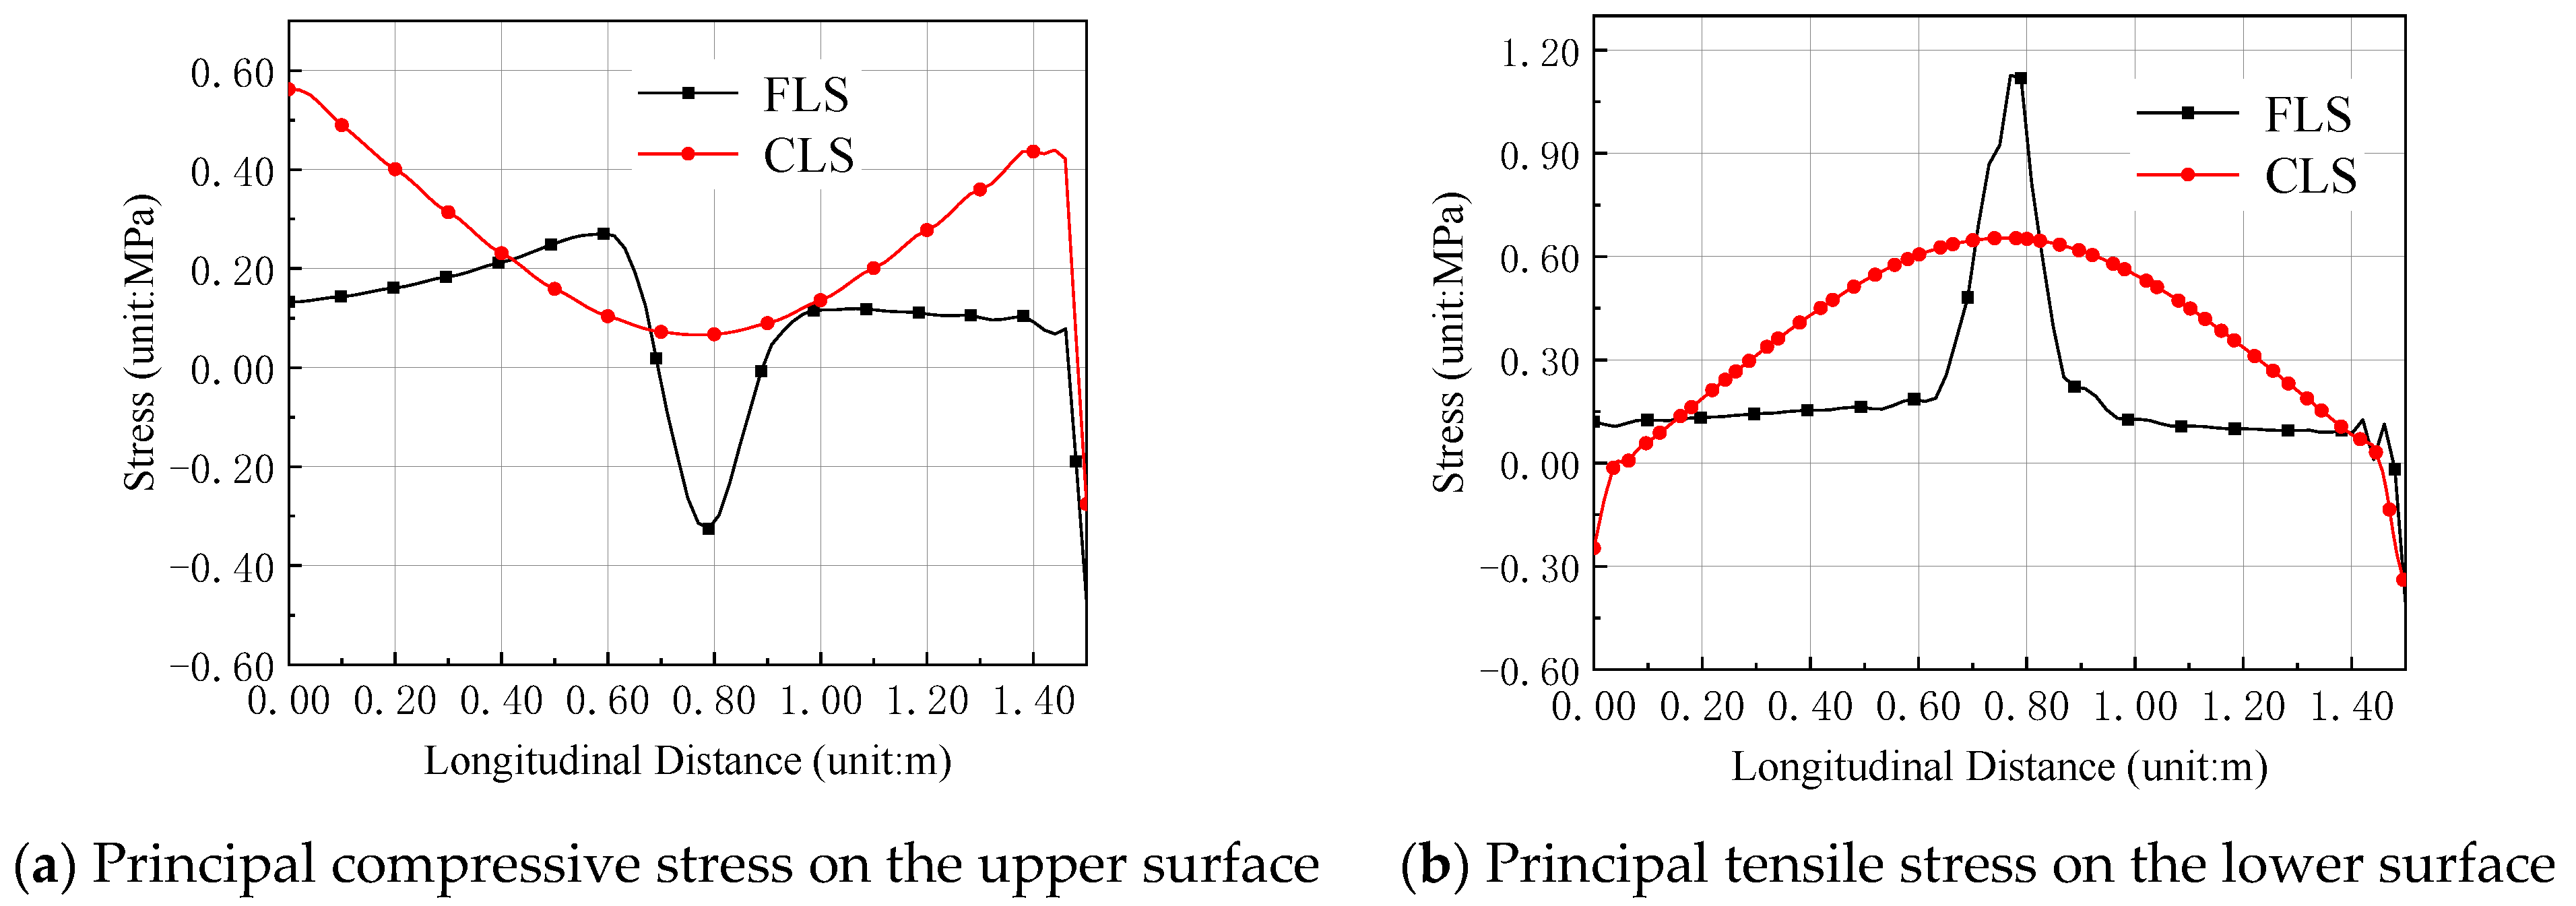
3.3.1. The Second Phase Dead Load

As noted in Figure 8, under the second phase dead load, the FLS produces stress concentration in the middle of the span. The tensile stress on the upper surface and compressive stress on the lower surface gradually gently decrease from the mid-span to the ends. The main tensile stress at the mid-span is 2.61 MPa and the main compressive stress at the mid-span is −3.81 MPa; both are less than the ultimate strength of concrete. Under the second phase dead load, for the CLS, the stress on its upper surface and the stress on its lower surface gradually increases from the mid-span to the two ends, the principal compressive stress at the mid-span is −0.39 MPa, and the main tensile stress is 0.22 MPa. The main compressive stress at the mid-span is −0.62 MPa, and the main compressive stress at the beam end is −1.25 MPa. Since there is no tensile stress in the weak part of the link-slab, no cracking at this part is expected.

3.3.2. Highway Class I Lane Load

Figure 9 shows that under the highway class I lane load, the FLS deformation and stress mode are similar to the second phase dead load. The tensile stress on the upper surface and compressive stress on the lower surface gradually decreases from the mid-span to the ends. The main tensile stress in the mid-span is 3.51 MPa, which is greater than the tensile limit value of the concrete, so the upper surface of the mid-span part is cracked. The principal compressive stress at the mid-span is −5.54 MPa. The upper surface stress of the CLS gradually increases from the mid-span to the end, where the concentrated load is applied and reaches the maximum at the connection section between the link-slab and bridge deck. The maximum tensile stress is 1.23 MPa, which is less than the tensile limit of concrete. The principal compressive stress at the mid-span part is −0.29 MPa. The lower surface stress change tends to be gentle, almost unchanged, presenting the principal compressive stress at the mid-span part of −1.02 MPa.

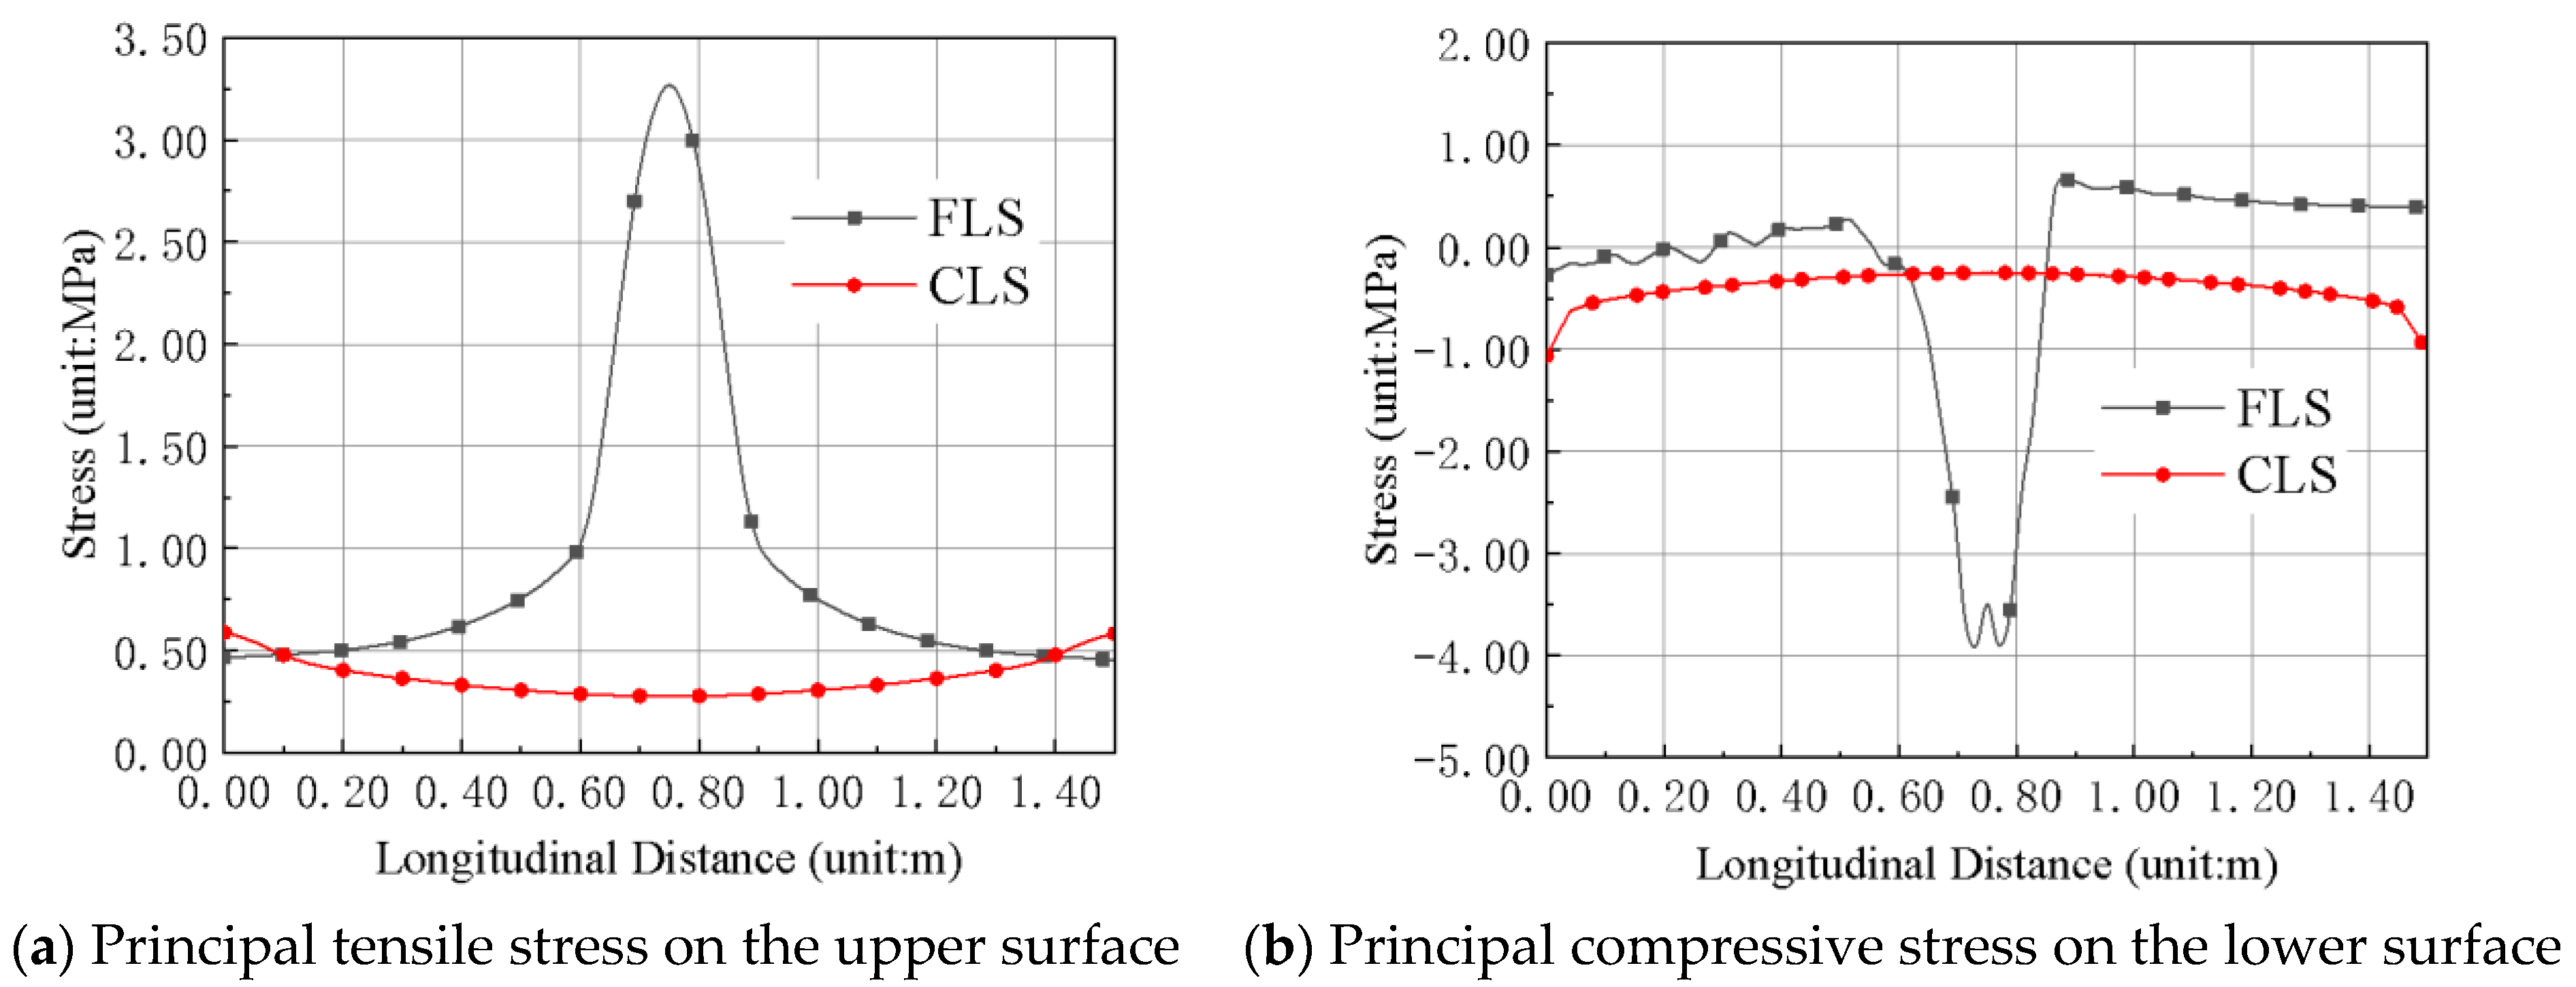
3.3.3. Vehicle Braking Force (Right Span)

Figure 10 shows that when the vehicle’s braking force acts on the right span of the adjacent main girder, the upper surface of the FLS is compressed, with a main compressive stress of −0.36 MPa. The lower surface is under tension, experiencing the main tensile stress of 1.09 MPa. The upper surface of the CLS is under tension, and the stress distribution gradually increases from the mid-span to the ends. The main tensile stress at the mid-span part is 0.57 MPa, and the maximum normal stress is 0.57 MPa. The lower surface is also under tensile stress, and the distribution gradually decreases from the middle of the span to both ends. The main tensile stress of the middle part of the span is 0.65 MPa. Both of these values are less than the ultimate strength of concrete, which does not lead to the link-slab cracking.

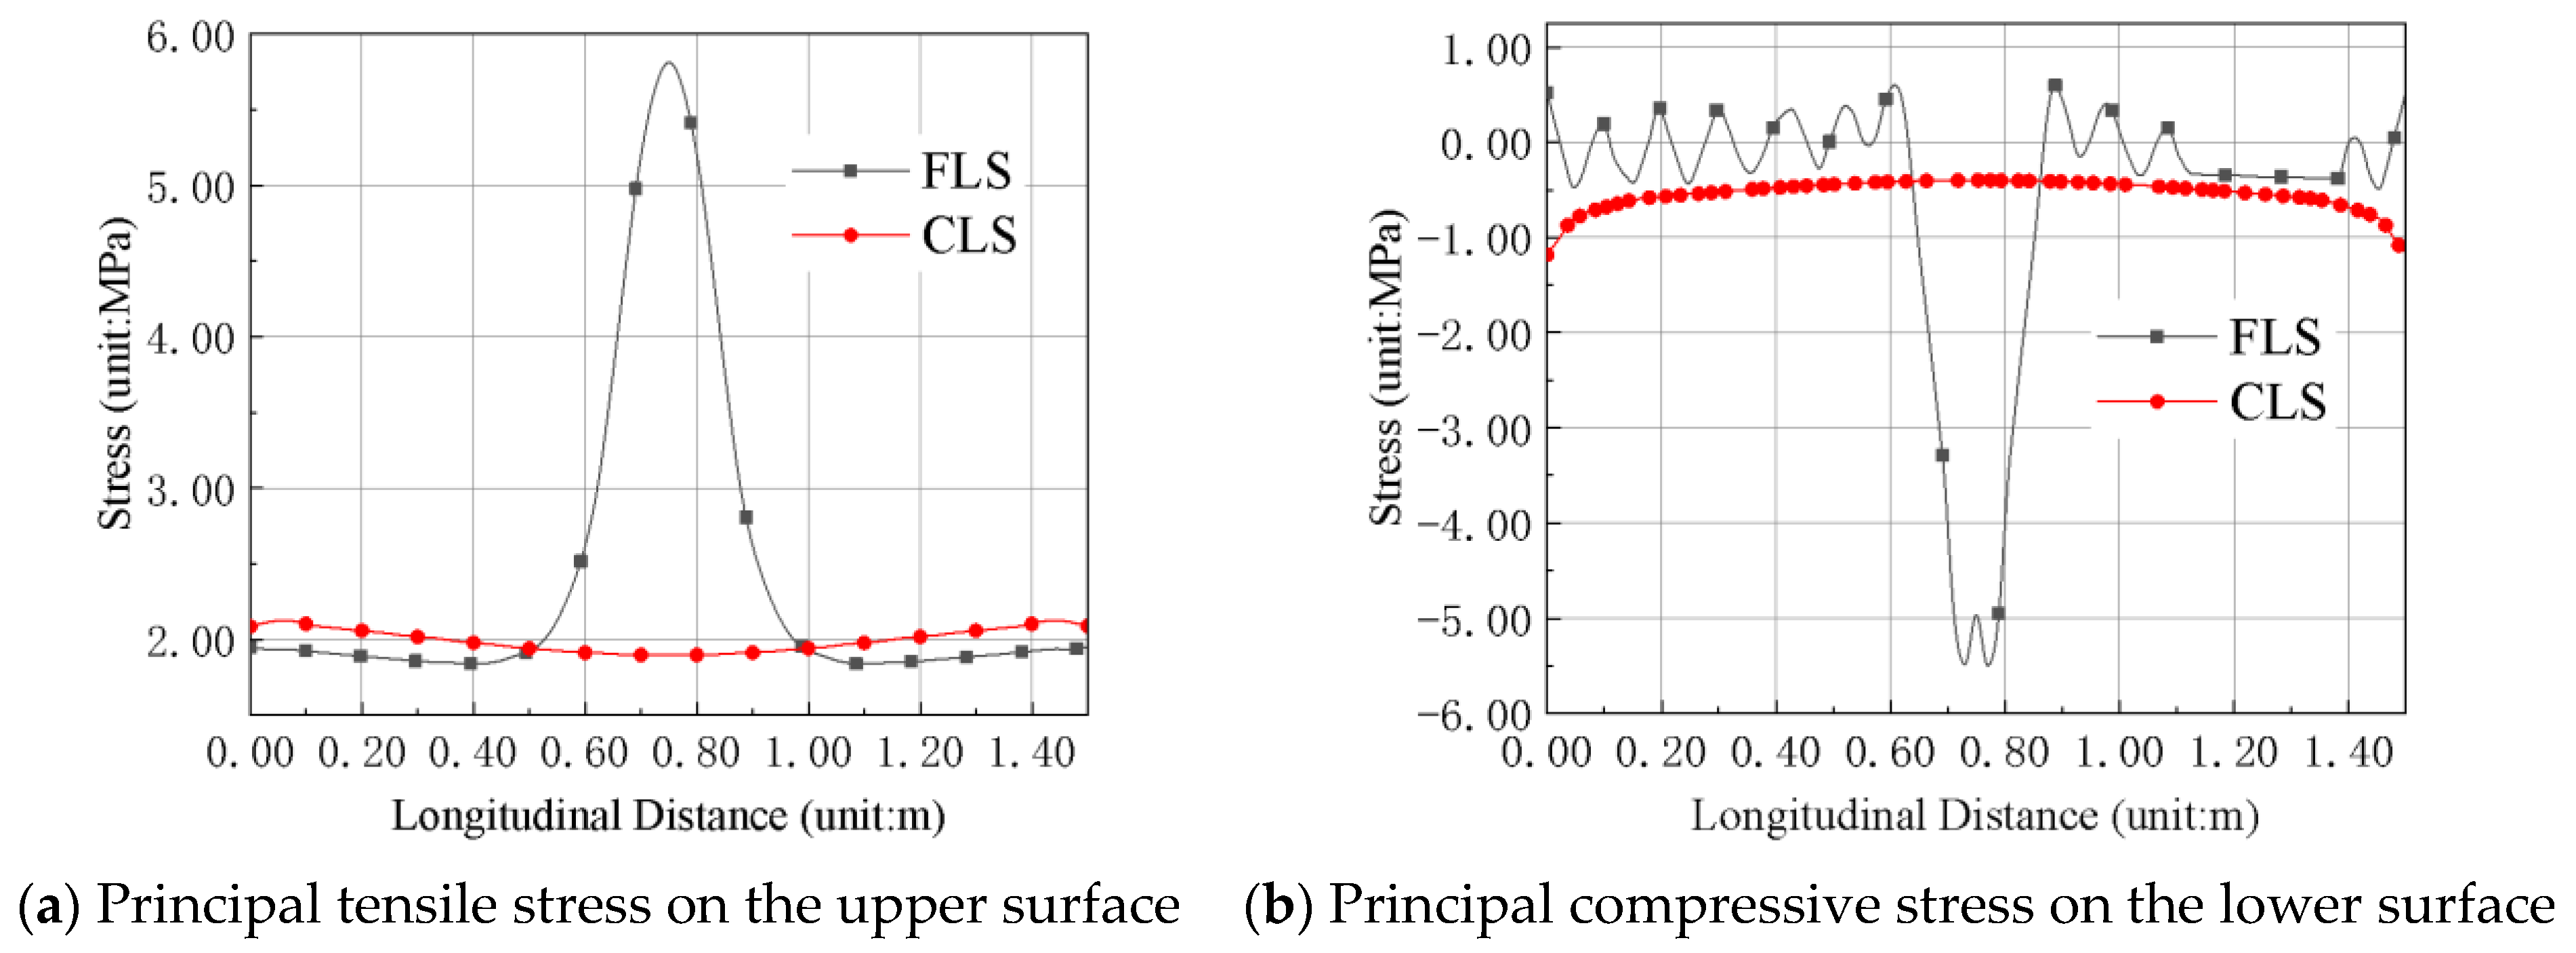
3.3.4. Overall Heating (15 °C)

Figure 11 shows that when the overall temperature of the bridge superstructure is increased by 15 °C, the FLS produces stress concentration at the mid-span part, and its upper surface is under tension. The tensile stress distribution gradually decreases from the mid-span to the ends and tends to be gentle. The main tensile stress at the mid-span part is 3.27 MPa, which is greater than the concrete’s tensile limit value, and the cracks appear on the upper surface in the middle of the span. The lower surface is compressed, the main compressive stress is −3.91 MPa. The CLS is tensioned on the upper surface of the mid-span part, and its tensile stress distribution gradually increases from the mid-span to the ends. The main tensile stress at the mid-span is 0.27 MPa. The principal tensile stress at the CLS end is 0.59 MPa, which is less than the tensile limit of concrete, where the lower surface is compressed, with a small stress variation along the CLS. The principal compressive stress at the mid-span part is −0.45 MPa.

3.3.5. Negative Temperature Gradient

From Figure 12, in the FLS, the principal tensile stress on the upper surface of the mid-span part is 5.81 MPa, which is greater than the tensile limit of concrete, and cracks appear. The principal compressive stress on the lower surface is −5.43 MPa. For CLS, the principal tensile stress on the upper surface mid-span is 1.90 MPa, which is less than the tensile limit of concrete. The principal compressive stress on the lower surface mid-span is −0.40 MPa, and the variation range of stress change is small.
This comparison shows that, under different load conditions in the longitudinal direction of the bridge, the FLS pavement has the most stress change in the middle of the span where it reaches a peak value. This value is greater than the tensile strength of the concrete, resulting in cracks on the bridge deck. The CLS structure dramatically reduces the contact and the squeezing effect of the concrete at the main beam end on the bridge deck, as well as the stress of the CLS’s concrete pavement. The stress distribution of the CLS pavement is controlled within the range of concrete strength, thus effectively preventing the cracking of the bridge deck.

4. Sensitivity Analysis of CLS

Many studies have shown that, without changing the bridge type and load conditions, the CLS mechanical properties’ factors include reinforcement ratio, pavement thickness, surface material, and the CLS span. A numerical analysis of different parameters was conducted to determine the influence on the CLS’s mechanical properties and help optimize the CLS design. The load conditions are shown in Table 4. By analyzing the CLS’s stress conditions under the most unfavorable load factors, the same eight load conditions were carried out according to MTPRC [17,18]. According to Table 5, the conditions correspond to load combinations I, II, III, and IV; for the ultimate state of the bearing capacity.

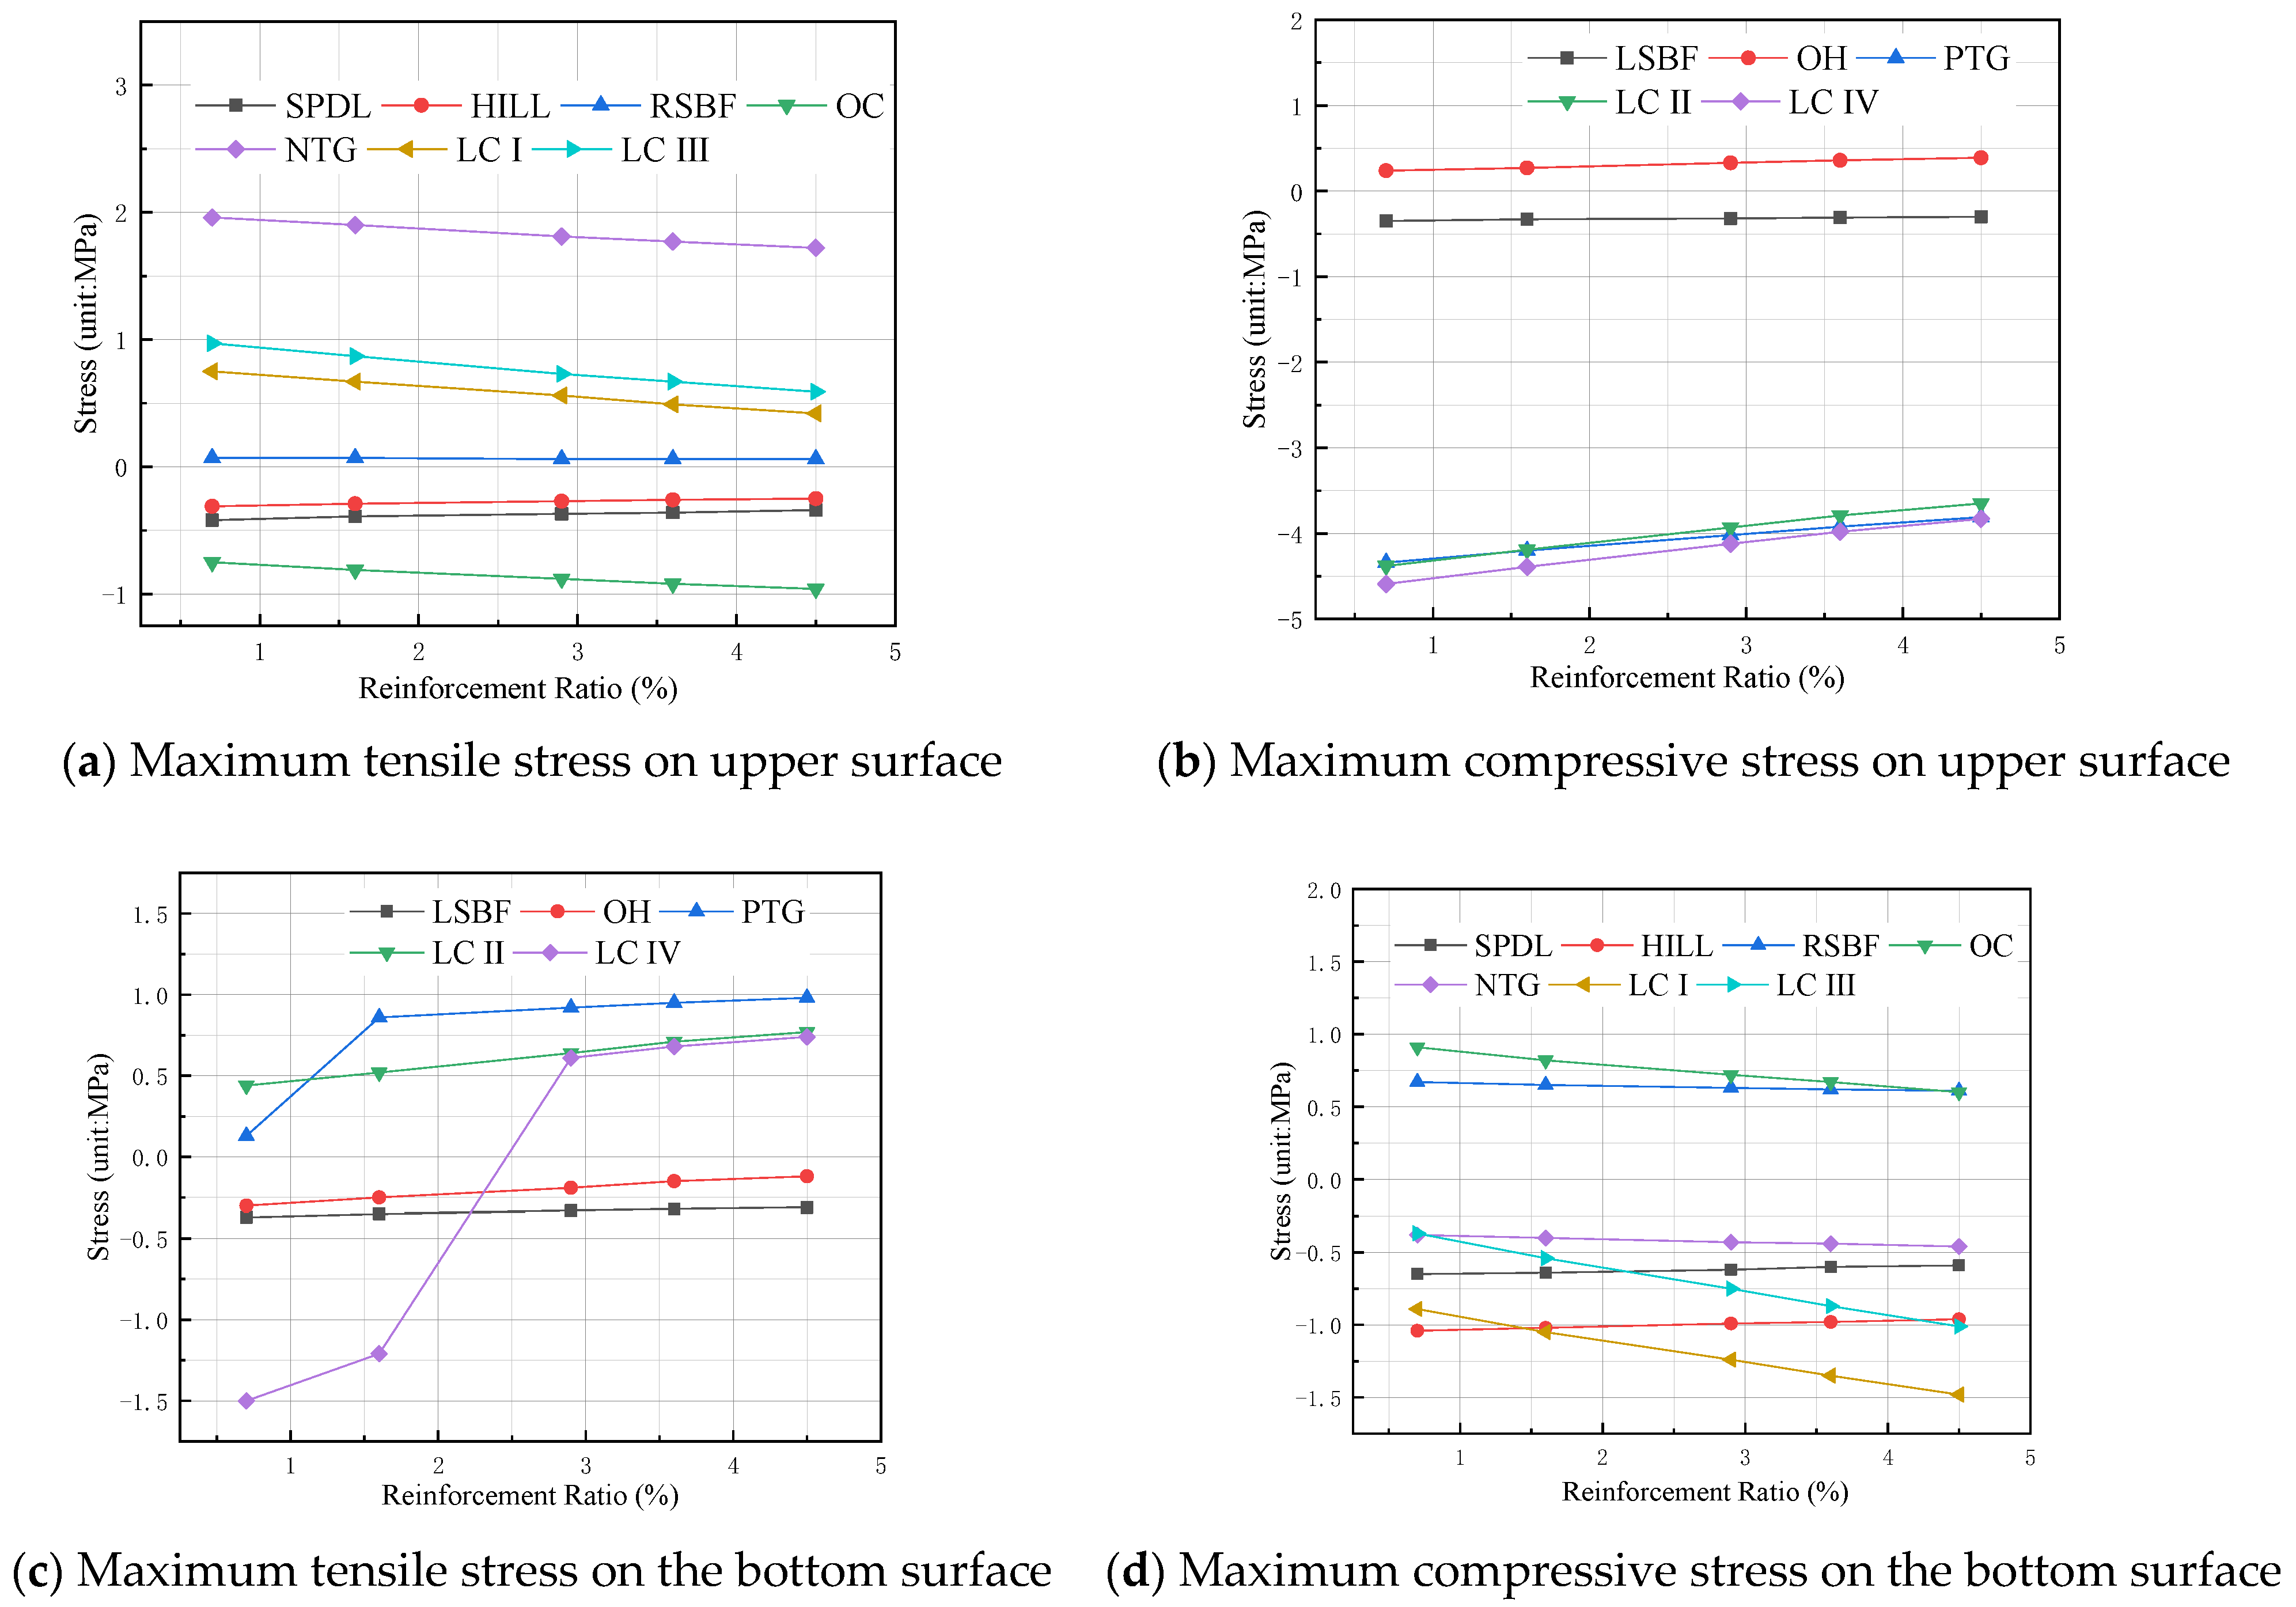
4.1. Reinforcement Ratio of CLS

Considering that the reinforcement of the pavement of the link-slab on the SSB bridge is relatively random in the design, this section will analyze the influence of the reinforcement ratio (0.7%, 1.6%, 2.9%, 3.6%, 4.5%) on the mechanical performance of the CLS without changing the pavement thickness. The elastic analysis method is used to calculate the maximum stress on the upper and lower surfaces of the CLS with different reinforcement ratios under various working conditions and load combinations.
The results are shown in Figure 13. In the figure, SPDL = second phase dead load, HILL = highway I lane load, RSBF = right span braking force, LSBF = left span braking force, OC = overall cooling 25 °C, OH = overall heating 15 °C, NTG = negative temperature gradient, PTG = positive temperature gradient, LC I = load combination I, LC II = load combination II, LC III = load combination III, and LC IV = load combination IV. As noted, with the increase in the reinforcement ratio, the maximum principal tensile stress and principal compressive stress on the upper surface of the CLS decrease, the maximum principal tensile stress of the upper surface under load combination III decreases from 0.97 MPa to 0.59 MPa, and the maximum principal compressive stress on the upper surface under load combination IV decreases from −4.59 MPa to −3.83 MPa. The maximum principal tensile stress and principal compressive stress on the lower surface increase. The maximum principal tensile stress of the bottom surface under load combination II increases from 0.44 MPa to 0.77 MPa. The maximum principal compressive stress on the bottom surface under load combination I increases from −0.89 MPa to −1.48 MPa. Both the upper and lower surface tensile stresses are less than the concrete’s tensile limit. Under the condition that the thickness of the CLS remains unchanged, the stress change amplitude of the CLS under different load conditions is small. Therefore, changing the reinforcement ratio of the CLS has a limited effect on the CLS stress performance.

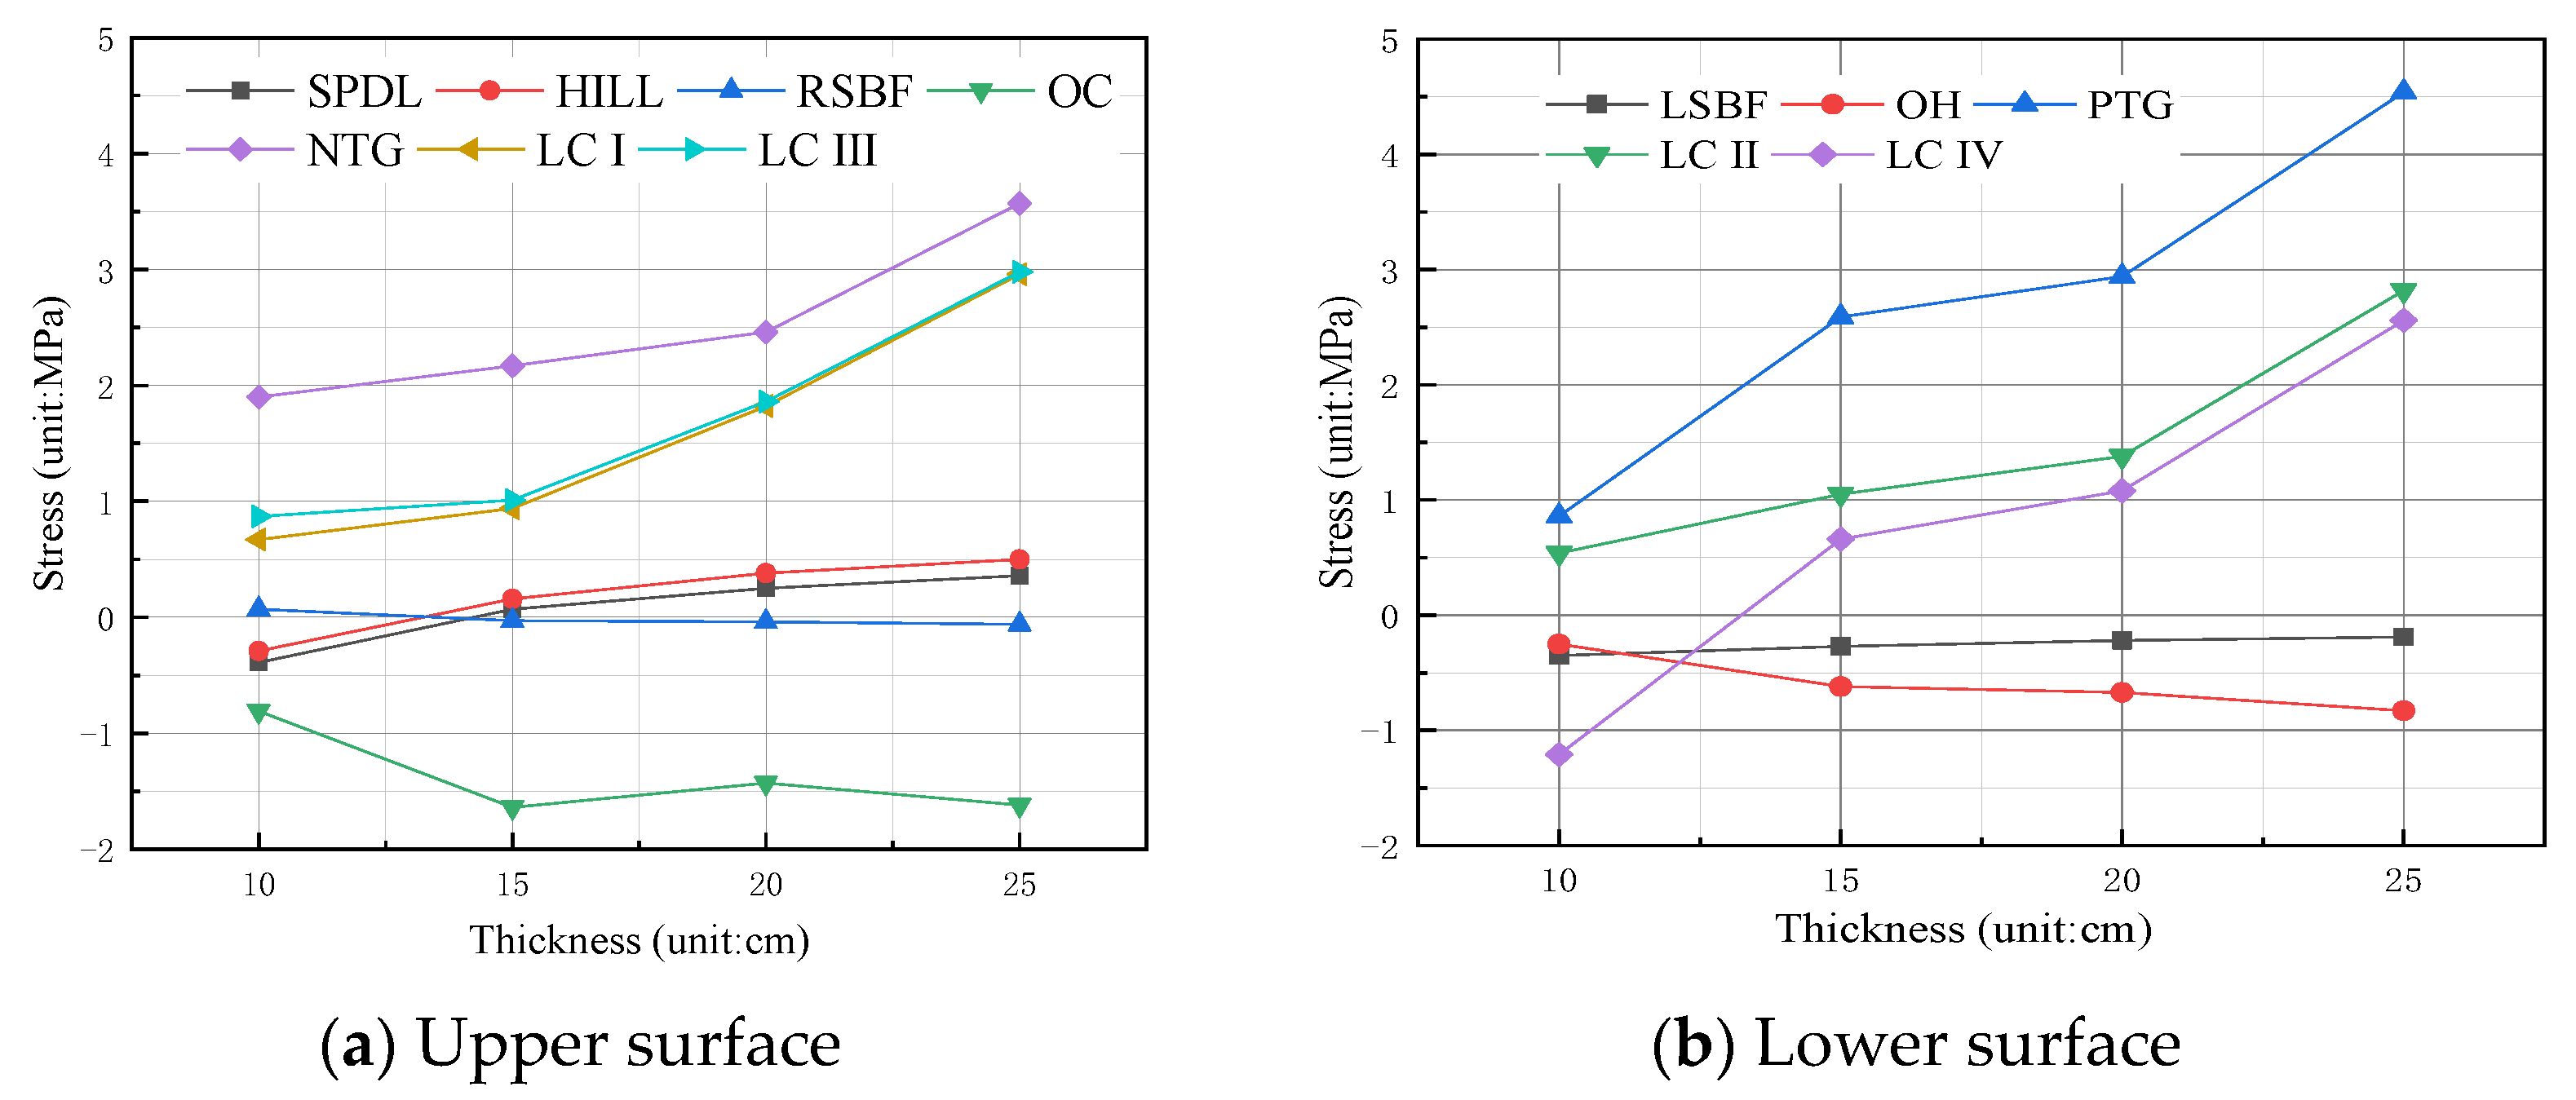
4.2. Pavement Thickness and Surface Material of CLS

The CLS mechanical performance with asphalt concrete and direct concrete pavements are compared. Let h1 and h2 denote the concrete and asphalt surface thicknesses design scheme of CLS, respectively. The design schemes are shown in Table 6. Schemes 1 to 4 use an asphalt concrete surface layer and concrete pavement to form a superimposed structure. Schemes 5 to 8 directly use a concrete paving layer as the overall paving structure. The maximum stresses of the CLS upper and lower surfaces and the CLS stress changes under the most unfavorable load combinations are analyzed, as shown in Figure 14 and Figure 15, respectively.
As noted, the maximum principal tensile stress of the CLS upper and lower surfaces with the asphalt concrete pavement and the concrete pavement directly increases as the thickness of the pavement increases under the corresponding load conditions. Under load combination I, when the thickness of pavement of CLS increases from 10 cm to 25 cm, the maximum principal tensile stress on the upper surface of the CLS asphalt concrete pavement increases from 0.75 MPa to 2.98 MPa, which is close to the concrete tensile limit value. The maximum principal tensile stress of the upper surface of the CLS concrete pavement is increased from 2.56 MPa to 5.83 MPa when no asphalt layer is applied, which is greater than the tensile limit value of the concrete. Under load combination II, the maximum principal tensile stress of the CLS lower surface increases as the thickness increases from 0.53 MPa to 2.66 Mpa, which is less than the tensile limit of concrete. The maximum principal tensile stress of the CLS’s lower surface increases with the thickness from 1.71 MPa to 6.72 MPa, and the range of tensile stress changes partially exceeds the tensile limit of concrete.
The pavement thickness should not be too small as small thickness will affect the vertical bearing capacity of the continuous structure of the bridge deck and cause premature damage to the structure. On the other hand, the thickness should not be too large as it will increase the cost and the overall rigidity of the bridge link-slab. It is not conducive to structural deformation and affects the structure’s stress. Combined with the tensile limit of concrete, the pavement thickness of the CLS is reasonable when the value is 15 cm to 20 cm. This structure can solve the cracking problem of the link-slab to a certain extent.
Comparing the CLS with asphalt concrete and concrete as the surface pavement, as the thickness increases, the tensile stresses on the upper and lower surfaces gradually increase. However, the tensile stress value of the latter is greater than the former when the thickness is the same. At the same time, to facilitate construction and keep the structure consistent with the entire bridge deck pavement, it is more reasonable to use asphalt concrete as the paving layer of the CLS under the same thickness.

4.3. Span of CLS

Without changing the CLS pavement thickness and surface material, appropriately increasing the span can effectively reduce the bending and tension stiffness of the CLS structure. This behavior makes the isolation space between the lower part of the link-slab and the main beam larger, which is beneficial to the coordinated deformation of the beam end displacement. In this section, numerical analysis is used to evaluate the effect of the preset curve span length on the CLS’s mechanical properties. The preset span lengths are 1 m, 1.5 m, 2.0 m, 3 m, and 4 m, which are 2.5%, 3.75%, 5%, 7.5%, and 10% of the main girder length, respectively. According to the numerical results, the maximum principal tensile stress of the upper and lower surfaces of the CLS pavement under different loads and load combinations are shown in Figure 16.
Figure 16 shows that under the corresponding load conditions, the maximum principal tensile stress on the upper surface of the mid-span part of the CLS structure of the CLS decreases with the increase of the curve-shape span. As noted, when the span length increases from 1 m to 2 m, the maximum principal tensile stress of the upper surface under load combination I decreased from 2.13 MPa to 0.97 MPa (54.5% difference), while it decreased from 2.15 MPa to 0.97 MPa (54.9% difference). The maximum principal tensile stress of the lower surface decreases first and increases as the curve span length increases. When the span length increases from 1 m to 2 m, the maximum principal tensile stress of the lower surface increases from 1.45 MPa to 1.47 MPa under load combination II (1.4% difference), while it decreases from 1.82 MPa to 1.06 MPa (41.7% difference) under load combination IV.
When the span length is 2 m to 3 m, the main tensile stress value of the CLS upper and lower surfaces tends to be stable. However, when the span length increases, the CLS stress does not change significantly, and it also affects the integrity of the CLS, which is not conducive to the structure’s strength. Therefore, when the CLS span is 2 m to 3 m (about 5% to 7.5% of the main girder length), the main tensile stress on the CLS upper and lower surfaces tends to be stable and reasonable.

4.4. Comparison of Numerical and Theoretical Results

The CLS design was optimized through parameter sensitivity analysis, and it was numerically analyzed and theoretically calculated according to the optimal design plan (see Table 7). The optimal design parameters are as follows: the asphalt concrete pavement and concrete pavement of the CLS are 10 cm and 15 cm thick, respectively, the curve span is 2 m long and is 3 cm high, and the steel bar configuration is 16@10 cm (reinforcement ratio 2.9%). Table 4 shows that the theoretical results of the CLS are similar to the numerical analysis estimates. The theoretical results are larger than the corresponding numerical ones, indicating that the theoretical results are conservative, which is more conducive to structural safety. It also further verifies the rationality of the stress formula derived from the simplified model of the hingeless arch, which can provide a theoretical basis for the design of the CLS.

5. Concluding Remarks

This paper has proposed a new type of CLS structure and has simplified it into a hingeless arch model. According to the theoretical deduction, the maximum stress formula for the middle part of the hingeless arch is obtained. The formula is numerically verified. The FLS and CLS bridge models were established using the finite element software ABAQUS to analyze and compare them under different load conditions. Based on this study, the following comments are offered:
  • The design of the CLS enables the link-slab to form an isolation space with the main girder, which can release the tensile stress in the CLS. In addition, the curve structure weakens the thickness of the link-slab and reduces its bending, and tensile stiffness can better adapt to the deformation of the beam end structure and effectively solves the cracking problem of the link-slab.
  • Since both CLS ends are consolidated with the bridge deck pavement, the CLS is simplified into a hingeless arch structure. According to the classical mechanical method, the hingeless arch simplified model is derived based on theoretical deduction. Formulas are derived for the maximum tension and compression stress on the upper and lower surfaces of the mid-span part of the link-slab. In addition, the rationality of the stress formula is verified using the FEM simulation.
  • The sensitivity analysis showed that only changing the CLS section’s reinforcement ratio has a limited impact on the CLS. The CLS with asphalt concrete pavement is more reasonable to keep the structure consistent with the overall bridge deck pavement. Based on the combined concrete tensile and compression limits, the CLS thickness should be 15 cm to 20 cm, and its design span should be about 5% to 7.5% of the main beam length.
  • The analysis of the refined model relies only on the two-span deck continuous T-shape simply supported girder on a straight bridge. However, this model has certain limitations regarding bridge type and bridge span diameter. Future research should address the force analysis of the inclined and curved bridges with different types and spans of arch deck continuous structure to fully verify the feasibility of the reinforced concrete arch deck. In addition, in the theoretical derivation and numerical analysis, only the force conditions of the continuous arch deck structure were calculated for the second stage constant load, highway class I lane load, vehicle braking force, overall temperature change, and temperature gradient. Future research should further analyze the effect of shrinkage, creep, and uneven settlement of the beam end on the continuous arch deck structure.

Author Contributions

The innovation of the article and the idea of writing the first draft were proposed by Y.Z. S.M.E. provided many suggestions and helped revise the paper. S.L. carried out the experimental design and data analysis of the paper and substantially contributed to writing and revising the paper. M.Z. and C.W. provided substantial help in preparing relevant data, finite element analysis, and the contents of the paper in the early stages. All authors have read and agreed to the published version of the manuscript.

Funding

National Natural Science Foundation of China (Grant No. 51774177) and the Natural Science Foundation of Zhejiang Province (Grant No. LY17E080022).

Institutional Review Board Statement

Not applicable.

Informed Consent Statement

Not applicable.

Data Availability Statement

All data, models, or codes that support the findings of this study are available from the corresponding author upon reasonable request.

Acknowledgments

The authors are grateful for the financial support provided by the National Natural Science Foundation of China (Grant No. 51774177) and the Natural Science Foundation of Zhejiang Province (Grant No. LY17E080022), and thanks to Chuang and Easa for their help in suggesting and revising the content of the paper.

Conflicts of Interest

The authors declare no conflict of interest.

Notation

The following symbols are used in this paper:
A s a , A s b total area of upper and lower edge steel bars, respectively
A c area of the concrete section
a, bupper and lower surfaces of the CLS, respectively
Bcalculated width of the section
b(H)function of the width of the main beam section along the beam height
Cgap between adjacent main beams, and d is the distance between the arch foot and the support
CLS
e
curved link-slab
distance from the bridge support to the beam end
E1elastic modulus of the main beam at the left end
Fzvehicle braking force
Fibraking force of each abutment
hheight of the mid-span section
h a , h b distances from the neutral axis of the upper and lower longitudinal bars to the bottom edge of the cross-section, respectively
Concrete surface thickness design scheme of CLS
h1, h2Concrete surface thickness and asphalt surface thickness design scheme of CLS, respectively
hcdistance from the neutral axis of the combined cross-section to the bottom of the cross-section
Hheight of the main beam
Hcdistance from the center of the main beam section to the bottom of the beam
I, Icmoments of inertia of the main beam section and the concrete section, respectively
lidistance between vehicle axle load Pi and the beam end A
I s a , I s b moments of inertia for steel bar section at the upper and lower edges, respectively
Kiintegrated thrust stiffness of the i-th bearing and abutment
lCLS span length
Lspan of the SSB
L1calculated span of the main beam
Pivehicle axle load
T(H)temperature change function of the main beam section
ysdistance from the elastic center to the vault
αlinear expansion coefficient of concrete
α E ratio coefficient of the elastic modulus of steel bar to that of concrete
Δ1c, Δ2c, Δ3cangular, horizontal, and vertical displacements, respectively
ΔHlongitudinal displacement of the CLS due to the corner of the beam end
ΔLhorizontal displacement of CLS under braking force
Δtdifference between the calculated and ambient temperatures when the bridge is closed
σqasum of bending and axial tensile stresses under vehicle load
σqbsum of bending and compressive stresses under vehicle load
σykatensile stress of the right-span vehicle under the braking force
σykbtensile stress of the right-span vehicle under the braking force
σfwasum of bending and axial tensile stresses under a negative temperature gradient
σfwbsum of bending and compressive stresses under a negative temperature gradient
σjatensile stress under the overall temperature drop
σjbtensile stress under the effect of overall cooling
σzwasum of bending and compressive stresses under a positive temperature gradient
σzwbsum of bending and axial tensile stresses under a positive temperature gradient
σzkacompressive stress under braking force of the left-span vehicle
σzkbcompressive stress under the braking force of the left-span vehicle
σsacompressive stress under overall temperature rise
σsbcompressive stress under overall heating
σ t max a maximum tensile stress on the CLS upper surface
σ c max a maximum compressive stress on the CLS upper surface
σ t max b maximum tensile stress on the CLS lower surface
σ c max b maximum compressive stress on the CLS lower surface
σsstress produced by the axial force X2
θangular displacement at the end of the main beam

References

  1. Chen, B.C.; Zhuang, Y.Z.; Huang, F.Y.; Briseghella, B. Jointless Bridges, 2nd ed.; China Communication Press: Beijing, China, 2019. (In Chinese) [Google Scholar]
  2. Matt, P. Status of segmental bridge construction in Europe. J.-Prestress. Concr. Inst. 1983, 28, 104–125. [Google Scholar] [CrossRef]
  3. Fan, L.C. Prestressed concrete highway bridges in China. Zeitschrift 1984, 12, 15–27. [Google Scholar] [CrossRef]
  4. Yao, H. Early damage and prevention of continuous expansion joint on reinforced concrete bridge deck. J. Ningbo Univ. (Sci. Technol. Ed.) 2005, 2, 261–263. (In Chinese) [Google Scholar]
  5. Su, L.; Yang, X.; Hu, Z.L. Analysis of hollow slab bridge diseases and remedial measures for continuous structure of bridge deck. Technol. Highw. Transp. 2005, 2, 100–103. (In Chinese) [Google Scholar]
  6. Caner, A.; Zia, P. Behavior and design of link slabs for jointless bridge decks. J.-Prestress. Concr. Inst. 1998, 43, 68–81. [Google Scholar] [CrossRef]
  7. Charuchaimontri, T.; Senjuntichai, T.; Limsuwan, E. Effect of lap reinforcement in link slabs of highway bridges. Eng. Struct. 2008, 30, 546–560. [Google Scholar] [CrossRef]
  8. Au, A.; Lam, C.; Au, J.; Tharmabala, B. Eliminating deck joints using debonded link slabs: Research and Field Tests in Ontario. J. Bridge Eng. 2013, 18, 768–778. [Google Scholar] [CrossRef]
  9. Chen, Q.; Abu-Farsakh, M. Mitigating the bridge end bump problem: A case study of a new approach slab system with geosynthetic reinforced soil foundation. Geotext. Geomembr. 2015, 44, 39–50. [Google Scholar] [CrossRef]
  10. Kim, Y.; Fischer, Y. Performance of bridge deck link slabs designed with ductile engineered cementitious composite. ACI Struct. J. 2004, 101, 792–801. [Google Scholar]
  11. Ahn, J.-H.; Yoon, J.-H.; Kim, J.-H. Evaluation of the behaviour of abutment-pile connection in integral abutment bridge. J. Constr. Steel Res. 2011, 67, 1134–1148. [Google Scholar] [CrossRef]
  12. Kendall, A.; Keoleian, G.A.; Helfand, G.E. Integrated life-cycle assessment and life-cycle cost analysis model for concrete bridge deck applications. J. Infrastruct. Syst. 2008, 14, 214–222. [Google Scholar] [CrossRef]
  13. Saber, A.; Aleti, A.R. Behavior of FRP link slabs in jointless bridge decks. Adv. Civ. Eng. 2012, 2012, 140–148. [Google Scholar] [CrossRef] [Green Version]
  14. Wang, G.; Xie, X.; Wang, C.Q. Mechanical performance of arch-type continuous slab-deck on simply-suppoorted girder bridge. J. Zhejiang Univ. (Eng. Sci. Ed.) 2014, 48, 1049–1057. (In Chinese) [Google Scholar]
  15. Wang, C.Q.; Shen, Y.G.; Wang, G. Tests on the mechanical characteristics of the continuous structure of the hollow slab girder bridge deck. J. Zhejiang Univ. (Eng. Sci. Ed.) 2016, 50, 1438–1445. (In Chinese) [Google Scholar]
  16. Zhuang, Y.Z.; Xu, L.; Cheng, J.F. Theoretical analysis of the mechanical characteristics of the continuous structure of the simply supported girder bridge deck. China J. Highw. Transp. 2017, 30, 73–85. (In Chinese) [Google Scholar]
  17. Ministry of Transportation of the People’s Republic of China. Concrete Structure: Concrete Highway Bridge Design; Ministry of Transportation of the People’s Republic of China: Beijing, China, 2008; Volume 2. (In Chinese)
  18. Ministry of Transportation of the People’s Republic of China. General Code for Design of Highway Bridges and Culverts; JTG D60-2015; Ministry of Transportation of the People’s Republic of China: Beijing, China, 2008. (In Chinese)
Figure 1. Structure of the reinforced concrete CLS.
Applsci 12 03344 g001
Figure 2. Simplified CLS structure.
Applsci 12 03344 g002
Figure 3. Geometry of the neutral axis of the combined section.
Applsci 12 03344 g003
Figure 4. Deformation of the beam end structure.
Applsci 12 03344 g004
Figure 5. Overall diagram of the simply supported beam bridge.
Applsci 12 03344 g005
Figure 6. Schematic of the CLS (unit: mm).
Applsci 12 03344 g006
Figure 7. Schematic of the main beam mesh.
Applsci 12 03344 g007
Figure 8. Stress distribution on link-slab under the second phase dead load.
Applsci 12 03344 g008
Figure 9. Stress distribution on the link-slab under highway class I load.
Applsci 12 03344 g009
Figure 10. Stress distribution on link-slab under vehicle braking force on the right span.
Applsci 12 03344 g010
Figure 11. Stress distribution on link-slab under global warming.
Applsci 12 03344 g011
Figure 12. Stress distribution on the link-slab under negative temperature gradient.
Applsci 12 03344 g012
Figure 13. Curve of maximum stress vs. reinforcement ratio of CLS.
Applsci 12 03344 g013
Figure 14. Curve of maximum principal tensile stress vs. thickness of CLS with asphalt concrete surface.
Applsci 12 03344 g014
Figure 15. The curve of maximum principal tensile stress vs. thickness of CLS with concrete pavement.
Applsci 12 03344 g015
Figure 16. Curve of the maximum principal tensile stress vs. CLS span.
Applsci 12 03344 g016
Table 1. Ultimate stress load combination a.
CLS PositionUltimate StressStress Combination
Upper surfaceMaximum tensile stress σ t max a = σ q a + σ y k a + σ f w a + σ j a
Maximum compressive stress σ c max a = σ z w a + σ z k a + σ s a
Lower surfaceMaximum tensile stress σ t max b = σ z w b + σ y k b + σ j b
Maximum compressive stress σ c max b = σ q b + σ z k b + σ f w b + σ s b
a The meaning of the parameters in the above table is shown in the Notation section of this paper.
Table 2. Tensile and compressive parameters of the concrete damage-plastic model.
Stressed BehaviorStretching Behavior
Yield Stress (Pa)Inelastic StrainYield Stress (Pa)Cracking Strain
17,361,73802,528,6600
24,006,5640.0001492,450,9514.57 × 10−5
28,009,3890.0003322,309,4685.99 × 10−5
29,779,4350.000582,151,5157.44 × 10−5
30,049,2000.0007651,996,6988.89 × 10−5
28,944,6640.0010971,853,1351.03 × 10−4
26,531,2420.0014661,723,4321.17 × 10−4
23,785,9620.0018451,607,6461.30 × 10−4
21,179,6900.002221,504,7581.43 × 10−4
18,877,0580.0025861,413,3821.56 × 10−4
16,901,8920.0029431,332,0911.68 × 10−4
15,224,8900.003291,035,7512.27 × 10−4
13,802,3560.003631852,075.22.82 × 10−4
12,591,2820.003965728,187.43.36 × 10−4
11,554,2510.004293639,087.33.88 × 10−4
10,660,2940.004618571,847.44.40 × 10−4
9,884,3180.004939519,2034.92 × 10−4
9,206,1460.005257476,782.35.43 × 10−4
8,609,5690.005573441,803.65.94 × 10−4
6,721,5610.006522412,414.76.45 × 10−4
3,994,8100.007495387,334.86.95 × 10−4
406,918.30.008492365,6507.46 × 10−4
346,690.37.97 × 10−4
329,953.28.47 × 10−4
315,054.28.97 × 10−4
301,693.89.48 × 10−4
278,688.61.05 × 10−3
268,700.21.10 × 10−3
Table 3. Parameters of elasto-plastic model of steel bar.
Reinforcing Steel TypeExpansion CoefficientModulus of Elasticity (MPa)Elastic Poisson’s RatioPlastic Modulus (MPa)Plastic Poisson’s Ratio
Prestressed steel bars1.2 × 10−51.95 × 1050.32.1 × 1030
Ordinary reinforcement steel1.2 × 10−52.0 × 1050.32.3 × 1030
Table 4. Load conditions.
NumberingLoad Condition
1Second Phase Dead Load
2Highway I Lane Load
3Vehicle Braking Force (Right Span)
4Vehicle Braking Force (Left Span)
5Overall Cooling 25 °C
6Overall Heating 15 °C
7Negative Temperature Gradient
8Positive Temperature Gradient
Table 5. Load combination conditions.
Load CombinationLoad Safety Factor a
DLPC&SCLTGTR&FVBF
I1.21.01.01.40.8 × 1.40.8 × 1.4- b
1.21.01.00.8 × 1.41.41.4- b
1.21.01.01.40.8 × 1.40.8 × 1.40.8 × 1.7
1.21.01.00.7 × 1.41.41.40.7 × 1.4
a DL = dead load, P = prestressed, C&S = creep and shrinkage, CL = carload (including impact), TG = temperature gradient, TR&F = temperature rise and fall, and VBF = vehicle breaking force. b Not applicable.
Table 6. Thickness design scheme of CLS (mm).
Thickness Design SchemeConcrete Surface Thickness
h1
Asphalt Surface
Thickness
h2
Rise of Curve
f
Number of Reinforcement Mesh Layer
1100100302
2150100302
3200100302
4250100302
51000302
61500302
72000302
82500302
Table 7. Maximum stresses on the upper and lower surfaces of the CLS span.
Stress LocationStressTypeStress Value (MPa)
Upper surfaceMaximum tensile stressTheoretical1.06
Analysis0.97
Maximum compressive stressTheoretical−4.50
Analysis−4.14
Lower surfaceMaximum tensile stressTheoretical0.86
Analysis0.80
Maximum compressive stressTheoretical−1.16
Analysis−1.08
Publisher’s Note: MDPI stays neutral with regard to jurisdictional claims in published maps and institutional affiliations.

