Abstract
The European regulatory framework requires prior authorization for the use of plants and activities that may impact the environment, to ensure an adequate level of environmental and human health protection. Data on industrial wastewater, urban sewage, atmospheric emissions and waste management of installations subject to licenses generate interest among stakeholders (Environmental Protection Agencies, Police Forces, regions, provinces, municipalities, Local Health Authorities, operators, research bodies, citizens), but unfortunately, they are not properly digitized and processed, as they are often unavailable. Therefore, the main goal of this project is to provide a flexible, interactive and easy-to-use tool for stakeholders to allow them to consult these kinds of environmental data. For this purpose, a database integrated with a web-based Geographical Information System (GIS) platform to collect, manage and share pollutant emissions data, is currently being designed and developed. The web platform offers to users interconnected informative modules on required authorizations, license processes and analytical controls. Moreover, stored data from industries and on emissions are georeferenced and displayed in a web GIS map. Stakeholders have free but limited access to specific sections of the web platform, depending on their tasks. They can consult environmental data and GIS representations, download reports or documents and enter new data. This web application seeks to: (1) promote collaboration among stakeholders, (2) simplify the monitoring of an installation’s authorization status and industrial emissions trends, (3) optimize the environmental licensing procedures, (4) enhance the management of environmental control by the relevant authorities, (5) support health and environmental research, and (6) provide industries with innovative services for data transmission. To evaluate the performance and benefits of the newly-developed tool, a real-life pilot case has been applied using data from industries located in the Province of Ascoli Piceno (Marche region, Italy).
1. Introduction
In Europe, industrial activities are amongst the main sources of pollution [1], imposing risks to, and having serious impacts on human health and the natural and social environment [2]. Despite industry being a key component in the European economy and playing a significant role in society’s economic well-being, it is the main source of emissions into the atmosphere and water ecosystems, generating waste and consuming resources [3].
Among the pollutants which factories release into air, there are greenhouse gases like carbon dioxide (CO2), acidifying pollutants like sulfur oxides (SOx), nitrogen oxides (NOx), particulate matter (in this case PM10), nonmethane volatile organic compounds (NMVOCs) and potentially toxic elements (PTEs). Likewise, pollutants emitted into water include total organic carbon (TOC), compounds that contain nutrients (such as nitrogen and phosphorous), which can cause eutrophication, and potentially toxic elements (PTEs), which also have detrimental impacts on human and environmental health [4].
The environmental impact of industry has been therefore subject to European Union (EU)-wide legislation since the 1970s [5]. The ambition of EU industrial policy strategy is to create a growing industrial sector that decreasingly exploits natural resources, reduces pollutant emissions to air, water and land, and generates decreasing amounts of waste [6].
Environmental authorizations are one of the main regulatory drivers for improvements in industrial performance [7]. Indeed, environmental licensing procedures are a key instrument for regulating a wide spectrum of the impacts of industry and promoting technological innovation. The overall aim of licenses is for authorities to define (in a transparent, accountable manner) legally binding requirements for individual sources of significant environmental impact. Typically, these deeds establish limits for pollutant emissions into air and water and for the generation and disposal of waste, together with any other environmental conditions that are specific to an individual installation [8].
Historically, European Member States adopted separate regulations and multiple sectorial authorizations to address the problems of pollution control and prevention. In 1996, thanks to the Integrated Pollution Prevention and Control (IPPC) Directive [9], single licenses replaced traditional ones, to manage all aspects of industrial activity likely to generate environmental impacts under the same administrative procedure [1].
Currently, the Industrial Emissions Directive (IED) [10], which has embedded the IPPC Directive, is the core of EU environmental industrial policy. This directive is based on an integrated approach, the use of the Best Available Techniques (BAT), flexibility, inspections and public participation. All installations covered by the IED, about 55,000, are required to operate in accordance with a license, granted by the authorities in the Member States [11]. However, in many countries, a large proportion of industrial installations (mostly small and medium-sized enterprises) do not fall under the scope of application of integrated permits. Such enterprises are usually regulated by simpler authorizations schemes [8].
The Italian Legislative Decree 152/06 [12] is the most important Italian environmental law. It applies European standards and regulates licenses, as well as Integrated Environmental Authorization (AIA), Unique Authorization for waste disposal and recovery plants and sectorial authorizations. For small and medium-sized enterprises which are not subject to other forms of unique or integrated environmental authorizations, the Italian regulatory framework provides for the Environmental Unique Authorization (AUA) [13].
Data of industries subject to licenses are of considerable interest to stakeholders (Environmental Protection Agencies, police forces, regions, provinces, municipalities, Local Health Authorities, operators, research bodies, citizens), to monitor industrial pollutant emission trends and to evaluate the effect of industrial activities on the environment and human health. Unfortunately, these data are often not properly digitized and processed, as they are unavailable. Therefore, they are not sufficient to assess the effectiveness of the actions aimed to protect the environment.
Flexible data management and information systems are necessary to provide meaningful information to stakeholders. These systems should support not only the storage of data, but also their description with comprehensive and standardized metadata [14]. Modern information technology and, in particular, the integration of monitoring and data base management systems, Geographical Information System (GIS), simulation modelling, and expert systems offers many possibilities to support data and information management tasks with a new level of efficiency and effectiveness [15,16,17]. At the same time, easy and direct access to information on the environment held by public authorities can be realized efficiently by multimedia technologies, using the Internet as the medium of visibility and consultation [15].
In this context, our project aims to design and develop a database integrated with a web-based GIS platform to collect, manage and share data on industrial wastewater, urban sewage, atmospheric emissions and waste management of installations subject to authorizations.
In particular, this study presents a complete and continuously updated database and a web interface as a solution for the application, administration and consultation of environmental authorizations. Indeed, our work provides a practical, flexible and interactive working tool for police forces, competent authorities, operators and research bodies, to make licensing process and preliminary investigation more efficient. Moreover, this tool makes it easier to share the emissions data with the stakeholders.
The data are supplied by all stakeholders involved strictly related to their role: data on inspection are provided by police forces, emissions data by competent authorities and operators and so on.
These inventories can be used for both health and environmental research purposes, as well as for improving urban and territorial planning. For example, they generate unique opportunities to strategically address the challenges associated with the sustainable development of the United Nations Goals (SDGs) to ensure a fair, environmentally sustainable and healthy society [18].
The project also aims to involve citizens on environmental issues and thus simplify the citizens’ access to these data, according to current legislation (e.g., Directive 2003/04/CE, Italian Legislative Degree 195/2005 and Italian Legislative Degree 33/2013).
In the last years, many web platforms were developed to support different environmental goals (e.g., water management, soil management, ecosystem and forest management), as reported extensively in the literature [19,20,21,22]. These platforms are helpful in managing specific environmental issues, but on the other hand they cannot be used all at once for different environmental sectors and by a large number of stakeholders.
As the best of our knowledge this is the first systematic study that proposed, for a Public Administration, an integrated web-based GIS platform to simultaneously support the management of administrative procedures, environmental inspection and scientific research. The interconnection between these activities is important for the environmental protection, but at the same time it is generally complicated. Apart from this, the proposed web application is a valid tool to assess the impact of an industry for all environmental matrices (air, soil and water) and enhance the collaboration between public administrations, environmental professionals, enterprises, researchers and citizens.
In the current paper, are presented the preliminary results of developing a new web-based GIS platform. Further data and tool implementations will be reported in future research studies.
2. Materials and Methods
The study has been organized into three different steps: (1) the system design presented, (2) the testing phase that are still being assessed, (3) the platform utilization which will start on November 2022.
In the first step, the requirement of the EU’s INSPIRE Directive [23] was considered to enhance the sharing of environmental spatial information among public sector organizations and the improvement of public access to spatial information throughout Europe. In the following two steps, we will evaluate the effect of the above requirement.
The system design process was divided into several distinct phases (see sections below) due to the initial conditions: in fact, a Microsoft Access database was historically used for water discharges data. At this moment, a migration of Access Database into MySQL database was constructed and new tables were created, e.g., an atmospheric emissions dataset (see Section 3). A web platform was also developed.
For this work, the Linux, Apache, MySQL and PHP (LAMP) software platforms and Apache Tomcat webserver were used. LAMP is an open-source web development platform that uses Linux as its operating system, Apache as its web server, MySQL as its relational database management system and Hypertext Preprocessor (PHP) as its object-oriented scripting language. Tomcat provides a “pure Java” HyperText Transfer Protocol (HTTP) web server environment in which Java code can run [24,25,26,27,28,29].
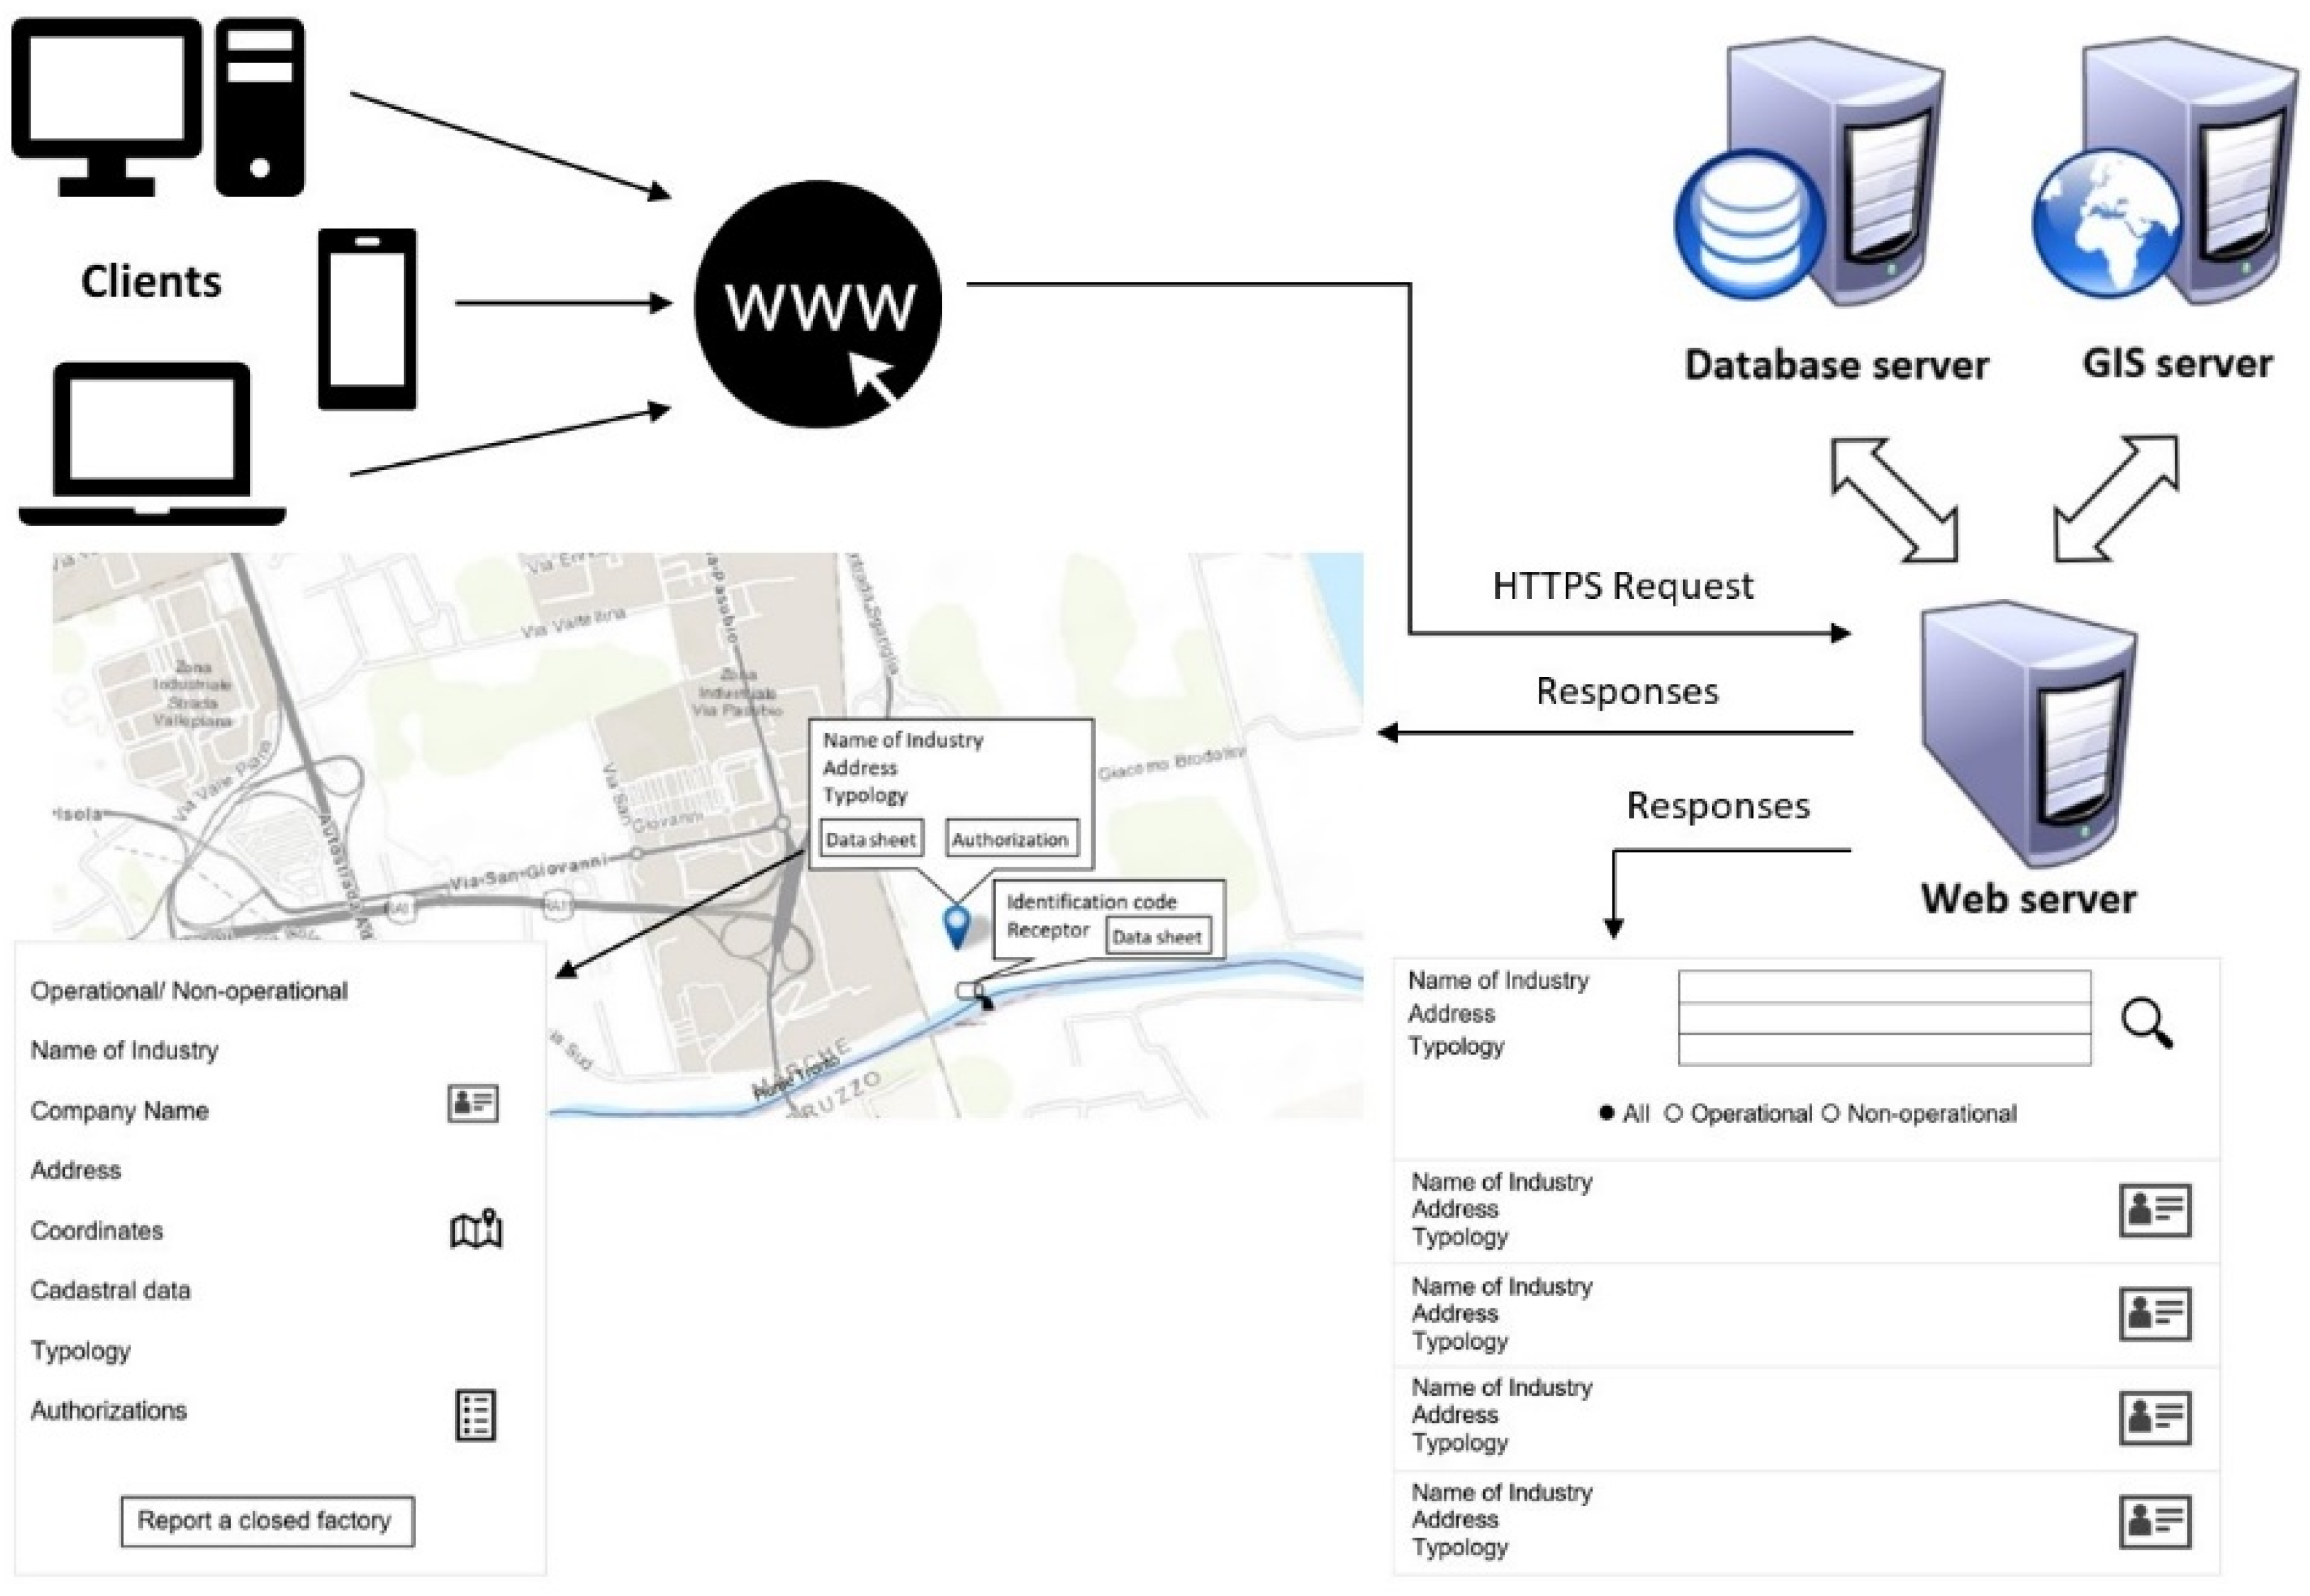
The overall layout of the framework comprises: (1) the database server (MySQL) for storing the environmental data of each installation, (2) the GIS server (Apache Tomcat) for managing and displaying the geographical data, (3) the web server (Apache) which communicates the data to the end users (Figure 1). The architecture and functionalities are described below.

Figure 1.
The overall layout of the framework.
2.1. The Database
A database server connected to the web application was required to store the data. It has to fulfil the following requirements: (1) variability of user access levels to ensure security of the data, (2) interconnection with several software and programming languages, such as Java, C, PHP and Active Server Pages (ASP), (3) the ability to work on many different platforms (e.g., Linux and Windows), (4) open source and free license, and (5) achieve high levels of reliability and performance.
For this reason, MySQL, an open-source relational database management system (RDBMS), was chosen. This software is widely used in web applications, and in 2019, it was named the DBMS of the year by the DB-Engines magazine [30].
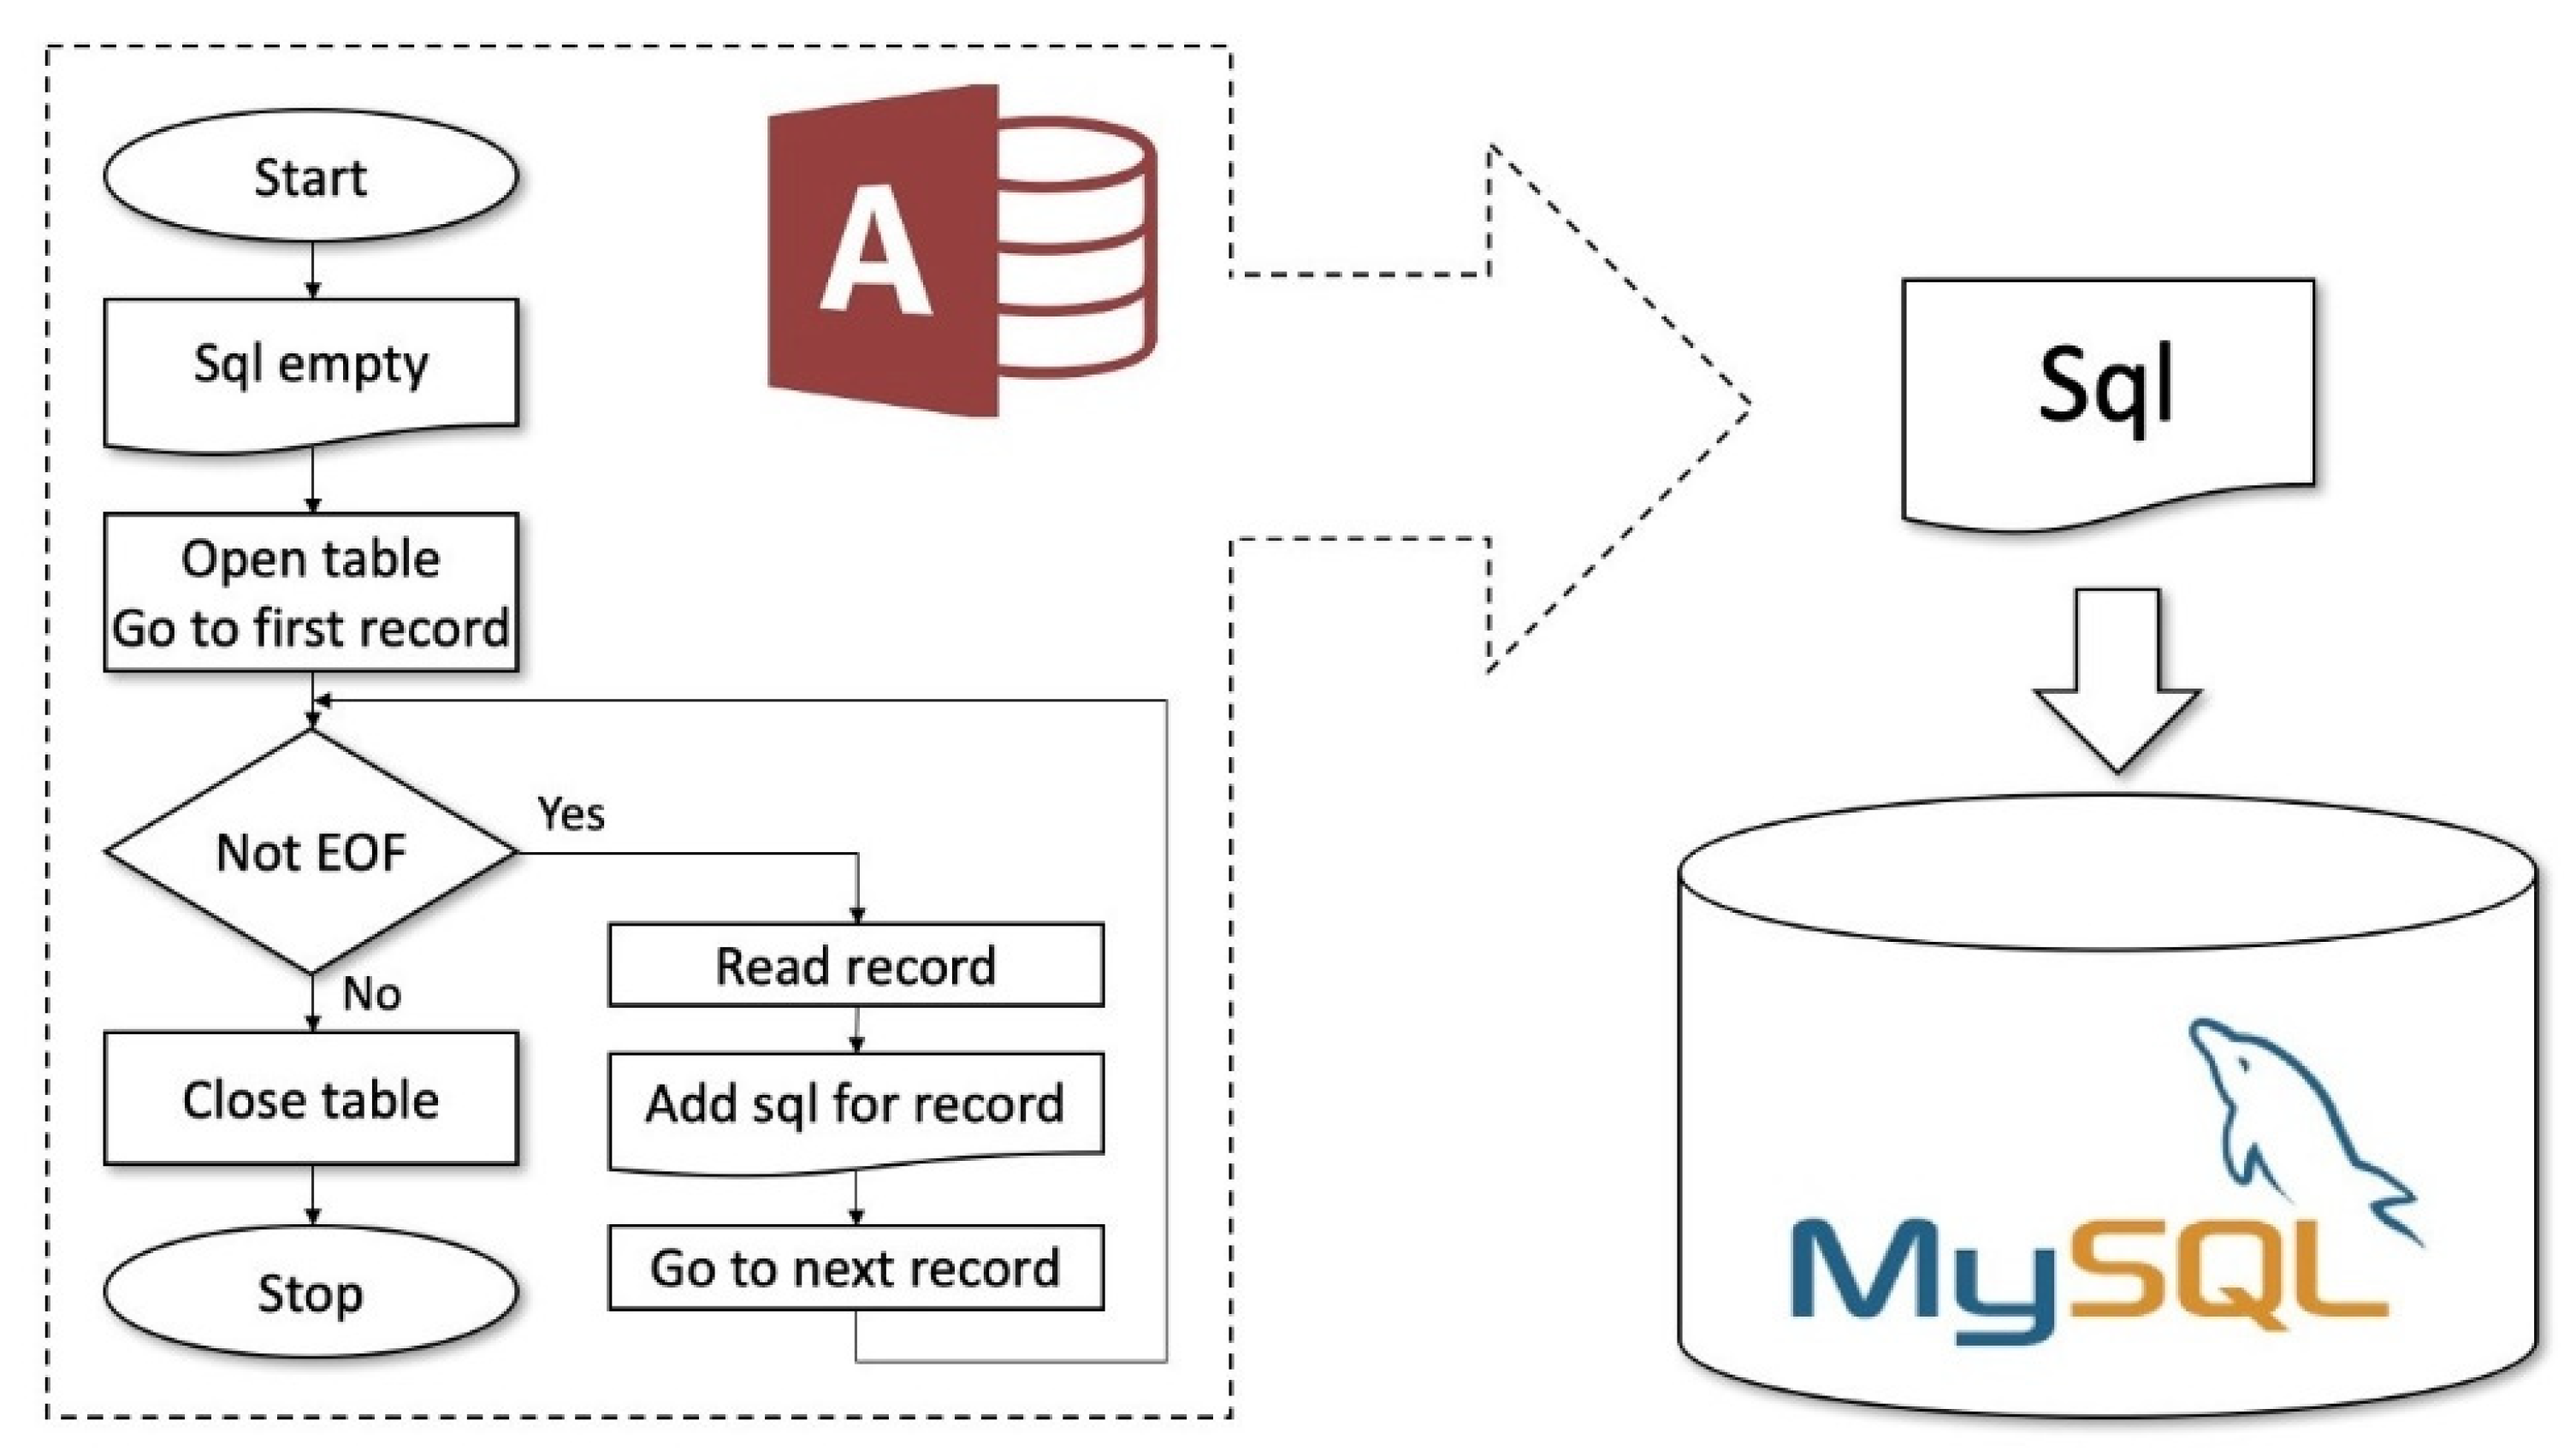
The first step was to migrate data from Microsoft Access to MySQL. Microsoft Access is not able to export data in the Structured Query Language (SQL) format. Therefore, it was necessary to manually create the schema on MySQL. Subsequently, scripts in Visual Basic were developed to read all the records of an Access table and generate the SQL code. This code was executed on a MySQL server (Figure 2).
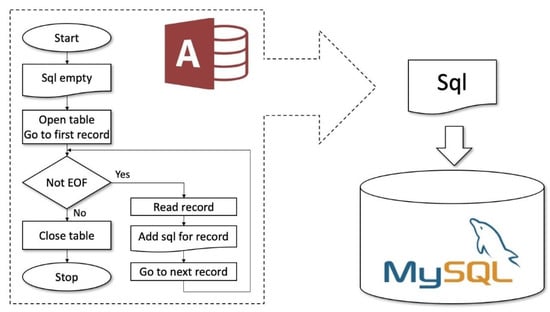
Figure 2.
Flow diagram of data exportation from Microsoft Access to MySQL.
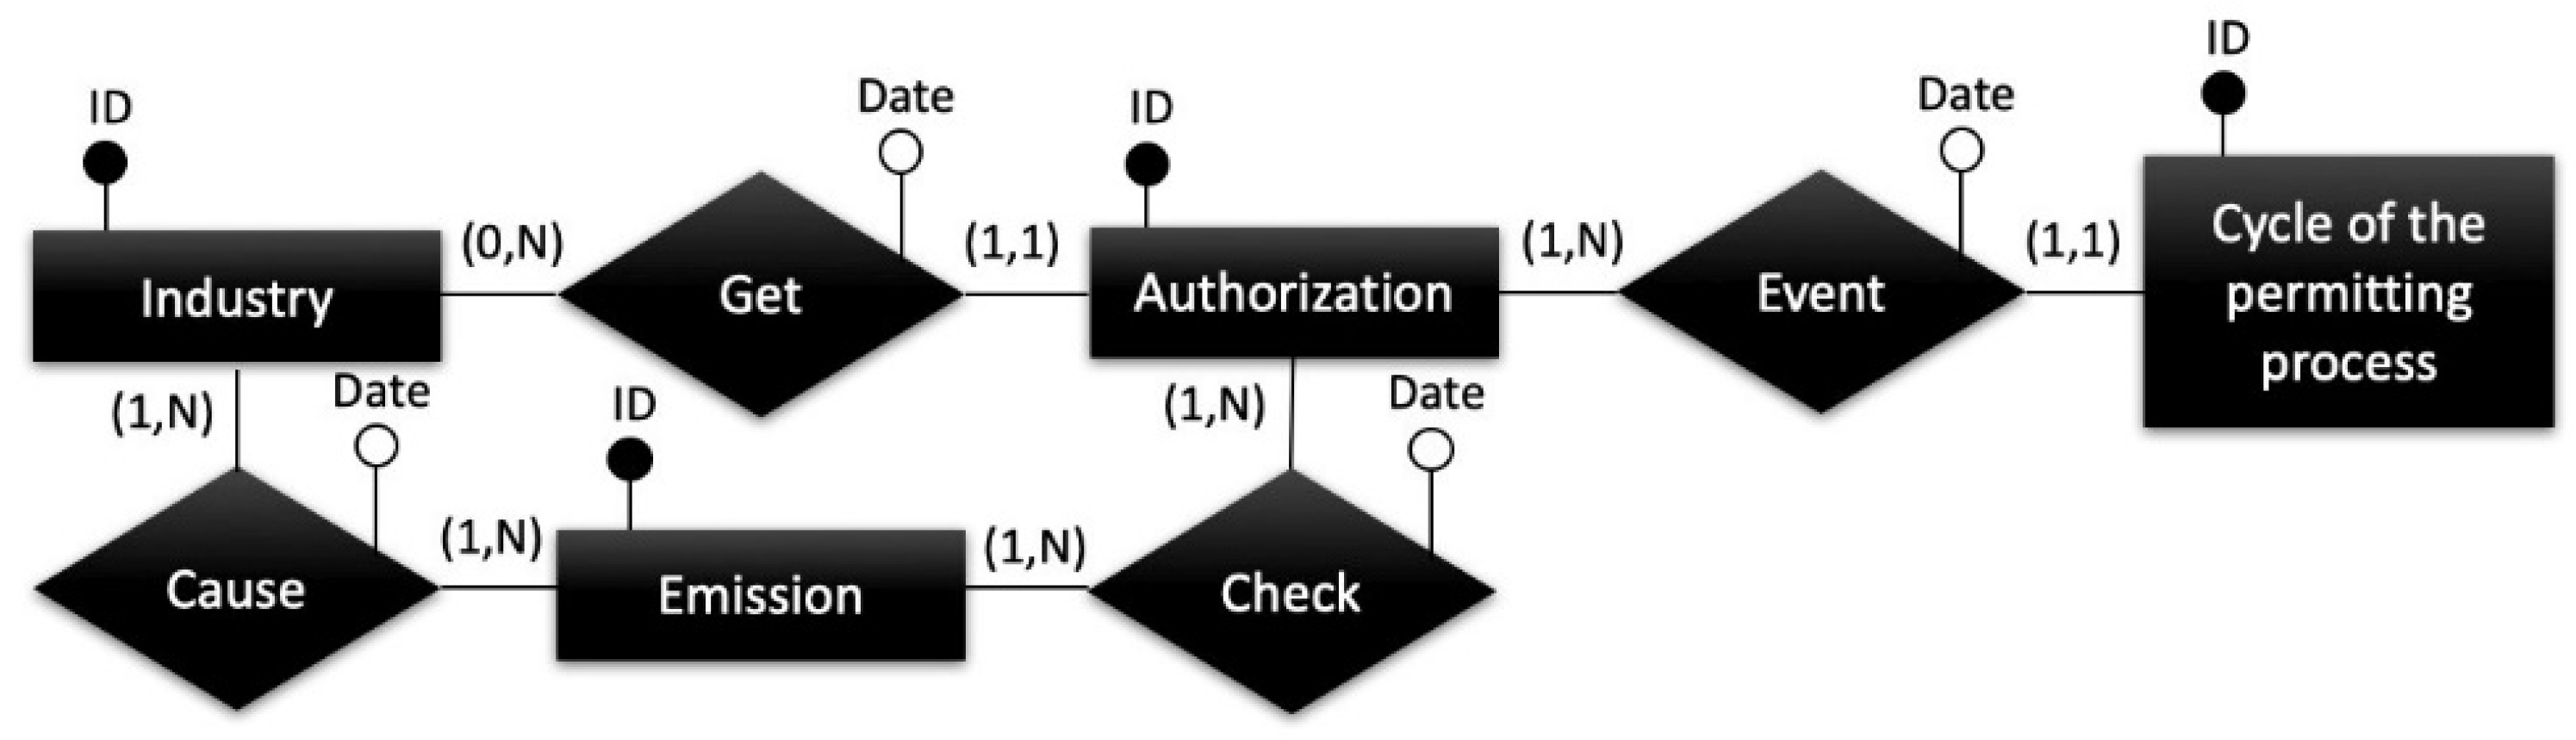
The second step was the database normalization process. The relationships and associations were studied and the functional dependencies and database integrity constraints were analyzed. Redundancies were identified and minimized, queries were studied and optimized, and a primary key and an index were created for each table to speed up searches. An entity-relationship model (ER model) was used for this study (Figure 3). At the end, the new database is in third normal (3NF). This normalization process reduces data duplication, avoids data anomalies, ensures referential integrity, and simplifies data management.
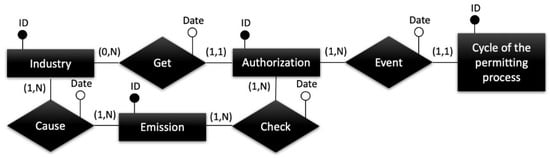
Figure 3.
Part of the database schema with ER model.
2.2. The Web GIS Map
The web GIS application consists of a server and a front end. The first one (the server) was developed in Java language; the second one was developed in Type script and was transposed into Java script to allow the data visualization using the most popular web-browsers (e.g., Google Chrome, Apple Safari and Microsoft Edge).
The GIS server [31] has to: (1) support various types of spatial data format, such as vector, raster, Keyhole Markup Language (KML), Shapefile and JavaScript Object Notation (JSON), (2) implement the various services required for the visualization (e.g., the Web Map Service, the Web Coverage Service and the Web Processing Service) and (3) provide editing facility for all types of geospatial data.
It provides two services: (1) cartographic service for the publication of the supporting information layers (e.g., municipal boundaries and hydrographic network). These data were locally stored as georeferenced shapefiles and displayed as raster images. (2) Representational State Transfer (REST) service for the publication of the industry data as a series of georeferenced points with the related attributes. This information is read from the database in real time and is made available in JSON format [32].
The Front End appropriately queries the two services and shows an interactive map, with zoom, pan and query functions. It overlays supporting layers on Bing Tiles and displays installations as clickable pushpins.
The data stored before web publication (manually entered in various formats) were cleansed and reprojected to the World Geodetic System 1984 (WGS84). Moreover, industries not yet georeferenced were placed on a map starting from the addresses and using the geocoding process. For this purpose, the Google Map Application Programming Interface (API) service was used [33].
Currently, due to a continuous exchange of information between the database server and the GIS server, the front end presents the geographic data on the map as soon as they are inserted into the database. Therefore, the system provides users with an interactive and always updated map.
Emissions data and analytical/statistical evaluation results will also be available on the web GIS map, providing accurate and consistent emissions inventories and making them more accessible and understandable to a wider audience [34].
2.3. The Web Platform
The web application was developed in PHP language and it is constantly evolving.
In agreement with the Agency for Digital Italy [35], the website must respect the accessibility criteria established by the World Wide Web Consortium (W3C) [36]. Therefore, cascading style sheets (CSS3) and responsive web design (RWD) were used.
To ensure data security, automatic periodic (daily) backup procedures have been set up.
The interfaces with the web application were created through customized queries for each user account types. Thus, the data are accessible through these web-based interfaces available simultaneously to different types of stakeholders. Authentication is free but limited: users can access specific sections of the web platform, depending on their tasks. Currently, there are four different user account types:
- ○
- Administrator (e.g., the webmaster). This account has full access to all functionalities.
- ○
- Staff (e.g., the competent authority). These users can add and modify all environmental data. They manage the licensing procedures, grant or revoke the authorizations, insert or update the emissions data, validate the analytical data and report deadlines or new requirements to the industries. Staff members can download templates from a specific section, populate with data from the database, depending on user’s requests. This allows staff members to obtain partially prefilled files, to automate and speed up the document writing process.
- ○
- Operators. They can only consult the data and the authorizations relating to their installations. They can monitor the authorization status of a plant, view emissions data, quickly and easily insert the results of the analytical self-checks. They can also download reports, documents and the necessary forms.
- ○
- Police forces (e.g., Financial Police, Local Police, Harbor Masters, Foresters) and public institutions (Environmental Protection Agencies, municipalities, Local Health Authorities). They can control the authorizations status of all industries. They can also verify the self-checks, enter analytical checks results and download summary reports or licenses documents.
All users can visualize the GIS map on the main screen of the web application. Here, different details of the information are displayed, depending on stakeholder’s permissions.
Some data are manually entered by all stakeholders involved, depending on their role, and others are compiled through automation. In addition, all users can report any anomalies or incorrect data via the platform.
The conditions of the access of the consultants, researchers and citizens are still being evaluated, according to the current legislation.
3. Results and Discussion
A real-life pilot case has been carried out using data from industries located in the Province of Ascoli Piceno (Marche region, Italy) to evaluate the performance and benefits of the new developed tool. In the first phase of our study, only authorizations adopted at the provincial administrative level were considered.
A test period was scheduled to demonstrate the advantages of our work. Preliminary meetings with some stakeholders (staff, police forces, competent authorities and operators) were organized in order to present the project, collect the first data and evaluate opinions (Table 1). Then, these stakeholders were involved in a testing phase from October 2021 to June 2022 to verify the functionality, flexibility and ease of use of the tool. Research bodies will also be involved to improve the sharing sections of the evaluation results. At the end of this step, further feedback and advice will be collected for future implementations.

Table 1.
Results of the preliminary meetings.
All information concerning the authorization, the licensing processes and the analytical controls were entered in the database. Accordingly, the web platform (available at https://www.alfa2020.it/, accessed on 20 March 2022) proposed to the stakeholders the following interconnected modules.
3.1. Operator, Company Name and Installation Modules
The term “installation” implies a stationary technical unit where one or more activities are carried out at the same site that could have a negative environmental impact. Authorization is generally granted to the operator of an installation. The operator is the natural or legal person who is the owner or the manager of the installation and has the authority and ability to ensure compliance with the authorization [8]. He/she has to comply with regulations, directives and licenses, and to ensure that all necessary measures are taken to protect the environment [37].
Therefore, the installation module represents the centerpiece of the database, which links together all the other modules.
Data on the operator, company name and installation are available in the web platform, including address, coordinates, activities, tax code, Value Added Tax (VAT) identification number, date and place of birth, telephone number and mail address. Users can consult the above-mentioned data and view the spatial-distribution of the installations on the territory in the GIS map.
3.2. Administrative Procedure and Authorization Modules
The environmental authorization is a deed adopted by the competent authority at the end of an environmental administrative procedure that consists of a series of coordinated documents and activities to evaluate all public and private interests. During the licensing procedure, the competent authority has to consult all the statutory stakeholders.
The authorization has to ensure that private and public interests are equally respected. Therefore, it establishes pollutant emission limits, specific environmental provisions and/or conditions and deadlines. In addition, it may provide reference levels to calculate environmental charges or taxes to be paid by industries [8]. It is important that the operator has a management system which should be organized in such a way as to prevent pollution and maintain compliance with their licenses and conditions therein. The competent authorities are responsible for assessing and ensuring the operator’s compliance [37].
The administrative procedure modules support staff to improve the procedures’ management and ensure compliance with deadlines. For this purpose, personalized summary and always updated reports are made available to each of them.
Currently only staff can log into these sections, but the possibility of sharing some of this data with other users will be evaluated in the future.
Data on the Integrated Environmental Authorization (AIA) [12], Environmental Unique Authorization (AUA) [13] and Unique Authorization for waste disposal and recovery plants [12] are available to all users. Moreover, data on the administration deeds of communication or notification, not included in any environmental authorization, are entered too. The details of the administrative act, the expiration date, the necessary conditions and provisions are some of the related information.
It is important to consult this section for both current and previous authorizations. Here, the stakeholders can download the related documents and view the reports for monitoring the conditions or the deadlines set by the licenses.
3.3. Emissions Module
The inventory includes qualitative and quantitative information on industrial pollutant emissions into air and water. It is implemented with details on waste production and management.
This kind of information is a fundamental requirement to better understand environmental problems and identify the most effective emission reduction policies. Therefore, comprehensive emission inventories are useful both for scientific applications and political processes.
The emissions module of the web platform is divided in subsections according to the different environmental compartments. Stakeholders can consult all stored data, but they cannot modify or enter information directly. Data are updated periodically and are always specific for each pollutant, source and emission point. In particular, the following subsections are available in the web platform:
- ○
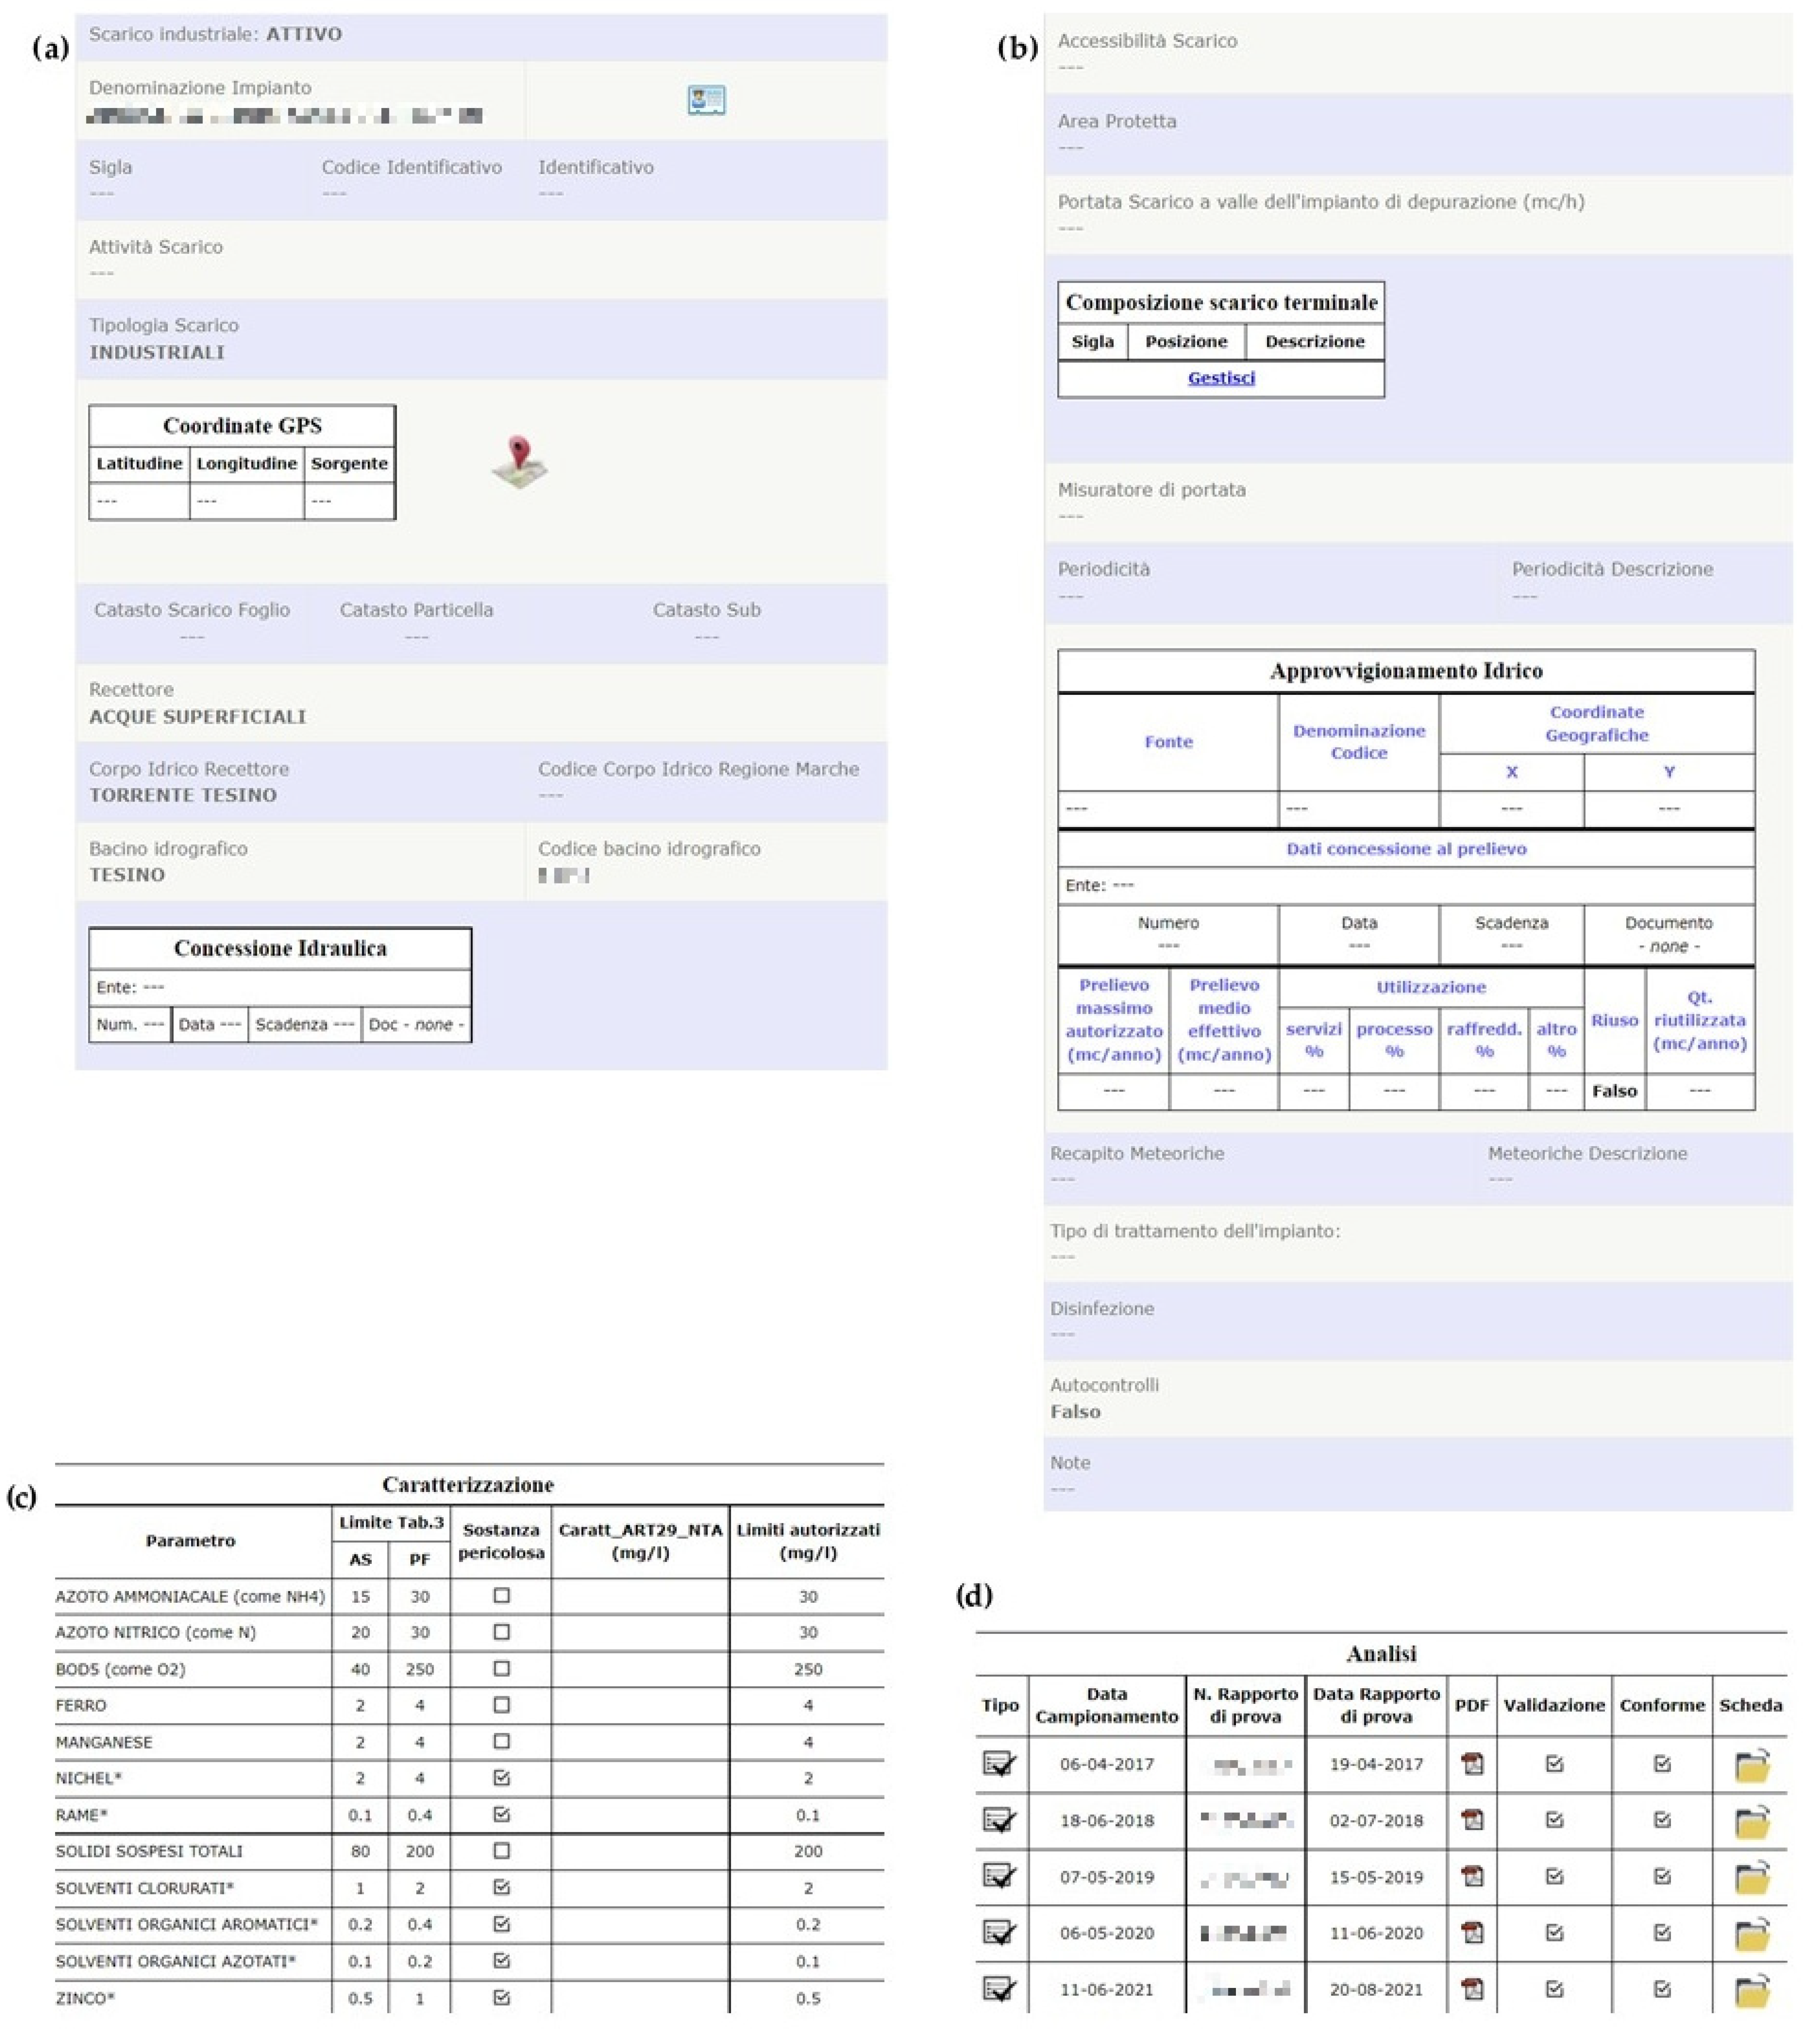
- Industrial wastewater (Figure 4). Here, there is the list of the authorized discharges of each industry, the related technical specifications, the coordinates of each discharge point, the information on the receptors, the treatment plant’s details (if required) and the authorized emission limits.
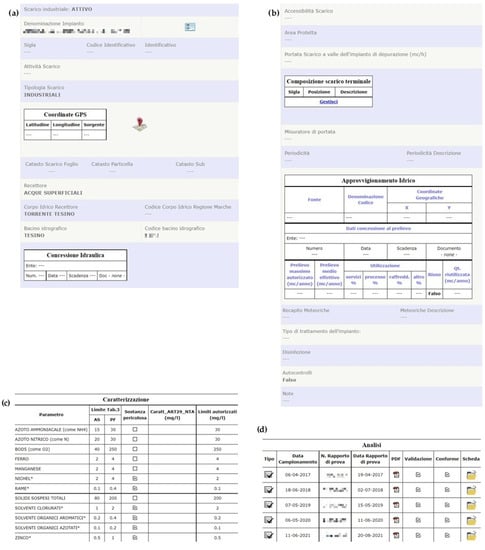 Figure 4. Example of the industrial wastewater subsection. (a) General information on a discharge point of an installation and the related receptor; (b) Technical specifications of the discharge; (c) Authorized emission limits; (d) List of the analytical checks carried out.
 - ○
- Urban sewage. Technical specifications of each purification plant, coordinates of the discharge point, information on the receptors and authorized emission limits are some of the available data.
- ○
- Atmospheric emissions. There is the list of the authorized emission points of each industry, the related technical specifications, the coordinates of each emission point, the treatment plant’s details (if required), the authorized emission limits, the information on the putting into operation and commissioning.
The waste management subsection are still being designed. Here, the following information will be provided: technical specifications and coordinates of the plant, types of waste treated, description of the waste treatment activities, types of disposal and recovery codes and details of the environmental management actions.
The emissions module is strictly interconnected with the environmental inspections module, where analytical data are available.
3.4. Environmental Inspections Module
The monitoring of industrial processes, their emissions and impact on the environment are key elements of regulatory control. Such monitoring may be undertaken by the competent authorities responsible for inspection duties. Industrial process operators may also be required to carry out inspections themselves and report their results to the competent authorities [37]. This self-monitoring by operators cannot replace government supervision, but it provides additional information based on which the competent authorities can judge whether an operator is compliant with the relevant legislation and license conditions [38]. In fact, environmental inspection means carrying out all actions, including site visits, monitoring of emissions and checks of internal reports and follow-up documents, verification of self-monitoring, checking the techniques used and adequacy of the environment management of the installation, undertaken by or on behalf of the competent authority to check and promote the compliance of installations with their permit conditions and, where necessary, to monitor their environmental impact [10].
Comparable emission data ought to be used when reviewing the compliance of industrial installations with the requirements set out in the environmental authorization provisions [39].
In the web platform, users can consult the results of self-monitoring and inspections, enter new analytical data and download reports.
These data could also be made available for research bodies involved in the analyses, modelling and assessment of the dispersion and impact of pollutants on the quality status of environmental matrices. For this purpose, a specific section is dedicated to the sharing of results of the analytical and statistical evaluations.
4. Conclusions
This research presents the preliminary results of designing and developing a database integrated with a web-based GIS platform to collect, manage and share environmental data.
The platform is: (1) based on open-source software, allowing it to be free of charge; (2) Interactive, intuitive and readily accessible to end-users. Stakeholders, primarily public authorities, can quickly and easily (from any device and at any time) consult environmental information for several purposes. These data are made available taking into account confidentiality constraints; and (3) A dynamic tool that meets local demands, to manage information as close as possible to its source. The platform is easily adaptable to the peculiarities and problems that characterize each territory.
However, the disadvantage is the requirement of periodic updates to the framework according to the evolution of legislation (e.g., through different stakeholders and environmental pressure).
Our future work will focus on testing the tools described in this report. In particular, the results of the Ascoli Piceno pilot case will be collected, processed and published. Furthermore, the application of these systems in different case studies will help to improve the available functions according to the user needs and the features of various territories.
Author Contributions
Conceptualization and writing—original draft preparation, G.G. (Giada Giglione); writing—review and editing, A.A., S.I. and G.P.; supervision, resources and project administration, G.G. (Gianni Giantomassi); software and visualization A.I., R.C. and G.B.; data acquisition F.C. and F.M. All authors have read and agreed to the published version of the manuscript.
Funding
Financial support was obtained from the Università Politecnica delle Marche under university funding for scientific research Ricerca Scientifica di Ateneo and is gratefully acknowledged.
Institutional Review Board Statement
Not applicable.
Informed Consent Statement
Not applicable.
Data Availability Statement
The data are available from the corresponding author, upon request.
Acknowledgments
Many thanks are due to the Provincia di Ascoli Piceno (in particular the Department of Environmental Protection and Enhancement), Ente Nazionale Energia e Ambiente (ENEA) and Confindustria Ascoli Piceno for the support given in many ways. The authors also wish to thank the police forces, competent authorities and operators involved in the testing phase.
Conflicts of Interest
The authors declare no conflict of interest.
References
- Daddi, T.; De Giacomo, M.R.; Frey, M.; Testa, F.; Iraldo, F. The implementation of IPPC directive in the Mediterranean area. In Environmental Management in Practice; Broniewicz, E., Ed.; IntechOpen: London, UK, 2011; pp. 119–144. [Google Scholar]
- Mirasgedis, S.; Hontou, V.; Georgopoulou, E.; Sarafidis, Y.; Gakis, N.; Lalas, D.P.; Loukatos, A.; Gargoulas, N.; Mentzis, A.; Economidis, D.; et al. Environmental damage costs from airborne pollution of industrial activities in the greater Athens, Greece area and the resulting benefits from the introduction of BAT. Environ. Impact Assess. Rev. 2008, 28, 39–56. [Google Scholar] [CrossRef]
- European Environment Agency (EEA). The European Environment—State and Outlook 2020: Knowledge for Transition to a Sustainable Europe; Publications Office of the European Union: Luxembourg, 2019. [Google Scholar]
- European Environment Agency (EEA). Industry Releases Thousands of Different Chemicals into the Environment. 2022. Available online: https://www.eea.europa.eu/themes/industry (accessed on 31 January 2022).
- Hey, C. EU Environmental Policies: A Short History of the Policy Strategies. EU Environmental Policy Handbook; European Environmental Bureau: Brussels, Belgium, 2005. [Google Scholar]
- European Environment Agency (EEA). Signals 2020—Towards Zero Pollution in Europe; Publications Office of the European Union: Luxembourg, 2020. [Google Scholar]
- Honkasalo, N.; Rodhe, H.; Dalhammar, C. Environmental permitting as a driver for eco-efficiency in the dairy industry: A closer look at the IPPC directive. J. Clean. Prod. 2005, 13, 1049–1060. [Google Scholar] [CrossRef]
- Organization for Economic Co-operation and Development (OECD). Integrated Environmental Permitting Guidelines for EECCA Countries; OECD: Paris, France, 2005; Available online: https://www.oecd.org/env/outreach/35056678.pdf (accessed on 31 January 2022).
- European Union (EU). Council Directive 96/61/EC of 24 September 1996 concerning integrated pollution prevention and control. Off. J. Eur. Communities 1996, 257, 26–40. Available online: https://eur-lex.europa.eu/legal-content/EN/TXT/PDF/?uri=CELEX:31996L0061&from=EN (accessed on 31 January 2022).
- European Parliament. Directive 2010/75/EU of the European parliament and of the Council of 24 November 2010, on industrial emissions (Integrated pollution prevention and control) (recast). Off. J. Eur. Union 2010, 334, 17–119. Available online: https://eur-lex.europa.eu/legal-content/EN/TXT/PDF/?uri=CELEX:32010L0075&from=EN (accessed on 31 January 2022).
- Industrial Emissions Directive. 2010. Available online: https://ec.europa.eu/environment/industry/stationary/ied/legislation.htm (accessed on 31 January 2022).
- Gazzetta Ufficiale della Repubblica Italiana. Decreto Legislativo 3 Aprile 2006, n. 152. Norme in Materia Ambientale. GU Serie Generale n. 88 del 14-04-2006. Suppl. Ordinario n. 96. 2006. Available online: https://www.gazzettaufficiale.it/dettaglio/codici/materiaAmbientale (accessed on 31 January 2022).
- Gazzetta Ufficiale della Repubblica Italiana. Decreto del Presidente della Repubblica 13 Marzo 2013, n. 59. Regolamento Recante la Disciplina dell’Autorizzazione Unica Ambientale e la Semplificazione di Adempimenti Amministrativi in Materia Ambientale Gravanti sulle Piccole e Medie Imprese e sugli Impianti non Soggetti ad Autorizzazione Integrata Ambientale, a Norma dell’Articolo 23 del Decreto-Legge 9 Febbraio 2012, n. 5, Convertito, con Modificazioni, dalla Legge 4 Aprile 2012, n. 35. 13G00101. GU Serie Generale n. 124 del 29-05-2013. Suppl. Ordinario n. 42. 2013. Available online: https://www.gazzettaufficiale.it/eli/id/2013/05/29/13G00101/sg (accessed on 31 January 2022).
- Zander, F.; Kralisch, S.; Busch, C.; Flügel, W.A. Environmental data management with the River Basin Information System. In Proceedings of the 19th International Congress on Modelling and Simulation, Perth, Australia, 12–16 December 2011. [Google Scholar] [CrossRef]
- Fedra, K. Urban environmental management: Monitoring, GIS, and modelling. Comput. Environ. Urban Syst. 1999, 23, 443–457. [Google Scholar] [CrossRef]
- Gkatzoflias, D.; Mellios, G.; Samaras, Z. Development of a web GIS application for emissions inventory spatial allocation based on open-source software tools. Comput. Geosci. 2013, 52, 21–33. [Google Scholar] [CrossRef]
- Calheiros, R.; Marques, J.E.; Teodoro, A.C.; Duarte, L. A Web GIS application to assess the groundwater vulnerability to pollution using the DRASTIC index. In Proceedings of the 2021 4th International Conference on Geoinformatics and Data Analysis (ICGDA 2021), Marseille, France, 14–16 April 2021; pp. 41–45. [Google Scholar]
- Mondejar, M.E.; Avtar, R.; Diaz, H.L.B.; Dubey, R.K.; Esteban, J.; Gómez-Morales, A.; Hallam, B.; Mbungu, N.T.; Okolo, C.C.; Prasad, K.A.; et al. Digitalization to achieve sustainable development goals: Steps towards a Smart Green Planet. Sci. Total Environ. 2021, 794, 148539. [Google Scholar] [CrossRef] [PubMed]
- Ghaemi, P.; Swift, J.; Sister, C.; Wilson, J.P.; Wolch, J. Design and implementation of a web-based platform to support interactive environmental planning. Comput. Environ. Urban Syst. 2009, 33, 482–491. [Google Scholar] [CrossRef]
- Karnatak, H.C.; Saran, S.; Bhatia, K.; Roy, P.S. Multicriteria spatial decision analysis in web GIS environment. Geoinformatica 2007, 11, 407–429. [Google Scholar] [CrossRef]
- Culshaw, M.G.; Nathanail, C.P.; Leeks, G.J.L.; Alker, S.; Bridge, D.; Duffy, T.; Fowler, D.; Packman, J.C.; Swetnam, R.; Wadsworth, R.; et al. The role of web-based environmental information in urban planning—The environmental information system for planners. Sci. Total Environ. 2006, 360, 233–245. [Google Scholar] [CrossRef] [PubMed]
- Simão, A.; Densham, P.J.; Haklay, M.M. GIS for collaborative planning and public participation: An application to the strategic planning of wind farm sites. J. Environ. Manag. 2008, 90, 2027–2040. [Google Scholar] [CrossRef] [PubMed]
- EU’s INSPIRE Directive. 2007. Available online: https://inspire.ec.europa.eu/inspire-directive/2 (accessed on 11 March 2022).
- Liu, X.; Truppe, S.; Meijer, G.; Pérez-Rìos, J. The diatomic molecular spectroscopy database. J. Cheminform. 2020, 12, 31. [Google Scholar] [CrossRef] [PubMed]
- Apache Tomcat. 1999. Available online: https://tomcat.apache.org/ (accessed on 18 March 2022).
- Linux. 2022. Available online: https://www.linux.com/what-is-linux/ (accessed on 18 March 2022).
- Apache HTTP Server Project. 1997. Available online: https://httpd.apache.org/ (accessed on 18 March 2022).
- MySQL. 2022. Available online: https://www.mysql.com/ (accessed on 18 March 2022).
- PHP. 2001. Available online: https://www.php.net/ (accessed on 18 March 2022).
- Gelbmann, M.; Andlinger, P. MySQL is the DBMS of the Year 2019. 2020. Available online: https://db-engines.com/en/blog_post/83 (accessed on 20 March 2022).
- Gobakis, K.; Mavrigiannaki, A.; Kalaitzakis, K.; Kolokotsa, D.D. Design and development of a Web based GIS platform for zero energy settlements monitoring. Energy Procedia 2017, 134, 48–60. [Google Scholar] [CrossRef]
- Introducing Json. 1999. Available online: https://json.org (accessed on 11 March 2022).
- Geocoding API. 2022. Available online: https://developers.google.com/maps/documentation/geocoding/overview (accessed on 31 January 2022).
- Gaffney, P. Developing a statewide emission inventory using geographic information systems (GIS). In Proceedings of the 11th U.S. EPA-Annual Emission Inventory Conference, Atlanta, GA, USA, 15–18 April 2002; Available online: https://www3.epa.gov/ttnchie1/conference/ei11/modeling/gaffney.pdf (accessed on 31 January 2022).
- Agenzia per l’Italia Digitale. Linee Guida Siti Web delle PA. Art 4 della Direttiva 8/2009 del Ministro per la Pubblica Amministrazione e l’Innovazione. 2011. Available online: https://www.agid.gov.it/sites/default/files/repository_files/linee_guida/linee_guida_siti_web_delle_pa_2011_0.pdf (accessed on 31 January 2022).
- The World Wide Web Consortium (W3C). 2022. Available online: https://www.w3.org/ (accessed on 31 January 2022).
- IMPEL. Operator Self-Monitoring. European Union Network for the Implementation and Enforcement of Environmental Law. February 1999. Available online: https://www.impel.eu/wp-content/uploads/2016/09/Reference-book-1999.pdf (accessed on 1 October 2021).
- Organization for Economic Co-operation and Development (OECD). Technical Guide on Environmental Self-Monitoring in Countries of Eastern Europe, Caucasus, and Central Asia; OECD: Paris, France, 2007; Available online: https://www.oecd.org/environment/outreach/39462930.pdf (accessed on 31 January 2022).
- Saarinen, K. A method to improve the international comparability of emission data from industrial installations. Environ. Sci. Policy 2003, 6, 355–366. [Google Scholar] [CrossRef]
Publisher’s Note: MDPI stays neutral with regard to jurisdictional claims in published maps and institutional affiliations. |
© 2022 by the authors. Licensee MDPI, Basel, Switzerland. This article is an open access article distributed under the terms and conditions of the Creative Commons Attribution (CC BY) license (https://creativecommons.org/licenses/by/4.0/).