Article

Geophysical Imaging of the Critical Zone along the Eastern Betic Shear Zone (EBSZ), SE Iberian Peninsula

by
Handoyo Handoyo
1,2,3,
Juan Alcalde
1,*,
Irene DeFelipe
4,
Imma Palomeras
4,
Raquel Martín-Banda
5,
Julián García-Mayordomo
5,
David Martí
6,
José J. Martínez-Díaz
7,
Juan Miguel Insua-Arévalo
7,
Teresa Teixidó
8,
Ignacio Marzán
5 and
Ramon Carbonell
1
1
Geosciences Barcelona (GEO3BCN, CSIC), 08028 Barcelona, Spain
2
Teknik Geofisika, Institut Teknologi Sumatera, South Lampung 35365, Indonesia
3
Facultat de Ciències de la Terra, Universitat de Barcelona, 08028 Barcelona, Spain
4
Departamento de Geología, Universidad de Salamanca, 37008 Salamanca, Spain
5
Instituto Geológico y Minero de España (IGME-CSIC), 28003 Madrid, Spain
6
Lithica SCCL, Santa Coloma de Farners, 17430 Girona, Spain
7
Department of Geodynamics, Stratigraphy and Paleontology, Universidad Complutense de Madrid, 28040 Madrid, Spain
8
Instituto Andaluz de Geofísica y Prevención de Desastres Sísmicos, Universidad de Granada, 52005 Granada, Spain
*
Author to whom correspondence should be addressed.
Appl. Sci. 2022, 12(7), 3398; https://doi.org/10.3390/app12073398
Submission received: 26 January 2022 / Revised: 23 March 2022 / Accepted: 23 March 2022 / Published: 27 March 2022
(This article belongs to the Special Issue Integration of Methods in Applied Geophysics)

Abstract

:
The critical zone (CZ) represents the most-shallow subsurface, where the bio-, hydro-, and geospheres interact with anthropogenic activity. To characterize the thickness and lateral variations of the CZ, here we focus on the Eastern Betic Shear Zone (EBSZ), one of the most tectonically active regions in the Iberian Peninsula. Within the EBSZ, the Guadalentín Depression is a highly populated area with intensive agricultural activity, where the characterization of the CZ would provide valuable assets for land use management and seismic hazard assessments. To achieve this, we have conducted an interdisciplinary geophysical study along the eastern border of the Guadalentín Depression to characterize the CZ and the architecture of the shallow subsurface. The datasets used include Electrical Resistivity Tomography (ERT), first-arrival travel time seismic tomography, and multichannel analysis of surface waves (MASW). The geophysical datasets combined help to constrain the high-resolution structure of the subsurface and image active fault systems along four transects. The resulting geophysical models have allowed us to interpret the first ~150 m of the subsurface and has revealed: (i) the variable thickness of the CZ; (ii) the CZ relationship between the fault zone and topographic slope; and (iii) the differences in CZ thickness associated with the geological units. Our results provide a method for studying the shallow subsurface of active faults, complementing previous geological models based on paleo-seismological trenches, and can be used to improve the CZ assessment of tectonically active regions.

1. Introduction

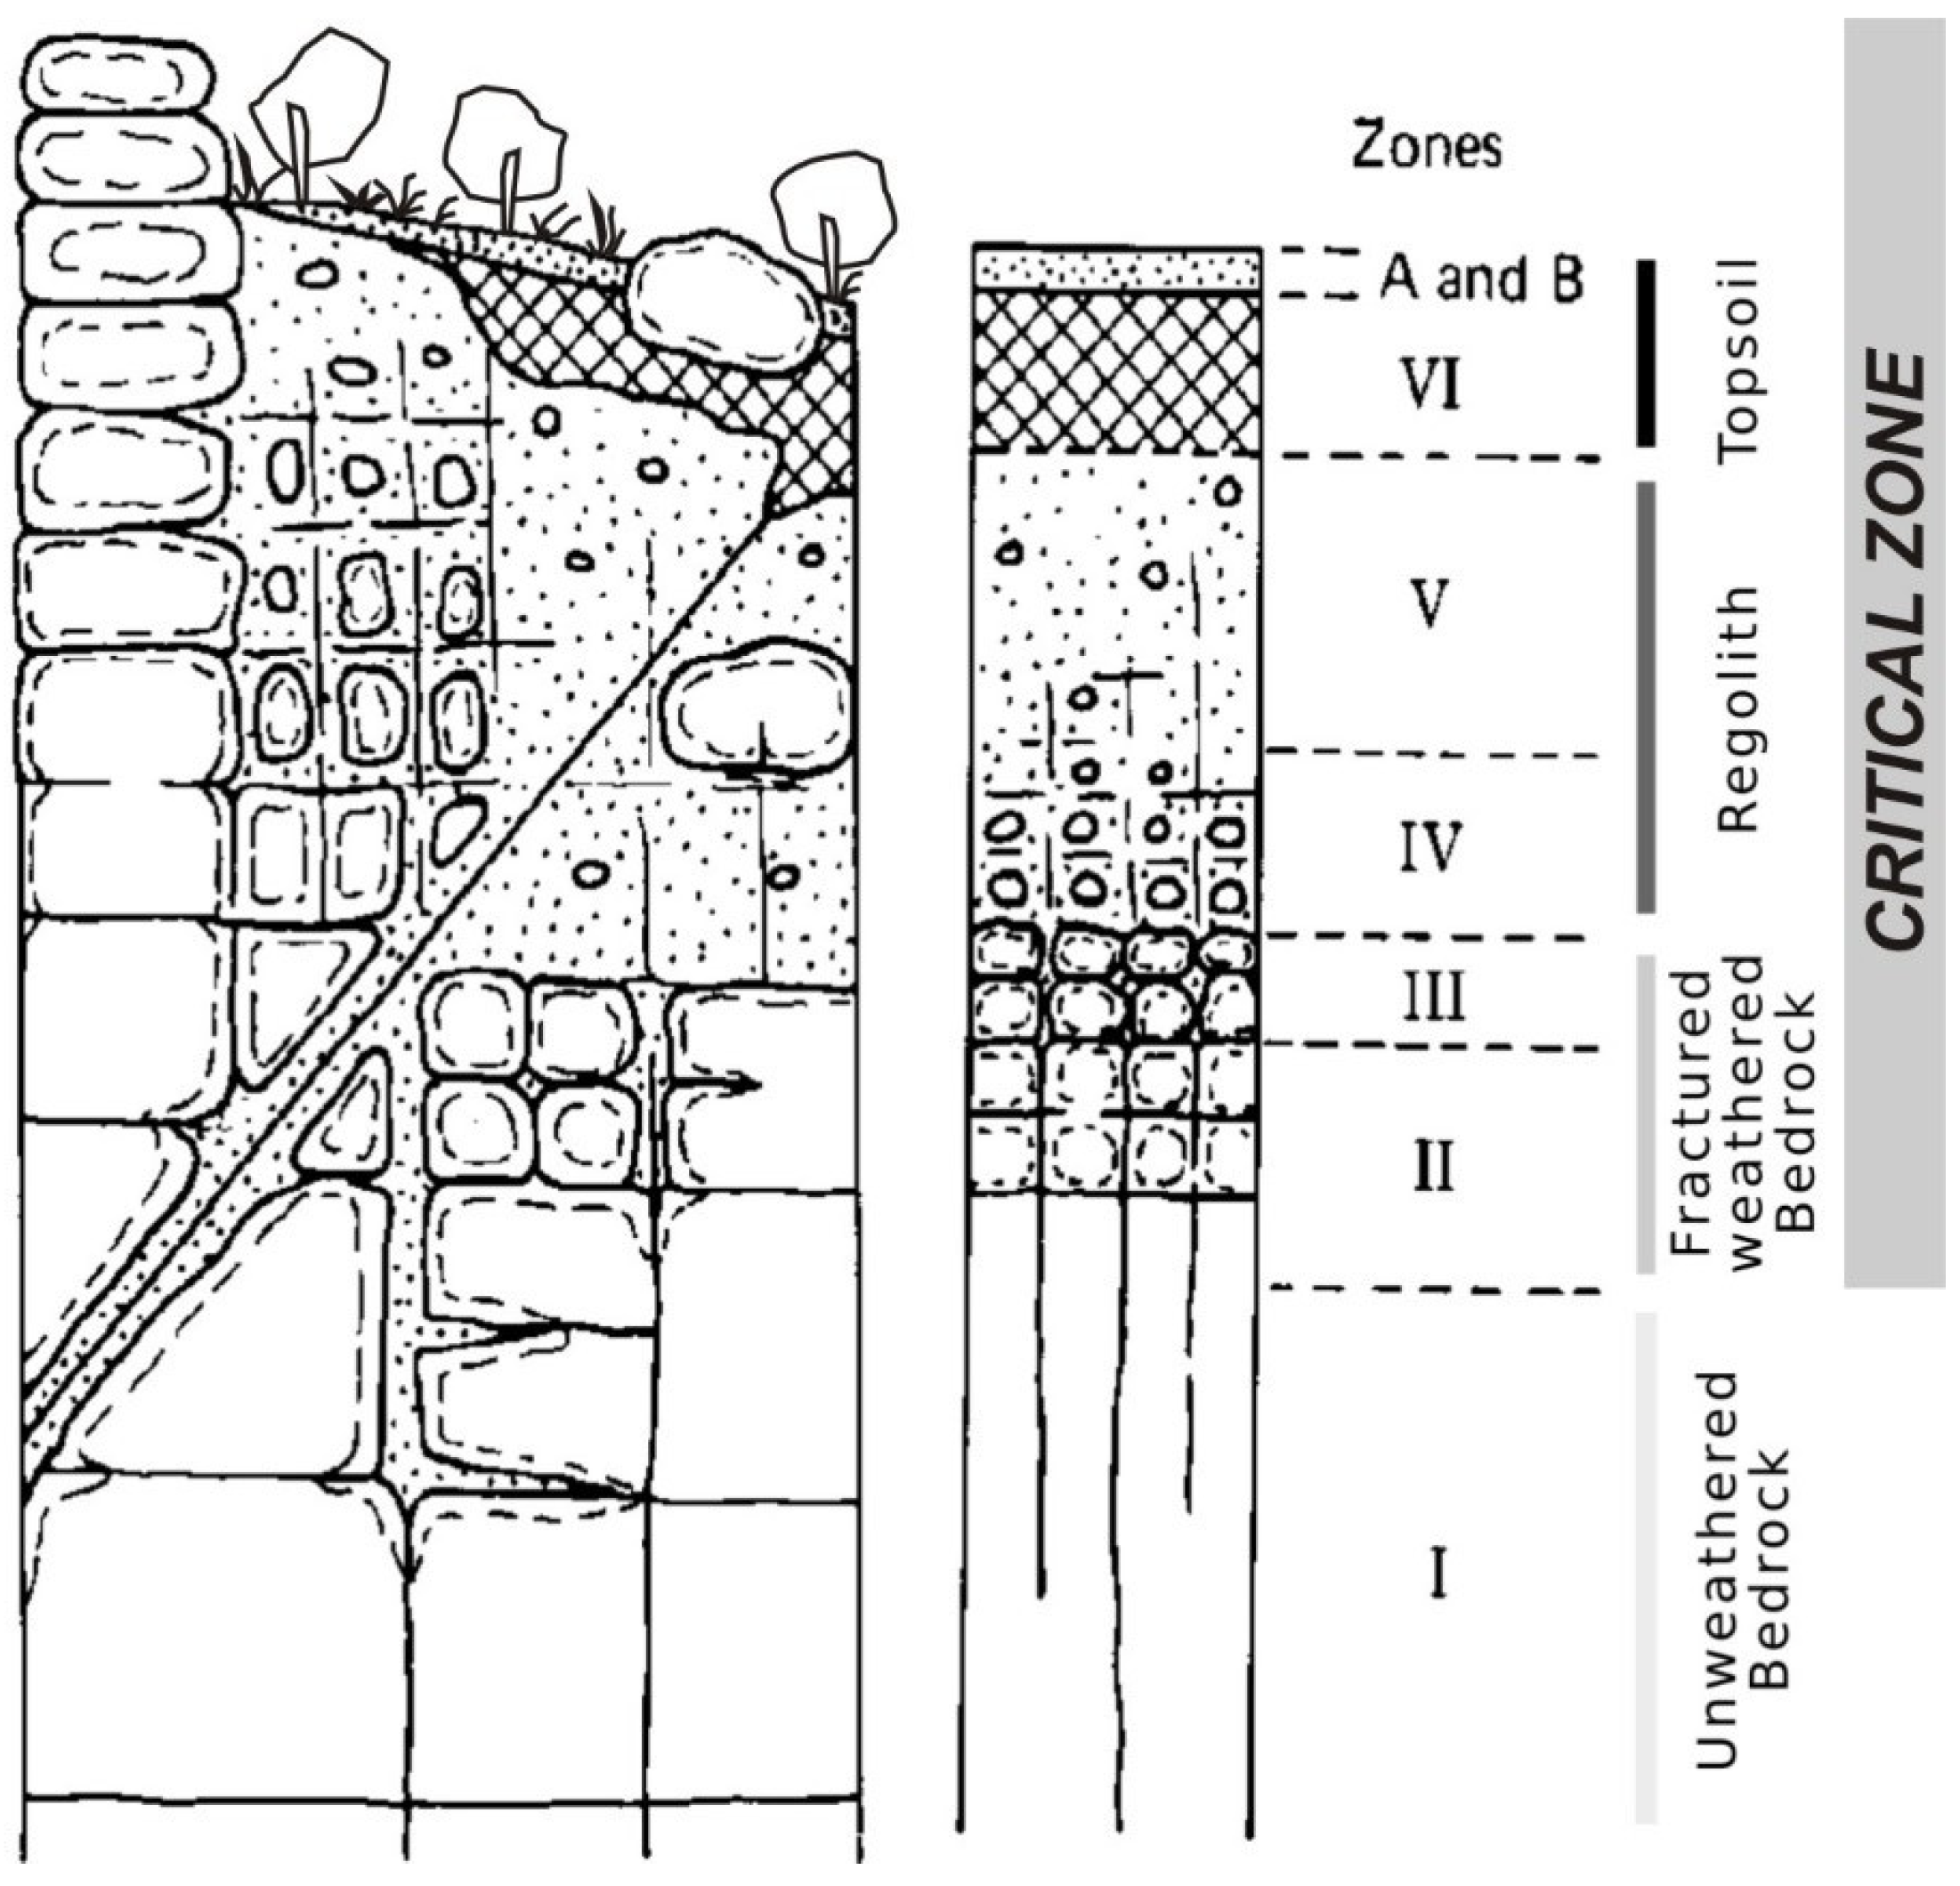
The critical zone (CZ) defines the outermost surface layer of the earth, where the atmosphere, meteoric water, biota, soil, and bedrock interact [1,2]. The CZ extends from the unaltered rock to the top of the canopy of plant vegetation on the ground surface [3] (Figure 1). The CZ hosts life and the energy and resources to sustain it, and it is the subject of an increasing body of research. Researchers and government entities have highlighted the role of the CZ for our society in different economic and environmental aspects, and the need for a correct and robust characterization of this important layer [4,5,6,7].
The CZ, from top to bottom, comprises: the soil (that includes the organic horizon, the surface horizon A, and the subsoil horizon B), regolith, fractured bedrock, and fresh bedrock (Figure 1). The CZ also comprises the near-surface aquifers. The formation of the CZ is a combination of two important processes, namely: (i) soil layer erosion, which can remove weathered materials from the topsoil surface (surface topography), and (ii) rock weathering processes, which occur mechanically and chemically and that can break down rock layers, separating the underlying altered bedrock and fresh bedrock [8,9,10]. The thickness of the CZ can range from 0.7 m to 223.5 m, being thicker in midlatitudes [11].
The production of regolith from fractured bedrock can increase the surface area and distribution of weatherable minerals and expose them to increased water intrusion from the surface. The thickness of the regolith controls groundwater storage and flow paths in highly complex system landscapes such as mountainous landscapes and is highly correlated with topographic slopes or gradients [12,13]. All the activity that occurs in the CZ will greatly determine the level of mass and energy exchange between the biosphere system, the regolith layer, and the earth’s atmosphere [14,15,16,17]. Thus, understanding the geometry, area, and physical properties of the CZ is crucial for the sustainability of the surrounding ecosystem.
Figure 1. Simplified model of the critical zone regarding the weathering profile developed on rock masses (modified from [18,19,20]). Zones I to VI defined by the degree of weathering [18].
Applsci 12 03398 g001
Geophysical methods have been used in the past to try to characterize and constrain the CZ, its formation, and the processes that occur within it, e.g., the analysis of deep rock weathering and groundwater storage potential; studies on transport processes, reactivation, and kinetics processes; imbalances of chemical processes in the water surface boundary plane, and tectonic fracture activity [21,22,23,24]. These processes are interrelated and influence each other in the formation of the CZ. Some works that focused on the study of the CZ used seismic wave velocities and electrical resistivity to demonstrate the influence of topographic stress and fault activity on bedrock fault distribution [25,26]. Specifically, in the EBSZ, the structure of the CZ was first characterized by P-wave tomography and MASW across the frontal strands of the Carrascoy fault system, namely the Algezares-Casas Nuevas fault (ACNF) [27]—in review. This study revealed the underground structure, the CZ, and the damage zone related to blind faults buried under the Guadalentín Depression. Nevertheless, the along-strike variations of the structure in the EBSZ and the CZ thickness and properties could not be estimated, requiring a comprehensive geophysical study along with different areas of this fault system.
In this study, we investigate the geometry of different fault zones and the distribution of the CZ using coincident seismic and electrical surveys in the EBSZ along four profiles (La Torrecilla, La Salud North, La Salud South, and Carrascoy). To characterize the CZ along the EBSZ, we have used indirect geophysical methods, including P-wave tomography, Multichannel Analysis of Surface Waves (MASW), and Electrical Resistivity Tomography (ERT) on the profiles of La Torrecilla and La Salud North. Meanwhile, the P-wave tomography and MASW were applied to the profiles of La Salud South and Carrascoy. The main goals of this investigation are to map the CZ, to characterize fault structure, to map the weathered distributions in the subsurface that are influenced by fault activity and topographic slope, and to study the relationship between geological units and the thickness of the CZ.

2. Geological Setting

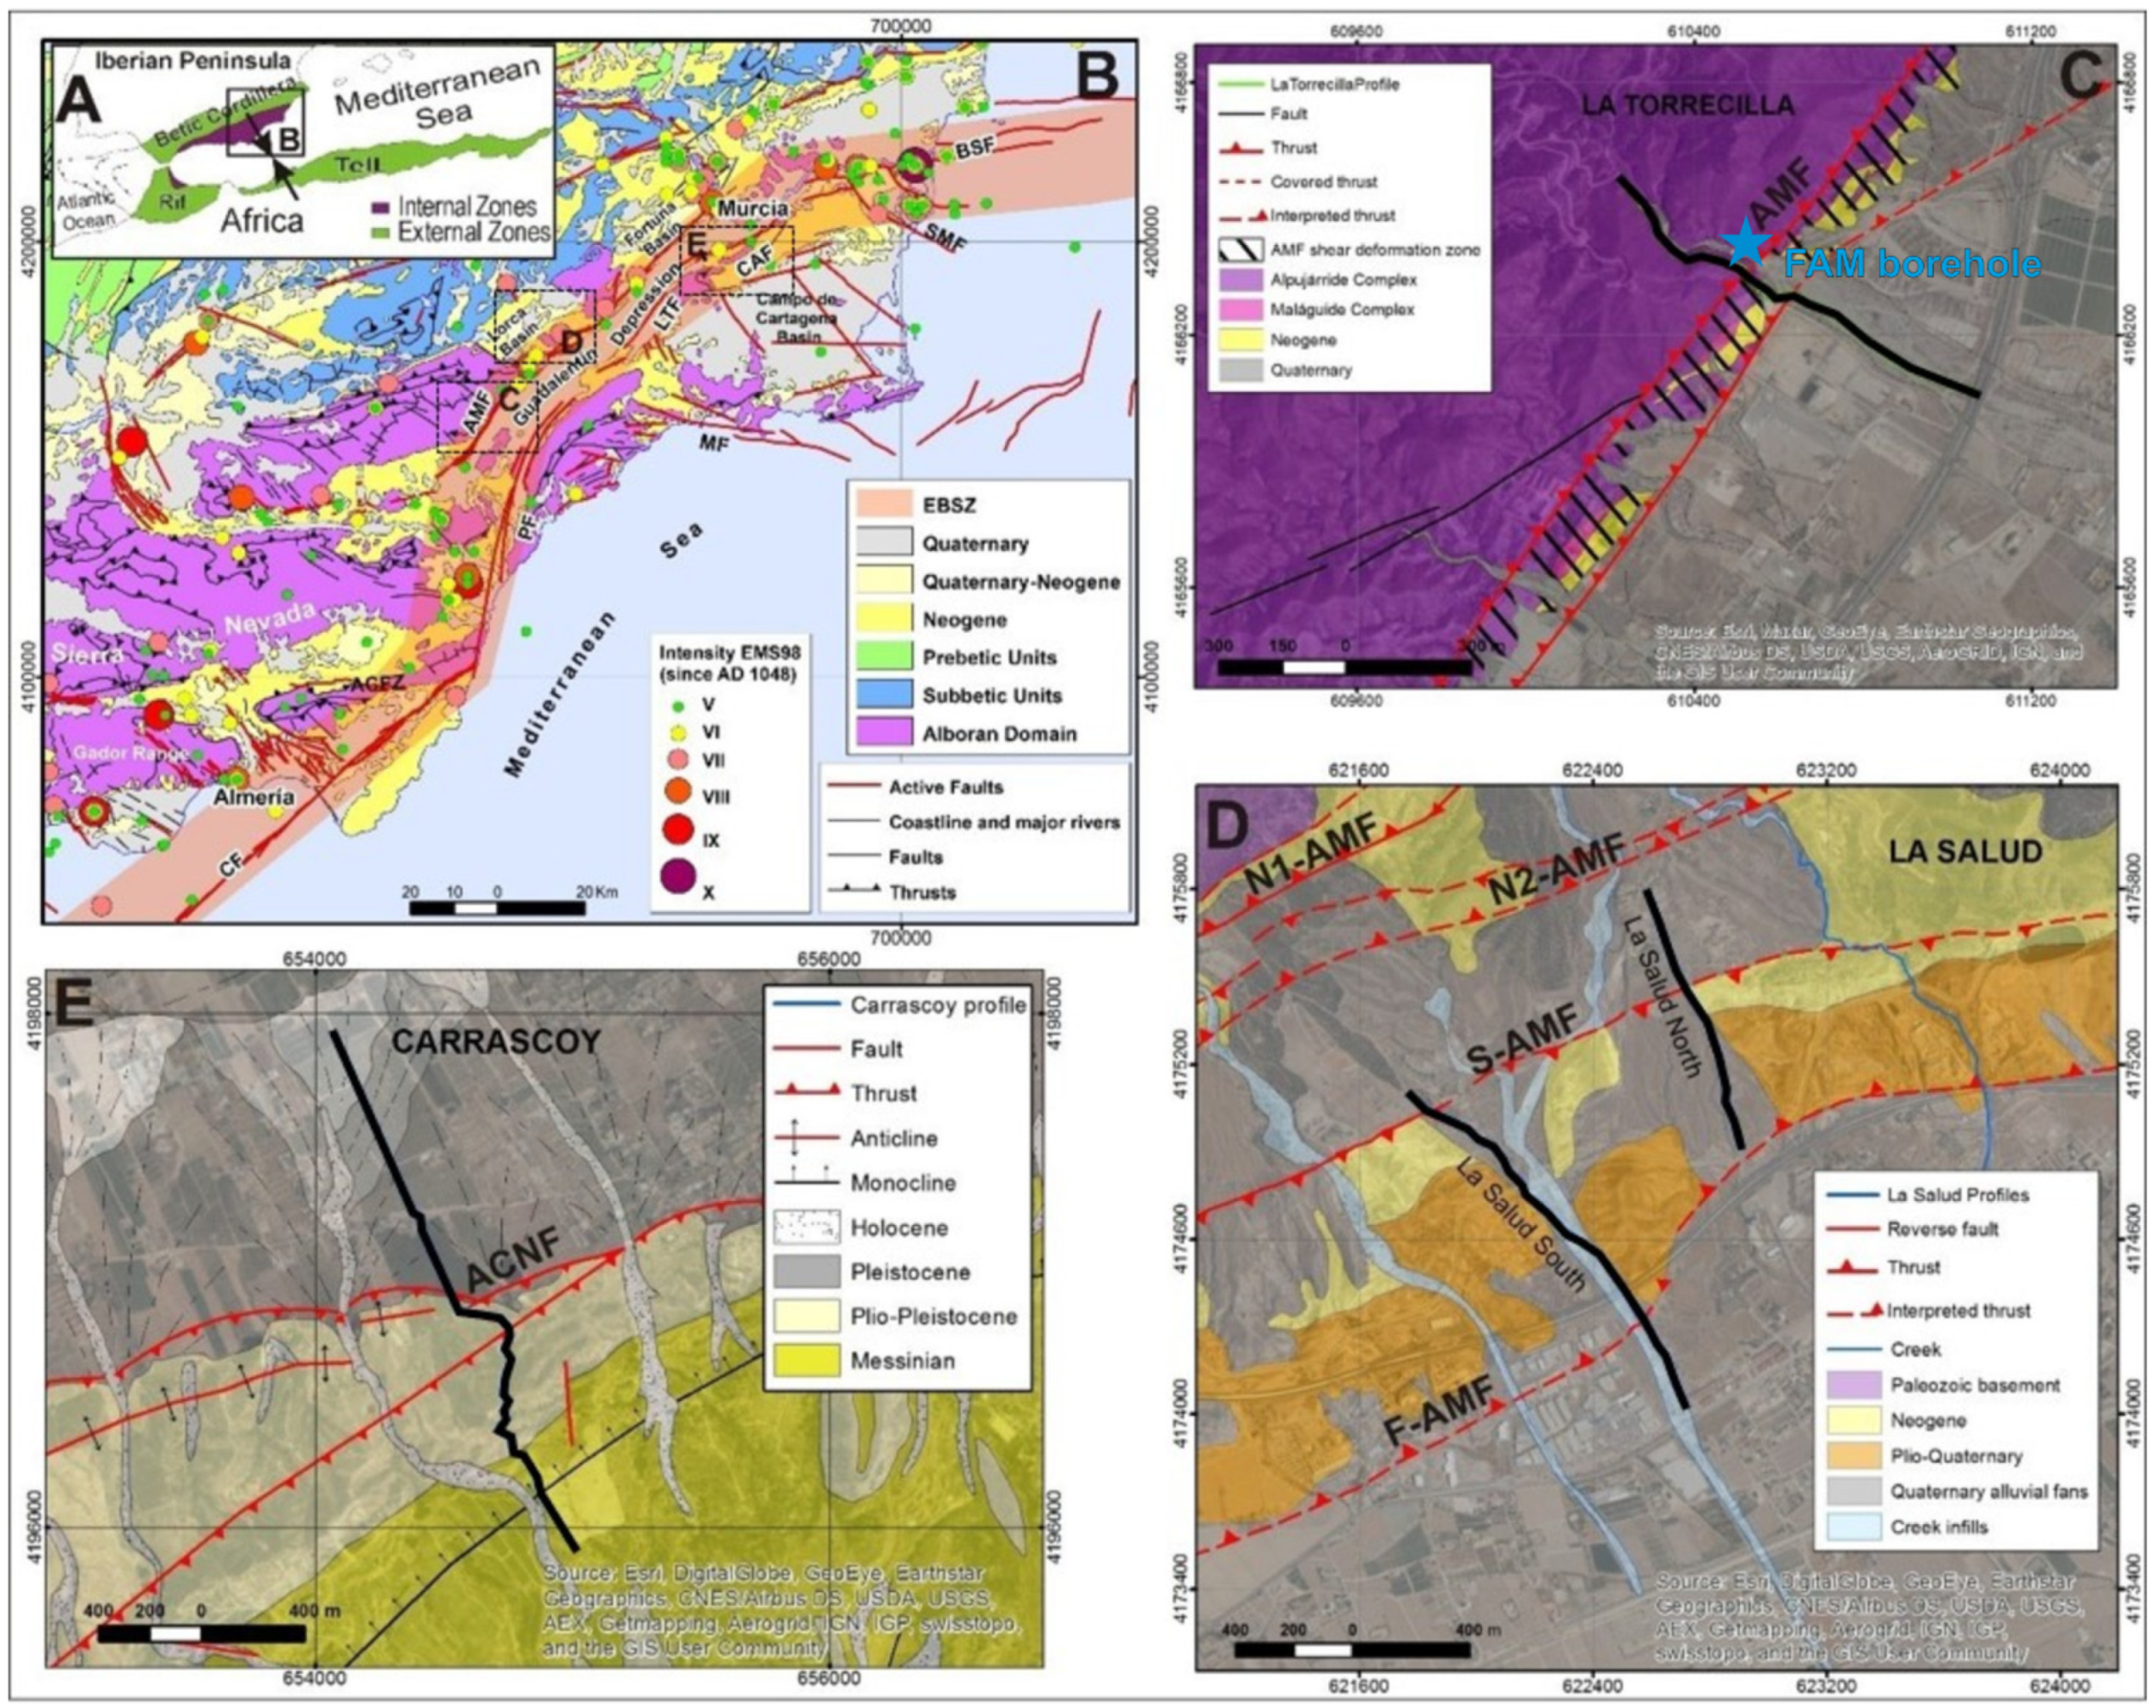
The EBSZ runs across the Internal Zone of the Betic Cordillera, a mountain belt that resulted from the convergence between the Nubian and Eurasian plates since the late Neogene (Figure 2A) [28,29]. The Internal Zone is formed by a stack of tectometamorphic complexes formed of Paleozoic, Mesozoic, and Cenozoic rocks that were exhumed during the Paleogene [30,31]. Subsequently and until the middle Miocene (Serravalian), former thrusts were reactivated as low-angle normal faults under extensional tectonics related to the opening of the South Balearic basin (e.g., [32,33]).
Partly coetaneous with this extension (from the Langhian to the Messinian), an intense magmatic activity took place in this area [34], and Neogene sedimentary basins formed (e.g., Lorca and Fortuna basins) [35]. At the end of the Messinian/beginning of the Pliocene, the tectonic convergence between the Nubian and Eurasian plates under an NNW-SSE regional shortening direction [28,36,37], inverted previous Neogene basins, and the Guadalentín Depression formed in an area that was previously uplifted [35,38,39]. Furthermore, the NNW-SSE regional shortening direction has not changed in the region since the late Miocene [40], as evidenced by GPS data.
The study area is located in the central and northern part of the EBSZ (Figure 2B). There, the Guadalentín Depression is bordered to the north by the Alhama de Murcia fault (AMF) and to the south by the Carrascoy fault system (CAF), NE-SW left-lateral strike-slip faults with a reverse component [41] (Figure 2B). The AMF is divided in four sections from SW to NE according to their geomorphological expressions, seismicity rates and fault zone geometries [42]: (i) Góñar-Lorca, a N40E narrow fault zone that ends in a horsetail to the south; (ii) Lorca-Totana, a section with a N60E trend and ~2 km wide fault zone where Gómez-Novell [43] identifies at least five strands; (iii) Totana-Alhama de Murcia, also with numerous strands, which recovers the N40E trend and loses geomorphological expression (outcrop of fault plane) northeastward; and (iv) Alhama de Murcia-Alcantarilla, where this expression is very diffuse, possibly because the deformation in this sector is transferred to CAF [42]. In turn, the CAF is formed by two overlapping segments [44].
Figure 2. Geological setting of the study area. (A) Geodynamic frame of the study area. Arrows indicate the current approximation direction between Eurasian and Nubian plates. (B) Geological and seismological setting of the Eastern Betic Shear Zone (EBSZ); SMF: San Miguel de Salinas Fault; BSF: Bajo Segura Fault; CAF: Carrascoy Fautl; LTF: Los Tollos Fault; AMF: Alhama de Murcia Fault; PF: Palomares Fault; CF: Carboneras Fault; ACFZ: Alpujarrides Corridor Fault Zone; MF: Las Moreras-Escarpe de Mazarrón Fault. Geological mapping was carried out from Continuous Digital Maps at scale of 1:50.000 of the Internal Zones of the Betic Cordillera [45]. Active fault traces are from an updated version of QAFI database [46,47]. Earthquake data correspond to a declustered version of the Spanish national seismic catalog [48]. (CE) represent the locations of Figure 2C–E. Geological setting of the La Torrecilla profile modified from Martínez-Díaz et al. [49]. The blue star marks the position of the scientific borehole FAM-1. AMF: Alhama de Murcia Fault. (D) Geological setting of the La Salud North and La Salud South profiles modified from Gómez-Novell [43]. N1-AMF, N2-AMF, S-AMF, and F-AMF are the names of the different strands of the AMF in this sector. (E) Geological setting of the Carrascoy profile modified from Martín-Banda et al. [44]. ACNF: Algezares-Casas Nuevas Fault.
Applsci 12 03398 g002
The SW segment is represented by: (i) the Carrascoy fault sensu lato, that uplifted the Carrascoy Range, and (ii) the Algezares-Casas Nuevas fault (ACNF), that runs for 23 km from the villages of Algezares to Casas Nuevas [44,50]. This area was studied by MASW and P-wave tomography, revealing the underground structure, damage zone related to blind faults, and allowed us to propose a vertical slip rate for the Algezares-Casas Nuevas fault of 0.66 ± 0.06 m/kyr since 209.1 ± 6.2 ka [27]—submitted.
The La Torrecilla profile is located in the northern sector of the Góñar-Lorca section of the AMF (Figure 2C). A single strand and 100 m wide deformation shear zone separates the metamorphic rocks from the Quaternary deposits of the Guadalentín Depression (Figure 2C). The AFM in this area was also investigated with the drilling of the 175 m scientific borehole FAM-1 (Figure 3, location in Figure 2). The FAM-1 borehole was drilled to examine the mineralogical and geomechanical behavior of the AFM fault zone, by sampling both fault zone and unaltered deposits [51]. The well-log data acquired included gamma ray (GR), Vp, Vs, and resistivity, and more than 100 m of core samples were recovered.
The Góñar-Lorca shear zone shows deformed Upper Miocene materials (marls, sandstones, and conglomerates) and a 20 m wide band of fault gouge that involves Alpujárride and Maláguide Complexes (phyllites, quartzites, and schists). The La Salud South and North profiles are located in the center of the Lorca-Totana section of the AMF (Figure 2D). In this sector, the fault controls Neogene sedimentary rocks from the Guadalentín Depression (mainly marls and gypsums) and Paleozoic rocks from the Alborán Domain (phyllites, quartzites, and schists). The La Salud South profile runs through the two southernmost strands (S-AMF) and the frontal branch (F-AMF) from the four identified in this section (e.g., [43,52,53,54]). In Figure 2D, the La Salud North profile does not reach the southernmost strand (F-AMF) but it does in the central strand (S-AMF) [43]. This portion of the S-AMF was also studied by Martí et al. (2020) employing magnetotelluric methods. Finally, the Carrascoy profile is located in the SW Segment of CAF (E; Figure 2B). Specifically, it crosses the fold-and-thrust system that conforms the ACNF on the foreland of the Carrascoy Range (Figure 2E) constituted by Upper Miocene marine sedimentary rocks (marl, biocalcarenite, and limestone) and Pliocene-middle Pleistocene continental deposits (conglomerate, gravel, sand, marl, limestone, etc.) (e.g., [44]). The youngest materials are middle Pleistocene to Holocene alluvial deposits that fill the Guadalentín Depression in all studied sectors. They correspond with at least five generations of alluvial fan systems and valley floor deposits, constituting an example of the transition from alluvial to fluvial sedimentary systems [55].

3. Geophysical Data and Methodology

The geophysical data used in this study consisted of two datasets, namely electrical resistivity data and seismic data. Resistivity data were obtained from the Electrical Resistivity Tomography (ERT) method, while seismic data (Vp and Vs) were obtained from the multi-channel analysis of surface waves (MASW) and P-wave travel time tomography. The resistivity and seismic data used in this study were acquired within the INTER GEO research project, which was funded by the Spanish national research program.

3.1. Electrical Resistivity Tomography

The ERT method allows the electrical resistivity properties of rocks beneath the surface to be calculated and is a well-established method in near-surface characterization studies [56,57,58,59]. The subsurface resistivity is strongly influenced by a rock’s properties, such as porosity, mineral composition, fluid content, and fault structure [60,61]. In this study, the ERT method was only applied in Torrecilla and La Salud North.
The ERT data was acquired with a 12-channel resistivimeter (ABEM Terrameter-RL-12) that involves 80 electrodes deployed at 10 m spacing. The electric spread consists of four lines with 21 electrode connections. For electronic continuity of the entire survey, the first and last electrodes are always overlapped between two lines (21-1 connections). This means that we worked with four cables registering at same time covering 800 m length in total. In order to reach the entire length of the profiles, we used the overlap technique shifting one electric line (21 electrodes) [62]. The apparent resistivities were obtained with the gradient-plus electrode protocol, a hybrid electrode configuration that involves a combination of the symmetric Wenner-Schlumberger with the asymmetric dipole–dipole [63,64]. This configuration provides a dense near-surface coverage and allows an investigation target of more than 120 m depth.
During the field acquisition the data quality was controlled by measuring each pseudo-midpoint twice, and for differences of apparent resistivities > 1%, four measures were averaged. The processing workflow used is described in Table 1. To obtain the 2D geoelectric models, we use two commercial software packages, Porosys II (www.iris-instruments.com/, accessed on 22 March 2022) and Resix2Dinv (www.geometrics.com, accessed on 22 March 2022). The first one was used to review the raw data, remove negative values, and define the track geometries. In a second stage, the Resix2Dinv inversion software was run twice: first, with only the most spurious data removed; and second, with a new dataset including data with apparent resistivity differences lower than 25% (an example of this procedure for the La Torrecilla profile is shown in Figure 4). The resulting final models of Torrecilla and La Salud North profiles after 5 and 7 iterations, respectively, had absolute errors of 5.8 and 7.2, respectively.

3.2. Seismic Data Acquisition

The seismic reflection acquisition experiment included four dense transects across different sections of the fault system. The seismic recording scheme was a 240-channel system made up of 10 GEODE recording units with 24 channels each. The seismic source was a 200 kg accelerated weight-drop provided by the University of Lisbon’s Instituto Tecnico Superior (Lisbon, Portugal). The acquisition geometry was designed with a 6 m shot spacing and a 2 m receiver interval. The sample rate was 1 ms, and the total recording time was 4 s. The data was collected using single vertical component exploration geophones with a natural frequency of 5 Hz (Table 2). The seismic data acquired were used in both MASW and P-wave tomography methods described in the next sections.

3.3. Multichannel Analysis of Surface Waves

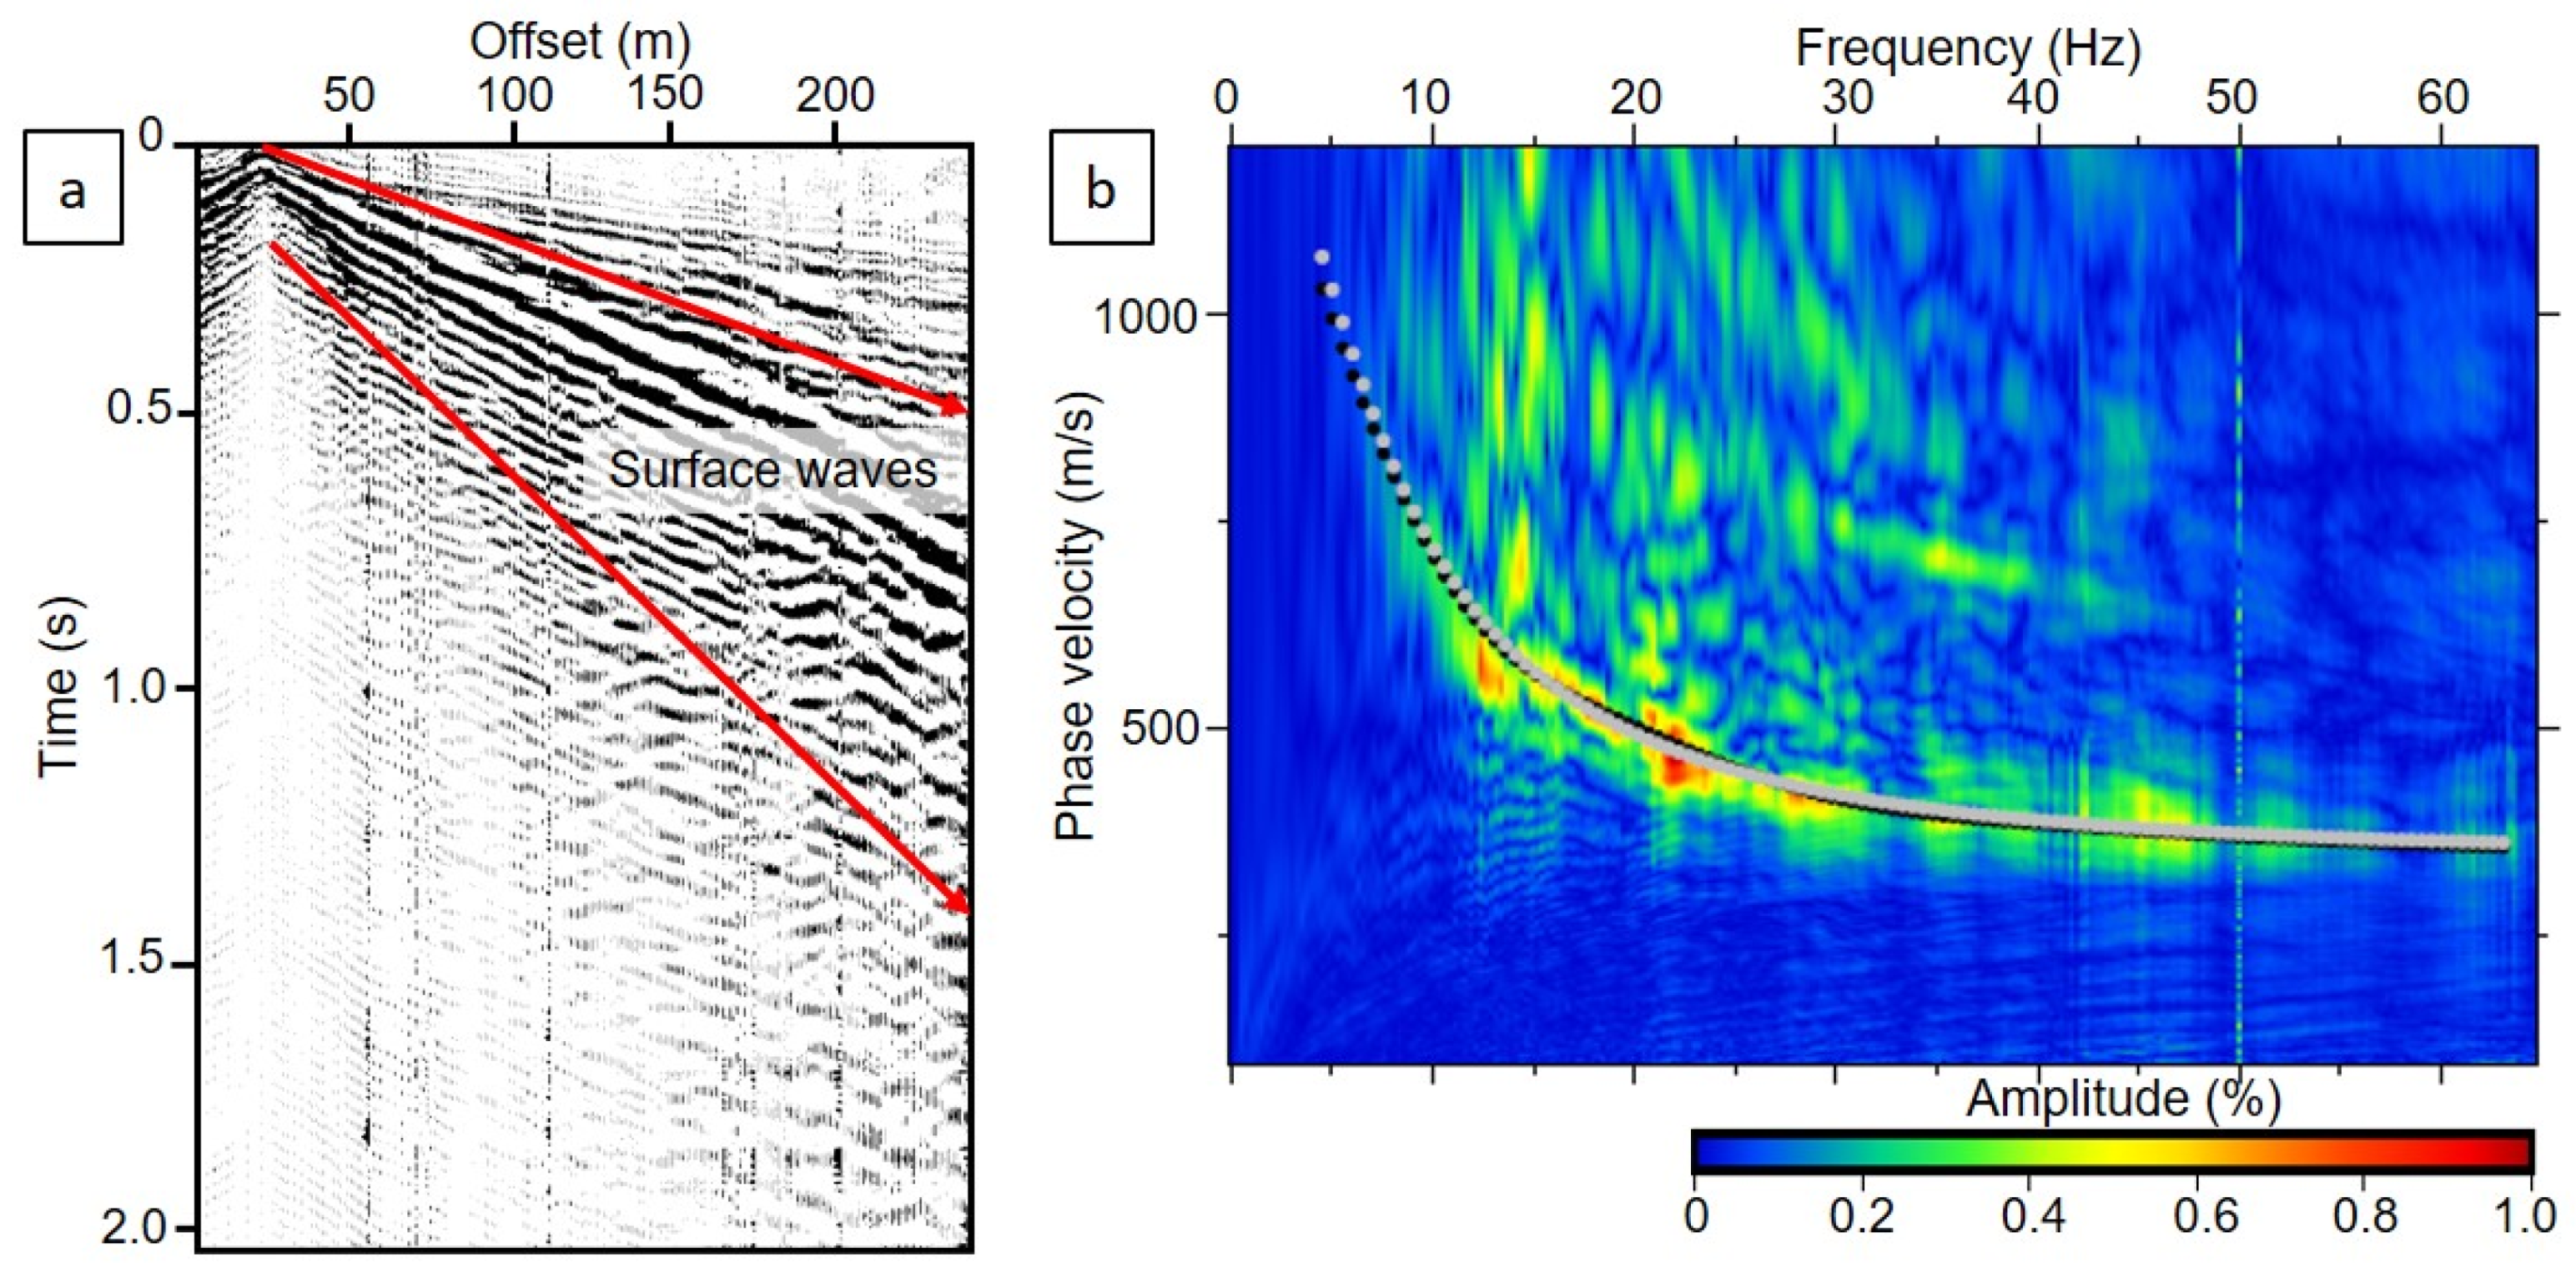
The multichannel analysis of surface waves (MASW) method estimates the S-wave velocity (Vs) of the subsoil from the recorded surface waves. Surface waves have a dispersive nature when propagating through layered media, that is, each frequency has a different penetration depth and thus travels at a different velocity. The dispersion curves (Figure 5) describe the relationship between the phase velocity and the corresponding frequency and can be inverted to predict the Vs distribution as a function of depth in both 1D and 2D [65]. The main process in MASW is the transformation of the recorded surface waves from time (s) and offset (meter) domain (as data is recorded) to the phase velocity (m/s) and frequency (Hz) domain, to form the surface wave dispersion curve [66].
In this work, we retrieved the dispersion curves using the wavefield transformation in each shot gather [67]. Then, we inverted each dispersion curve following an Occam’s inversion algorithm [66] to get a 1D Vs model at each shot gather position. Finally, we created the pseudo 2D Vs velocity profiles interpolating and merging the 1D Vs models. To average spatially balanced small-scale sharp anomalies, a spatial smoothing operator was applied to the 2D velocity model. This operation can be justified by considering that the inverted model is an approximation of the average at a wavelength of 25–35 m combining the frequency of the seismic signal and the offset contribution. Furthermore, each velocity-depth function is the smoothest model that can reproduce observations within a standard deviation of 10–12%.

3.4. P-Wave Tomography

We used the academic 3D tomographic code Pstomo_eq [68,69] to run the inversion of the first arrival times. The forward modeling part of the algorithm, responsible for the travel time computations and ray tracing in the isotropic model, consists of a first-order finite difference approximation of the Eikonal’s equations [70,71]. Once the travel-times to all shots or receivers are calculated, the ray paths are determined by tracing backward from the shot or receiver locations that are perpendicular to the isochrons map [72]. The software has two different schemes implemented to carry out this forward modeling based on Hole and Zelt [73] and Tryggvason and Bergman [71]. The inversion is performed with the conjugate gradient solver LSQR (least square) that iteratively solves the velocity model updates.
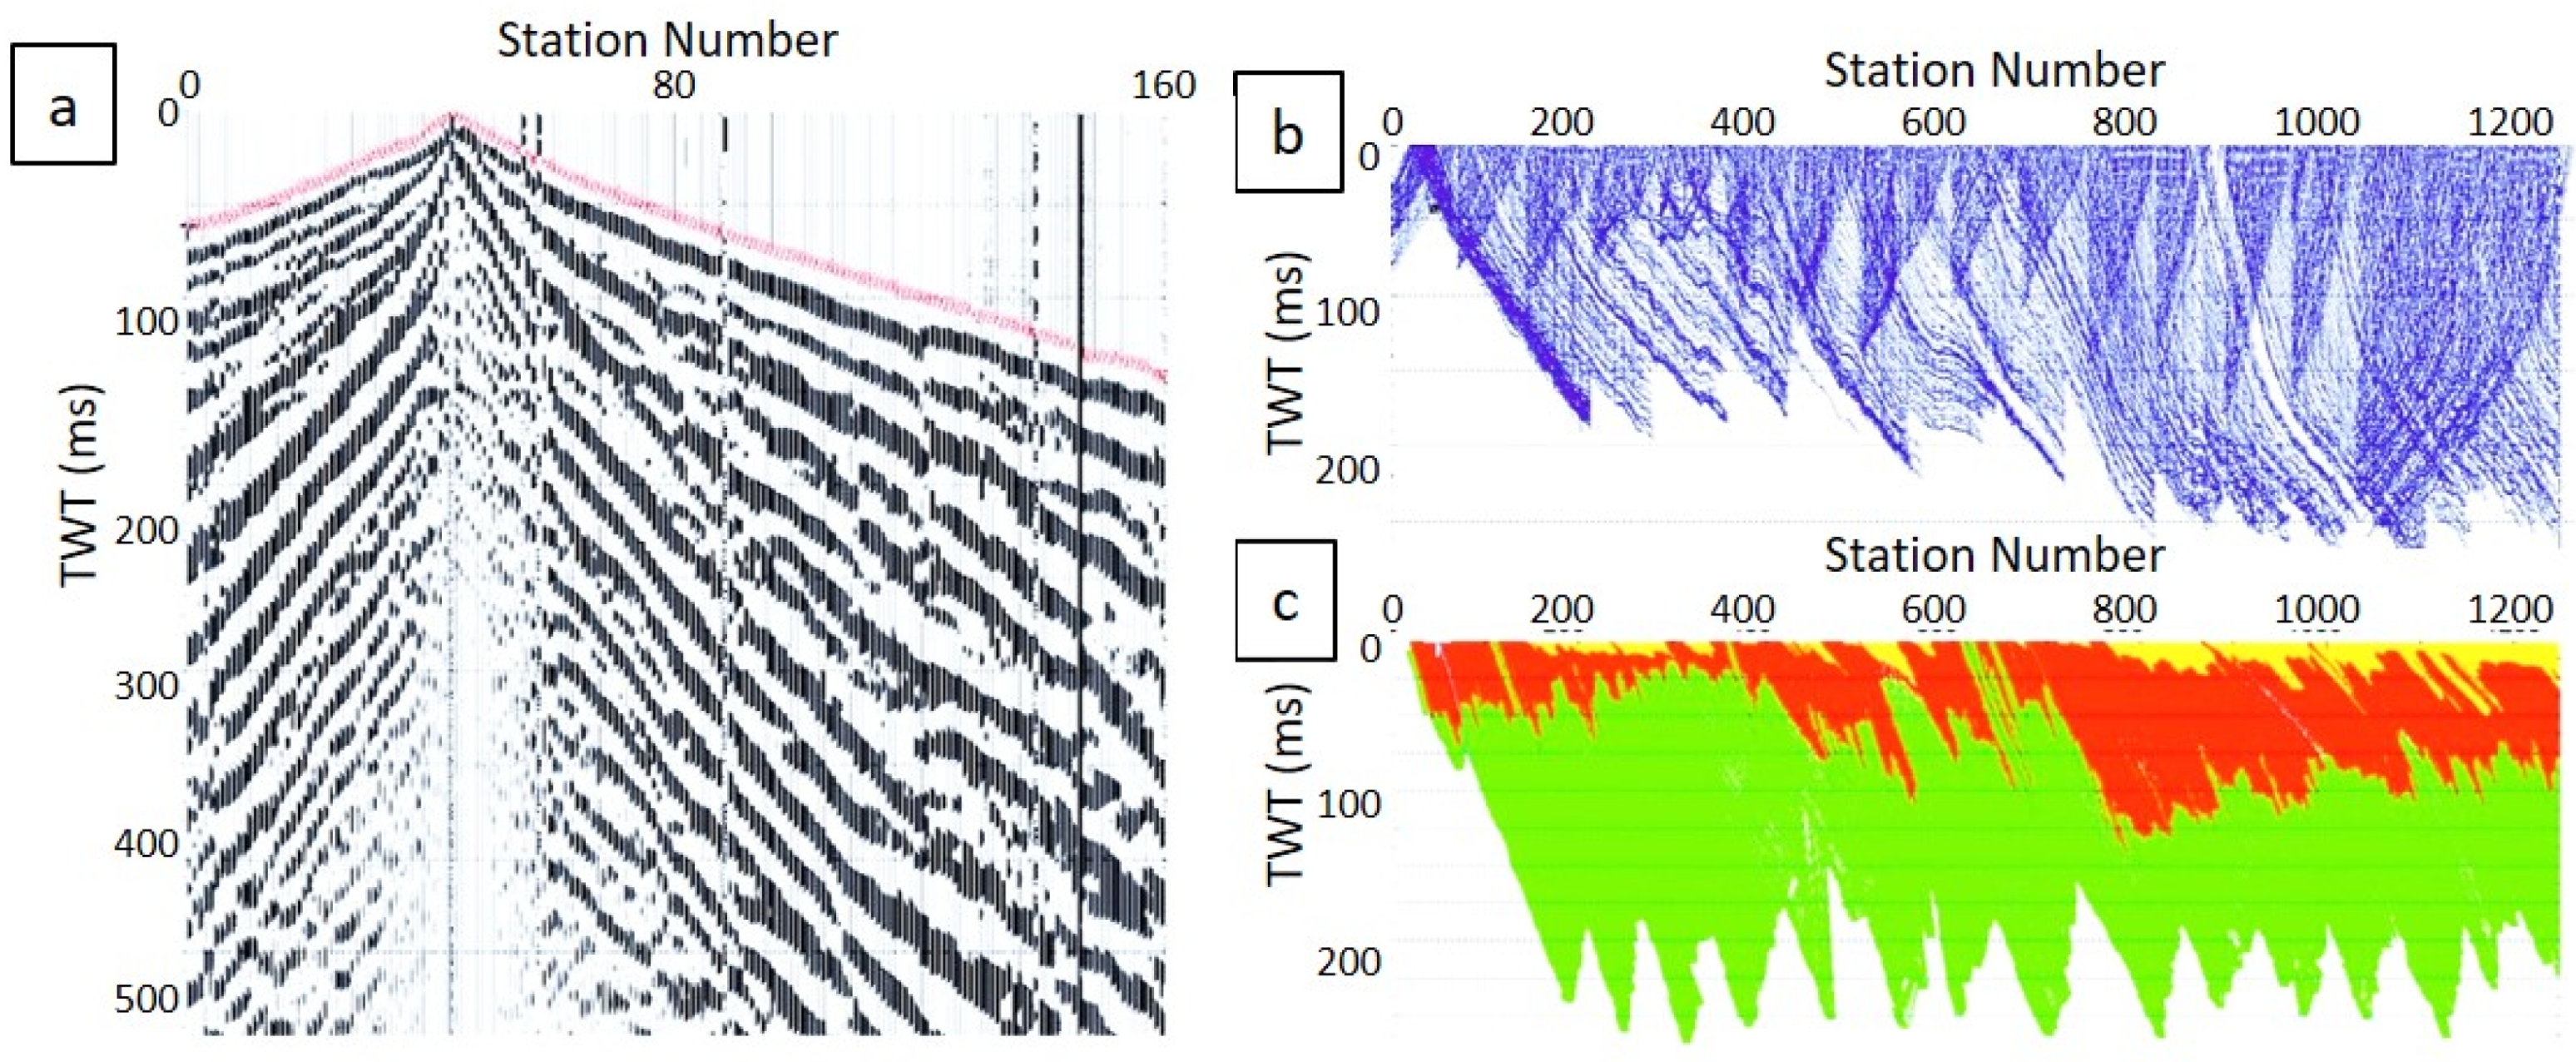
For the P-wave tomography study, we semi-automatically picked the seismic first arrivals using the commercial software Globe Claritas (Figure 6). The high quality of the recorded data allowed us to pick up 90% of the travel times, which include all the offset ranges, reaching to maximum offsets of 480 m. This high percentage of successful picked first arrival, even in areas with some anthropogenic activity-related noise, ensures a good lateral and depth resolution for the top 100 m.
The setup of initial 2D velocity models used in the inversion were based on surface geology and on the well-logging data of the FAM-1 well, located next to the La Torrecilla area (Figure 1) [51]. These starting velocity models assure a good convergence of the tomographic inversion providing an average reduction of the RMS misfit of 80%, providing final RMS travel time residuals ranging from 2–16 ms. The high-resolution seismic data acquired in the area led us to velocity models with final inversion cell sizes of around 2 × 2 m.

4. Results

The thickness of the CZ can be obtained by combining multi-geophysical data and mapping the minimum thickness that is matched with all the data [74,75]. In this study, the identification of the CZ from geophysical data includes three parts, namely topsoil, regolith, and weathered bedrock. To determine the distribution of the CZ layer in the different profiles, we have interpreted the zone featuring low-velocities (Vp < 1200 m/s and Vs < 600 m/s) and high-resistivity (ρ > 200 Ωm). In the profiles of La Torrecilla and La Salud North, CZ is defined by resistivity ρ > 200 Ωm, Vp < 1300 m/s, and Vs < 600 m/s. While in the profiles of La Salud South and Carrascoy, CZ is defined by Vp < 1300 m/s and Vs < 600 m/s. Finally, the interpretation of the CZ is the minimum thickness of the CZ constrained by all geophysical data (coincident geophysical data).

4.1. La Torrecilla

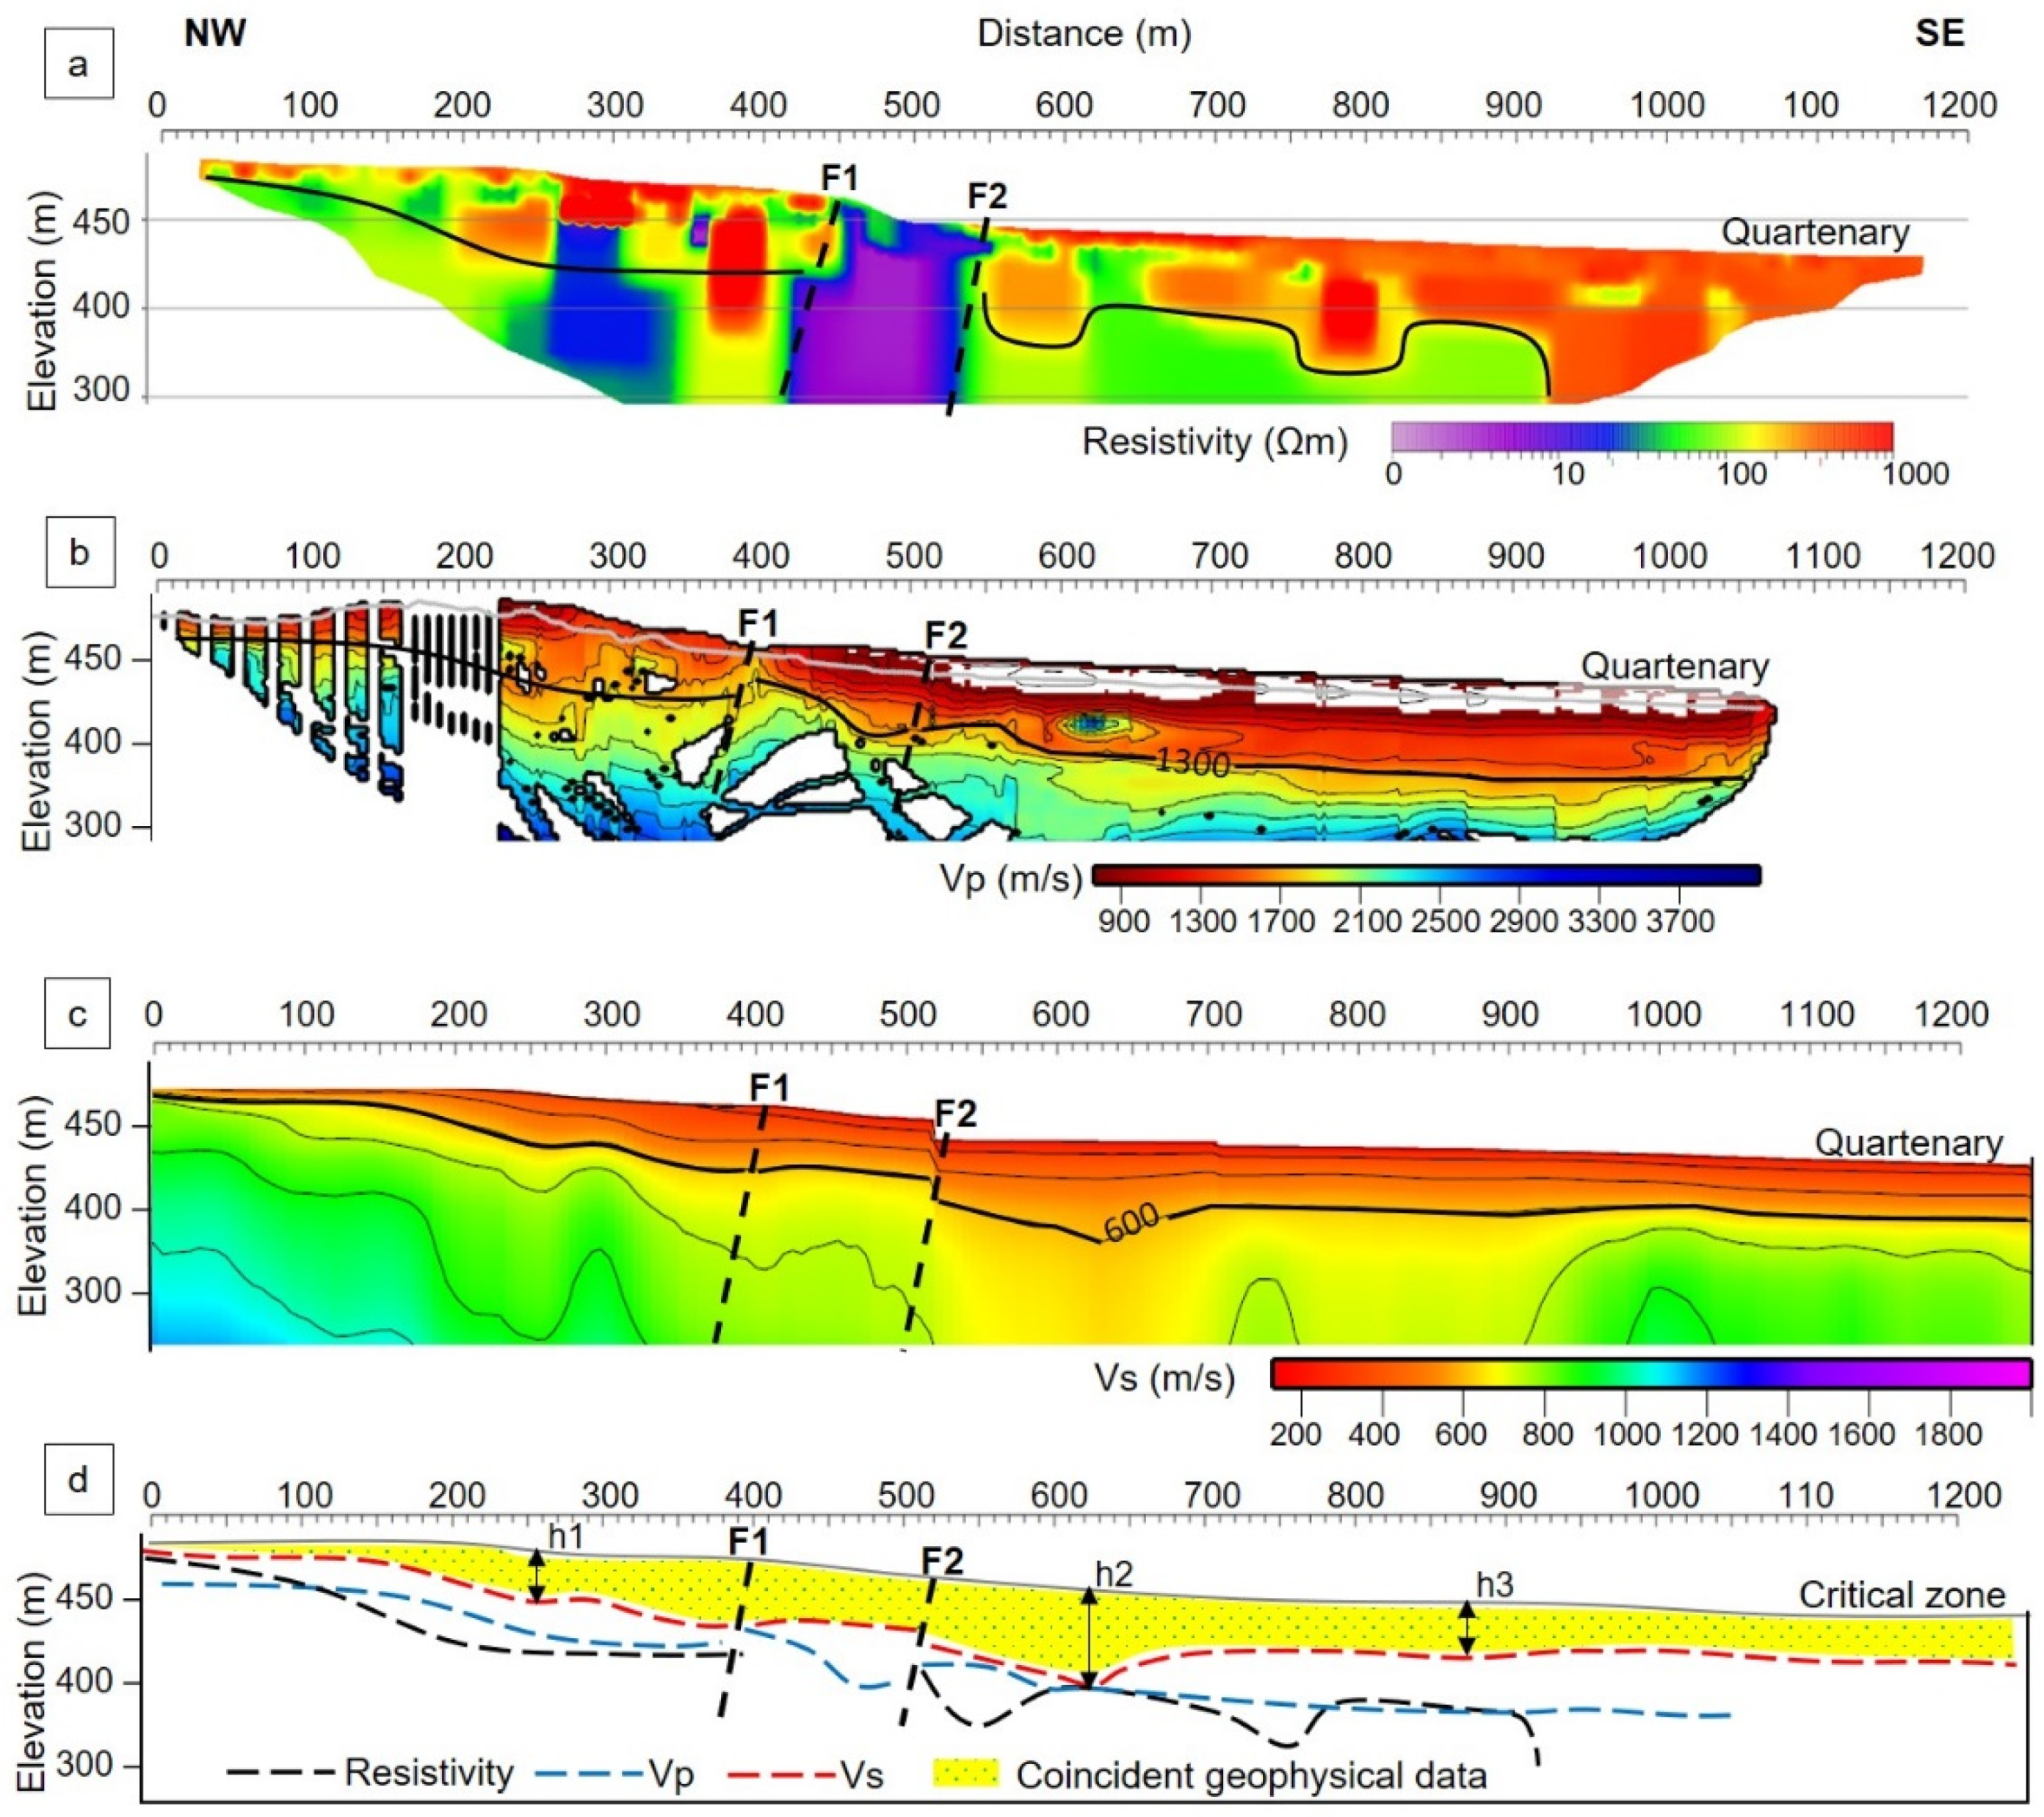
Figure 7a shows the resistivity model, Figure 7b shows the Vp model, Figure 7c shows the Vs model, and Figure 7d illustrates a combined interpretation of three geophysical data. The resistivity and seismic velocity models obtained from the La Torrecilla profile reveal distinct domains in the shallow subsurface. The CZ is represented by a high resistivity area (ρ > 200 m) to the SE of the profile (Figure 7a), which is consistent with the expected high resistivity of Quaternary alluvial fan deposits and fluvial sediment composed of conglomerates, gravels, sands, silts, and clays. Another high resistivity area is identified at surface levels at a distance of 0 to 450 m along with the profile. Underneath the high resistivity area, a medium resistivity area (50–150 Ωm) corresponds to the Paleozoic basement. At distances of 450 to 550 m, there is a ~500 m wide low resistivity (ρ < 50 Ωm) that features net and parallel limits. This sector is interpreted as a wide fault zone between two fault planes (Figure 1 and Figure 2) belonging to the AMF shear deformation zone. This shear zone is formed by a 20 m wide band of well-developed fault gouge in Permian-Triassic quartzites and phyllites from the Alpujárride Complex together with sheared Upper Neogene marls, sandstones, and conglomerates.
Figure 7b,c show the Vp and Vs distributions, respectively. Both models show a low seismic velocity subparallel to and near the surface. The CZ is characterized by a low seismic velocity (Vp < 1300 m/s and Vs < 600 m/s) with thickness variation in the NW-SE direction of 30–40 m at a distance of ca. 300 m (h1), which increases by 50–60 m at a distance of ca. 530 m (h2), and thins again to 30–35 m at a distance of ca. 980 m (h3). At the same distance, the CZ interpreted by Vp and Vs (Figure 7b,c) also appears to match the distribution of the high resistivity in Figure 7a (ρ > 200 Ωm). These low velocities correspond to the Quaternary fluvial sediments, alluvial fan deposits and sedimentary rocks in the southern half of the profile, south of the shear zone. At a distance of ca. 400–500 m, there is a fault zone that is relatively parallel to Figure 1 and Figure 2, which is represented by a discontinuity low-velocity layer. Bedrock layers characterized by values of Vp > 1300 m/s and Vs > 600 m/s were interpreted as more compact and rigid rock formations, i.e., the fresh bedrock that underlies the CZ. These Vp, Vs, and resistivity values are in line with those recorded in the well-logs of the FAM-1 borehole (Figure 3).

4.2. La Salud North

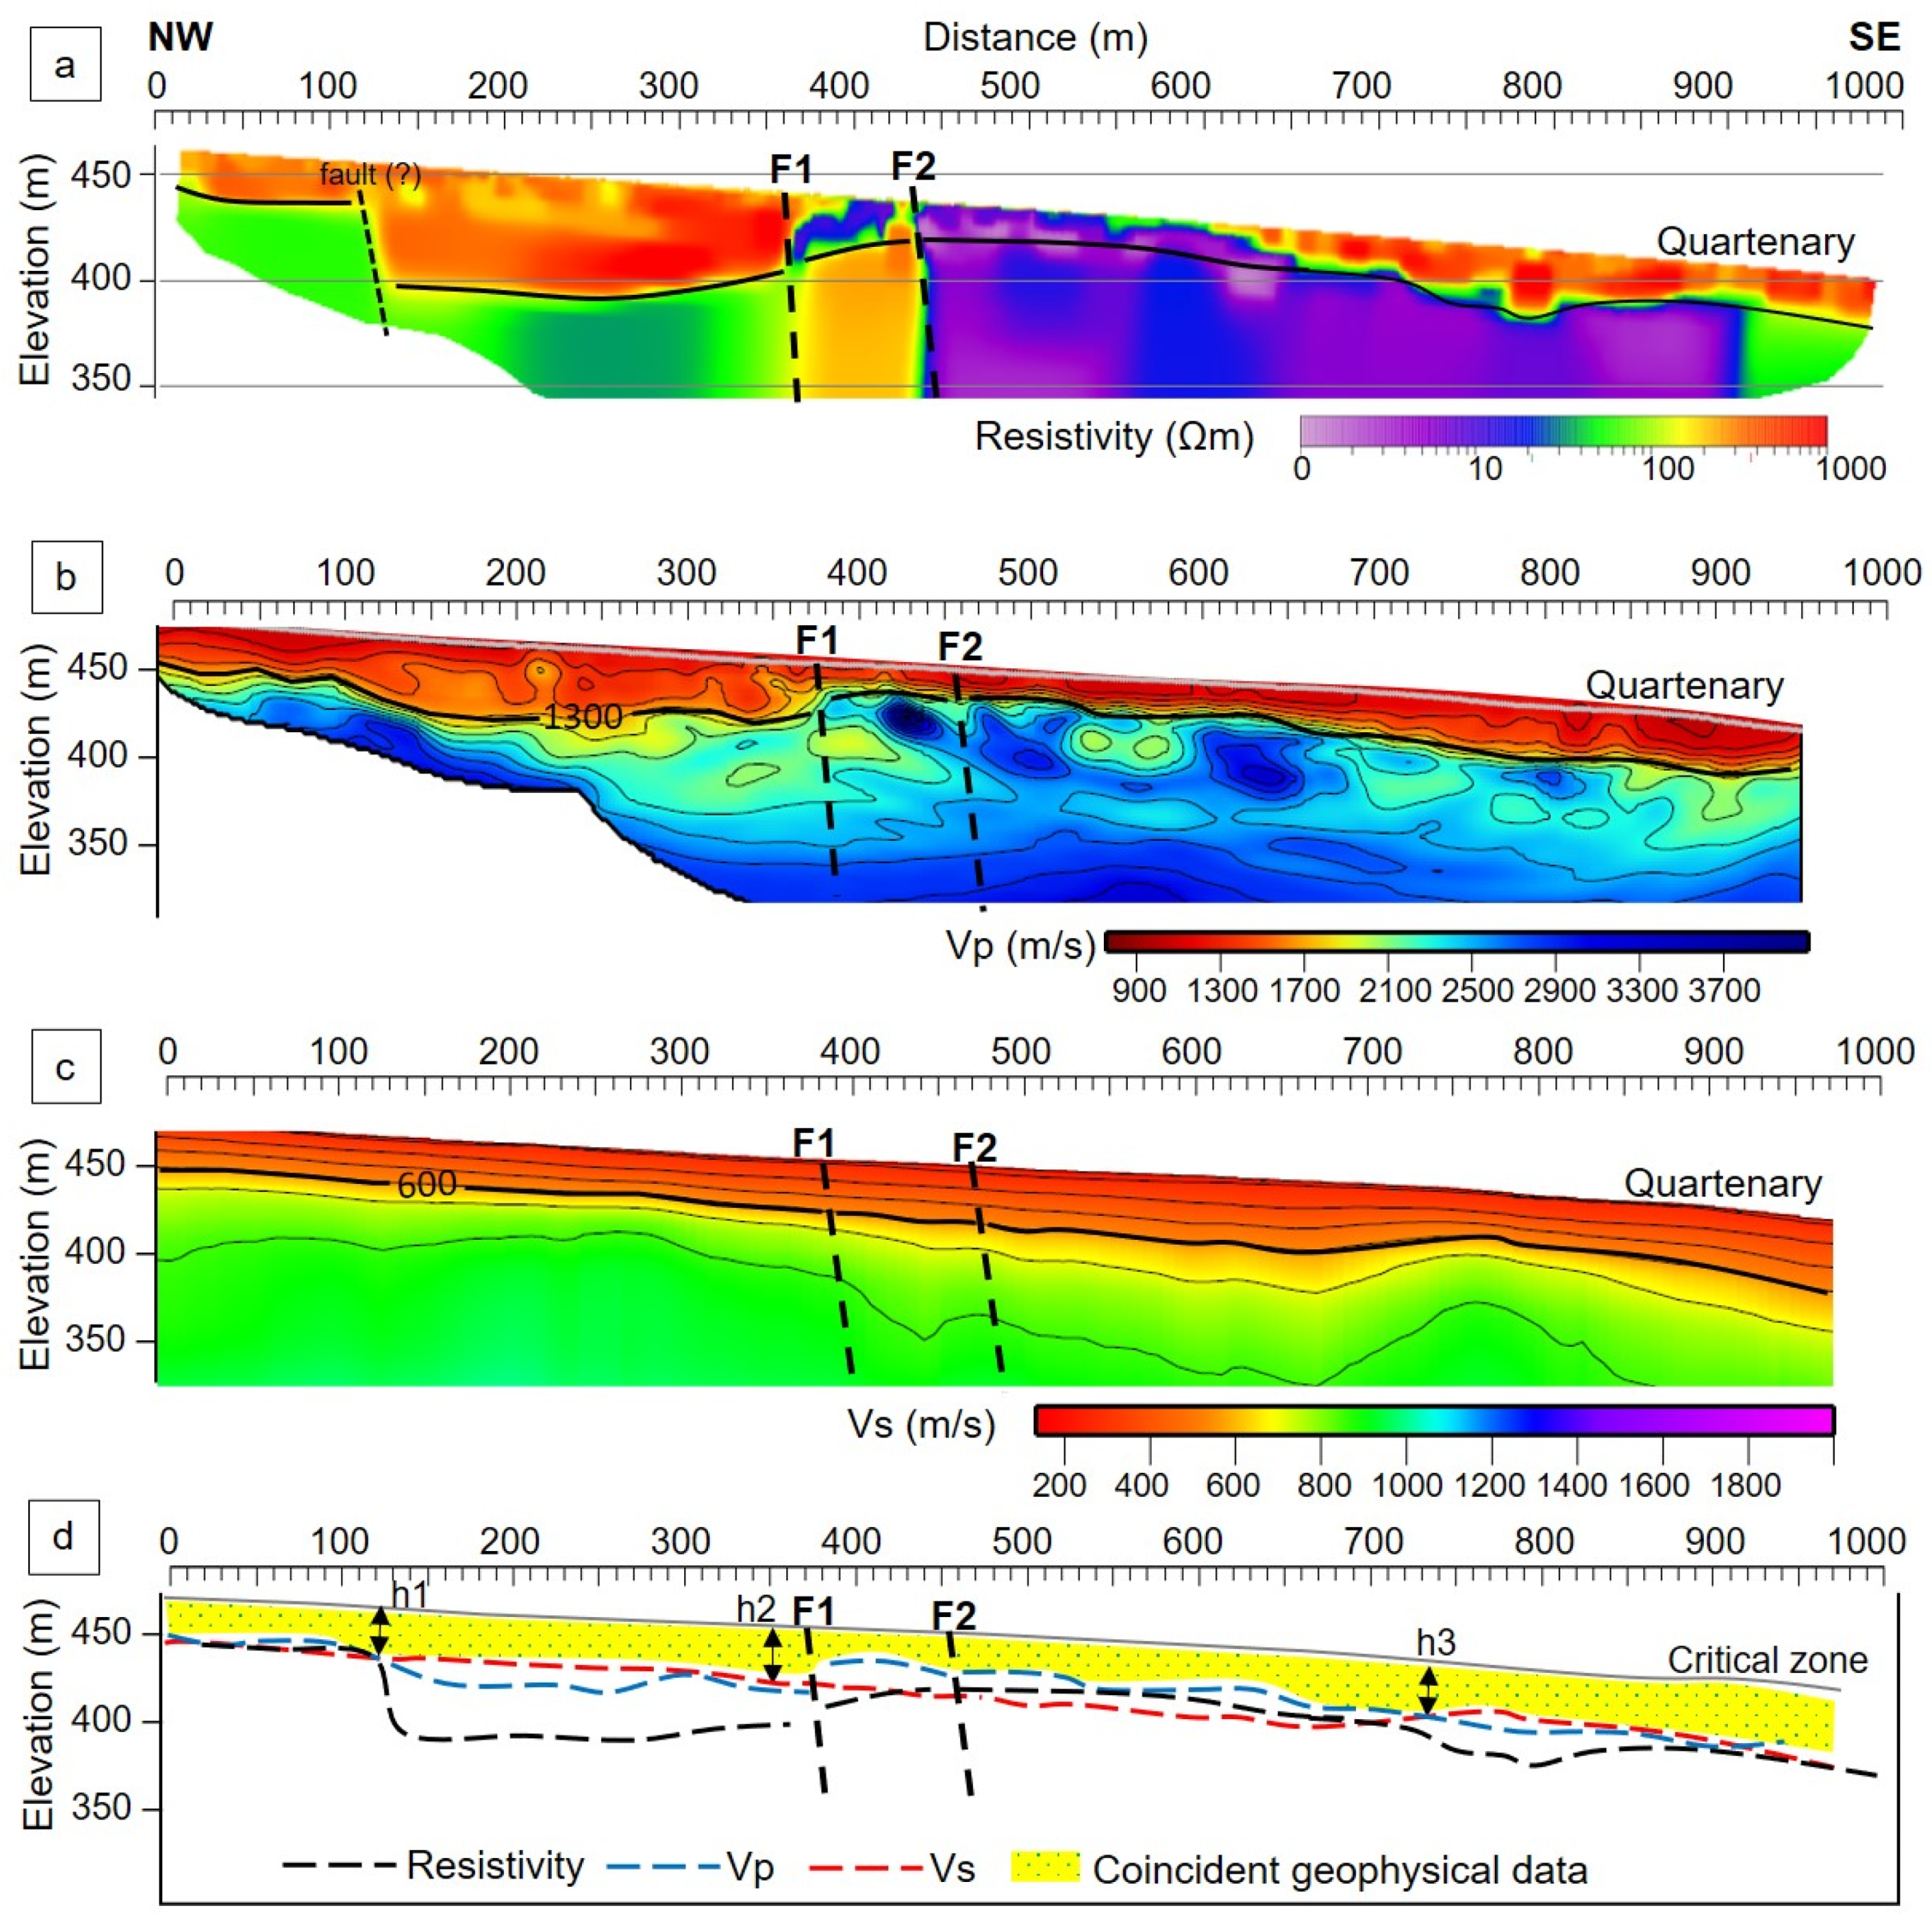
The geophysical models for La Salud North profile are depicted in Figure 8. The resistivity profile (Figure 8a) shows striking lateral variations on the resistivity. The CZ is interpreted by high resistivity (ρ > 200 Ωm) reaching the surface in the NW and SE parts of the line profile. This is consistent with the Quaternary formation’s expected high resistivity, which is formed by alluvial gravel and siltstone deposits. The medium resistivity (50–150 Ωm) corresponds to the Tortonian-Messinian formation with marl and interlayered sand and gypsum along the NW-facing profile path at a depth of more than 50 m. A low resistivity ρ < 50 Ωm at a distance of ca. 450–900 m is interpreted as the Messinian-Pliocene formation with sandy and marl siltstone and interlayered laminated gypsum and marl. The low resistivity contact is interpreted as a fault zone (defined by the fault planes F1 and F2 in Figure 8) that corresponds to the S-AMF strand. This low resistivity was also clearly identified in the resistivity model obtained by inversion of magnetotelluric data reported by Martí et al. (2020) [48]. The authors interpret this area as an alternation of resistors and conductors (50 Ωm/5000 Ωm) produced by the alternation of shallow levels of very dry colluvial materials cut by vertical faults.
The Vp and Vs profiles (Figure 8b and Figure 8c, respectively) show a low seismic velocity area subparallel to the surface. The CZ is characterized by low seismic velocity (Vp < 1300 m/s and Vs < 600 m/s), which corresponds to the Quaternary formations. On the NW-SE board, the thickness of the CZ varies from 30–40 m at a distance of ca. 100m (h1), increases by 40–50 m at a distance of ca. 350 m, very close to the fault zone F1 and F2 (h2), and re-thins by 30–40 m at a distance of ca. 750 m (h3). The bedrock is characterized by a velocity layer of Vp > 1300 m/s and Vs > 600 m/s. In turn, the fault zones F1 and F2 are indicated by the low-velocity contrast of Vp which is well correlated with the ERT results. Meanwhile, another fault is predicted from the geophysical interpretation that is located at a distance of ca. 120 m.

4.3. La Salud South

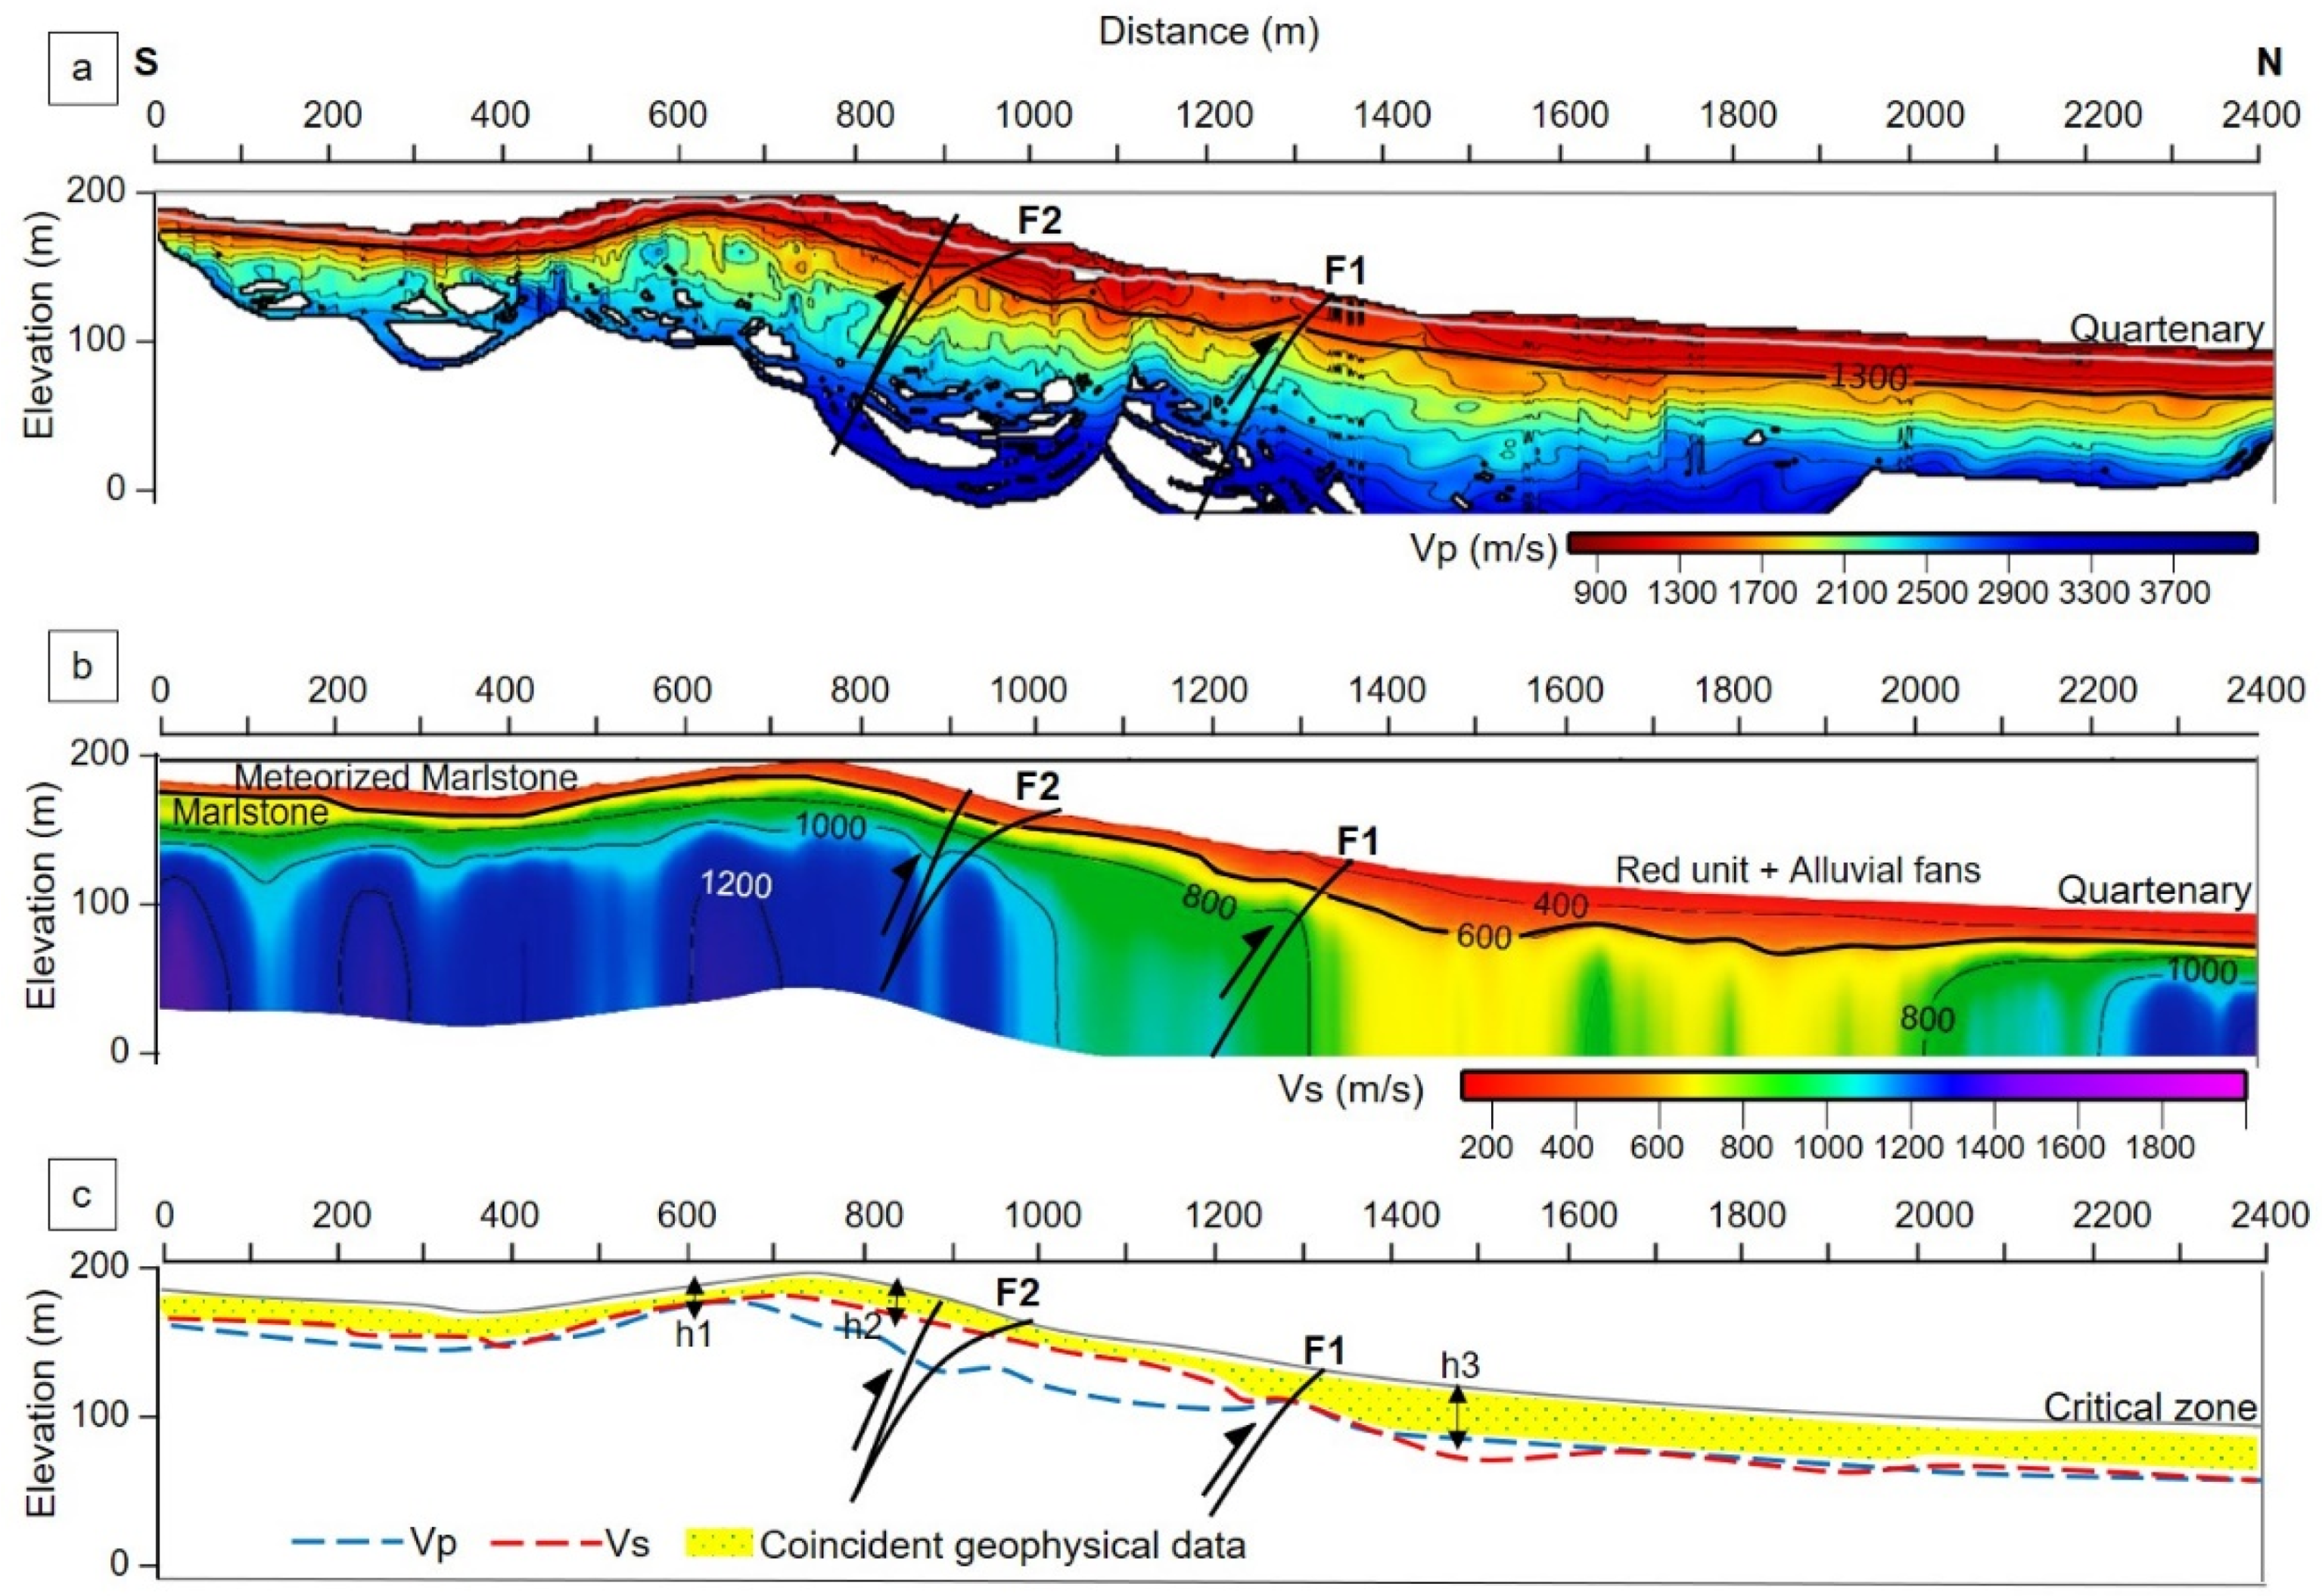
The La Salud South profile was only sampled with seismic methods, and so only the Vp and Vs models are available (Figure 9). A low seismic velocity anomaly (Vs < 600 m/s and Vp < 1200 m/s) runs parallel to the surface, which may indicate the presence of the CZ. The CZ thickens towards the SE direction, which in h1 is about 30–40 m at a distance of ca. 200 m, in h2 is 40–50 m at a distance of ca. 430 m, and in h3 is 50–55 m at a distance of ca. 1200 m close to fault F3 (fault F3 is mapped at a distance of ca. 1200 m). The bedrock is characterized by a velocity layer of Vp > 1300 m/s and Vs > 600 m/s. The low-velocity contrast is interpreted as a fault zone at a distance between ca. 310 m and 600 m defined by the fault planes F1 and F2 that correspond to the S-AMF strand.

4.4. Carrascoy

The high-resolution Vp and Vs models presented here (Figure 10a,b) allowed us to precisely locate the contact of the most surficial geological units: (i) the Red Unit and Pleistocene-Quaternary alluvial fan deposits to the north of F2, and (ii) a weathered layer to the south of F2.
Towards the south, the CZ identified by the lowest velocities (Vs < 600 m/s and Vp < 1200 m/s) is located parallel to the topography at a depth of approximately 15–30 m at a distance of approximately 600 m (h1), close to the Red Unit outcrops until ca. 650 m. The Messinian rocks also have a very low seismic velocity, which could be associated with a weathered layer of marlstone. Taking a closer look at this layer (h2) in the elevated area towards the fault zone F2, it is relevant to point out this small thickness difference between h1 and h2. The CZ increases its thickness in 30–40 m in h2. The thickest point of the CZ is located at ca. 1300 m distance near fault zone F1 (h3). There, the Red Unit and the Pleistocene-Quaternary alluvial deposits feature a thickness of ca. 45–50 m. Between F1 and F2, only the rocks of the Red Unit crop out forming an anticline in the hanging wall of F1. In contrast to h1 and h2, the thickness of this shallow layer in the study area is strongly influenced by the overall oblique reverse deformation that characterizes the surroundings of the Algezares-Casas Nuevas fault, which influences the thickness of the CZ through the interaction of tectonic stresses with topography.

5. Implications and Discussion

5.1. The Advantages of Multi-Geophysical Measurements and Implications for the Interpretation of the CZ

Geophysical methods have numerous advantages for the characterization of the near-surface in terms of cost efficiency and depth accuracy (e.g., [76,77]). Geophysical methods can provide spatial boundaries to determine the maximum depth range of the CZ [22,23,78]. When deep marker information (e.g., well data) is not available, outcrop and trench data can be combined with different geophysical methods to produce a robust model of the near-surface. For instance, P-wave tomography, Multichannel Analysis of Surface Waves (MASW), and Electrical Resistivity Tomography (ERT) are here used to minimize the ambiguity of the subsurface features. Each geophysical method used to determine the thickness of the CZ produces varying results in terms of vertical and lateral resolution. One approach involved the combination of the interpretation results from the multi-geophysical method to use the minimum thickness constrained by all the data as the final interpretation (as seen in, e.g., [74,75]). Future work could address the integration of the geophysical data using more advanced interpretation strategies, e.g., Machine Learning [79] or joint inversion [80].
Taking into account that the seismic profiles were originally designed for seismic reflection characterization, the quality of the first arrivals ensures the homogeneous distribution of the ray coverage along all profiles. It is important to highlight that the areas of poor coverage/gaps in ray coverage observed in some resulting velocity models (e.g., La Torrecilla, Figure 7b, and La Salud South, Figure 9a) are not related to the lack of data, but to the fact that these areas the acquisition geometry is far from a 2D geometry (mainly due to crooked pathways). The use of a fully 3D inversion code makes it difficult to obtain a good ray coverage in these areas when extracting the 2D velocity model along the seismic profile transects.
The interpretation of the CZ thickness in the La Torrecilla profile (Figure 7d) differs the most at ca. 250 m, where the ERT results point to a thicker CZ than the Vp and Vs models (h1). The three geophysical methods meet at a distance of ca. 620 m to provide the same thickness interpretation (h2). Meanwhile, at a distance of ca. 900 m, the ERT interpretation results matched Vp and shows a thicker CZ than that interpreted by Vs. Generally, the interpretation of Vs from MASW represents the distribution of the thickness of the CZ in the La Torrecilla profile as a minimum thickness than Vp and ERT. In the case of the La Salud North profile in Figure 8d, the interpretation of the Vp model represents the distribution of the CZ. The interpreted thickness of the CZ in the Vp model is slightly thinner than in the Vs model, and the result of the ERT interpretation is the thickest. The three geophysical methods meet in h1 at a distance of ca. 100 m and ca. 900 m facing SE. Meanwhile, Vp and Vs match in h2 at a distance of ca. 350 m and h3 at a distance of ca. 750 m.
From the La Salud South profile, the geophysical interpretation of the thickness of the CZ was obtained from the combination of Vp and Vs models (Figure 9c). The resulting CZ interpretation of the Vp model is slightly thinner than Vs and meets at some points, such as h1 at a distance of approximately 200 m and h3 at approximately 1300 m. In the Carrascoy profile (Figure 10c), the interpretation of the CZ is determined by the Vs result, similarly to the La Torrecilla profile (Figure 7d). The resulting interpretation of Vs is slightly thinner than Vp and meets at some points, such as h1 at a distance ca. 600 m and h3 at a distance ca. 1400 m.

5.2. The Impact of a Fault Zone, Elevation, and Topographic Slope on CZ Thickness

The presence of fault zones may have an effect on the thickness of the CZ. The presence of faults can lead to one of two outcomes: (i) a change in bedrock height levels caused by fault geometry changes, and (ii) an increase in the number of altered regolith layer fragments [19,22,23].
In this study, we have identified different fault zones in each profile by the combination of ERT, seismic tomography, and MASW models. The results in these models indicate that fault zones have a clear impact on the thickness of the CZ. For example, the thickness of the CZ in the La Torrecilla profile (Figure 7) coincides with the presence of a fault zone between F1 and F2, specifically the AMF shear deformation zone defined by Martínez-Díaz et al. [49]. The CZ surrounding the fault zone (h2) is thicker than the area outside the fault zone (h1 and h3). The thickness of the CZ in the La Salud North is also affected by the AMF shear deformation zone [49]. The thickest CZ in the La Salud North profile (Figure 8) is very close to the F1 fault (h2). Meanwhile, the thickening of the CZ in the La Salud South profile (Figure 9) appears close to the F3 fault, which is correlated to the S-AMF deformation zone (h3). In the Carrascoy profile (Figure 10), the ACNF fault zone controls the thickness of the CZ, with the thickened layer located near the F1 fault zone (h3) [27,49].
The effect of elevation in the thickness of the CZ has been analyzed by Nielson et al., [81]. Their study reported that lower elevations correlated well with thicker CZ. In the La Salud South profile (Figure 9c), the lowest elevation on the SE (ca. 420–430 m) coincides with the thickest CZ (h3). The differences in elevation across La Torrecilla and La Salud North profiles are relatively small, and the thickness of the CZ is thus more controlled by the presence of the fault zone.
Different geophysical studies have identified differences in the thickness of the CZ depending on the topographic slope and orientation [8,25,78,82]. In our study area, especially in the Carrascoy profile (Figure 10b), the Vs model shows clear differences in CZ thickness in the topographic asymmetry area:the CZ thickness in h1 has a relatively lower topographic slope than in the h2 thickness (Figure 10c). This seems to indicate CZ thickness differences is depending on the orientation of the slope, where the north-facing CZ l (h1) is relatively thinner than the south-facing (h2). It could also depend on the lithology that the northern part is the Guadalentín Depression, which is a relatively thick basin.

5.3. Relationship between the Geological Units and the Cz Thickness

The thickness of the CZ is influenced by the type of rock. We attempted to investigate the relationship between the thickness of the CZ and the different geological units crossed by each profile. The results of the geophysical interpretation of the thickness of the CZ from the four study profiles are shown in Table 3.
The CZ with the greatest average thickness is located in the La Torrecilla profile, with an average CZ thickness of 40–50 m. The CZ in La Torrecilla corresponds to Quaternary fluvial sediments and alluvial fan deposits (quartzite conglomerates and unconsolidated deposits formed by gravel, sands, silts and clays) [42,49]. In the La Salud North profile, the average CZ thickness of about 35–45 m corresponds to the Qua-ternary formations (alluvial gravels and siltstones). Similarly, in the La Salud South pro-file, the mean CZ thickness of about 40–47.5 m also corresponds to the Quaternary formations (alluvial gravels and siltstones). Alluvial fan deposits are important recorders of tectonic activity. Alluvial fans develop at the edge of the sedimentary basin, and this can be evidence of tectonic activity, with faults along the edge of the basin causing uplift in the catchment area and subsidence in the basin. Therefore, it is possible to see evidence of tectonic activity in the alluvial fan depositional succession, where the massive influx of coarse detritus into alluvial fan deposits can be interpreted as the result of tectonic activity in the form of earthquakes and uplift [83,84].
The Carrascoy profile has the thinnest average CZ (around 30–40 m) and includes a weathered layer of Messinian marlstone and the Red Unit and Pleistocene-Quaternary alluvial fan deposits [42,49,85]. The marlstone rocks are interpreted as a shallow marine zone with a fairly massive concentration of carbonate deposits so that the clastic deposits are not thick enough in the Carrascoy profile. In the North of the Carrascoy profile, the presence of the Red Unit and Pleistocene-Quarterary alluvial fan deposits can explain why the CZ thickness in the Carrascoy profile deposits does not exceed the thickness of the other three profiles.
Finally, the values estimated for the thickness of the CZ in our study correlated well with the average 36.8 m thickness across continental areas estimated by Xu and Liu [11]. Therefore, we validate here the use of combined electrical and seismic methods to evaluate the thickness and characterize the CZ.

6. Conclusions

Geophysical methods, both seismic and electrical, have been used to map the distribution of the critical zone (CZ) laterally and vertically along the Eastern Betic Shear Zone (EBSZ). The CZ was mapped from the geophysical investigation in four different profiles: La Torrecilla, La Salud North, La Salud South, and Carrascoy. The P-wave tomography, MASW, and resistivity (ERT) models have provided valuable information to interpret the vertical and horizontal distribution of the shallow subsurface of active fault zones on profiles La Torrecilla and La Salud North. Similarly, the P-wave tomography and MASW methods were applied on profiles La Salud South and Carrascoy. The interpretation of these models allowed us to identify significant features of the subsurface: (i) the thickness of the CZ; (ii) the impact of the fault zone, elevation and topographic slope in the thickness of the CZ; and (iii) the relationship between the geological units forming the CZ and its thickness.
The final interpretation of the CZ thickness is the area where all the geophysical methods coincide. The CZ is identified along the profiles featuring low seismic velocity (Vp < 1300 m/s and Vs < 600 m/s) and high resistivity (ρ > 200 Ωm) and includes different fault zones. The thickness of the CZ varies along the profiles, with the average CZ thickness at La Torrecilla 40–50 m, La Salud North 35–45 m, La Salud South 40–47.5 m, and Carrascoy 30–40 m.
For complex locations where there is a combination of the fault zone and elevation differences, the thickness of the CZ may be controlled by one or both. In La Torrecilla and La Salud North, the CZ thickness is mostly controlled by the AMF shear deformation zone. In the La Salud South profile, the thickness of the CZ is more controlled by low elevation, with a thickness slightly larger than the CZ near the S-AMF shear deformation zone fault zone. Meanwhile, the thickest CZ in the Carrascoy profile is in the ACNF fault zone and has a low elevation. Based on the relationship between geological units and the thickness of the CZ, the CZ in the Carrascoy profile is the thinnest with the geological units in the form of marlstone, Red Unit, and Pleistocene-Quarterary alluvial fan. The La Salud North and La Salud South profiles are intermediate CZ composed of quaternary formations (alluvial gravels and siltstones). Then, the thickest CZ is on the La Torrecilla profile which is composed of Quaternary fluvial sediments and alluvial fan deposits (quartzite conglomerates and unconsolidated deposits formed by gravel, sands, silts, and clays).

Author Contributions

Conceptualization, R.C., H.H., J.A. and I.D.; methodology, R.C., H.H., J.A. and I.D.; software, R.C., H.H. and J.A.; validation, R.C., J.A., I.D., R.M.-B., J.G.-M., J.J.M.-D., D.M., J.M.I.-A., I.P. and T.T.; formal analysis, H.H., R.C., J.A., I.D., R.M.-B., J.G.-M., J.J.M.-D., D.M., J.M.I.-A., I.P. and T.T; investigation, R.C., J.A., I.D., R.M.-B., J.G.-M., J.J.M.-D., D.M., J.M.I.-A., I.P. and T.T.; data curation, R.C., J.A., I.D., R.M.-B., J.G.-M., J.J.M.-D., D.M., J.M.I.-A., I.P. and T.T.; writing—original draft preparation, H.H., R.C., J.A., I.D. and I.P.; writing—review and editing, H.H., R.C., J.A., I.D., I.P., R.M.-B., J.G.-M., J.J.M.-D., D.M., J.M.I.-A., I.M. and T.T.; visualization, H.H., R.C., J.A., I.D., R.M.-B., J.G.-M., J.J.M.-D., D.M., J.M.I.-A., I.P. and T.T.; supervision, R.C., J.A., I.D., R.M.-B., J.G.-M., J.J.M.-D., D.M., J.M.I.-A., I.P. and T.T.; project administration, R.C., J.A., I.D., R.M.-B., J.G.-M., J.J.M.-D., D.M., J.M.I.-A., I.P. and T.T. All authors have read and agreed to the published version of the manuscript.

Funding

J.A. is funded by grant IJC2018-036074-I and by MCIN/AEI /10.13039/501100011033. I.P. is funded by the Spanish Government and the Universidad de Salamanca (Beatriz Galindo grant BEGAL 18/00090). This project was funded by Grant 2017SGR1022 (GREG) from the Generalitat de Catalunya (AGAUR); EU (H2020) 871121 (EPOS-SP); and EIT-RawMaterias 17024 from the European Institute of Technology (EIT) (SIT4ME).

Institutional Review Board Statement

Not applicable.

Informed Consent Statement

Not applicable.

Data Availability Statement

The data used to support the findings of this study are available from the corresponding author upon request.

Acknowledgments

The authors would like to thank the following: The project INTERGEO (CGL2013-47412-C2-1-P) GEO3BCN-CSIC for providing access to the data. SeisDARE provides public access to the seismic data [86]. The KEMDIKBUDRISTEK of the Republic of Indonesia for providing a Ph.D. scholarship to the first author. The GIPP-GFZ (Germany) and Lisbon University (Portugal) provided the instrumentation. Additionally, we sincerely thank Seismic Unix CWP (Center for Wave Phenomena, Colorado School of Mines) for allowing us to use the free academic license software, and we also thank everyone who was directly or indirectly involved in this work.

Conflicts of Interest

The authors declare no conflict of interest.

References

  1. Banwart, S.A.; Nikolaidis, N.P.; Zhu, Y.G.; Peacock, C.L.; Sparks, D.L. Soil Functions: Connecting Earth’s Critical Zone. Annu. Rev. Earth Planet. Sci. 2019, 47, 333–359. [Google Scholar] [CrossRef]
  2. Brantley, S.L.; Goldhaber, M.B.; Ragnarsdottir, K.V. Crossing disciplines and scales to understand the critical zone. Elements 2007, 3, 307–314. [Google Scholar] [CrossRef]
  3. National Research Council (NRC). Basic Research Opportunities in the Earth Sciences; National Academies Press: Washington, DC, USA, 2001. [Google Scholar]
  4. European Commission. Communication from the Commission to the Council, the European Parliament, the European Economic, and Social Committee, and the Committee of Regions. In Thematic Strategy for Soil Protection (COM 2006. 231); Commission of the European Communities: Brussels, Belgium, 2006. [Google Scholar]
  5. Panagos, P.; Van Liedekerke, M.; Jones, A.; Montanarella, L. European Soil DataCentre: Response to European policy support and public data requirements. Land Use Policy 2012, 29, 329–338. [Google Scholar] [CrossRef]
  6. Field, J.P.; Breshears, D.D.; Law, D.J.; Villegas, J.C.; López-Hoffman, L.; Brooks, P.D.; Chorover, J.; Barron-Gafford, G.A.; Gallery, R.E.; Litvak, M.E.; et al. Critical Zone Services: Expanding Context, Constraints, and Currency beyond Ecosystem Services. Vadose Zone J. 2015, 14, vzj2014.10.0142. [Google Scholar] [CrossRef] [Green Version]
  7. Montanarella, L.; Panagos, P. Policy relevance of critical zone science. Land Use Policy 2015, 49, 86–91. [Google Scholar] [CrossRef]
  8. Anderson, S.P.; Hinckley, E.-L.; Kelly, P.; Langston, A. Variation in critical zone processes and architecture across slope aspects. Procedia Earth Planet. Sci. 2014, 10, 28–33. [Google Scholar] [CrossRef] [Green Version]
  9. Anderson, R.S.; Anderson, S.P.; Tucker, G.E. Rock damage and regolith transport by frost: An example of climate modulation of the geomorphology of the critical zone. Earth Surf. Process. Land. 2013, 38, 299–316. [Google Scholar] [CrossRef]
  10. Rempe, D.M.; Dietrich, W.E. A bottom-up control on fresh-bedrock topography under landscapes. Proc. Natl. Acad. Sci. USA 2014, 111, 6576–6581. [Google Scholar] [CrossRef] [Green Version]
  11. Xu, X.; Liu, W. The global distribution of Earth’s critical zone and its controlling factors. Geophys. Res. Lett. 2017, 44, 3201–3208. [Google Scholar] [CrossRef]
  12. Grant, G.E.; Dietrich, W.E. The frontier beneath our feet. Water Resour. Res. 2017, 53, 2605–2609. [Google Scholar] [CrossRef]
  13. Rempe, D.M.; Dietrich, W.E. Direct observations of rock moisture, a hidden component of the hydrologic cycle. Proc. Natl. Acad. Sci. USA 2018, 115, 2664–2669. [Google Scholar] [CrossRef] [Green Version]
  14. Lin, H. Earth’s critical zone and hydropedology: Concepts, characteristics and advances. Hydrol. Earth Syst. Sci. 2010, 14, 24–45. [Google Scholar] [CrossRef] [Green Version]
  15. Chorover, J.; Troch, P.A.; Rasmussen, C.; Brooks, P.; Pelletier, J.; Breshears, D.D.; Huxman, T.; Lohse, K.; McIntosh, J.; Meixner, T.; et al. How water, carbon, and energy drive critical zone evolution: The Jemez-Santa Catalina Critical Zone Observatory. Vadose Zone J. 2011, 10, 884–899. [Google Scholar] [CrossRef] [Green Version]
  16. Lin, H.; Hopmans, J.W.; Richter, D.D. Interdisciplinary sciences in a global network of Critical- Zone Observatories. Vadose Zone J. 2011, 10, 781–785. [Google Scholar] [CrossRef]
  17. Rasmussen, C.; Troch, P.A.; Chorover, J.; Brooks, P.; Pelletier, J.; Huxman, T.E. An open system energy-based framework for predicting critical zone structure and function. Biogeochemistry 2011, 102, 15–29. [Google Scholar] [CrossRef]
  18. ISRM (International Society of Rock Mechanics). Rock Characterization, Testing and Monitoring; ISRM Suggested Methods; Pergamon Press: Oxford, UK, 1981; ISBN 0080273084/9780080273082. [Google Scholar]
  19. Holbrook, W.; Riebe, C.S.; Elwaseif, M.; Hayes, J.L.; Basler-Reeder, K.; Harry, D.L.; Malazian, A.; Dosseto, A.; Hartsough, P.C.; Hapmans, J.W. Geophysical constraints on deep weathering and water storage potential in the Southern Sierra Critical Zone Observatory. Earth Surf. Processes Landf. 2014, 39, 366–380. [Google Scholar] [CrossRef] [Green Version]
  20. Schaetzl, R.J.; Anderson, S. Soils–Genesis and Geomorphology; Cambridge University Press: Cambridge, UK, 2005. [Google Scholar]
  21. Fletcher, R.C.; Brantley, S.L. Reduction of bedrock blocks as cornerstones in the weathering profile: Observations and model. Am. J. Sci. 2010, 310, 131–164. [Google Scholar] [CrossRef]
  22. Clarke, B.A.; Burbank, D.W. Quantifying bedrock-fracture patterns within the shallow subsurface: Implications for rock mass strength, bedrock landslides, and erodibility. J. Geophys. Res. 2011, 116, F04009. [Google Scholar] [CrossRef] [Green Version]
  23. Slim, M.; Perron, J.T.; Martel, S.J.; Singha, K. Topographic stress and rock fracture: A two-dimensional numerical model for arbitrary topography and preliminary comparison with bore-hole observations. Earth Surf. Processes Landf. 2015, 40, 512–529. [Google Scholar] [CrossRef] [Green Version]
  24. Flinchum, B.A.; Holbrook, W.S.; Carr, B.J. What Do P-Wave Velocities Tell Us about the Critical Zone? Front. Water 2022, 3, 772185. [Google Scholar] [CrossRef]
  25. St. Clair, J.; Moon, S.; Holbrook, W.S.; Perron, J.T.; Riebe, C.S.; Martel, S.J.; Carr, B.; Harman, C.; Singha, K.; de Richter, D. Geophysical imaging reveals topographic stress control of bedrock weathering. Science 2015, 350, 534–538. [Google Scholar] [CrossRef] [Green Version]
  26. Place, J.; Géraud, Y.; Diraison, M.; Herquel, G.; Edel, J.-B.; Bano, M.; Le Garzic, E.; Walter, B. Structural control of weathering processes within exhumed granitoids: Compartmentalisation of geophysical properties by faults and fractures. J. Struct. Geol. 2016, 84, 102–119. [Google Scholar] [CrossRef]
  27. Handoyo, H.; DeFelipe, I.; Martín-Banda, R.; García-Mayordomo, J.; Martí, D.; Martínez-Díaz, J.J.; Insua-Arévalo, J.M.; Teixidó, T.; Alcalde, J.; Palomeras, I.; et al. Characterization of the shallow structure across the frontal strands of the Carrascoy fault system (SE Iberian Peninsula), an oblique reverse fault within an active strike-slip fault system. Geol. Acta, 2022; in review. [Google Scholar]
  28. De Larouzière, F.D.; Bolze, J.; Bordet, P.; Hernández, J.; Montenat, C.; Ott d’Estevou, P. The Betic segment of the lithospheric Trans-Alboran shear zone during the Late Miocene. Tectonophysics 1988, 152, 41–52. [Google Scholar] [CrossRef]
  29. DeMets, C.; Iaffaldano, G.; Merkouriev, S. High-resolution Neogene and Quaternary estimates of nubia-eurasia-north America plate motion. Geophys. J. Int. 2015, 203, 416–427. [Google Scholar] [CrossRef]
  30. Egeler, C.; Simon, O.J. Orogenic evolution of the betic zone (Betic cordilleras, Spain) with emphasis on the nappe structure. Geol. Mijnbouw 1969, 48, 295–305. [Google Scholar]
  31. Azañón, J.M.; Crespo-Blanc, A.; García-Dueñas, V. Continental collision, crustal thinning and nappe forming during the pre-Miocene evolution of Alpujarride Complex (Alboran Domain, Betic). J. Struct. Geol. 1997, 19, 1055–1071. [Google Scholar] [CrossRef]
  32. Sanz de Galdeano, C. Geologic evolution of the Betic Cordilleras in the Western Mediterranean. Miocene to the present. Tectonophysics 1990, 172, 107–119. [Google Scholar] [CrossRef]
  33. Azañón, J.M.; Crespo-Blanc, A. Exhumation during a continental collision inferred from the tectonometamorphic evolution of the Alpujarride Complex in the central Betics (Alboran Domain, SE Spain). Tectonics 2000, 19, 549–565. [Google Scholar] [CrossRef]
  34. López Ruiz, J.; Cebriá, J.M.; Doblas, M.; Benito, R. El vulcanismo Neógeno Peninsular. In Geologia de España; Vera, J.A., Ed.; SGE-IGME: Madrid, Spain, 2004; pp. 678–680. [Google Scholar]
  35. Montenat, C.; Barrier, P.; Di Geronimo, I. The Messina Strait, past and present: A review. In Le Détroit de Messine (Italie). Evolutiontectono-Sédimentaire Récente (Pliocène et Quaternaire) et Environnement Actuel; Barrier, P., Di Geronimo, I., Montenat, C., Eds.; Doc. et Trav. IGAL: Paris, France, 1987; Volume 11, pp. 7–14. [Google Scholar]
  36. Khazaradze, G.; Gárate, J.; Suriñach, E.; Davila, J.M.; Asensio, E. Crustal deformation in south-eastern Betics from CuaTe-Neo GPS network. Geotemas 2008, 10, 1023–1026. [Google Scholar]
  37. Echeverria, A.; Khazaradze, G.; Garate, J.; Asensio, E.; Masana, E.; Suriñach, E. Present-day GPS crustal deformation rates in the Eastern Betics (SE. Spain). In Proceedings of the Geophysical Research Abstracts 13, EGU General Assembly 2011, Viena, Austria, 3–8 April 2011. [Google Scholar]
  38. De Larouzière, F.; Montenat, C.; O’Estevou, P.O.; Griveaud, P. Evolution simultanée des basin néogènes en compression et enextension dans un couloir de décrochement: Hinojar et Malarron (Sud Est de l’Espagn). Bull. Cent. Rech. Explor. Prod. EIf-Aquitaine 1987, 11, 23–38. [Google Scholar]
  39. Vissers, R.L.M.; Meijninger, B.M.L. The 11 May 2011 earthquake at Lorca (SE Spain) viewed in a structural-tectonic context. Solid Earth 2011, 2, 199–204. [Google Scholar] [CrossRef] [Green Version]
  40. Martínez-Díaz, J.J. Stress field variety related to fault interaction in a reverse oblique-slip fault: The Alhama de Murcia Fault, Betic Cordillera, Spain. Tectonophysics 2002, 356, 291–305. [Google Scholar] [CrossRef]
  41. Silva, P.G. Evolución Geodinámica de la Depresión del Guadalentín (Murcia) desde el Mioceno Superior Hasta la Actualidad: Neotectónica y Geomorfología. Ph.D. Thesis, Universidad Complutense de Madrid, Madrid, Spain, 1994; 642p. [Google Scholar]
  42. Martínez-Díaz, J.J.; Masana, E.; Ortuño, M. Active tectonics of the Alhama de Murcia fault, Betic Cordillera, Spain. J. Iber. Geol. 2012, 38, 253–270. [Google Scholar] [CrossRef] [Green Version]
  43. Gómez Novell, O. Paleoseismic Transect across the Alhama de Murcia Fault and Implications of a Fault-Based Seismic Hazard Assessment for the Eastern Betics. Ph.D. Thesis, Departament—Dinàmica de la Terra i de l’Oceà, Universitat de Barcelona, Barcelona, Spain, 2021. [Google Scholar] [CrossRef]
  44. Martín-Banda, R.; García-Mayordomo, J.; Insua-Arévalo, J.M.; Salazar, Á.E.; Rodríguez-Escudero, E.; Álvarez-Gómez, J.A.; Medialdea, A.; Herrero, M.J. New insights on the seismogenic potential of the Eastern Betic Shear Zone (SE Iberia): Quaternary activity and paleoseismicity of th SW segment of the Carrascoy Fault Zone. Tectonics 2016, 35, 55–75. [Google Scholar] [CrossRef]
  45. Marín-Lechado, C.; Roldán-García, F.J.; Pineda-Velasco, A.; Martínez-Zubieta, P.; Rodero-Pérez, J.; Díaz-Pinto, G. Mapa Geológico Digital Continuo E 1:50000, Zonas Internas de las Cordilleras Béticas (Zona-2100): GEODE. Mapa Geológico Digital Continuo de España. 2011. Available online: https://mapas.igme.es/gis/services/Cartografia_Geologica/IGME_MAGNA_50/MapServer/WMSServer (accessed on 22 March 2022).
  46. García-Mayordomo, J.; Martínez-Díaz, J.J.; Capote, R.; Martín-Banda, R.; Insua-Arévalo, J.M.; Álvarez-Gómez, J.A.; Perea, H.; González, A.; Lafuente, P.; Martín-González, F.; et al. Modelo de Zonas Sismogénicas para el Cálculo de la Peligrosidad Sísmica en España. In Proceedings of the 7th Asamblea Hispano-Portuguesa de Geodesia y Geofísica, Donostia, Spain, 25–28 June 2012. [Google Scholar] [CrossRef]
  47. IGME; ENRESA. Mapas Neotectónico y Sismotectónico de España a Escala 1:1.000.000. Vol. I (237 pp.) and Vol. II (167 pp.). 1998. Available online: www.igme.es (accessed on 22 March 2022).
  48. IGN-UPM. Actualización de Mapas de Peligrosidad Sísmica de España 2012; Centro Nacional de Información Geográfica, Instituto Geográfico Nacional: Madrid, Spain, 2013; 267p. [Google Scholar]
  49. Martínez-Pagán, P.; Navarro, M.; Pérez-Cuevas, J.; Alcalá, F.J.; García-Jerez, A.; Vidal, F. Shear-wave velocity structure from MASW and SPAC methods: The case of Adra town, SE Spain. Near Surf. Geophys. 2018, 16, 356–371. [Google Scholar] [CrossRef]
  50. Martín-Banda, R.; Insua-Arévalo, J.M.; García-Mayordomo, J. Slip Rate Variation During the Last ∼210 ka on a Slow Fault in a Transpressive Regime: The Carrascoy Fault (Eastern Betic Shear Zone, SE Spain). Front. Earth Sci. 2021, 8, 599608. [Google Scholar] [CrossRef]
  51. Martínez-Díaz, J.J.; Insua-Arévalo, J.M.; Tsige, M.; Rodríguez-Escudero, E.; Alonso-Henar, J.; Crespo, J.; Jiménez-Molina, D.; Moratalla, J.M.; Rodríguez-Péces, M.J.; Álvarez-Gómez, J.A.; et al. FAM-1 Borehole: First results from the scientific drilling of the Alhama de Murcia Fault, Betic Cordillera, Spain. GeoTemas 2016, 16, 579–582. [Google Scholar]
  52. Martínez-Díaz, J.J.; Masana, E.; Hernández-Enrile, J.L.; Santanach, P. Effects of repeated paleoearthquakes on the Alhama de Murcia Fault (Betic Cordillera, Spain) on the Quaternary evolution of an alluvial fan system. Ann. Geophys. 2003, 46, 775–791. [Google Scholar] [CrossRef]
  53. Masana, E.; Martínez-Díaz, J.J.; Hernández-enrile, J.L.; Santanach, P. The Alhama de Murcia fault (SE Spain), a seismogenic fault in a diffuse plate boundary: Seismotectonic implications for the Ibero-Magrebian region. J. Geophys. Res. 2004, 109, 1–17. [Google Scholar] [CrossRef]
  54. Ferrater, M.; Echeverría, A.; Masana, E.; Martínez-Díaz, J.J.; Sharp, W.D. A 3D measurement of the offset in paleoseismological studies. Comput. Geosci. 2016, 90, 156–163. [Google Scholar] [CrossRef] [Green Version]
  55. Silva, P. Landscapes and Landforms of Spain; Gutiérrez, F., Gutiérrez, M., Eds.; Springer: Dordrecht, The Netherlands, 2014; World Geomorphological Landscapes; Volume 2, pp. 273–288. [Google Scholar] [CrossRef]
  56. Griffiths, D.H.; Barker, R.D. Two-dimensional resistivity imaging and modelling in areas of complex geology. J. Appl. Geophys. 1993, 29, 211–226. [Google Scholar] [CrossRef]
  57. Loke, M.H.; Barker, R.D. Rapid least-squares inversion of apparent resistivity pseudosections by a quasi-Newton method. Geophys. Prospect. 1996, 44, 131–152. [Google Scholar] [CrossRef]
  58. McInnis, D.; Silliman, S.; Boukari, M.; Yalo, N.; Orou-Pete, S.; Fertenbaugh, C.; Sarre, K.; Fayomi, H. Combined application of electrical resistivity and shallow groundwater sampling to assess salinity in a shallow coastal aquifer in Benin. West Africa. J. Hydrol. 2013, 505, 335–345. [Google Scholar] [CrossRef]
  59. Zarroca, M.; Bach, J.; Linares, R.; Pellicer, X.M. Electrical methods (VES and ERT) for identifying, mapping and monitoring different saline domains in a coastal plain region (Alt Emporda, Northern Spain). J. Hydrol. 2011, 409, 407–422. [Google Scholar] [CrossRef]
  60. Samouëlian, A.; Cousin, I.; Tabbagh, A.; Bruand, A.; Richard, G. Electrical resistivity survey in soil science: A review. Soil Till. Res. 2005, 83, 173–193. [Google Scholar] [CrossRef] [Green Version]
  61. Friedman, S.P. Soil properties influencing apparent electrical conductivity: A review. Comput. Electron. Agric. 2005, 46, 45–70. [Google Scholar] [CrossRef]
  62. Ardanaz, O.; Dávila, L.; Teixidó, T.; Martí, D.; Martí, A.; Queralt, P.; Rodríguez-Escudero, E.; Camacho, J.; Martínez-Díaz, J.; Carbonell, R. Geophysical characterization of the Alhama de Murcia Fault in the Torrecilla sector. In Proceedings of the III Reunión Ibérica Sobre Fallas Activas y Paleosismologia (Iberfault), Alicante, Spain, 11–13 June 2018. [Google Scholar]
  63. Dahlin, T.; Zhou, B. Multiple-gradient array measurements for multichannel 2D resistivity imaging. Near Surf. Geophys. 2006, 4, 113–123. [Google Scholar] [CrossRef] [Green Version]
  64. Zhou, B.; Bouzidi, Y.; Ullah, S.; Asim, M. A full-range gradient survey for 2D electrical resistivity tomography. Near Surf. Geophys. 2020, 18, 609–626. [Google Scholar] [CrossRef]
  65. Park, C.B.; Miller, R.D.; Xia, J. Multichannel analysis of surface waves. Geophysics 1999, 64, 800–808. [Google Scholar] [CrossRef] [Green Version]
  66. Xia, J.; Miller, R.D.; Park, C.B. Estimation of near-surface shear-wave velocity by inversion of Rayleigh waves. Geophysics 1999, 64, 691–700. [Google Scholar] [CrossRef] [Green Version]
  67. Park, C.B.; Xia, J.; Miller, R.D. Imaging dispersion curves of surface waves on multi-channel record. SEG Technical Program Expanded Abstracts. Society of Exploration Geophysicists. USA, 1998; pp. 1377–1380. Available online: https://library.seg.org/doi/10.1190/SEGEAB.17# (accessed on 22 March 2022).
  68. Benz, H.M.; Chouet, B.A.; Dawson, P.B.; Lahr, J.C.; Page, R.A.; Hole, J.A. Three-dimension P and S wave velocity structure of Redoubt Volcano, Alaska. J. Geophys. Res. 1996, 101, 8111–8128. [Google Scholar] [CrossRef]
  69. Tryggvason, A.; Rognvaldsson, S.T.; Flovenz, O.G. Three-dimensional imaging of the P- and S-wave velocity structure and earthquake locations beneath Southwest Iceland. Geophys. J. Int. 2002, 151, 848–866. [Google Scholar] [CrossRef] [Green Version]
  70. Podvin, P.; Lecomte, I. Finite different computation of traveltimes in very contrasted velocity models: A massively parallel approach and its associated tools. Geophys. J. Int. 1991, 105, 271–284. [Google Scholar] [CrossRef]
  71. Tryggvason, A.; Bergman, B. A traveltime reciprocity discrepancy in the Podvin & Lecomte time3d finite difference algorithm. Geophys. J. Int. 2006, 165, 432–435. [Google Scholar]
  72. Vidale, J. Finite-difference calculation of travel times. Bull. Seismol. Soc. Am. 1988, 78, 2062–2076. [Google Scholar]
  73. Hole, J.A.; Zelt, B.C. 3-D finite-difference reflection traveltimes. Geophys. J. Int. 1995, 121, 427–434. [Google Scholar] [CrossRef] [Green Version]
  74. Olona, J.; Pulgar, J.A.; Fernández-Viejo, G.; López-Fernández, C.; González-Cortina, J.M. Weathering variations in a granitic massif and related geotechnical properties through seismic and electrical resistivity methods. Near Surf. Geophys. 2010, 8, 585–599. [Google Scholar] [CrossRef]
  75. Parsekian, A.D.; Singha, K.; Minsley, B.J.; Holbrook, W.S.; Slater, L. Multiscale geophysical imaging of the critical zone. Rev. Geophys. 2015, 53, 1–26. [Google Scholar] [CrossRef]
  76. Malehmir, A.; Socco, L.V.; Bastani, M.; Krawczyk, C.M.; Pfaffhuber, A.A.; Miller, R.D.; Maurer, H.; Frauenfelder, R.; Suto, K.; Bazin, S.; et al. Near-surface geophysical characterization of areas prone to natural hazards: A review of the current and perspective on the future. Adv. Geophys. 2016, 57, 51–146. [Google Scholar]
  77. Ogaya, X.; Alcalde, J.; Marzán, I.; Ledo, J.; Queralt, P.; Marcuello, A.; Martí, D.; Saura, E.; Carbonell, R.; Benjumea, B. Joint interpretation of magnetotelluric, seismic, and well-log data in Hontomín (Spain). Solid Earth 2016, 7, 943–958. [Google Scholar] [CrossRef] [Green Version]
  78. Befus, A.F.; Sheehan, M.; Leopold, S.P.; Anderson, S.P.; Anderson, R.S. Seismic Constraints on Critical Zone Architecture, Boulder Creek Watershed, Front Range, Colorado. Vadose Zone J. 2011, 10, 915–927. [Google Scholar] [CrossRef]
  79. Marzán, I.; Martí, D.; Lobo, A.; Alcalde, J.; Ruiz, M.; Alvarez-Marrón, J.; Carbonell, R. Joint interpretation of geophysical data: Applying machine learning to the modeling of an evaporitic sequence in Villar de Cañas (Spain). Eng. Geol. 2021, 288, 106126. [Google Scholar] [CrossRef]
  80. Linde, N.; Doetsch, J. Joint inversion in hydrogeophysics and near-surface geophysics. Integr. Imaging Earth Theory Appl. 2016, 218, 119. [Google Scholar]
  81. Nielson, T.; Bradford, J.; Holbrook, W.S.; Seyfried, M. The Effect of Aspect and Elevation on Critical Zone Architecture in the Reynolds Creek Critical Zone Observatory: A Seismic Refraction Study. Front. Water 2021, 3, 670524. [Google Scholar] [CrossRef]
  82. Anderson, S.P.; Blum, J.; Brantley, S.L.; Chadwick, O.; Chorover, J.; Derry, L.A.; Drever, J.I.; Hering, J.G.; Kirchner, J.W.; Kump, L.R.; et al. Proposed initiative would study Earth’s weathering engine. Eos Trans. Am. Geophys. Union 2004, 85, 265–269. [Google Scholar] [CrossRef]
  83. Nichols, G. Sedimentology and Stratigraphy, 2nd ed.; Wiley-Blackwell: London, UK; Washington, DC, USA, 2009. [Google Scholar]
  84. Heward, A.P. Alluvial fan sequence and megasequence models: With examples from Westphalian D–Stephanian B coalfields, northern Spain. In Fluvial Sedimentology; Miall, A.D., Ed.; Memoir 5, Canadian Society of Petroleum Geology: Calgary, AB, Canada, 1978; pp. 669–702. [Google Scholar]
  85. Martí, A.; Queralt, P.; Marcuello, A.; Ledo, J.; Rodríguez-Escudero, E.; Martínez-Díaz, J.J.; Campanyà, J.; Meqbel, N. Magnetotelluric characterization of the Alhama de Murcia Fault (Eastern Betics, Spain) and study of magnetotelluric interstation impedance inversion. Earth Planets Space 2020, 72, 16. [Google Scholar] [CrossRef] [Green Version]
  86. DeFelipe, I.; Alcalde, J.; Ivandic, M.; Martí, D.; Ruiz, M.; Marzán, I.; Diaz, J.; Ayarza, P.; Palomeras, I.; Fernandez-Turiel, J.; et al. Reassessing the lithosphere: SeisDARE, an open access seismic data repository. Earth Syst. Sci. Data 2021, 13, 1053–1071. [Google Scholar] [CrossRef]
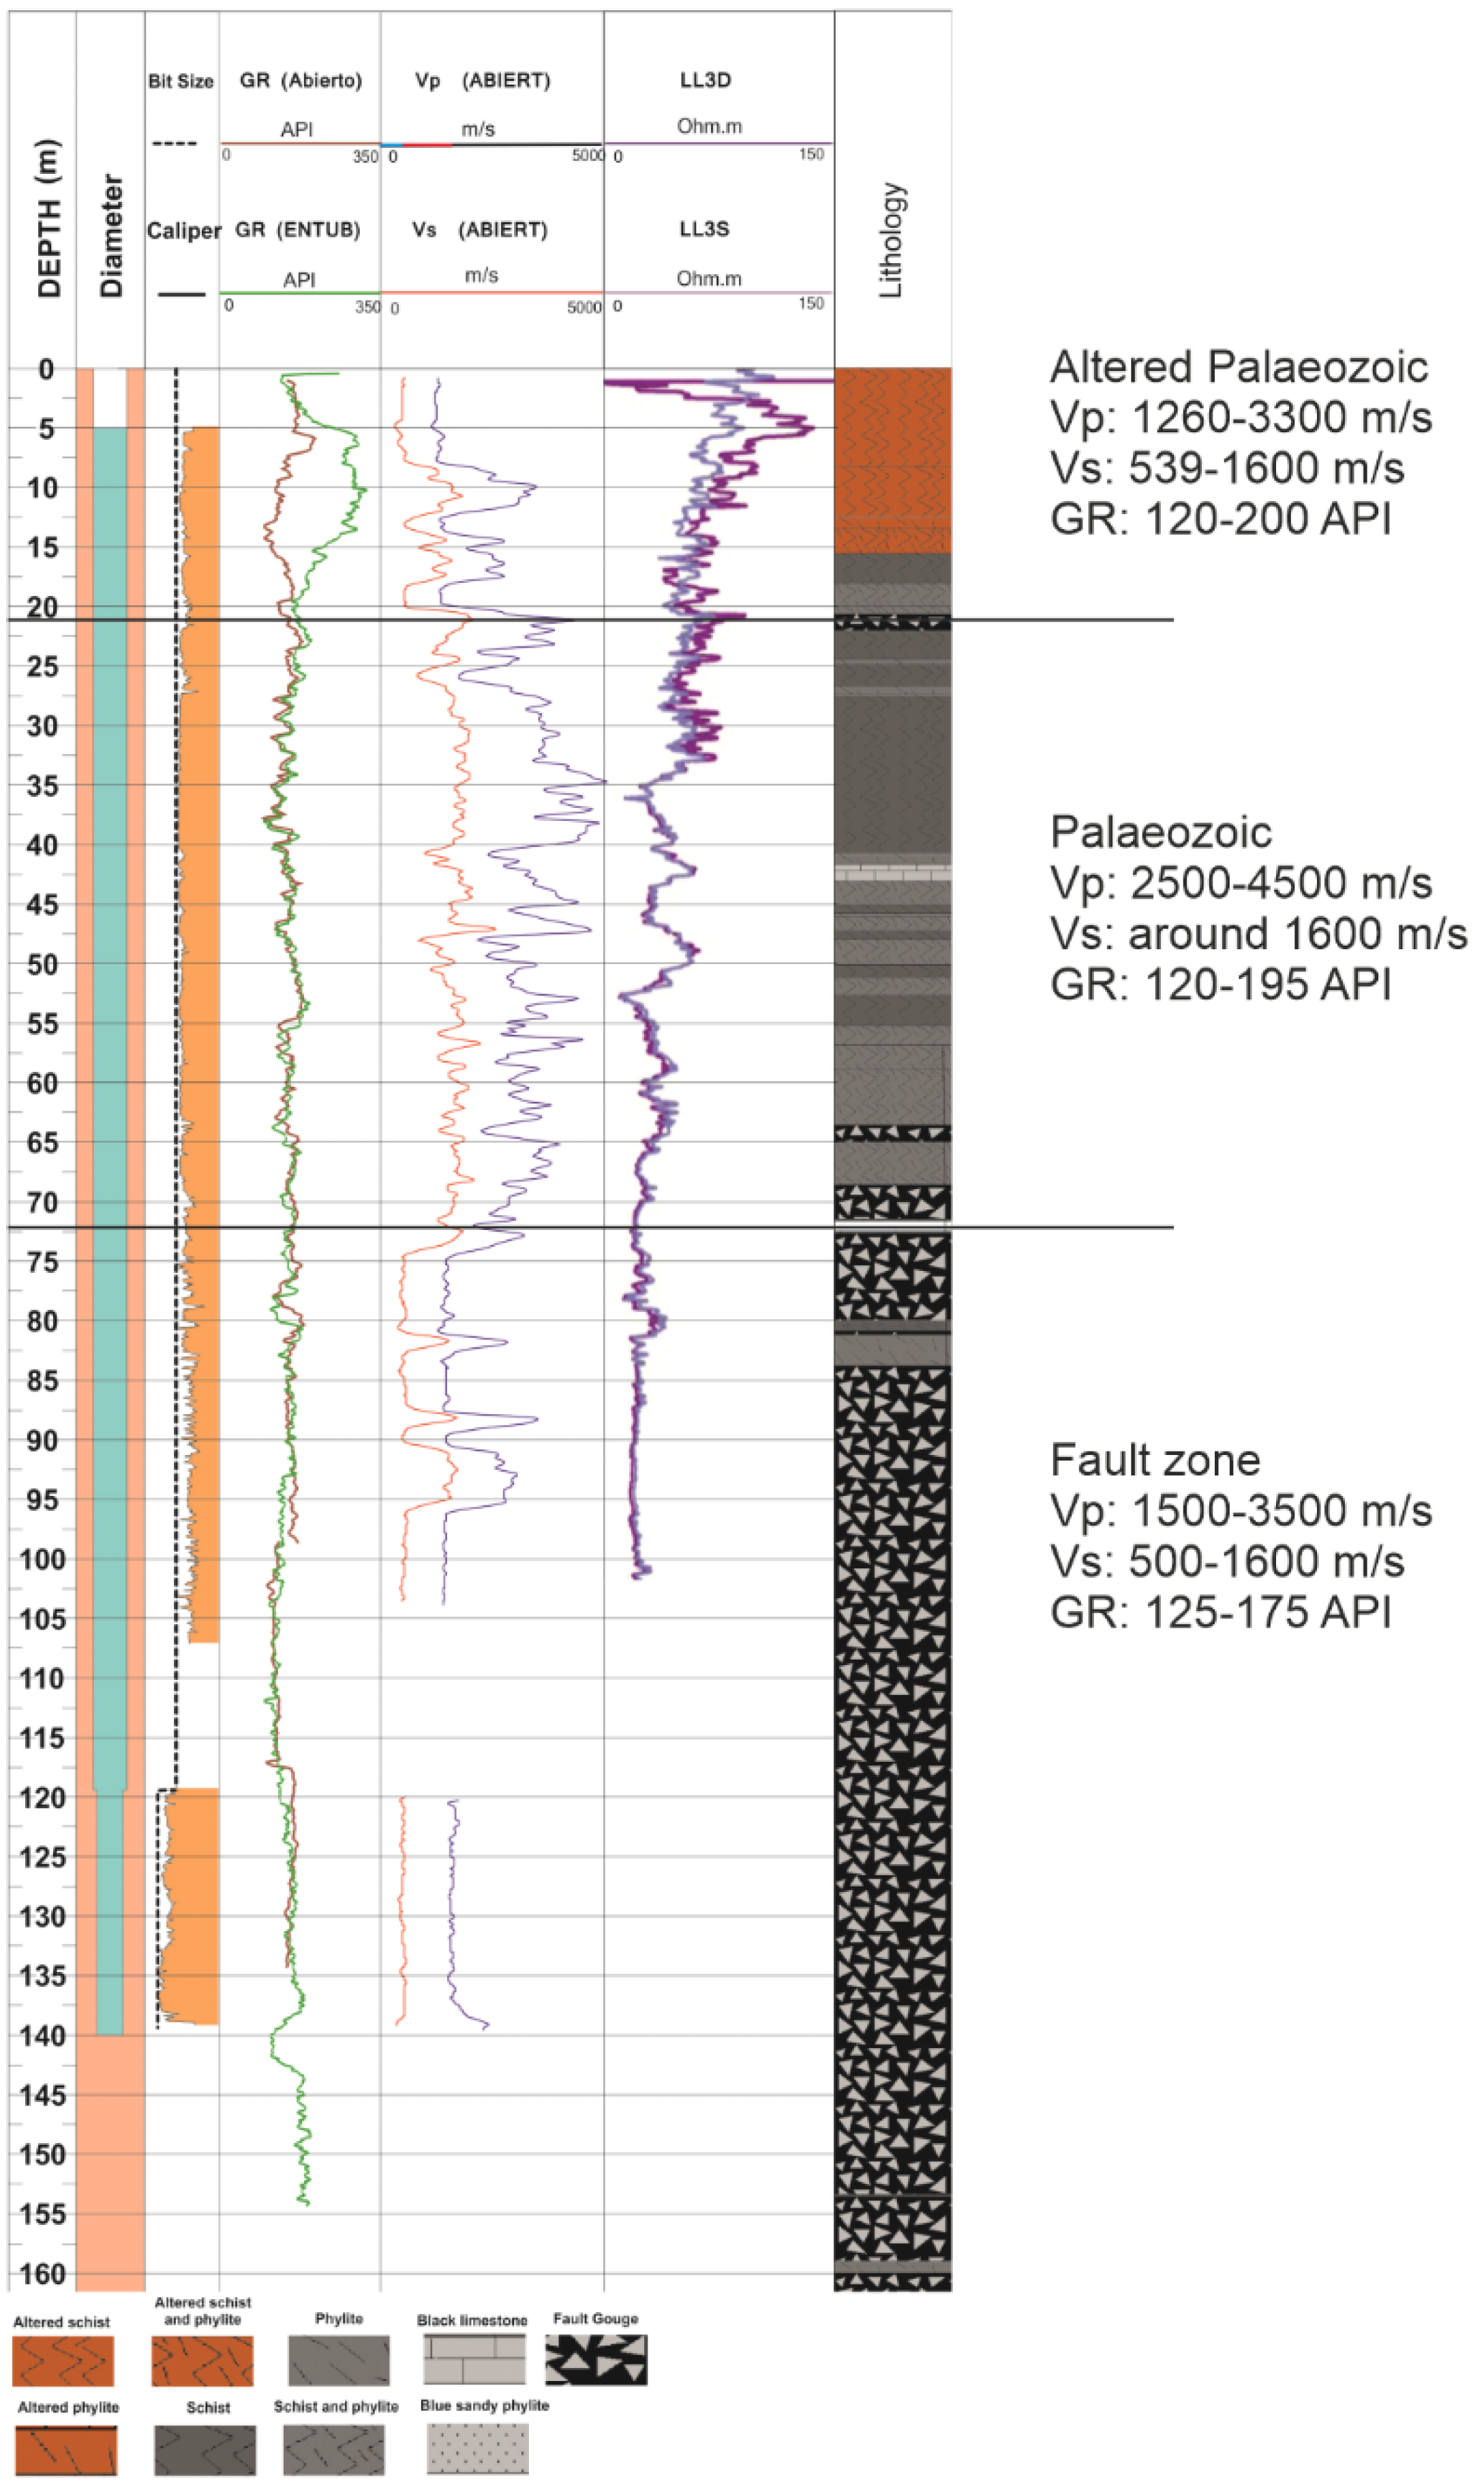
Figure 3. Gamma ray (GR), P-wave velocity (Vp), S-wave velocity (Vs), and resistivity logs recorded in the FAM-1 borehole (location in Figure 2C).
Applsci 12 03398 g003
Figure 4. (a) Error distribution after 9 iterations (absolute error = 11.53) between calculated and measured resistivities for the La Torrecilla ERT survey in first inversion. (b) Error distribution after five iterations (absolute error = 5.8) between calculated and measured resistivities in second inversion, once the points that exceeded 25% misfit (red crosses) were removed.
Applsci 12 03398 g004
Figure 5. (a) Example seismic shot record with labelled red arrows showing the extent of the surface waves. (b) Corresponding dispersion diagram. The high amplitudes are indicative of the different phases (frequency and phase-velocity). The theoretical and inverted curves are shown as white and black dots, respectively.
Applsci 12 03398 g005
Figure 6. The fundamental inputs for resolving the P-wave velocity subsurface distribution. (a) Example of the first-arrival times picked in the shot viewer (red crosses); (b) the space-time graphs of all picked first-arrivals; and (c) the first-arrival time is picked as a function of the independent variables CMPx (station) and the CMP constant offset. Ray paths are shown with a velocity reduction of 5000 m/s.
Applsci 12 03398 g006
Figure 7. Geophysical imaging of the La Torrecilla with the interpretation proposed and details. Black line indicates the thickness of the CZ. (a) The resistivity profile, (b) the Vp profile from first arrival P-wave tomography, (c) the Vs profile from MASW, and (d) a joint comparison of the CZ inferred from the different geophysical methods. The dot-yellow pattern is shown when the three methods match in their interpretations. The low-velocity anomaly (limited between F1 and F2) corresponds to the AMF shear deformation zone [49]. The variation in thickness of the CZ is indicated by h1, h2, and h3.
Applsci 12 03398 g007
Figure 8. Geophysical imaging of La Salud North site along ~1000 m NW-SE with the interpretation proposed. (a) The resistivity profile, (b) the Vp model, (c) the Vs model from MASW, and (d) a joint comparison of the interpreted CZ. The resistivity contact marked by Figure 1 and Figure 2 corresponds to the AMF shear zone in this sector.
Applsci 12 03398 g008
Figure 9. Geophysical imaging of La Salud South site with the interpretation proposed and details. (a) The Vp model from seismic tomography, (b) the Vs model from MASW, and (c) a joint comparison of the Vp and Vs results. The low velocity anomaly between F1 and F2 could correspond to the fault zone of the S-AMF.
Applsci 12 03398 g009
Figure 10. Geophysical imaging of Carrascoy site with the interpretation proposed and details. (a) The Vp model from seismic tomography, (b) the Vs model from MASW, and (c) a joint comparison of the interpreted CZ from both geophysical models. The low-velocity anomalies marked by F1 and F2 correspond to different thrust strands of the ACNF.
Applsci 12 03398 g010
Table 1. Processing workflow used to obtain the ERT models in La Torrecilla and La Salud North profiles.
Software PackageProcessing StepRationale
Prosys II (Iris Instruments)Step 1Data point inspection
Resix2DinvStep 2Negative values removal (filtering)
Step 3Insertion of the topography
Step 4Adjust the X,Z points along the GPS track
Step 5Edition of bad data points
Step 6Selection of inversion parameters
Step 7Display of model parameterization and selection of a finer mesh (Figure 4a)
Step 8With the new dataset, return to step 6 for a new iteration process (Figure 4b)
Table 2. Description of the seismic parameters in the study area.
Seismic Survey ParameterDescription
Seismic sourceAccelerated weight-drop (200 kg)
Source interval6 m
Source impacts1
Transect Lengtha. La Torrecilla = 1278 m
b. La Salud North = 960 m
c. La Salud South = 1488 m
d. Carrascoy = 2496 m
Receiver interval2 m
Geophone Natural Frequency5 Hz
Recording Time4 s
Sample rate1 ms
File formatSEGY
Table 3. Relationship between CZ thickness and the different geological units that host it.
ProfileGeological UnitsMinimum CZ (m)Maximum CZ (m)Average CZ (m)
La TorrecillaQuaternary fluvial sediments and alluvial fan deposits (quartzites conglomerates and unconsolidated deposits formed by gravel, sands, silts, and clays).30–4050–6040–50
La Salud NorthQuaternary formations (alluvial gravels and siltstones).30–4040–5035–45
La Salud SouthQuaternary formations (alluvial gravels and siltstones).30–4050–5540–47.5
CarrascoyThe Messinian rocks are associated with a weathered layer of marlstone as well as the Red Unit and Pleistocene-Quaternary alluvial fan deposits.15–3045–5030–40
Publisher’s Note: MDPI stays neutral with regard to jurisdictional claims in published maps and institutional affiliations.