Abstract
Climate change continues to have adverse effects on crop yields in Africa and globally. In Morocco, rising temperatures and declining precipitation are having daunting effects on the vulnerability of crops. This study examines the vulnerability of barley, maize, and wheat to variations in growing season precipitation and socio-economic proxies of adaptive capacity such as literacy and poverty rates at both national and sub-national scales in Morocco. The methodology is based on a composite vulnerability index (vulnerability is a function of exposure, sensitivity, and adaptive capacity). National and sub-national crop yield data used to compute the sensitivity index were downloaded from FAOSTAT and the global crop yield gaps Atlas. The mean annual growing season precipitation data at both the national and sub-national scales used to compute the exposure index were downloaded from the world bank climate portal. Proxy data for adaptive capacity in the form of literacy and poverty rates were downloaded from the world bank, figshare, and MPR archives. The CANESM model was used to validate the crop yield observations. The results show that wheat shows the lowest vulnerability and the highest adaptive capacity, while maize has the highest vulnerability and lowest adaptive capacity. Sub-nationally, vulnerability indexes decrease northwards while adaptive capacity and normalized growing season precipitation increase northwards. Wheat also shows the lowest vulnerability and highest adaptive capacity and normalized growing season precipitation at each latitude northward. Model validation shows that the models used here reproduce most of the spatial patterns of the crops concerned. These findings have implications for climate change adaptation and climate policy in Morocco, as it becomes evident which of these most cultivated crops are more vulnerable nationally and spatially. These results have implications for future research, as it might be important to understand how these crops perform under growing season temperature as well as what future projections and yield gaps can be observed.
Keywords:
vulnerability; exposure; sensitivity; adaptive capacity; precipitation; poverty; literacy; Morocco 1. Introduction
Climate change is an important challenge for the world in general and Africa in particular. Globally, warming of about 1.5 °C and a reduction in rainfall are already being recorded, with daunting consequences on agriculture [1]. The COP26 has set a target of stabilizing temperature increase at 1.5 °C while reducing deforestation and methane by 2030. The impacts of climate change are negatively affecting the agricultural sector and, in turn, food security. Each degree of warming reduces wheat yields by 6%, rice and soybean yield by 3%, and maize yields by 7% [2]. Although no country is spared the effects of climate change, Africa is among the most vulnerable continents. In West Africa today, rainfall generally decreases from the south to the north [3,4,5] while in North Africa, precipitation is characterized by a rainy winter season and dry summer conditions. The rainy season begins in October and lasts until April, with the months of December and February are the wettest [6,7]. Additionally, the entire region is marked by high inter-annual precipitation fluctuation. The effects of climate change are becoming more visible in Morocco, which has been designated as a very vulnerable country [8]. In Morocco, drought, rising average temperatures, heat waves, and shifting rainfall patterns are affecting more locations. “Since the 1960s, an increase of 1 °C has been observed throughout Morocco and projections show an increase of 1 to 1.5 °C by 2050 (3rd NC Morocco 2016) [9].”
It has been projected that between 2018–2050, there will be a downward trend of annual rainfall for various Representative Concentration Pathway (RCP) 4.5 (17.29%) and RCP 2.6 and RCP 8.5 (12.50% and 21.33%, respectively) [10]. The annual mean temperature was found to increase by 0.72 °C, 0.57 °C, and 0.69 °C under the RCP 2.6, 4.5, and 8.5, respectively [11]. In addition, a relative Standardized Precipitation Index (SPI index) computed to evaluate the impacts of climate change on drought occurrence in Morocco and based on the projected precipitation (2006–2100) from five high-resolution CORDEX regional climate simulations, under two emission scenarios (RCP 4.5 and RCP 8.5) shows a decrease in precipitation towards the future of up to −65% compared to the historical period. In terms of drought events, the future projections indicate a strong increase in the frequency of SPI events, considered as severe drought conditions [12]. In addition, the mean annual rainfall varies from 500 to 2000 mm in the northwest of the country (subject to Atlantic and Mediterranean influences), from 200 to 1000 mm in the west and center (subject to Atlantic influences), from 100 to 200 mm in the eastern part of the country, and to less than 100 mm in the south [13]. The consequences of this decline in rainfall in Morocco are northward shift in arid conditions, higher temperatures, reduced growing season precipitation, and increased crop vulnerability [14].
In Morocco, crop yields are being driven by the increased frequency of extreme weather events and unpredictable weather patterns. Extreme droughts were recorded during the seasons 1986–1987, 1991–1992, 1994–1995, and 1998–2000, and floods in 2014, 2011, and 2009, inter alia [15]. Due to the negative future climate estimates for Morocco (1.3 °C increase in yearly mean temperature and 11% drop in the annual average rainfall by 2050), the country will be facing economic and food security issues, as agriculture is highly climate dependent in Morocco [15]. For example, summer droughts affect the Gharb in Morocco, but their intensity and length vary from one year to another, and between the Atlantic Gharb and the High Gharb. When the summer droughts exceed 6 consecutive months, a major constraint for crops in the Gharb is easily triggered. Although the Rif mountains and the Middle Atlas Mountains provide most of the water that contributes to supporting the summer discharge in the Sebou basin, the amount of water available in summer—especially during the less rainy months of the year (July and August)—is generally insufficient for the agricultural needs of the Gharb [16]. To grapple with the decline in discharge, dams have been built upstream of the Sebou basin to mobilize winter water resources for summer use. Some dams also help in controlling floods that used to ravage the Gharb plain—for example, the Al Wahda dam [17].
Cereal seeds play a vital economic role in Morocco by providing certified seeds with enhanced genetic capabilities that are drought- and pest-resistant and have a short growing season. The cereal seed industry is a vital part of the larger agricultural system that generates jobs and economic growth in the agricultural sector. According to the Ministry of Agriculture (MoA), the cereal seeds sector earned over MAD 600 million in revenue in 2009 (2009, Kingdom of Morocco) [18]. The current turnover is projected to be more than MAD 1.2 billion (around USD 140 million). As a result, the cereal seeds sector is critical to the Green Morocco Plan (GMP), as it promotes agricultural production while also improving the capacity of other agricultural (such as legume, vegetable, and fruit) and animal sectors [19].
Assessing the vulnerability of crops to growing season precipitation and socio-economic variables is very important because it enhances understanding of the role of climatic and non-climatic variables in impacting vulnerability. For example, at the level of sub-Saharan Africa, a few such assessments have been performed in the scientific literature as follows: Epule [20] developed a crop yield vulnerability index for maize yields to droughts in Uganda; this approach was later applied to assess the vulnerability of five crops to droughts in Uganda, as well as three crops in Cameroon [20,21]. In Morocco, a few studies have looked at how vulnerable crops are to droughts from various viewpoints. For example, Ouassou [22], discussed the application of drought management guidelines in Morocco as well as the national drought observatory in the form of an institutional zone. Within this, they also present the characterization of drought risk and vulnerability assessment in agricultural systems in the Oum Er Rbia river basin. Additionally, Imani [23] observed that the drivers of vulnerability in Morocco at the river basin level are average annual rainfall, the proportion of irrigated land, land status, literacy ratio, and access to drinking water. Additionally, Karmaoui [5] noted that oasis agriculture is vulnerable to climate change, and that biofertilizers could be a possible technique in reducing the effects of climate change on oasis agriculture in Morocco. Furthermore, Fniguire [24] discussed the spatio-temporal variations of drought vulnerability and risks through the SPI and observed that the inter-annual variability of rainfall is partly responsible for the vulnerability of agricultural systems in Morocco. Finally, Schilling [25] looked at climate change vulnerability and adaptability in Morocco, observing that a combination of declining supplies and rapid population expansion are exacerbating the country’s difficult water sanitation situation.
Despite the proliferation of literature on vulnerability in Morocco, there are still no studies that have used and perfected the vulnerability index reported in [20,21] to analyze the vulnerability of several crops in Morocco at both the national and sub national scales. The index employed in this study is largely relevant in determining how vulnerable cropping systems are to droughts in African crop production contexts by integrating crop yield, climatic, and adaptive capacity data. Indeed, this method is helpful as it can meet the objectives of offering a comprehensive approach that includes climatic and socioeconomic factors into vulnerability assessments and mapping [21]. Additionally, it is based on historical data for field verifications of the actual stress that agricultural systems may face [21,26]. The adaptive capacity component of this indicator specializes in two factors which are particularly important in the African context: namely, literacy and poverty rates [27]. This work therefore seeks to assess the vulnerability of barley, maize, and wheat to changes in growing season precipitation in Morocco at both the national and sub-national scales. These crops were selected because they are among the most widely grown crops in Morocco [28]. In other words, this study’s goal is to evaluate the vulnerability of these three crops in Morocco by assessing their sensitivity index, exposure index, and adaptive capacity index at the national and sub- national scales using growing season precipitation and two socio-economic indicators, which are poverty and literacy rates (Figure 1).
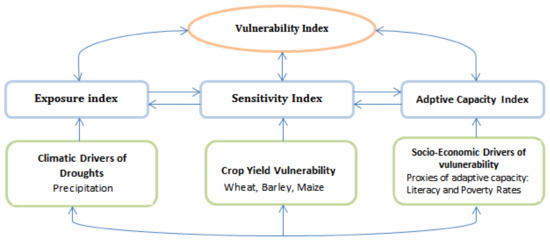
Figure 1.
The conceptual framework of vulnerability.
2. Conceptual Framework
2.1. Vulnerability Index
The vulnerability index represents the susceptibility of a system to loss or damage or its propensity to be adversely affected by something else. It also contains a range of concepts such as sensitivity and lack of adaptive capacity [29]. Closely linked to vulnerability is the concept of risk, which is based on of the interactions of vulnerability, exposure, and hazard [29]. Hazards on the other hand represent the potential occurrence of a natural or human-induced physical event or physical impact that may cause loss of life, injury, or other health impacts, as well as damage and loss of property, livelihoods, services, ecosystems, and environmental resources. In other words, hazards refer to physical events and trends or physical impacts [29]. To further support the above, the vulnerability sourcebook [30] reaffirms the definition of vulnerability as, “The propensity or predisposition to be adversely affected. Vulnerability encompasses a variety of concepts and elements including sensitivity or susceptibility to harm and lack of capacity to cope and adapt.” The vulnerability assessment reveals that tailored support can play an important role in assisting the rural poor in adapting to climate change [30]. Vulnerability is frequently influenced by the amount and rate of climate change, as well as the variability to which any specific cropping system is subject (wheat, barley, and maize yields) [20]. Vulnerability is a function of (1) the exposure index, which describes the effects of climate change on components of the climate such as precipitation and temperature; (2) the sensitivity index, which describes the extent to which climate change has a detrimental effect on a cropping system; and (3) the adaptive capacity index, which measures a production system’s ability to react to shocks produced by precipitation reduction. Literacy and poverty rates, for example, can serve as proxies for adaptive ability [20,31] (Figure 1).
In this study, the vulnerability index is based on time series crop yields, precipitation, and socio-economic proxies of adaptive capacity [21,32,33]. The approach used by this study for framing vulnerability improves the quantification of variables, such as adaptive capacity, that cannot be easily quantified. Data on adaptive capacity are difficult to come by throughout most of Africa, forcing scientists to rely on proxies. Literacy and poverty rates are the two most important proxies of adaptive capacity in Africa in general and Morocco in particular [21] (Figure 1). This is because poverty reduction and enhancement of literacy have been identified as key drivers of development across Africa, including Morocco.
2.2. Sensitivity and Exposure Indexes
The sensitivity index describes responses to climatic stimuli or climatic extremes [29]. It also represents the impact of climate forcing on the yields of the crops concerned [29]. In other words, the sensitivity index measures the quantitative decrease in agricultural yields because of climate change, climatic variability, and severe events [31,34,35,36]. Thus, the sensitivity index examines how actual yields respond to precipitation during the growing season. In theory, the sensitivity index (crop vulnerability index) is directly related to the exposure index (drought vulnerability index)—mostly via evapotranspiration (Figure 1). According to the vulnerability sourcebook [30], “sensitivity is determined by those factors that directly affect the consequences of a hazard. Sensitivity may include physical attributes of a system (e.g., building material of houses, type of soil on agriculture fields), social, economic, and cultural attributes (e.g., age structure, income structure). Thus, the understanding of sensitivity largely remains unchanged from the AR4 concept.”
The exposure index depicts the presence of people, livelihoods, species or ecosystem functions, services, resources, infrastructure, economic, social, and/or cultural assets in places and settings that could be adversely impacted by climate change [29]. The exposure index is therefore related to the climate stress level of a given analysis unit or system [29]. Furthermore, the vulnerability sourcebook [30] affirms the definition of exposure as, “the presence of people, livelihoods, species or ecosystems, environmental functions, services, and resources, infrastructure, or economic, social, or cultural assets in places and settings that could be adversely affected”. The term “exposure” in AR5 differs from the way it is used in the AR4. Exposure is related to specific exposed elements (or elements at risk), e.g., people, infrastructure, ecosystems. Exposure can be expressed by absolute numbers, densities, or proportions, etc., of the elements at risk (e.g., population density in an area affected by drought). A change in exposure over time (e.g., change in the number of people living in drought-prone areas) can increase or decrease risk [30]. In this study, the exposure index describes the level and character of the stimulus as represented in the quantity, severity, and length of droughts, or quantitative changes in precipitation or temperature caused by climate change [20,31,34,35,36,37]. The exposure index concentrates on how precipitation reacts to changes in climate. As with sensitivity, vulnerability has a positive correlation with exposure [38] (Figure 1).
2.3. Adaptive Capacity Index
Adaptive capacity, which is a component of resilience development, refers to the ability to shift and capitalize on opportunities or cope with the repercussions of climate change. Adaptive capacity is often context-specific and depends on the availability of resources and the capacity to learn, as well as governance measures. Often, adaptive capacity must be translated into actions, without which vulnerability will be enhanced [29]. The adaptive capacity index indicates therefore the inherent characteristics of a system that allow it to adjust. In addition, adaptive capacity can be framed as, “the ability of systems, institutions, humans, and other organisms to adjust to potential damage, to take advantage of opportunities, or to respond to consequences’ (e.g., knowledge to introduce new farming methods)” [30]. In the context of this current work, this refers to a production system’s (wheat, barley, and maize) capacity to adapt to and deal with a variety of stresses and shocks, such as climate change, climate variability, and extreme occurrences [31,35,36,39]. In this work, the adaptive capacity of farmers to produce crops to manage droughts regularly reduces the severity of drought effects on agricultural production [21]. The effect of the adaptive capacity index on the exposure, sensitivity, and vulnerability indexes are determined through proxies such as literacy and poverty rates. Poverty and literacy rates were chosen as the primary socioeconomic proxies because they fully contain and influence all other variables. For instance, poverty alleviation might result in increased literacy rates, and the ramifications of this might be shown in improved social networks, connections, safety nets, enhanced transportation and route networks, greater property ownership, and more discretionary income, as well as the capacity to irrigate rivers and streams [20,39]. All these sub-indices (sensitivity, exposure, and adaptive capacity) combine to form the vulnerability index (Figure 1).
As seen above, the vulnerability sourcebook presents two perspectives of vulnerability based on the AR4 and AR5. The AR4 perspective frames vulnerability as a function of exposure, sensitivity, and adaptive capacity, while the more recent AR5 frames vulnerability as a function of hazard exposure and adaptive capacity. In the current work, we adopt the AR4 definition of vulnerability for our methodology based on the following reasons: (1) It involves a broader perspective of vulnerability that already encompasses three elements of the AR5 perspective (exposure, sensitivity, and adaptive capacity); (2) the different components of vulnerability introduced here have specific contributions towards the climate-agriculture and socio-economic proxies (exposure reflecting the effects of climate forcing, sensitivity representing yield changes, and adaptive capacity reflecting the ability to cope through specific proxies), which all correspond to the precipitation, yield and adaptive capacity data; (3) the equation which states that vulnerability is a function of exposure, sensitivity, and adaptive capacity has recently been cited by several studies [20,21,40] and used to frame vulnerability; and finally (4), this work aims at incorporating the hazard element of vulnerability into exposure, which is also a reflection of the effects of climate on vulnerability. This is important because including a separate variable for hazards might lead to double counting, since exposure already covers that dimension.
3. Materials and Methods
3.1. Study Site
Morocco is situated in the northwest of Africa between latitudes 20.5 ° N and 36 ° N. It spans an area of 446,550 km2 with a population of roughly 37 million, as well as a semi-arid climate affected by the Atlantic Ocean, the Mediterranean Sea, and the Sahara Desert [40]. Its topography is dominated by two big mountain ranges (Rif and Atlas), the highest of which stands at 4165 m. This sort of topography causes a lot of precipitation anisotropy. Morocco’s precipitation is characterized by a high degree of spatiotemporal variability and a rainy season extending through winter and spring from November to April, which coincides with the cereal growing season. Morocco’s northern region receives more precipitation, which may reach 900 mm, whilst the country’s central region receives less than 350 mm (Figure 2). Similarly, the temperature has a considerable degree of geographical fluctuation. When compared to other parts of the nation, high-elevation locations (such as the high Atlas Mountains) have cooler temperatures [41,42]. The cereal sector is one of Morocco’s most important agricultural output industries; it occupies up to 90% of the rainfed agricultural area in Morocco, employs a huge population, and contributed to the agricultural value added over the period 2008–2018 of, on average, around 15.6% [43]. Early sowing takes place in November, if significant precipitation occurs at that time—while the sowing can be extended to January if precipitation is delayed. Late sowing usually results in lower production compared to early sowing, due to both a decrease in cropped areas—because many farmers will not plant if rain occurs late in the season—and the period of high temperatures which coincides with the latter part of the season, which may wreak havoc on yields [44,45]. Harvests take place generally around the end of May. Common wheat accounts for about half of the gross value of cereals, followed by durum wheat (27%), barley (23%), maize (2%), and other cereals (sorghum and rice) (1%). The average yields are still low and considerably below the potential of each region [19].
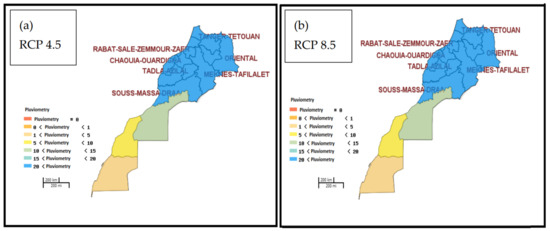
Figure 2.
Spatial distribution of pluviometry across Morocco under (a) and (b).
3.2. Data Collection
Several datasets and both the national and sub national scales were employed in this study. Data collection started at the national scale as the main unit of analysis, down to the sub-national scale, based on the data from nine stations from the south to the north of Morocco. All data on the different sub-components of vulnerability were collected to attain the objectives of this study. The annual yield data for the national scale assessment for the three crops chosen: wheat, barley, and maize over the period 1991–2019 in hg/ha/year were collected from FAOSTAT [46], aiming to calculate the national scale sensitivity index. At the sub national scale, crop yield data (hg/ha/year) for the period 1989–2014 were downloaded from the Global Yield Gap Atlas [47] (https://www.yieldgap.org/ accessed on 3 November 2021) for nine stations in Morocco where these crops are mainly grown: Agadir, Beni Mellal, Fes Sais, Marrakesh, Meknes, Nador Arwi, Nouasser, Safi, and Tanger. The historical period for this sub national scale perspective was limited to 1989–2014 due to data availability. As with the national scale, the sub national perspectives helped to give us a spatial context of changes in the sensitivity index.
Furthermore, the mean annual precipitation data and the mean crop growing season precipitation for each crop over the periods 1991–2019 and 1998–2014 for the national and sub national scale assessments were collected from the World Bank Climate Change Knowledge Portal [48] (https://climateknowledgeportal.worldbank.org/download-data accessed on 31 October 2021). The latter were used to compute the exposure index. As shown in Figure 3, the growing seasons for wheat and barley are the same, but different for maize. On the other hand, the mean growing season precipitation data for each year is an average aggregate for that year’s growing season months. The national scale exposure index was validated at the sub-national scale using the mean annual crop growing season precipitation and the mean annual precipitation data collected from the World Bank Climate Change Knowledge Portal [48].
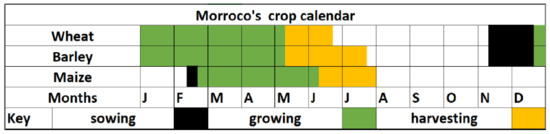
Figure 3.
Crop calendar for wheat, barley, and maize in Morocco.
To compute the adaptive capacity index, two proxies of adaptive capacity were used. It turns out that poverty (%) and literacy rates (%) are major indicators of the variations in the adaptive capacity and resilience to climate disturbances. These two proxies were selected to assess the adaptive capacity. The poverty rate involves the material and financial assets that reflect the capacity of populations to maintain their functioning in the face of the external constraints imposed by climate change by appealing to resilience and evolving more desirable tools and livelihoods that help improve the sustainability of the crop system. The literacy rate on the other hand involves the ability of a farmer to read and be able to grasp knowledge on climate change. The national-scale poverty and literacy rate data were collected for the period 1991–2019 from [49] (doi.org/10.6084/m9.figshare.16903483.v1 accessed 31 October 2021), while those for the sub-national scale sites were collected for the period 1989–2014 from the Regional Disparities in Development in Morocco [50]. Since the vulnerability index is a composite index, it is a function of the three indexes already mentioned (the sensitivity index, exposure index, and adaptive capacity index). Therefore, the simulation of the vulnerability index will be based on the data collected from these three indexes. This computation will be explained in the subsequent parts of this paper.
3.3. Data Analyses
3.3.1. Vulnerability Indexes
This work is based on a composite vulnerability index developed by [20,21,39]. This index was created with the intention of being used in the context of African agricultural growing. This composite index is a combination of three sub-indexes that are subcomponents of the vulnerability index (sensitivity index, exposure index, and adaptive capacity index). These indexes are used to determine the degree of vulnerability of (wheat, barley, and maize) in Morocco and to incorporate some crop parameters such as yield, precipitation, and socio-economic proxies (poverty and literacy rates). This methodology is based on other vulnerability indexes, including the Notre Dame Global Adaptation Index (ND-GAIN) [51], the crop-drought indicator [52], and the water-poverty index [53]. Equation (1), shown below, was used to compute the vulnerability index:
where VUxinsn is the crop yield vulnerability index for wheat, barley, and maize at the national and sub-national scale, SExinsn is the crop yield sensitivity index at both the national and sub-national scale, and EXyinsn is the yield crop exposure index—also at the national and sub-national scale. ADCxinsn is the crop yield adaptive capacity index at both the national and sub-national scale, while x indicates the year and i is the given crop.
3.3.2. Sensitivity Index
To determine the sensitivity index of crop yields to rainfall perturbations, a crop yield sensitivity index was calculated at both the national and sub-national scale, from the period 1991–2020 for the national scale and 1989–2014 for the sub national scale, respectively, using methods adapted from [21,51]. Detrending was used to eliminate a linear model of the actual yield time series from the data [54,55,56], which was carried out by dividing the projected linear trend value by the actual observed value (Equation (2)). Detrending reduces the consequences of agricultural technological advancements and has the capacity to illustrate annual crop yield variations due to rainfall, reducing the effects of consistent reporting or bias errors resulting from estimations of expected crop yields [21,55,56]. For the three crops selected (wheat, barley, and maize) the expected crop yields were projected by using a trend line equation for a simple linear regression (Equations (3)–(5)). The observed and expected crop yield data were regressed against the precipitation data. Then, the sensitivity indexes for each crop were computed by dividing the mean expected crop yields by the mean observed crop yields (Equation (6)).
where EXPynsn is the projected crop yield at both the national and sub-national scales, a is the linear trend, b is the intercept when EXPynsn = ax, and x is the year.
EXPywheatn, EXPybarleyn, EXPymaizen represent the expected wheat, barley, and maize yields in Morocco at the national scale; the numbers in the equations are the slopes and intercepts from left to right, respectively, and x represents the years.
where SExynsn represents the crop yield sensitivity index at both the national and sub-national scale, EXPxynsn is the mean expected crop yield—also at the national and sub-national scale, and ACTxynsn is the mean actual crop yield at both national and sub-national scale. y and x represent the yield and the year respectively.
3.3.3. Exposure Index
This index was computed following similar approaches in studies by [20,21,51,57]. The exposure index was fitted by dividing the mean annual precipitation by the mean growing season precipitation for each crop at the national scale for the period 1991–2020, and from 1989 to 2014 for the sub-national scale. Precipitation data were used because agriculture in Morocco is essentially driven by precipitation [58]. Equation (7), shown below, was used to compute the exposure index:
where EXypnsn represents the crop yield exposure index at the national and sub-national scale, μLTannualpptnsn (1991−2020 and 1989–2014, respectively) is the mean annual precipitation at both the national and subnational scale, and μSTYGSpptnsn (1991−2020 and 1989−2014, respectively) is the mean growing season precipitation at both national and sub-national scale, while y represent years and p is the precipitation.
3.3.4. Adaptive Capacity Index
In our approach, poverty and literacy rates were used to assess and compute the adaptive capacity index. These proxies were selected because of the scarcity of data for other proxies such as transportation, safety nets, and natural resources. Furthermore, these two proxies accurately reflect adaptive capacity and have an impact on all other proxies. These proxies have an inverse connection, although they are not completely independent. Poverty reduction can boost literacy rates and resistance to climatic shocks by increasing access to climate knowledge and investing in more resilient farming systems [59]. It can be observed through the Green Morocco Plan (GMP) that the technical and material support offered to help small and medium scale farmers is able to somehow reduce the poverty rate in the agricultural sector in Morocco. Therefore, it turns out that reducing the poverty rate can lead to improved access to irrigation through easy access to knowledge and rationalization of new irrigation practices, which can also help in reducing the effects of problems associated with declining rainfall, as well as rainwater harvesting. Equation (8) was used to compute the adaptive capacity index:
where AdCynsn is the crop yield adaptive capacity index at the national and sub-national scale, Pytnsn and Lytnsn are the poverty and literacy rates (%) at both the national and sub-national scale, respectively, and y represents the year notation.
3.3.5. Validation of Crop Yield and Growing Season Rainfall Trends at the Sub-National Scale
To validate the results at the sub-national scale and to ensure that the models used here to assess vulnerability adequately reproduce the variations in the yields of the concerned crops, a validation model was employed. For the sub-national spatial variations in crop yield and precipitation, this work used yield data for the period 1919–2020 for the CANESM model to validate the yield and precipitation observations. The yield model was first run for the RCP 4.5 scenario for wheat and barley, for which data were available for the period 1991–2020. Later, the RCP 8.5 scenario was used to evaluate wheat and barley. This was also conducted for precipitation under the RCP 4.5 and RCP 8.5 scenarios. The spatial yield and precipitation models were run within the MOSAICC simulator interface available at [60] (http://196.200.148.123/mosaicc/ accessed on 3 November 2021), within which all model parameters were selected and specified, and the model was run. The models used here are considered reliable as they reproduce most of the spatial variations in yield and the error terms of the regression equations are considered valid.
4. Results
4.1. Patterns of Growing Season Precipitation and Crop Yield at the National Scale in Morocco
The results from the vulnerability indexes previously discussed were consistent with the patterns of observed yields for the three crops involved in this analysis in Morocco. For example, wheat showed the lowest vulnerability index and the highest adaptive capacity index, and its yields were observed to be higher when compared to the other crops throughout the time series 1991–2020. This is consolidated by the fact that wheat has an equal, relatively higher R2 for all the three crops of 0.24 or 24% (Figure 4a). Just as with the vulnerability indexes, barley showed the second highest yield trends throughout the series, while maize had the lowest. This are also consistent with their R2, which was 0.107 (10.7%) and 0.103 (10.3%) for barley and maize, respectively.
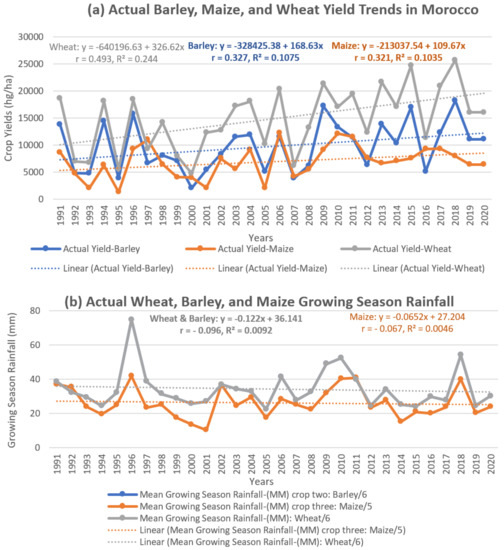
Figure 4.
Trends in (a) actual wheat, barley, and maize yields, and (b) actual mean growing season precipitation for wheat, barley, and maize in Morocco.
While wheat had higher yields throughout the time series, an interesting observation was that the highest R2 for wheat was only around 24%, an indication that in general these crops are highly vulnerable, as shown by their recurrent up and down cyclical trends. These frequent cyclical trends of up and downs are indications that these crops have fluctuating yields and that the country experiences frequent droughts. This can be confirmed from the observations in the patterns of growing season precipitation (Figure 4b). In this context of growing season precipitation, it can be observed that throughout the series, wheat and barley showed the highest—and the same—amounts of precipitation during their growing season, while maize showed lower growing season precipitation throughout the series. The consistency in the growing season precipitation for wheat and barley is associated with the fact that the two crops are grown over the same growing season months (Figure 3).
The results also showed the same R2 for wheat and barley, which was higher than that of maize (Figure 4b). Another common phenomenon of the observed growing season precipitation was frequent fluctuations which tallied with those for yields, and consequently—like the vulnerability indexes—further depicted the influence of growing season precipitation on the yields of these crops. Evidently, maize is more affected, as reflected in its lower yields throughout the time series—trends that tallied with highly fluctuating growing season precipitation (Figure 4b). The parallel scatter plots for these three crops showed a general positive relationship between yield and growing season precipitation (Figure 5a–c). This is an indication that the cultivation of these crops is dependent on the growing season precipitation. However, due to high levels of variability in growing season precipitation in Morocco, the cultivation of these crops is likely affected. Barley showed the highest r and R2, followed by wheat, and maize showed the lowest (Figure 5a–c). However, though these correlations and R2 were positive, they were generally weak, meaning that there is a weak relationship between these crops and precipitation. This means that even though agriculture is essentially rainfed, other potential drivers of agriculture might be irrigation and fertilization. The results of declining precipitation in Morocco go a long way to supporting this finding.
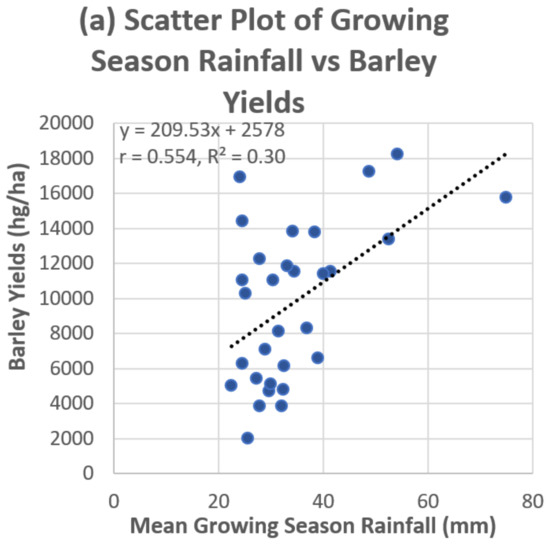
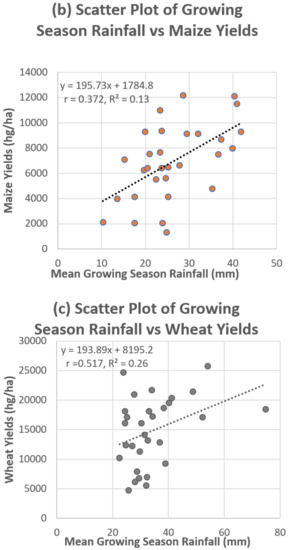
Figure 5.
Scatter plots of mean growing season rainfall vs. (a) barley yields, (b) maize yields, and (c) wheat yields.
4.2. Patterns of Vulnerability, Exposure, and Adaptive Capacity at a National Scale
At a national scale in Morocco, the vulnerability, exposure, sensitivity, and adaptive capacity indexes varied for barley, maize, and wheat. The initial results from the vulnerability indexes confirmed this assertion. For example, wheat showed the lowest rates for all the indexes except for the adaptive capacity index, where it showed the highest rate. The vulnerability index for wheat was 0.15 and the exposure index was 0.75, while the sensitivity index was 1.1. The adaptive capacity index of wheat was 1.7 (Figure 6). These initial results show that wheat is the least vulnerable of the three crops and the most adaptive, due to the higher adaptive capacity of the farmers. Barley on the other hand is the second, as it showed the second lowest vulnerability index of 0.42, the same exposure index as wheat of 0.75, the second lowest sensitivity index of 1.2, and the second highest adaptive capacity index of 1.53 (Figure 6). Finally, maize showed the highest vulnerability index of 0.84, the highest exposure index of 1.01, the highest sensitivity index of 1.3, and the lowest adaptive capacity index of 1.47 (Figure 6). From these results, wheat is the least vulnerable and the most adaptive of the three crops, followed by barley—while maize is the most vulnerable and the least adaptive, as indicated by the low adaptive capacity of the farmers.
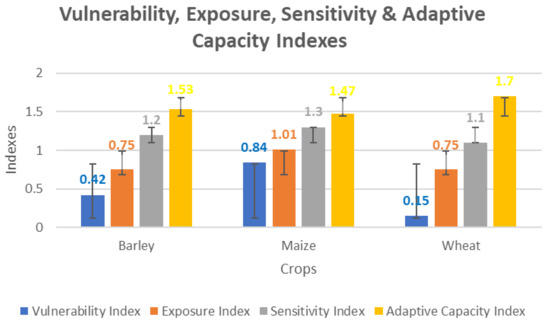
Figure 6.
Vulnerability, exposure, sensitivity, and adaptive capacity indexes of selected crops in Morocco.
From a temporal perspective, the results showed that vulnerability generally declined over time for all three crops, while adaptive capacity increased. The other sub-indexes (sensitivity and exposure indexes) were generally declining in a fluctuating manner but were higher than the vulnerability index (Figure 7). When these indexes were compared with yield trends and growing season precipitation (Figure 4a,b), it was observed that the yields assumed a highly fluctuating but declining trend, while growing season precipitation was also highly variable and unreliable over time. This unreliable growing season precipitation is an indication that precipitation was adversely affecting yields in the study area and that the rising yield trends for some crops can be attributed to other drivers such as irrigation and agricultural mechanization. Indeed, the level of vulnerability for any of these crops was mitigated by the adaptive capacity of the farmers cultivating the crop. This was seen here, as higher adaptive capacities were often linked to lower vulnerability indexes. Thus, the hypothesis was that when the adaptive capacity index is high, the vulnerability index is lower. Over time, the results showed that the adaptive capacity index had been increasing while the vulnerability index had been declining. Additionally, the adaptive capacity and vulnerability indexes were higher and lower, respectively, in the northern parts of the country when compared to the southern parts. Invariably, the adaptive capacity index plays a key role here, as it ultimately determines the level and intensity of vulnerability. Despite the magnitude of the climate forcing, adequate adaptive capacity could mitigate its effects and lower the vulnerability index.
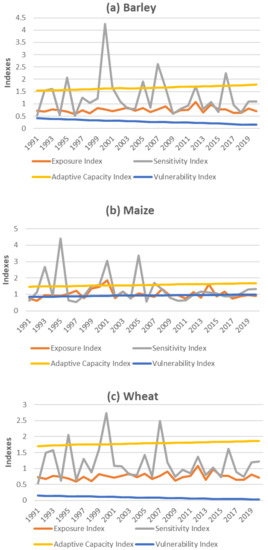
Figure 7.
Temporal variations of vulnerability indexes for (a) barley, (b) maize, and (c) wheat at the national scale.
In terms of Pearson correlations, it can be observed that at the national scale, the correlation between the adaptive capacity index and the vulnerability index was generally negative, implying that when adaptive capacity increases vulnerability declines. Additionally, the latter correlation was the highest of all the correlations, indicating that the adaptive capacity index had a stronger impact on the vulnerability index when compared to the sensitivity and the exposure indexes (Table 1).

Table 1.
Pearson Correlations between the Sensitivity (SI), Exposure (EI), Adaptive Capacity (AdCI) Indexes vs the Vulnerability Index (VI) at the National Scale.
4.3. Spatial Variations in Precipitation at the Sub-National Scale in Morocco
Model outputs of the spatial patterns of growing season precipitation based on the MOSAICC simulator of the CANESM model and on the RCP 4.5 and 8.5 scenarios basically reproduced the same spatial variation in precipitation. In fact, it could be observed that there was a tendency for precipitation to increase northwards and to decline towards the south (Figure 2). However, unlike the crop model results below (Figure 8), here the precipitation model reproduced the same spatial pattern of precipitation for both the RCP 4.5 and 8.5 scenarios (Figure 2). Consequently, the RCP 4.5 and 8.5 scenarios based on the CANESM model for the period 1991–2020 equally confirmed an increase in precipitation with increases in latitude (Figure 2). This supports the observation of progressive higher yields when we move from stations in the south towards the north (Figure 9, Figure 10 and Figure 11). The models used here are considered reliable as they reproduced most of the spatial variations in yield, and the error terms of the regression equations are considered valid.
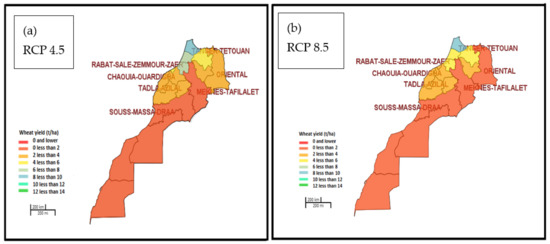

Figure 8.
Spatial distribution of crop yields across Morocco under different scenarios for (a) wheat at RCP 4.5, (b) wheat at RCP 8.5, (c) barley at RCP 4.5, and (d) barley at RCP 8.5.

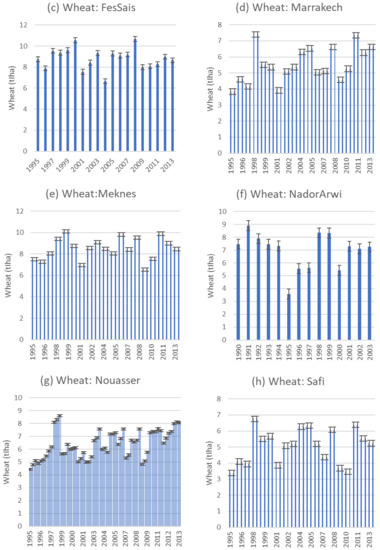
Figure 9.
Variations in wheat yield over time in various stations in Morocco.
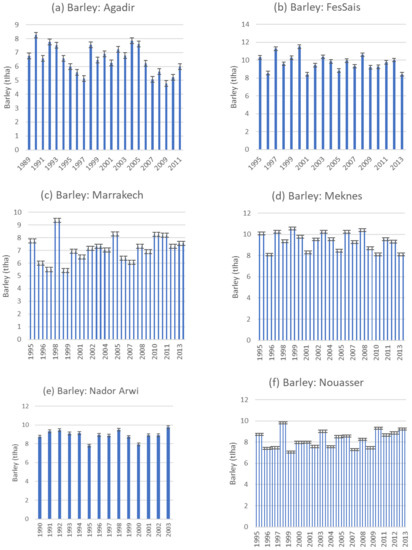
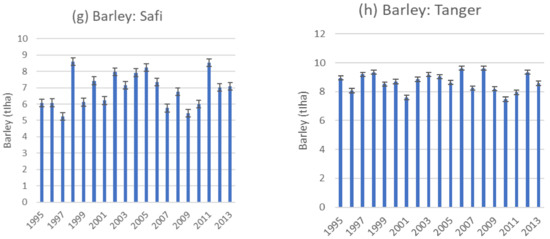
Figure 10.
Variations in barley yield over time at various stations in Morocco.
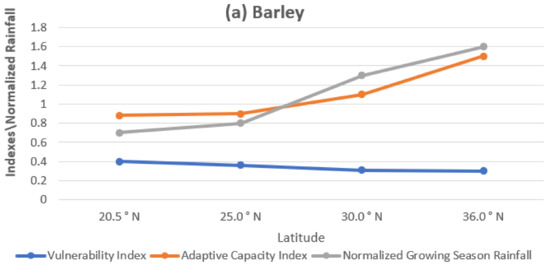
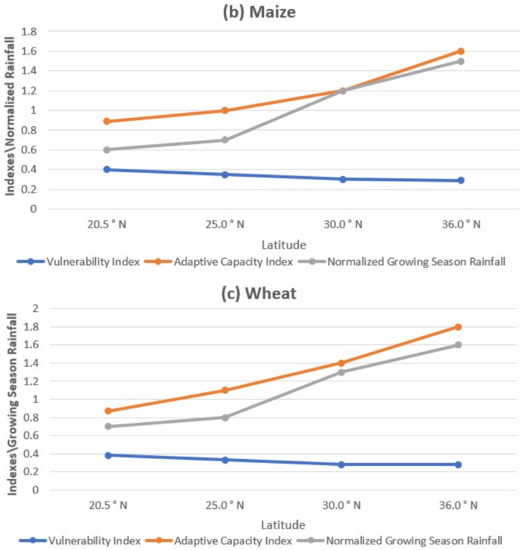
Figure 11.
Spatial/latitudinal variations in vulnerability indexes, adaptive capacity indexes, and normalized rainfall for (a) barley, (b) maize, and (c) wheat in Morocco.
4.4. Spatial Variations in Crop Yield at the Sub-National Scale in Morocco
The validation outputs of the spatial patterns of crop yield based on the MOSAICC simulator of the CANESM model and on the RCP 4.5 and 8.5 scenarios basically reproduced the same spatial variation in the vulnerability of yields, as they showed that there was a tendency for the yields of most crops to increase towards the north of the country (Figure 8). However, while this model reproduced the same spatial pattern for barley at both RCP 4.5 and 8.5, there were slight differences in the case of wheat. For example, under the RCP 4.5 scenario, Rabat–Sale–Zemmour was grey and showed between 6 and less than 8 t/ha of wheat between 1991–2020. However, in the RCP 8.5 scenario, the yields for wheat fell to between 4 and less than 6 t/ha for wheat for the period 1990–2020. Another change was observed for the Oriental region, which recorded between 4 and less than 6 t/ha under RCP 4.5 and dropped to between 0 and less than 2 t/ha for the RCP 8.5 scenario during the period 1990–2020 (Figure 8). This goes to support the observations of progressive higher yields when we moved from stations in the south towards the north (Figure 9 and Figure 10). The models used here are considered reliable as they reproduced most of the spatial variations in yield, and the error terms of the regression equations are considered valid.
4.5. Spatial Variations in Vulnerability Indexes and Adaptive Capacity at the Sub-National Scale in Morocco
At the sub-national scale, the results were consistent with what was obtained at the national scale. For example, wheat showed the lowest vulnerability indexes and the highest adaptive capacity indexes as we moved from one part of the country to another. In Figure 11, it can be observed that the vulnerability indexes for wheat—shown by the blue curve—declined consistently from 0.38, to 0.33, to 0.28, and to 0.28, as we moved from latitudes 20.5 ° N, to 25 ° N, to 30 ° N, and 36 ° N, respectively (Figure 11a–c). This indicates that at the sub-national scale, vulnerability declined as we move northwards in the context of wheat.
Still in the context of wheat, the adaptive capacity increased as we move northwards from 0.87, to 1.1, to 1.4, and to 1.8 for latitudes 20.5 ° N, 25 ° N, 30 ° N, and 36 ° N, respectively. Therefore, while the vulnerability indexes reduced northwards, adaptive capacity increased. In the context of precipitation, it could also be observed that the normalized growing season precipitation increased northwards from 0.7, to 0.8, to 1.3, and to 1.6 for latitudes 20.5 ° N, 25 ° N, 30 ° N, and 36 ° N, respectively. This finding shows that for wheat the growing season increased as we moved northwards (Figure 11c). The observations in the case of wheat show that wheat is generally less vulnerable and more adaptive. Wheat was also associated with higher growing season precipitation. When compared to wheat, barley had the second lowest vulnerability indexes and the second highest adaptive capacity indexes, while maize had the highest vulnerability indexes and the lowest adaptive capacity indexes (Figure 11a). However, all these crops showed a declining vulnerability index and increasing adaptive capacity and normalized growing season precipitation from the south to the north. It is important to underscore the fact that these crops showed decreasing vulnerability and increasing adaptive capacity and normalized growing season precipitation from the south to the north. Additionally, wheat generally showed the best rates for vulnerability, adaptive capacity, and normalized growing season precipitation among all the crops. At each latitude, wheat showed the lowest vulnerability index, the highest adaptive capacity index, and the highest levels of normalized growing season precipitation; barley was second and maize showed the least. The results obtained at the sub-national scale were consistent with those at the national scale but went a step further to improve our understanding of the spatial and sub-national variations in vulnerability, adaptive capacity, and normalized growing season precipitation. Again, the correlation between the adaptive capacity index and the vulnerability index at the sub-national scale/latitudes was negative for all three crops and was the highest when compared to the other correlation outcomes (Table 2). This further shows that just as with the national scale correlations, adaptive capacity is a stronger driver of vulnerability relative to the other indexes.
Table 2.
Pearson Correlations between the Sensitivity (SI), Exposure (EI), Adaptive Capacity (AdCI) Indexes vs the Vulnerability Index (VI) at the Sub-national Scale.
The spatial variations described above can be confirmed by the actual spatial variations in wheat and barley yield for various stations across Morocco. These observations showed increasing yields for both wheat and barley from stations in the south to the north (Figure 9 and Figure 10)—a phenomenon that was closely knit to variations in rainfall and, consequently, vulnerability and adaptive capacity. This is seen as the areas of low yield in the south are more exposed to the Sahara and are host to some of the poorest and least educated populations in Morocco.
5. Discussion
The approach employed in this work follows the AR4 classification of vulnerability (where vulnerability is a function of sensitivity, exposure, and adaptive capacity), while future developments and updates of this work may follow the terminology in AR5 and include risk (hazard, exposure, and vulnerability). The above results show that maize has the highest vulnerability index and the lowest adaptive capacity index compared to both wheat and barley nationally and sub-nationally; this is also justified by the relatively low mean growing season precipitation recorded for maize at both scales. When rainfall during the growing season decreases, the humidity of the soil obtained from rainwater vegetation decreases, and water pressure occurs, which results in a drop in crop yield. Other research has looked at the effects of climate change on the growth season of various crops, such as crop shortening and early ripening [60,61,62,63]. For example, Karim et al. [64] detailed that the reduction in yield was proportional to the lengthening of the growth period due to extended periods of high temperatures. In West Africa, growing season precipitation also impacts crop yields [64,65]. Various yield responses have been attributed to changes in growing season rainfall months. Wheat yields in Morocco were the lowest in 1999 due to poor rainfall throughout the growing season [66]. Specifically, the timing of rainfall and its distribution are both important factors in differentiating between a good and a bad year. Below-average rainfall corresponds to an excellent crop year if the timing is good, and if it is well distributed throughout the crop growing season. The low correlation and R2 between yield and rainfall recorded in this study shows that cereal yields can be associated with different elements that were not taken into consideration in our study, consisting of irrigation, fertilization, soil qualities, pests, and different components of management [41].
In terms of cereal production, wheat, barley, and maize are among the grains produced and imported by North African nations. While Egypt is by far the most important manufacturer and importer, Morocco has the best cereal production according to capita manufacturing of wheat [67]. In sub-Saharan Africa, the average consumption of wheat is about 30 kg/capita/year, which is less than the 200 kg/capita/year recorded in North Africa [68]. Many variables can account for this—particularly in Eastern Africa’s highlands—including the high frequency of diseases and the spread of pests, as well as the pre-harvest sprouting in Ethiopia that deteriorates the quality of wheat [67]. While Maize is the staple and most common cereal in sub–Saharan Africa, in Morocco maize production has been shrinking since the 1960s. The decline in maize and barley yields is explained by the fact that these crops have been pushed back by wheat to less fertile plots [69]. This further explains why these crops are more vulnerable. Furthermore, some production elements suffer losses in their returns because of adverse weather. Among the various types of rainfed fields, those in Morocco’s intermediate zone have been the most damaged. Additionally, maize production areas have been hardest hit [70].
In Morocco, droughts during the growing season of maize have also increased the vulnerability of the crop [71]. It has been forecasted that warming paired with a decrease or modest increase in rainfall will cause maize yields to decline [71]. The maize growing season has seen larger warming trends in most northern African countries; this is especially noticeable in Morocco, where average temperature patterns have increased by more than 0.3 °C every decade. To further support this view, Shi [72] showed that yield instability is yet another indicator of how vulnerable agriculture is to climate change across Africa. The study found that some countries, including Morocco and Sudan, had high instability, with huge impacts on mean temperature trends. This means that in these nations, a little variation in average growing season precipitation can result in a significant difference in maize yields. For these reasons, determining seasonal drought danger is critical for growers in selecting appropriate crop species and planting dates, as well as for decision makers in deciding whether to import grains to satisfy local demands [73,74].
In addition, this study has shown that the less vulnerable people are, the more adaptive they are. Fluctuations in the adaptive capacity index are associated with fluctuations in the level of poverty and literacy rates. This means that high levels of poverty are often correlated with low levels of literacy. Even though the study carried out by Epule [75] showed that the north of Africa has the weakest poverty rates and the highest literacy rate compared to the rest of Africa, it appears that Morocco has the lowest per capital income and a relatively higher Gini index (statistic that assesses how evenly a resource is allocated in a population, using income as an example) in North Africa [74]. The distribution of income is the most unequal in north Africa [67], and this explains why low-income farmers usually do not have access to modern agricultural equipment and planting materials, or better access to high-yielding varieties, pesticides, irrigation systems, and fertilizers, which serve as obstacles that limit their ability to adapt [39]—even though nearly half of Morocco’s workforce is hired inside the agricultural sector [25]. Therefore, the high vulnerability indexes recorded in the southern parts of the country are linked to a lower adaptive capacity that is reflected in higher levels of poverty and lower literacy rates. The high vulnerability index is also associated with relatively lower growing season rainfall as you move southwards in Morocco. While this work only examines the role of rainfall, literacy, and poverty rates in impacting vulnerability, it is important to state that other potential drivers might exist such as irrigation, fertilization, pests, and diseases, among others.
These findings are also in line with those of previous African investigations. For instance, in Cameroon, southern maize was found to have a lower vulnerability index and a higher adaptive capacity index, whereas the northern maize had a vulnerability index that was higher, and a lower adaptive capacity index [21]. However, the current study in Morocco indicated geographical differences in vulnerability; wheat, barley, and maize showed highest vulnerability in the southern region, while the lowest was observed in the north—this can be explained by the fact that the timing of crop planting and locations are affected by rainfall, which is lower in the south of Morocco and increases northwards. Cereal crops, especially wheat, are often cropped continuously in the most suitable part of the north of the country, whereas in 250–400 mm rainfall areas, farmers alternate grain with corn, legumes, and other crops. In addition, maize is produced as a fodder crop and as a weed control crop after the land has been farmed multiple times [76]. On the other hand, the adaptive capacity increases northwards [77], indicating that in the southern parts of the country (urban and rural areas), there are higher rates of poverty and lower literacy rates because of the presence of nomadic populations in the south. Contrary to Morocco, another study conducted on the vulnerability of Uganda’s maize production noted that the vulnerability of maize yield was higher in the north the country than in the south. Similar observations were made for adaptive capacity, which showed higher trends in the south and lower trends in the north of Uganda [20]. Furthermore, following the distribution of annual precipitation across Morocco’s major regions for the period 1970–2001, it was observed that normalized rainfall increased northwards, from 30 mm in Dakhla (South) to 700 mm in Tangier (North) [22]. In sub-Saharan Africa (Uganda, Cameroon, etc.) the reverse has been observed, with declining precipitation with every northward move due to climate, soil, and other socio-economic factors.
In Morocco, the so-called favorable zones, and intermediate zones—where the amount of precipitation ranges from 350 mm to 450 mm—account for an average of 38% of the sown area of cereals, with a predominance of soft and durum wheat. Agricultural practices in these areas are aimed at intensification, which makes it possible to produce nearly 60% of cereal production (average 1998–2003). The areas considered unfavorable contribute a little over 40% of the cereal area, which is mainly sown with barley in a traditional cultivation system characterized by minimal use of selected seeds, fertilizers, and pesticides. Production in these areas is about 30% of the country’s total production of cereal crops. The remaining areas are in the mountains and the Sahara, which account for 10% of the annual cereal production [78]. The increase in common wheat production is essentially due to the extension of areas stimulated by the intensification policies implemented since the early 1980s. An intensification program was set up by the Ministry of Agriculture in 1985, aimed at planting one million hectares. The expansion of the surface area seems to be mainly at the expense of barley, which is increasingly grown in marginal areas with low agronomic potential [78], paired with the population’s lower potential for identifying alternative solutions to climatic limitations in these locations, owing to poverty and restricted access to information—as evidenced by poverty and literacy indicators. This explains why certain recent advances, such as peripheral agriculture areas and the growth of wheat instead of barley, are projected to enhance Morocco’s agriculture sector’s vulnerability to climate change [25,69,79].
Besides this, the vulnerability of crops to climate change is closely associated with poverty and literacy rates [80,81]. In fact, poverty restricts access to resources by denying impoverished people access to agricultural supplies such as drought-tolerant crops with high yields, fertilizers, and irrigation infrastructure. Additionally, information dissemination is a key concern; people with lower levels of education are less likely to comprehend climate-related information and put climate-smart concepts into practice [79,82,83,84,85]. Such disparities in literacy and poverty rates are often remarkable in Africa in general and spatially in Morocco, which makes them particularly highly representative proxies of adaptive capacity [86,87]. However, this study has provided for the first time in Morocco an all-encompassing approach by merging rainfall and socio-economic factors and introducing the three components of vulnerability, opening the door to further studies investigating other climatic and non-climatic variables such as temperature, soils, pests, and diseases affecting crops, high-yielding varieties, and fertilizers to assess the vulnerability of cereal crops in Morocco.
6. Conclusions
This work has shown that at both the national and sub-national scale, wheat is the least vulnerable and most adaptive crop in Morocco because of the expansion of regions prompted by intensification policies and the fact that local farmers of the concerned regions were given better advice and had more understanding about wheat cultivation. Wheat also showed the highest adaptive capacity and normalized growing season precipitation. Spatially, as we move from the south to the north, the vulnerability of wheat, barley, and maize declined, while adaptive capacity and normalized growing season precipitation increased. It is now important to verify how other crops respond to this observed spatial variation in vulnerability, adaptive capacity, and normalized growing season precipitation. It should be noted, however, that the adaptive capacity index of this work is based on the use of proxies such as literacy and poverty rates, for which numerous proxies exist; however, in Africa in general and Morocco in particular, these proxies are very representative and cut across other proxies. Additionally, being that the three crops covered by this work are amongst the most cultivated and consumed in Morocco, it becomes important to further evaluate how these results can inform agricultural policy and adaptation actions. An index of this type might also serve as a forum for numerous actors (civil society, business sector, and governmental sector) to analyze their level of engagement and performance in adapting to climate change. In fact, this will not be sufficient if projections of future trends and the effects of different temperature-change scenarios such as 1.5°, 2°, and 2.5° C on the future yields of these crops are not considered. Creating scenarios and evaluating the consequences of the coming change in temperature might be a useful tool for assessing and forecasting future risk. It could be also important to investigate the drivers of arable production in general in Morocco, as well as to perform a systematic inquiry to verify the current state of vulnerability research in Morocco in terms of models, data inputs, and keys crops, and the results that dominate such studies.
Author Contributions
Conceptualization, T.E.E.; methodology, S.A. and T.E.E.; validation, S.A., T.E.E.; formal analysis, S.A.; investigation, S.A.; resources, T.E.E.; data curation, S.A. and T.E.E.; writing—original draft preparation, S.A. and T.E.E.; writing—review and editing, D.D., S.A., S.E.-R. and A.C.; supervision, T.E.E., D.D., S.E.-R. and A.C.; project administration, T.E.E.; funding acquisition, T.E.E. All authors have read and agreed to the published version of the manuscript.
Funding
This research and the APC fees were funded by the Pan Moroccan Yield and Precipitation Gaps Project (PAMCPP), awarded to T.E.E. at Mohammed VI Polytechnic University in 2021.
Institutional Review Board Statement
Not applicable.
Informed Consent Statement
Not applicable.
Data Availability Statement
Data available on request.
Acknowledgments
The authors would like to thank all partners who provided the data and all the authors whose works have been cited.
Conflicts of Interest
The authors declare no conflict of interest.
References
- Pachauri, R.K.; Meyer, L. Changements Climatiques 2014—Rapport de Synthèse Publié Sous la Direction de L’équipe de Rédaction Principale Rapport de Synthèse GIEC Équipe de Rédaction Principale; GEIC: Geneva, Switzerland, 2014. (In French) [Google Scholar]
- Balaghi, R.; Jlibene, M.; Tychon, B.; Eerens, H. Agrometeorological Cereal Yield Forecasting in Morocco; INRA: Rabat, Marocco, 2013; Volume 26. [Google Scholar]
- Boko, C.; Kpodekon, T.; Dahouda, M.; Marlier, D.; Mainil, J. Contraintes techniques et sanitaires de la production traditionnelle de pintade en Afrique subsaharienne. Ann. Méd. Vét. 2012, 156, 25–36. (In French) [Google Scholar]
- Vanlauwe, B.; AbdelGadir, A.H.; Adewopo, J.; Adjei-Nsiah, S.; Ampadu-Boakye, T.; Asare, R.; Baijukya, F.; Baars, E.; Bekunda, M.; Coyne, D.; et al. Looking back and moving forward: 50 years of soil and soil fertility management research in sub-Saharan Africa. Int. J. Agric. Sustain. 2017, 15, 613–631. [Google Scholar] [CrossRef] [PubMed] [Green Version]
- Karmaoui, A. Climate Change and Its Impact on Ecosystem Services and Biodiversity in Arid and Semi-Arid Zones View Project Decision Support Methods for Assessing Flood Risk and Vulnerability View Project; Engineering Science Reference: Hershey, PA, USA, 2019; ISBN 97815-225-73876. [Google Scholar]
- Weischet, W.; Endlicher, W. Die Alte Welt: Europa, Afrika, Asien; Teubner Verlag: Berlin, Germany, 2000. (In German) [Google Scholar]
- Lionello, P.; Malanotte-Rizzoli, P.; Boscolo, R.; Alpert, P.; Artale, V.; Li, L.; Luterbacher, J.; May, W.; Trigo, R.; Tsimplis, M.; et al. The Mediterranean climate: An overview of the main characteristics and issues. Dev. Earth Environ. Sci. 2006, 4, 1–26. [Google Scholar] [CrossRef]
- Cherif, S.E.; Chourak, M.; Abed, M.; Pujades, L. Seismic risk in the city of Al Hoceima (North of Morocco) using the vulnerability index method, applied in Risk-UE project. Nat. Hazards 2017, 85, 329–347. [Google Scholar] [CrossRef]
- GIZ CLIMATE EXPERT: Morocco. Available online: http://www.climate-expert.org/en/home/business-adaptation/morocco/ (accessed on 31 October 2021).
- Paeth, H.; Born, K.; Girmes, R.; Podzun, R.; Jacob, D. Regional climate change in tropical and Northern Africa due to greenhouse forcing and land use changes. J. Clim. 2009, 22, 114–132. [Google Scholar] [CrossRef] [Green Version]
- Ouhamdouch, S.; Bahir, M. Climate change impact on future rainfall and temperature in semi-arid areas (Essaouira Basin, Morocco). Environ. Processes 2017, 4, 975–990. [Google Scholar] [CrossRef]
- Zkhiri, W.; Tramblay, Y.; Hanich, L.; Jarlan, L.; Ruelland, D. Spatiotemporal characterization of current and future droughts in the High Atlas basins (Morocco). Theor. Appl. Climatol. 2019, 135, 593–605. [Google Scholar] [CrossRef]
- Tuel, A.; Eltahir, E.A.B. Why Is the Mediterranean a Climate Change Hot Spot? J. Clim. 2020, 33, 5829–5843. [Google Scholar] [CrossRef]
- Kholoud, K.; Denis, S.; Lahouari, B.; El Hidan, M.A.; Souad, B. Management of Leishmaniases in the Era of Climate Change in Morocco. Int. J. Environ. Res. Public Health 2018, 15, 1542. [Google Scholar] [CrossRef] [Green Version]
- Benabdelouahab, T.; Balaghi, R.; Hadria, R.; Lionboui, H.; Minet, J.; Tychon, B. Monitoring surface water content using visible and short-wave infrared SPOT-5 data of wheat plots in irrigated semi-arid regions. Int. J. Remote Sens. 2015, 36, 4018–4036. [Google Scholar] [CrossRef]
- Chbika, S.; Aouane, E.M. The adoption of sustainable development indicators in agricultural practices in the Gharb region (Morocco). E3S Web Conf. 2021, 234, 00098. [Google Scholar] [CrossRef]
- Sara, S.; El, M.; El Moutaouakil, A. Study on the Spread of Procambarus clarkii at Gharb (Morocco) and Its Impact on Rice Growing. J. Agric. Sci. Technol. A 2019, 9, 81–92. [Google Scholar] [CrossRef]
- Ministère Délègue Auprès Du Ministre De L’énergie, Des Mines, De L’eau Et De L’environnement, Chargé De L’environnement (MDENV). Chapitre I: Les Changements Climatiques au Maroc; MDENV: Rabat, Marocco, 2014; pp. 15–30. (In French) [Google Scholar]
- Bishaw, Z.; Yigezu, Y.A.; Niane, A.; Telleria, R.J.; Najjar, D. Political Economy of the Wheat Sector in Morocco: Seed Systems, Varietal Adoption, and Impacts; ICARDA: Beirut, Lebanon, 2019; ISBN 97892912-75168. [Google Scholar]
- Epule, T.E.; Ford, J.D.; Lwasa, S.; Lepage, L. Vulnerability of maize yields to droughts in Uganda. Water 2017, 9, 181. [Google Scholar] [CrossRef] [Green Version]
- Epule, T.E.; Chehbouni, A.; Dhiba, D.; Etongo, D.; Driouech, F.; Brouziyne, Y.; Peng, C. Vulnerability of maize, millet, and rice yields to growing season precipitation and socioeconomic proxies in Cameroon. PLoS ONE 2021, 16, e0252335. [Google Scholar] [CrossRef] [PubMed]
- Ouassou, A.; Ameziane, T.; Ziyad, A.; Belghiti, M. Chapter 19. Application of the Drought Management Guidelines in Morocco. Options Méditerr. Ser. B 2007, 58, 343–372. [Google Scholar]
- Imani, Y.; Lahlou, O.; Bennasser Alaoui, S.; Naumann, G.; Barbosa, P.; Vogt, J.; Imani, Y.; Lahlou, O.; Bennasser Alaoui, S.; Naumann, G.; et al. Drought vulnerability assesssment and mapping in Morocco. Eguga 2014, 16, 276. [Google Scholar]
- Fniguire, F.; Laftouhi, N.-E.; Saidi, M.E.; Zamrane, Z.; El Himer, H.; Khalil, N. Spatial and temporal analysis of the drought vulnerability and risks over eight decades in a semi-arid region (Tensift basin: Morocco). Theor. Appl. Climatol. 2016, 130, 321–330. [Google Scholar] [CrossRef]
- Schilling, J.; Freier, K.P.; Hertig, E.; Scheffran, J. Climate change, vulnerability and adaptation in North Africa with focus on Morocco. Agric. Ecosyst. Environ. 2012, 156, 12–26. [Google Scholar] [CrossRef]
- Burke, M.B.; Miguel, E.; Satyanath, S.; Dykema, J.A.; Lobell, D.B. Warming increases the risk of civil war in Africa. Proc. Natl. Acad. Sci. USA 2009, 106, 20670–20674. [Google Scholar] [CrossRef] [Green Version]
- Luers, A.L.; Lobell, D.B.; Sklar, L.S.; Lee Addams, C.; Matson, P.A. A method for quantifying vulnerability, applied to the agricultural system of the Yaqui Valley, Mexico. Glob. Environ. Chang. 2003, 13, 255–267. [Google Scholar] [CrossRef]
- Frascari, D.; Zanaroli, G.; Motaleb, M.A.; Annen, G.; Belguith, K.; Borin, S.; Choukr-Allah, R.; Gibert, C.; Jaouani, A.; Kalogerakis, N.; et al. Integrated technological and management solutions for wastewater treatment and efficient agricultural reuse in Egypt, Morocco, and Tunisia. Integr. Environ. Assess. Manag. 2018, 14, 447–462. [Google Scholar] [CrossRef] [PubMed]
- IPCC. Climate Change Impacts, Adaptation, and Vulnerability Part A: Global and Sectoral Aspects Working Group II Contribution to the Fifth Assessment Report of the Intergovernmental Panel on Climate Change; Field, C.B., Barros, V.R., Dokken, D.J., Mach, K.J., Mastrandrea, M.D., Bilir, T.E., Chatterjee, M., Yuka, K.L.E., Estrada, O., Genova, R.C., Eds.; Cambridge University Press: Cambridge, UK; New York, NY, USA, 2014. [Google Scholar]
- GIZ; EURAC. Risk Supplement to the Vulnerability Sourcebook. Guidance on How to Apply the Vulnerability Sourcebook’s Approach with the New IPCC AR5 Concept of Climate Risk; GIZ: Bonn, Germany, 2017. [Google Scholar]
- Lemos, M.C.; Boyd, E.; Tompkins, E.L.; Osbahr, H.; Liverman, D. Developing adaptation and adapting development. Ecol. Soc. 2007, 12. [Google Scholar] [CrossRef] [Green Version]
- Climate Change 2007: The Physical Science Basis: Intergovernmental Panel on Climate Change, Intergovernmental Panel on Climate Change. Working Group I. Available online: http://books.google.co.uk/books?hl=en&lr=&id=8-m8nXB8GB4C&oi=fnd&pg=PA339&dq=ipcc+2007+science&ots=hyfvA6tcM0&sig=Hz9i-XuhWs42WsedvN903LOvLZQ#v=onepage&q=ipcc2007science&f=false (accessed on 31 October 2021).
- Moss, R.H.; Edmonds, J.A.; Hibbard, K.A.; Manning, M.R.; Rose, S.K.; Van Vuuren, D.P.; Carter, T.R.; Emori, S.; Kainuma, M.; Kram, T.; et al. The next generation of scenarios for climate change research and assessment. Nature 2010, 463, 747–756. [Google Scholar] [CrossRef] [PubMed]
- Sharma, J.; Ravindranath, N.H. Applying IPCC 2014 framework for hazard-specific vulnerability assessment under climate change. Environ. Res. Commun. 2019, 1, 051004. [Google Scholar] [CrossRef]
- Sherman, M.; Ford, J.; Llanos-Cuentas, A.; Valdivia, M.J. Food system vulnerability amidst the extreme 2010–2011 flooding in the Peruvian Amazon: A case study from the Ucayali region. Food Secur. 2016, 8, 551–570. [Google Scholar] [CrossRef]
- Ford, J.D.; McDowell, G.; Shirley, J.; Pitre, M.; Siewierski, R.; Gough, W.; Duerden, F.; Pearce, T.; Adams, P.; Statham, S. The Dynamic Multiscale Nature of Climate Change Vulnerability: An Inuit Harvesting Example. Ann. Assoc. Am. Geogr. 2013, 103, 1193–1211. [Google Scholar] [CrossRef]
- Ford, J.D.; Keskitalo, E.C.H.; Smith, T.; Pearce, T.; Berrang-Ford, L.; Duerden, F.; Smit, B. Case study and analogue methodologies in climate change vulnerability research. Wiley Interdiscip. Rev. Clim. Chang. 2010, 1, 374–392. [Google Scholar] [CrossRef]
- O’Brien, K.; Eriksen, S.E.H.; Schjolden, A.; Nygaard, L.P. What’s in a Word? Conflicting Interpretations of Vulnerability in Climate Change Research; CICERO: Oslo, Norway, 2004. [Google Scholar]
- Ford, J.D.; Smit, B. A framework for assessing the vulnerability of communities in the Canadian Arctic to risks associated with climate change. Arctic 2004, 57, 389–400. [Google Scholar] [CrossRef]
- Epule, T.E.; New, M.G. Vulnerability of crop yields to variations in growing season precipitation in Uganda. SN Appl. Sci. 2019, 1, 899. [Google Scholar] [CrossRef] [Green Version]
- Knippertz, P.; Christoph, M.; Speth, P. Long-term precipitation variability in Morocco and the link to the large-scale circulation in recent and future climates. Meteorol. Atmos. Phys. 2003, 83, 67–88. [Google Scholar] [CrossRef]
- Bouras, E.H.; Jarlan, L.; Er-Raki, S.; Balaghi, R.; Amazirh, A.; Richard, B.; Khabba, S. Cereal yield forecasting with satellite drought-based indices, weather data and regional climate indices using machine learning in morocco. Remote Sens. 2021, 13, 3101. [Google Scholar] [CrossRef]
- Driouech, F.; Déqué, M.; Mokssit, A. Numerical simulation of the probability distribution function of precipitation over Morocco. Clim. Dyn. 2009, 32, 1055–1063. [Google Scholar] [CrossRef]
- Louali, A. Etudes Le Secteur Agricole Marocain: Tendances Structurelles, Enjeux et Perspectives de Développement; DEPF: Rabat, Marocco, 2019. (In French) [Google Scholar]
- Bouras, E.; Jarlan, L.; Khabba, S.; Er-Raki, S.; Dezetter, A.; Sghir, F.; Tramblay, Y. Assessing the impact of global climate changes on irrigated wheat yields and water requirements in a semi-arid environment of Morocco. Sci. Rep. 2019, 9, 19142. [Google Scholar] [CrossRef] [PubMed]
- FAOSTAT. Available online: https://www.fao.org/faostat/en/#home (accessed on 31 October 2021).
- GYGA. Available online: https://www.yieldgap.org/gygaserver/download?downloadurl=/gygamaps/excel/GygaMorocco.xlsx (accessed on 3 November 2021).
- World Bank Climate Change Knowledge Portal, Ghana Vulnerability. Available online: https://climateknowledgeportal.worldbank.org/country/ghana/vulnerability (accessed on 31 October 2021).
- Figshare. Available online: https://figshare.com/articles/dataset/Readiness_Index_for_Climate_Change_Adaptation_Database_for_Africa/16903483/1 (accessed on 31 October 2021).
- Yassine, M. Regional Disparities in Development in Morocco: Statistical Analyses Using Dispersion Indicators and Multidimensional Techniques; MPRA: Munich, Germany, 2019. [Google Scholar]
- University of Notre Dame Global Adaptation Index Country Index Technical Report. Available online: https://www.researchgate.net/publication/318431802_University_of_Notre_Dame_Global_Adaptation_Index_Country_Index_Technical_Report (accessed on 31 October 2021).
- Simelton, E.; Fraser, E.D.G.; Termansen, M.; Forster, P.M.; Dougill, A.J. Typologies of crop-drought vulnerability: An empirical analysis of the socio-economic factors that influence the sensitivity and resilience to drought of three major food crops in China (1961–2001). Environ. Sci. Policy 2009, 12, 438–452. [Google Scholar] [CrossRef]
- Sullivan, C. Calculating a Water Poverty Index. World Dev. 2002, 30, 1195–1210. [Google Scholar] [CrossRef]
- Eriksen, S.H.; Kelly, P.M. Developing credible vulnerability indicators for climate adaptation policy assessment. Mitig. Adapt. Strateg. Glob. Chang. 2007, 12, 495–524. [Google Scholar] [CrossRef]
- Lobell, D.B.; Cahill, K.N.; Field, C.B. Historical effects of temperature and precipitation on California crop yields. Clim. Chang. 2007, 81, 187–203. [Google Scholar] [CrossRef]
- Easterling, W.; Chen, X.; Hays, C.; Brandle, J.; Zhang, H. Improving the validation of model-simulated crop yield response to climate change: An application to the EPIC model. Clim. Res. 1996, 06, 263–273. [Google Scholar] [CrossRef]
- Antwi-Agyei, P.; Fraser, E.D.G.; Dougill, A.J.; Stringer, L.C.; Simelton, E. Mapping the vulnerability of crop production to drought in Ghana using rainfall, yield and socioeconomic data. Appl. Geogr. 2012, 32, 324–334. [Google Scholar] [CrossRef]
- Sivakumar, M.V.K.; Das, H.P.; Brunini, O. Impacts of Present and Future Climate Variability and Change on Agriculture and Forestry in the Arid and Semi-Arid Tropics. Clim. Chang. 2005, 70, 31–72. [Google Scholar] [CrossRef]
- Eriksen, S.H.; O’BRIEN, K. Vulnerability, poverty and the need for sustainable adaptation measures. Clim. Policy 2007, 7, 337–352. [Google Scholar] [CrossRef]
- MOSAICC. Simulator. 2021. Available online: http://196.200.148.123/mosaicc/ (accessed on 3 November 2021).
- Brown, R.A.; Rosenberg, N.J. Climate Change Impacts on the Potential Productivity of Corn and Winter Wheat in Their Primary United States Growing Regions. Clim. Chang. 1999, 41, 73–107. [Google Scholar] [CrossRef]
- Chmielewski, F.-M.; Müller, A.; Bruns, E. Climate changes and trends in phenology of fruit trees and field crops in Germany, 1961–2000. Agric. For. Meteorol. 2004, 121, 69–78. [Google Scholar] [CrossRef]
- Schwartz, M.D.; Ahas, R.; Aasa, A. Onset of spring starting earlier across the Northern Hemisphere. Glob. Chang. Biol. 2006, 12, 343–351. [Google Scholar] [CrossRef]
- Karim, M.R.; Ishikawa, M.; Ikeda, M.; Islam, M.T. Climate change model predicts 33% rice yield decrease in 2100 in Bangladesh. Agron. Sustain. Dev. 2012, 32, 821–830. [Google Scholar] [CrossRef] [Green Version]
- Roudier, P.; Sultan, B.; Quirion, P.; Berg, A. The impact of future climate change on West African crop yields: What does the recent literature say? Glob. Environ. Chang. 2011, 21, 1073–1083. [Google Scholar] [CrossRef] [Green Version]
- Rowhani, P.; Lobell, D.B.; Linderman, M.; Ramankutty, N. Climate variability and crop production in Tanzania. Agric. For. Meteorol. 2011, 151, 449–460. [Google Scholar] [CrossRef]
- Mrabet, R. Differential response of wheat to tillage management systems in a semiarid area of Morocco. Field Crop. Res. 2000, 66, 165–174. [Google Scholar] [CrossRef]
- Schilling, J.; Hertig, E.; Tramblay, Y.; Scheffran, J. Climate change vulnerability, water resources and social implications in North Africa. Reg. Environ. Chang. 2020, 20, 15. [Google Scholar] [CrossRef] [Green Version]
- Tadesse, W.; Bishaw, Z.; Assefa, S. Wheat production and breeding in Sub-Saharan Africa: Challenges and opportunities in the face of climate change. Int. J. Clim. Chang. Strateg. Manag. 2019, 11, 696–715. [Google Scholar] [CrossRef] [Green Version]
- Joshi, A.K.; Azab, M.; Mosaad, M.; Moselhy, M.; Osmanzai, M.; Gelalcha, S.; Bedada, G.; Bhatta, M.R.; Hakim, A.; Malaker, P.K.; et al. Delivering rust resistant wheat to farmers: A step towards increased food security. Euphytica 2011, 179, 187–196. [Google Scholar] [CrossRef]
- Karaky, R.H. Climate Variability and Agricultural Policy Reform in Morocco. Ph.D. Thesis, Purdue University, West Lafayette, IN, USA, 2004. [Google Scholar]
- Shi, W.; Tao, F. Vulnerability of African maize yield to climate change and variability during 1961–2010. Food Secur. 2014, 6, 471–481. [Google Scholar] [CrossRef]
- Ahmed, K.F.; Wang, G.; Yu, M.; Koo, J.; You, L. Potential impact of climate change on cereal crop yield in West Africa. Clim. Chang. 2015, 133, 321–334. [Google Scholar] [CrossRef]
- Mougou, R.; Mansour, M.; Iglesias, A.; Chebbi, R.Z.; Battaglini, A. Climate change and agricultural vulnerability: A case study of rain-fed wheat in Kairouan, Central Tunisia. Reg. Environ. Chang. 2011, 11, 137–142. [Google Scholar] [CrossRef] [Green Version]
- Epule, T.E.; Chehbouni, A.; Dhiba, D.; Moto, M.W. The Readiness Index for Climate Change Adaptation in Africa: The Role of Climate and Adaptive Capacity Proxies. Appl. Sci. 2021, 11, 9413. [Google Scholar] [CrossRef]
- Shroyer, J.P.; Ryan, J.; Monem, M.A.; El Mourid, M. Production of fall-planted cereals in Morocco and technology for its improvement. J. Agron. Educ. 1990, 19, 32–40. [Google Scholar] [CrossRef]
- Poverty, T.; Application, M. The Poverty Mapping Application in Morocco; Pennsylvania State University: Pennsylvania, PA, USA, 2002; pp. 208–224. [Google Scholar]
- CIEHAM. Les Politiques Céréalières au Maroc Akka Aït El Mekki; CIEHAM: Rabat, Marocco, 2006. (In French) [Google Scholar]
- Rakodi, C. A capital assets framework for analysing household livelihood strategies: Implications for policy. Dev. Policy Rev. 1999, 17, 315–342. [Google Scholar] [CrossRef]
- Abeygunawardena, P.; Vyas, Y.; Knill, P.; Foy, T.; Harrold, M.; Steele, P.; Tanner, T.; Hirsch, D.; Oosterman, M.; Rooimans, J.; et al. Poverty and Climate Change: Reducing the Vulnerability of the Poor through Adaptation; The World Bank: Washington, DC, USA, 2009; pp. 1–43. [Google Scholar]
- Burton, I.; Huq, S.; Lim, B.; Pilifosova, O.; Schipper, E.L. From impacts assessment to adaptation priorities: The shaping of adaptation policy. Clim. Policy 2002, 2, 145–159. [Google Scholar] [CrossRef] [Green Version]
- Ait-El-Mokhtar, M.; Boutasknit, A.; Ben-Laouane, R.; Anli, M.; El Amerany, F.; Toubali, S.; Lahbouki, S.; Wahbi, S.; Meddich, A. Vulnerability of Oasis Agriculture to Climate Change in Morocco. In Research Anthology on Environmental and Societal Impacts of Climate Change; IGI Global: Hershey, PV, USA, 2022; pp. 1195–1219. [Google Scholar]
- Verner, D.; Treguer, D.; Redwood, J.; Christensen, J.; McDonnell, R.; Elbert, C.; Yasuo, K.; Belghazi, S. Climate Variability, Drought, and Drought Management in Morocco’s Agricultural Sector; The World Bank: Washington, DC, USA, 2018. [Google Scholar]
- Brouziyne, Y.; Abouabdillah, A.; Chehbouni, A.; Hanich, L.; Bergaoui, K.; McDonnell, R.; Benaabidate, L. Assessing hydrological vulnerability to future droughts in a Mediterranean watershed: Combined indices-based and distributed modeling approaches. Water 2018, 12, 2333. [Google Scholar] [CrossRef]
- Benabderrazik, K.; Kopainsky, B.; Tazi, L.; Joerin, J.; Six, J. Agricultural intensification can no longer ignore water conservation–A systemic modelling approach to the case of tomato producers in Morocco. Agric. Water Manag. 2021, 256, 107082. [Google Scholar] [CrossRef]
- Karmaoui, A.; El Jaafari, S.; Chaachouay, H.; Hajji, L. The socio-ecological system of the pre-Sahara zone of Morocco: A conceptual framework to analyse the impact of drought and desertification. GeoJournal 2021, 1, 114. [Google Scholar] [CrossRef]
- Swart, J.; Leal Filho, W.; Azul, A.M.; Brandli, L.; Lange Salvia, A.; Özuyar, P.G.; Wall, T. Gini Index: Conceiving Inequality in One Single Number; Springer: Berlin/Heidelberg, Germany, 2020. [Google Scholar]
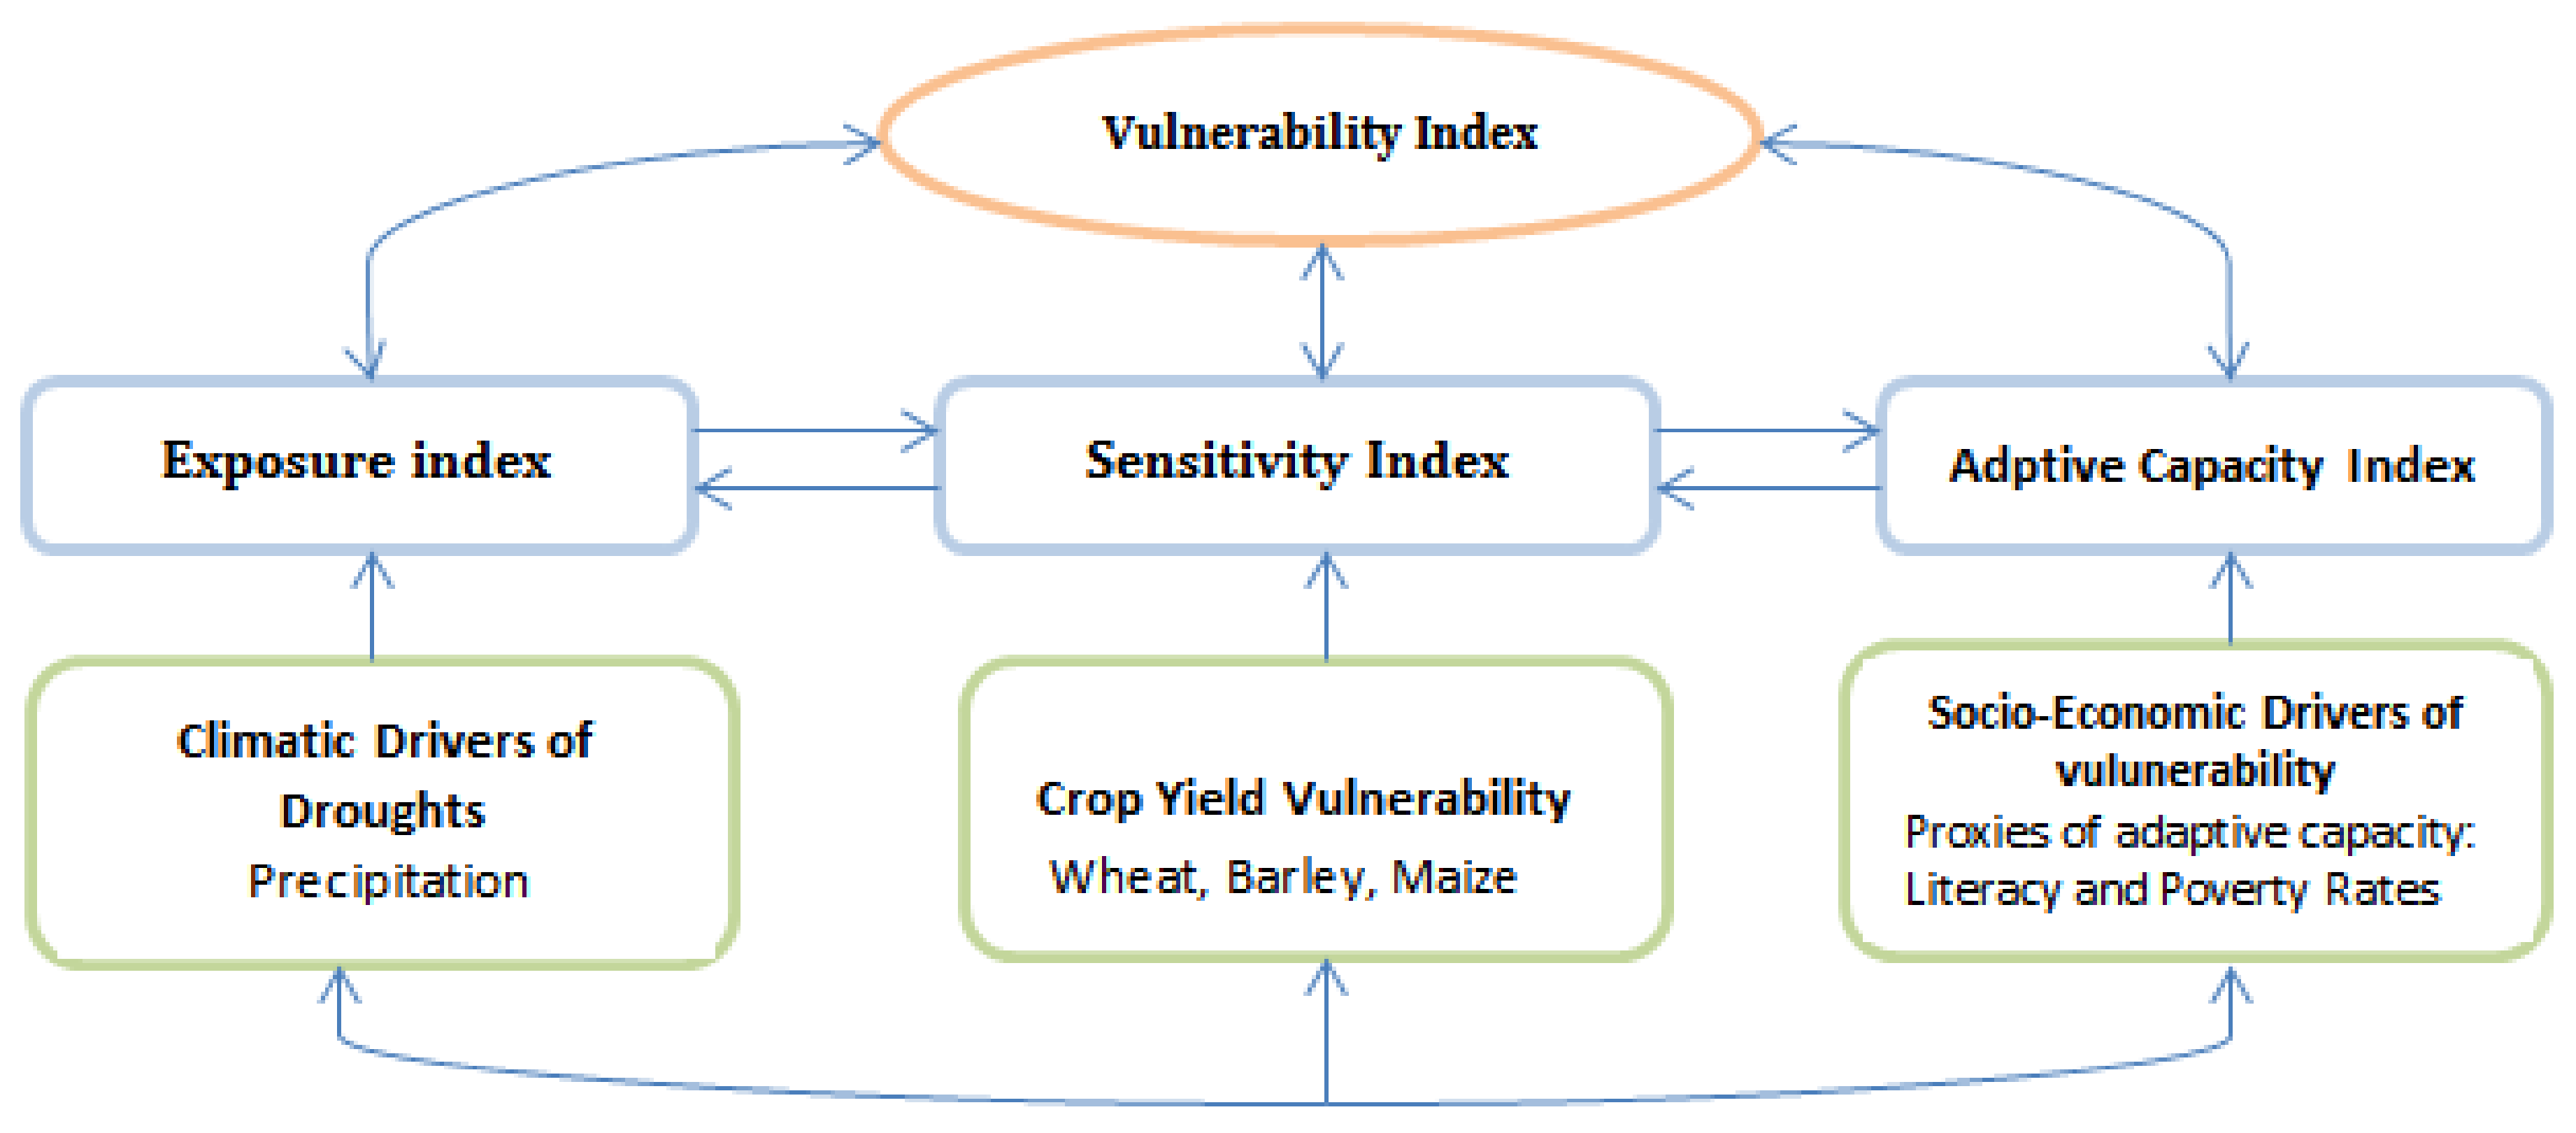


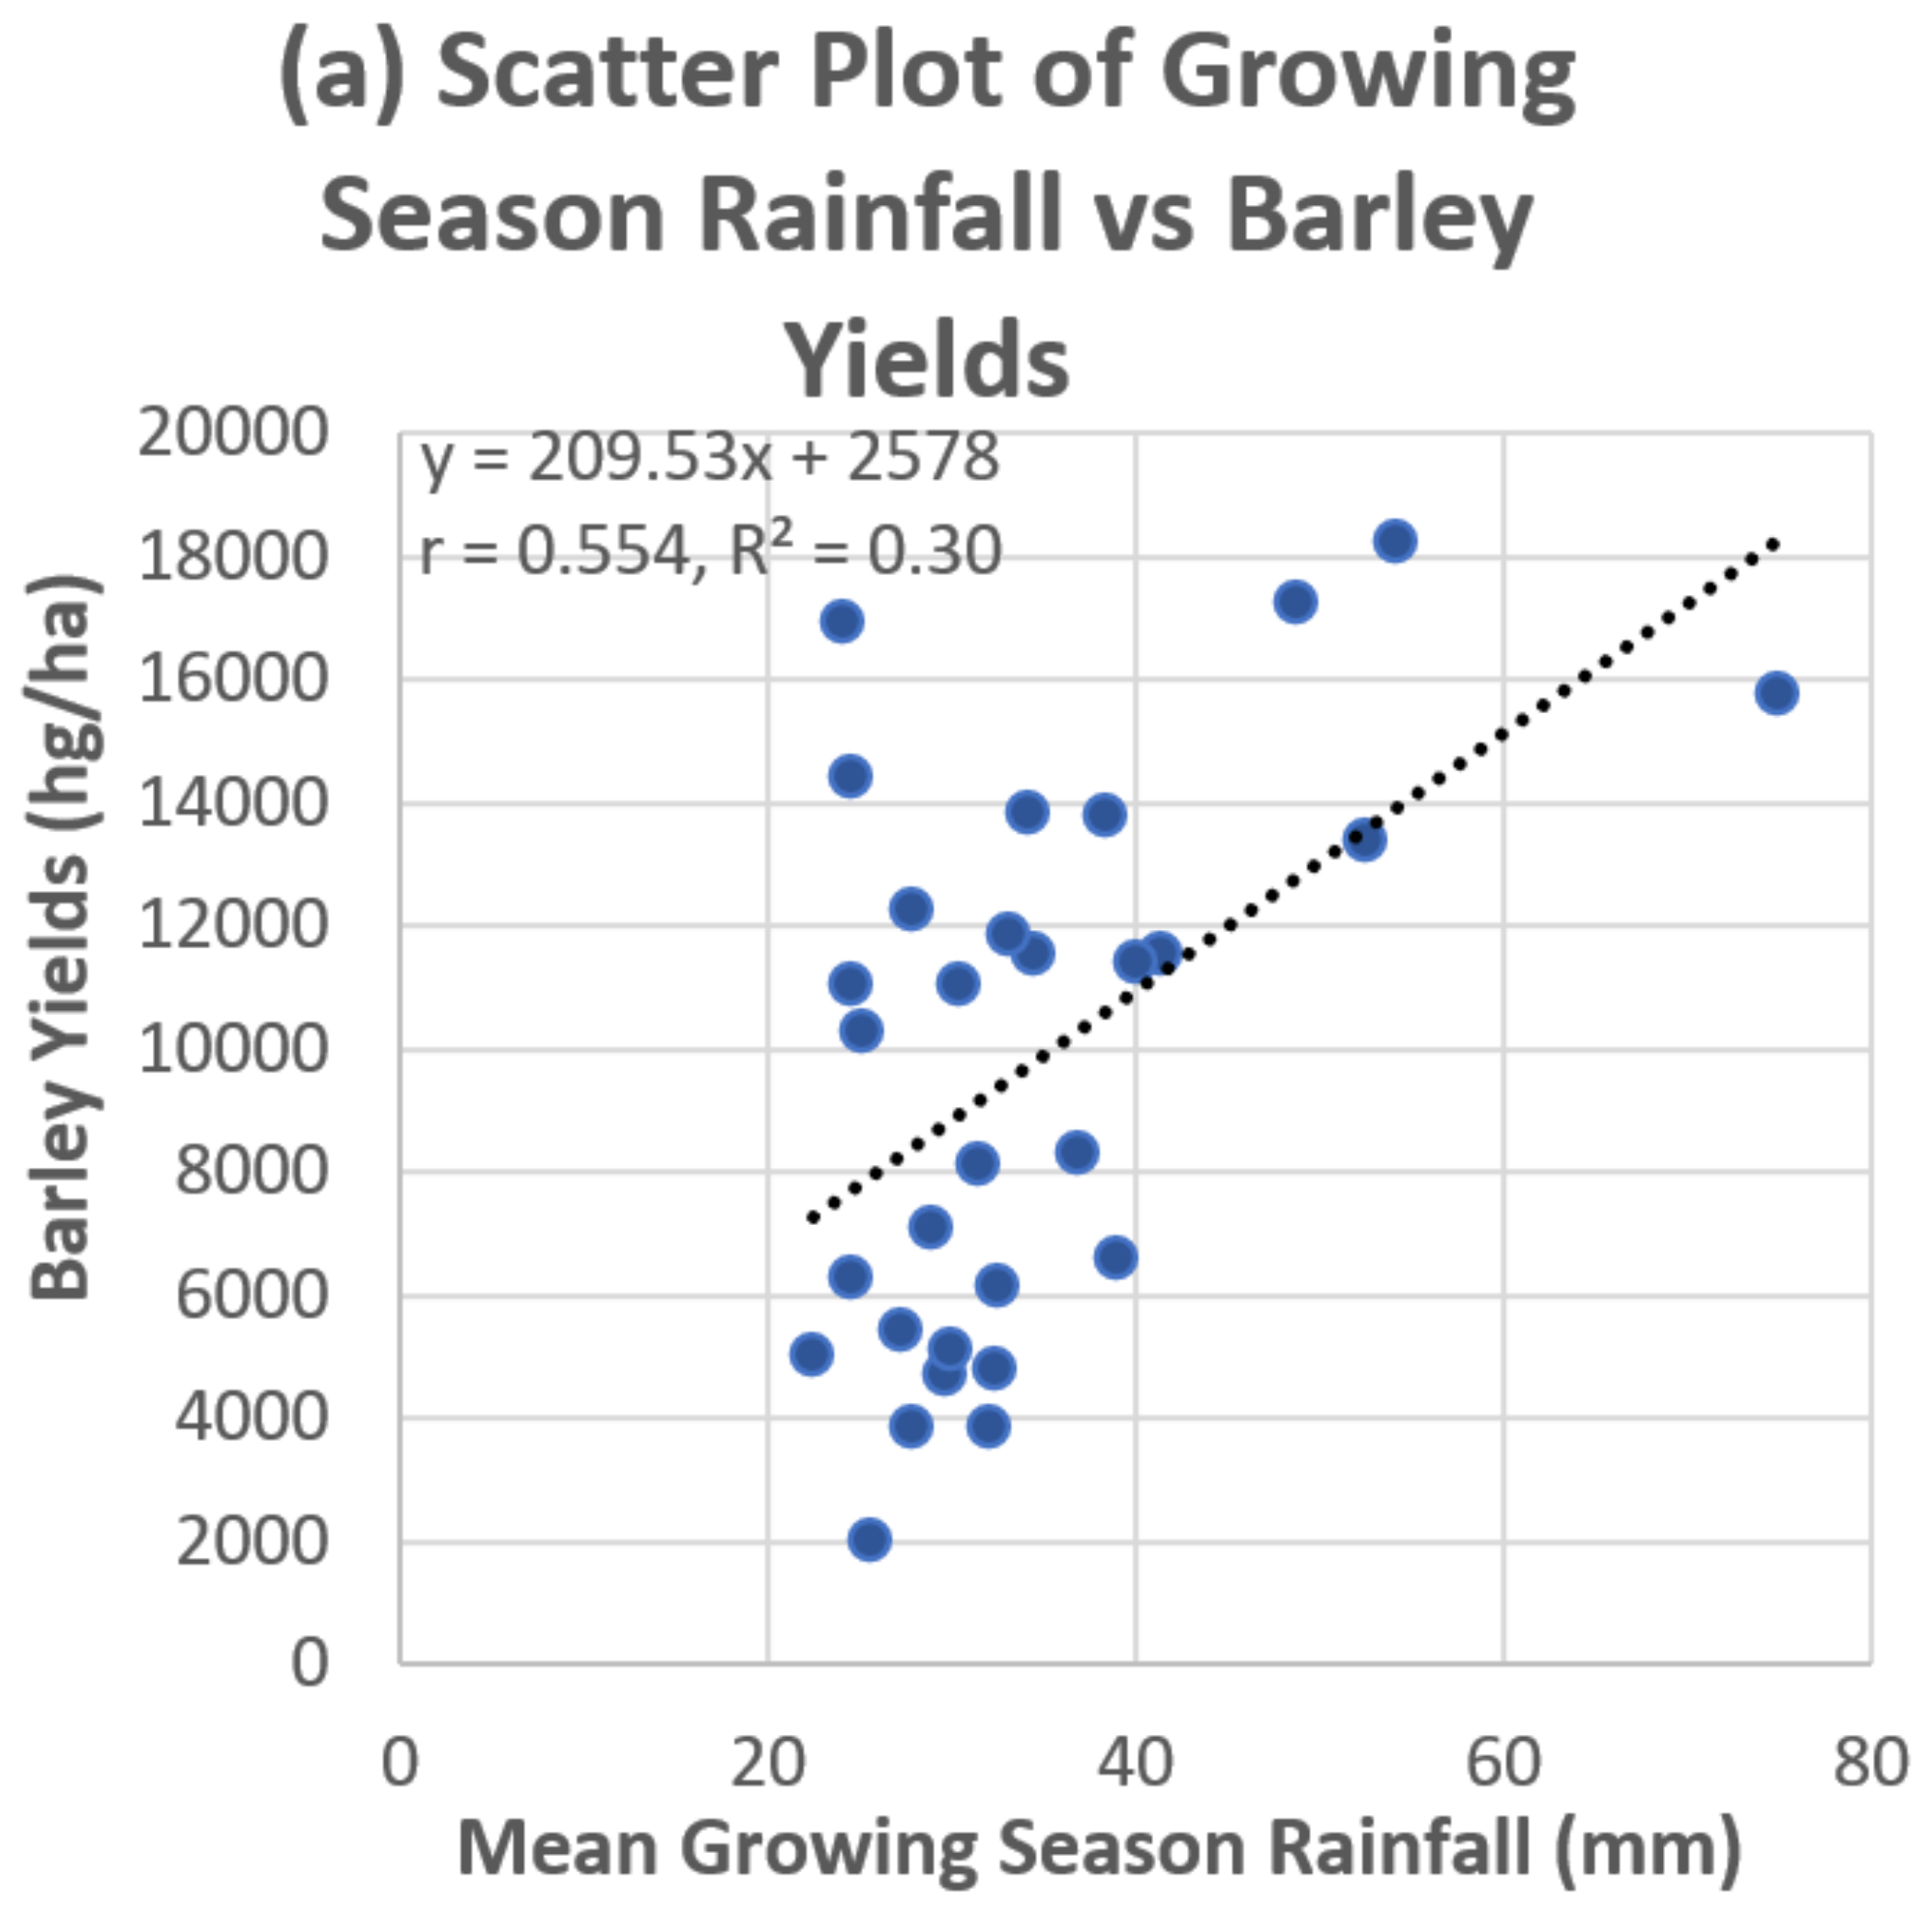
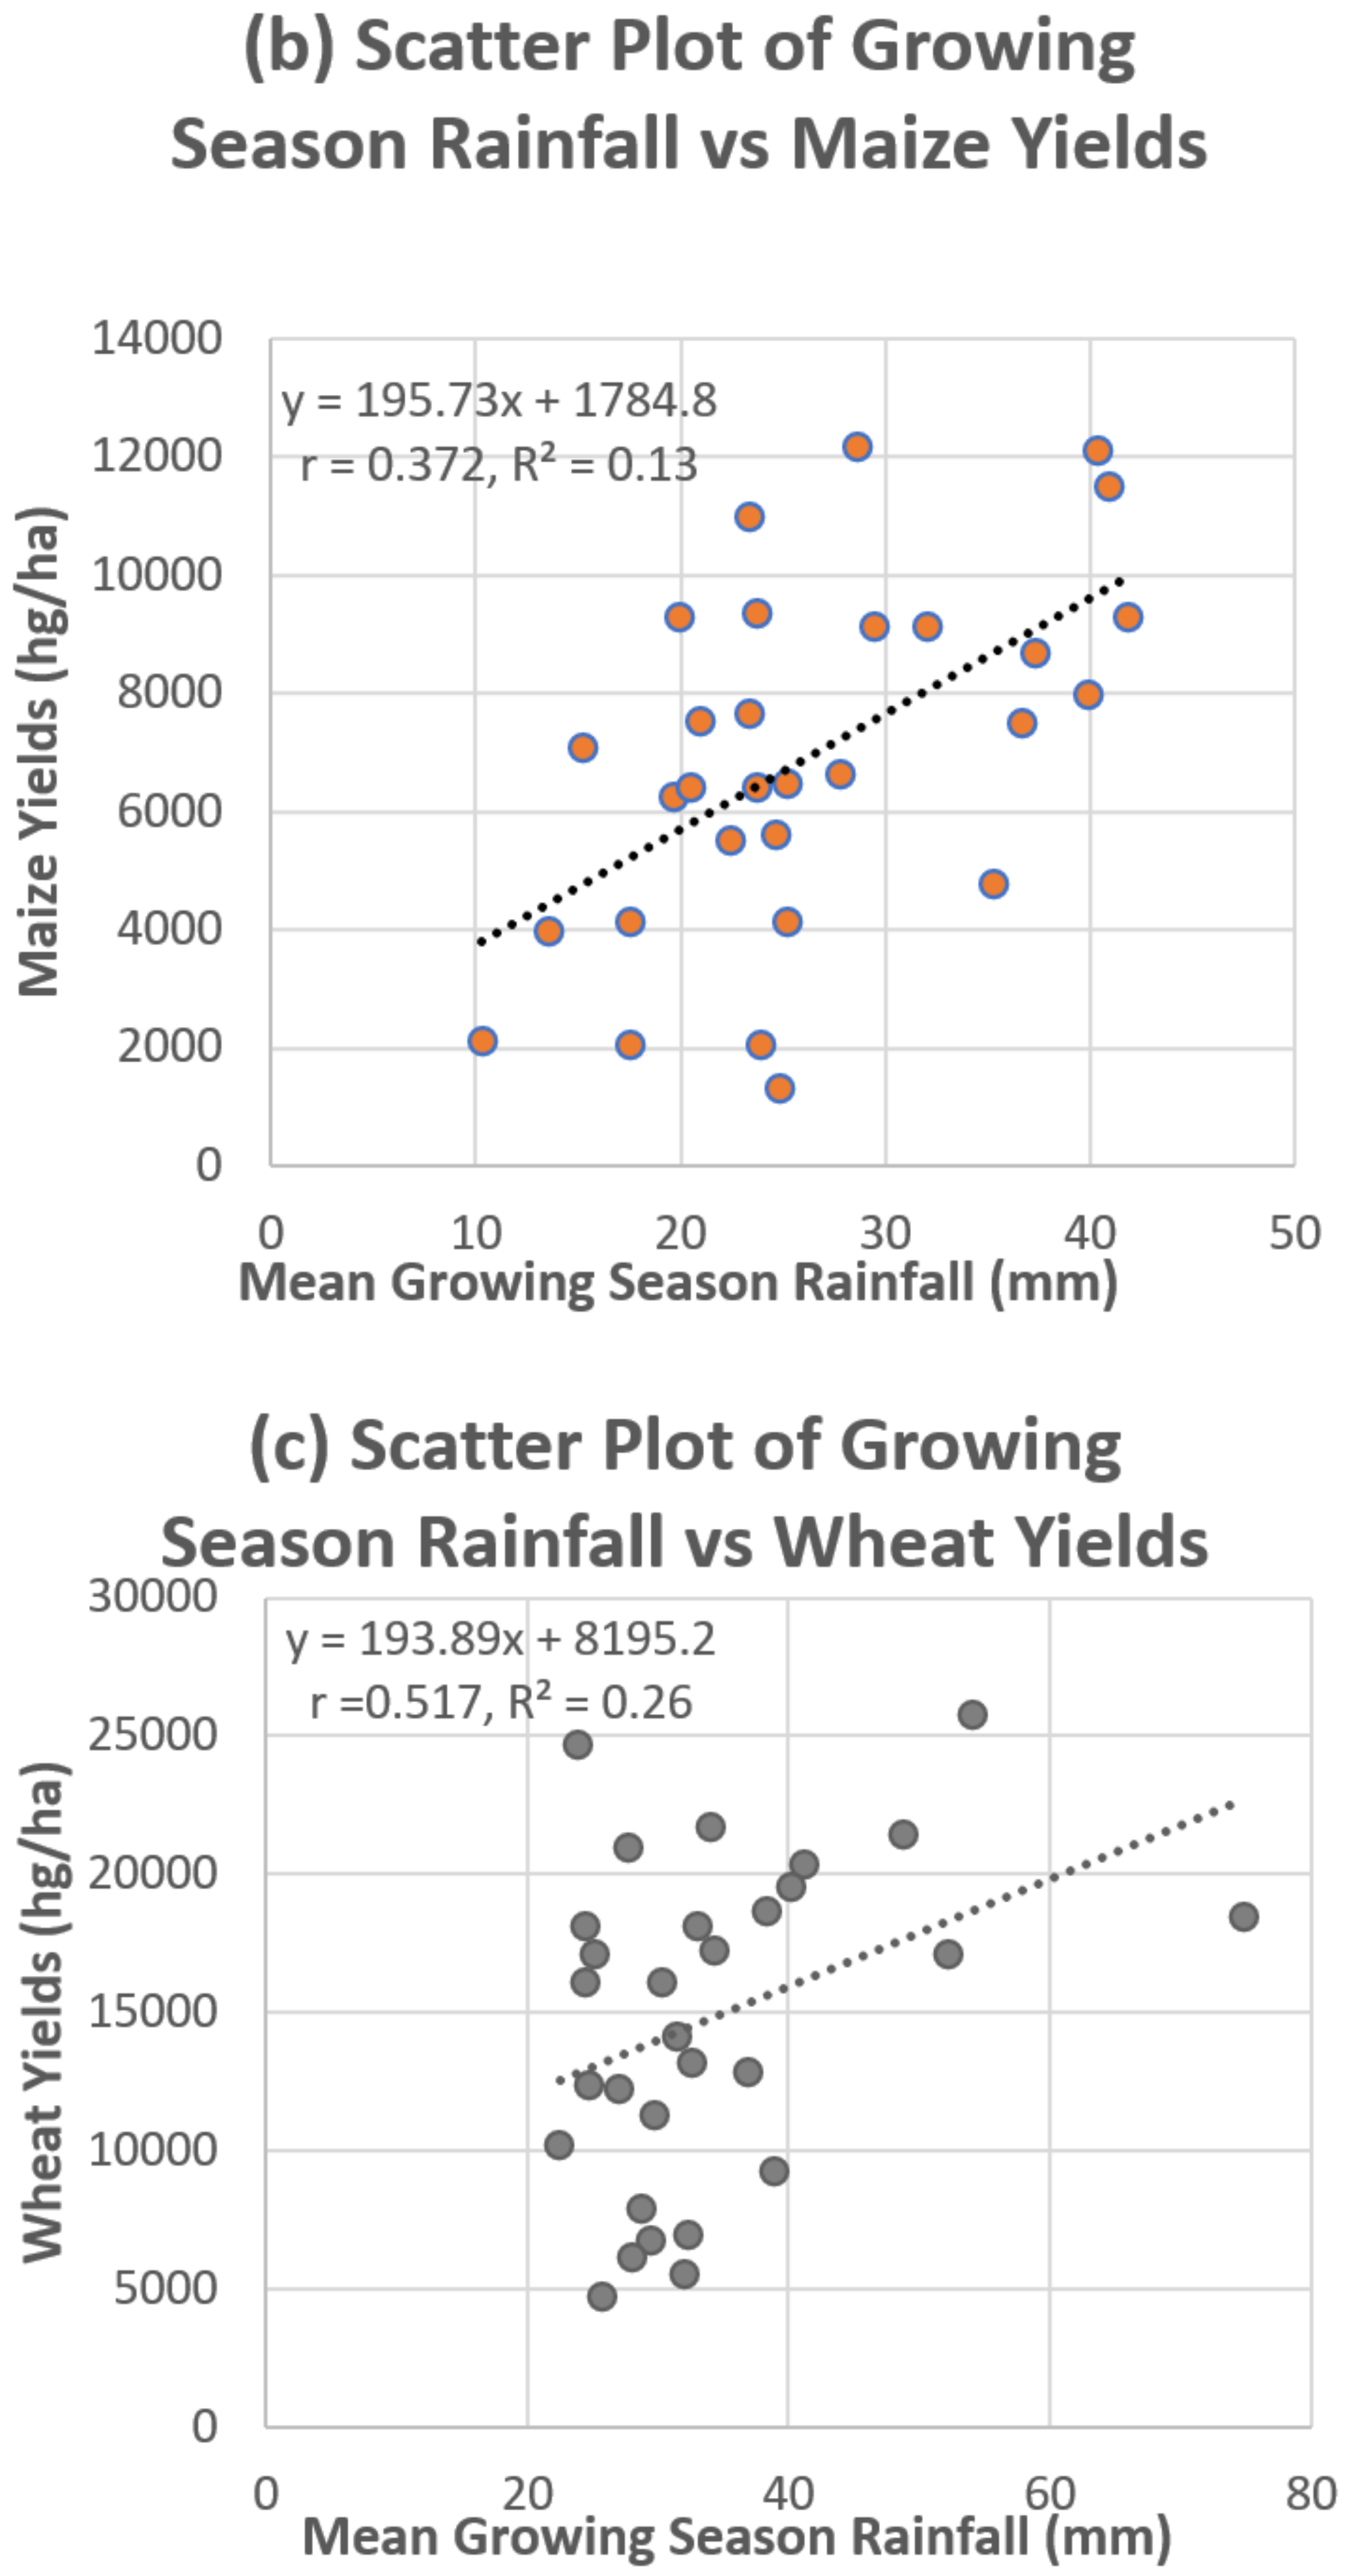

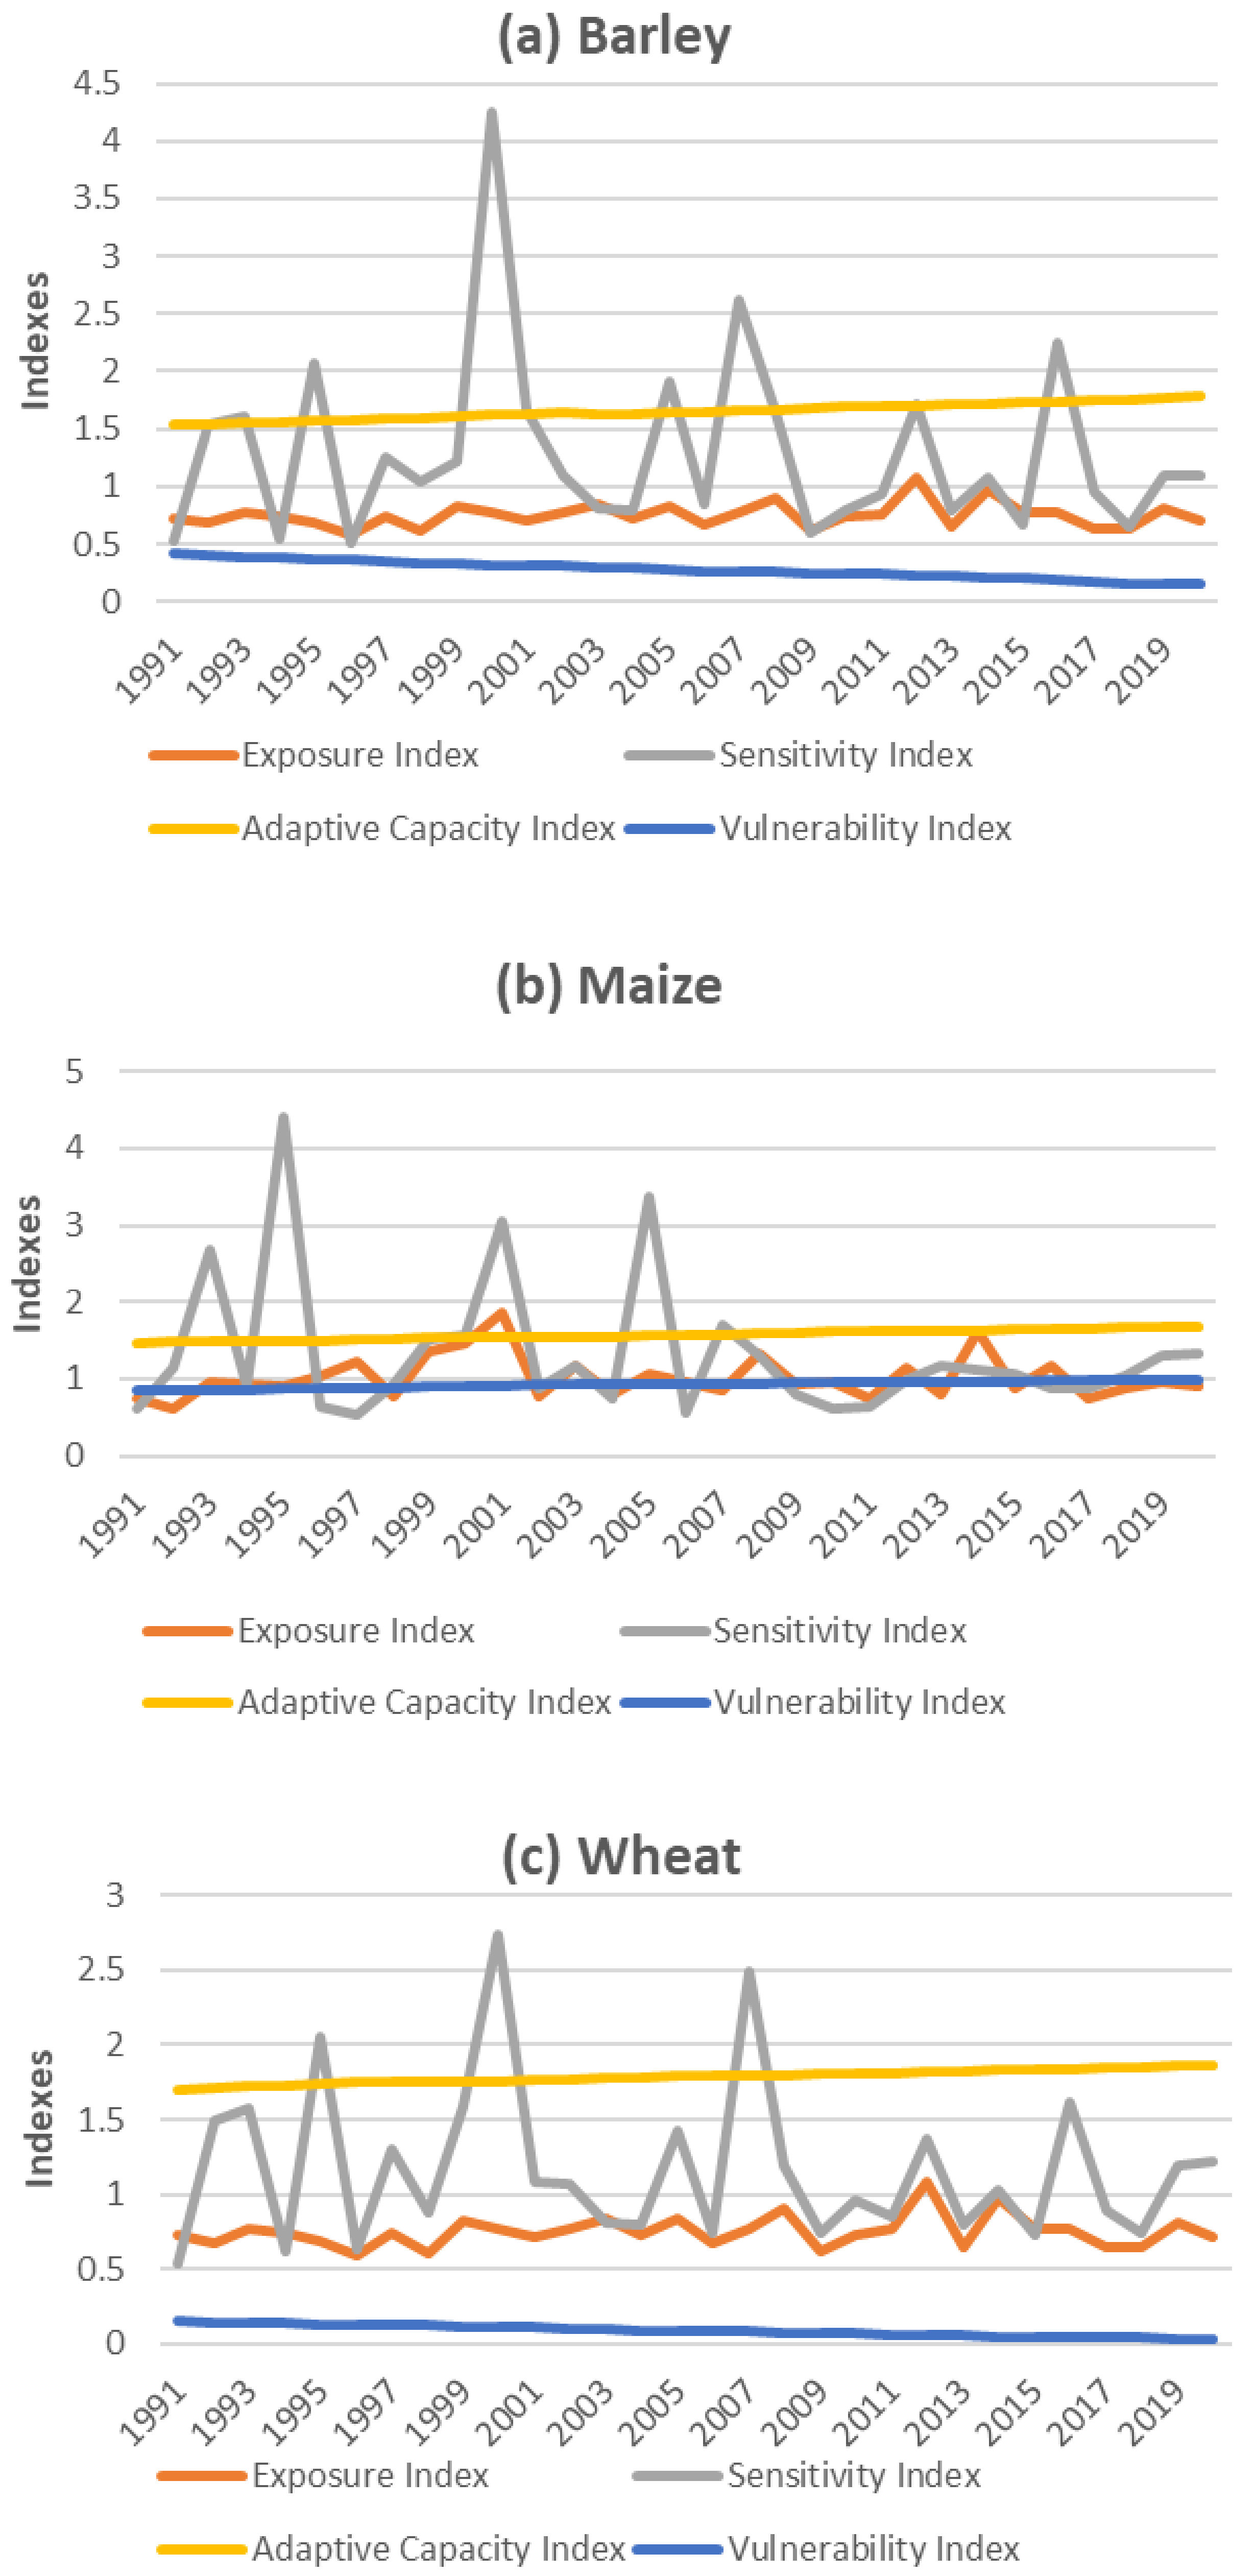

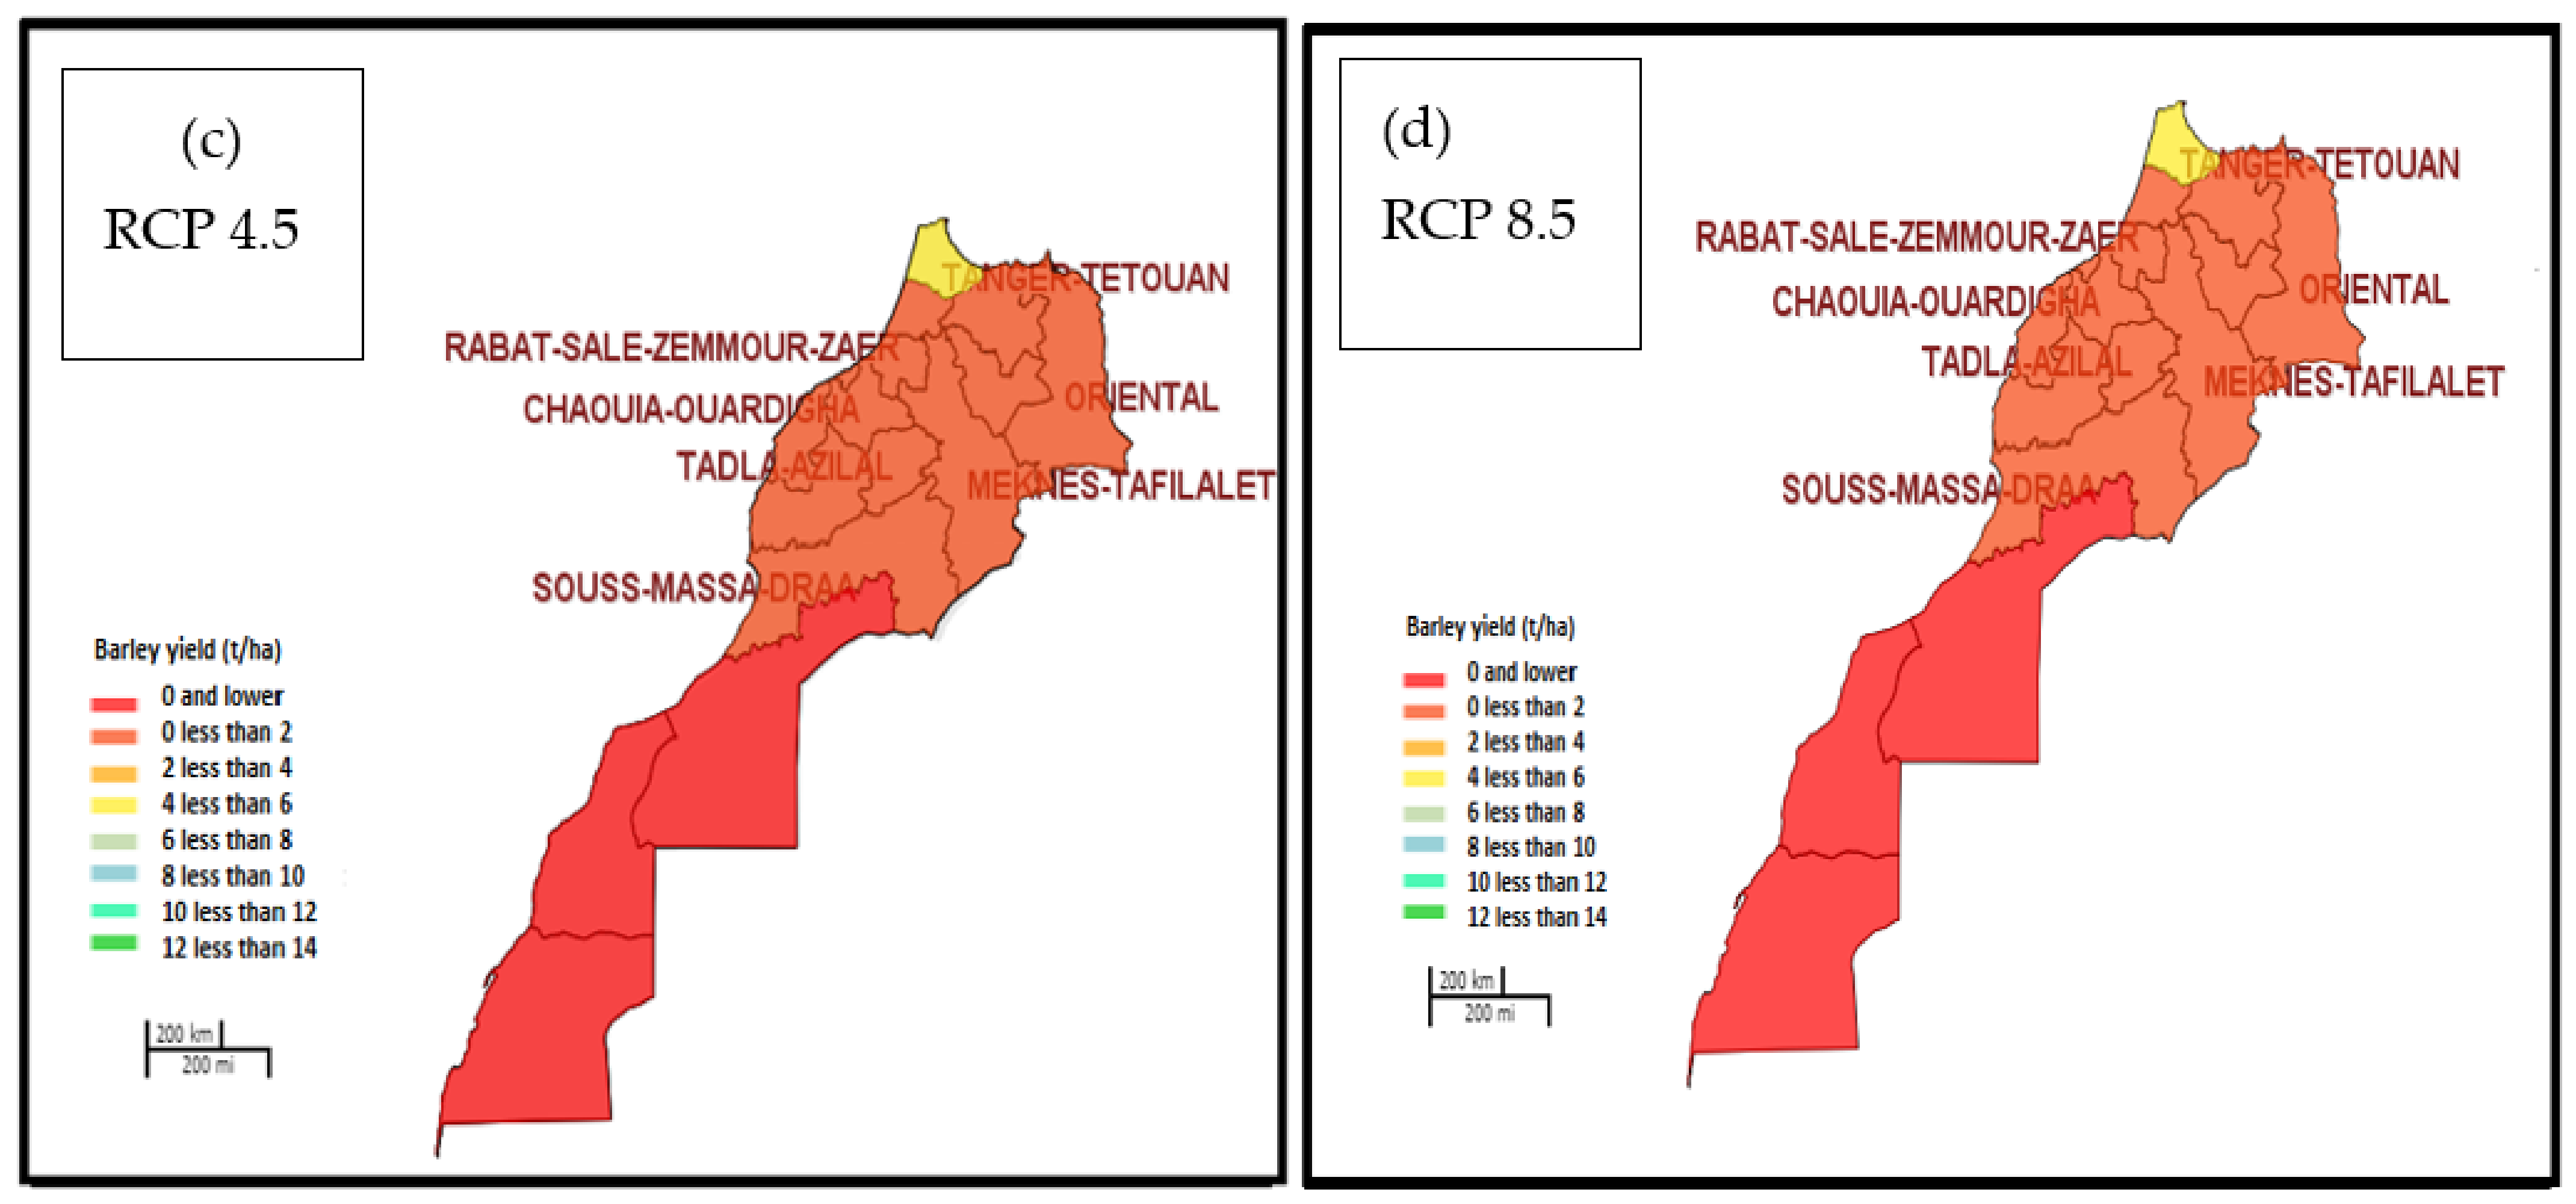
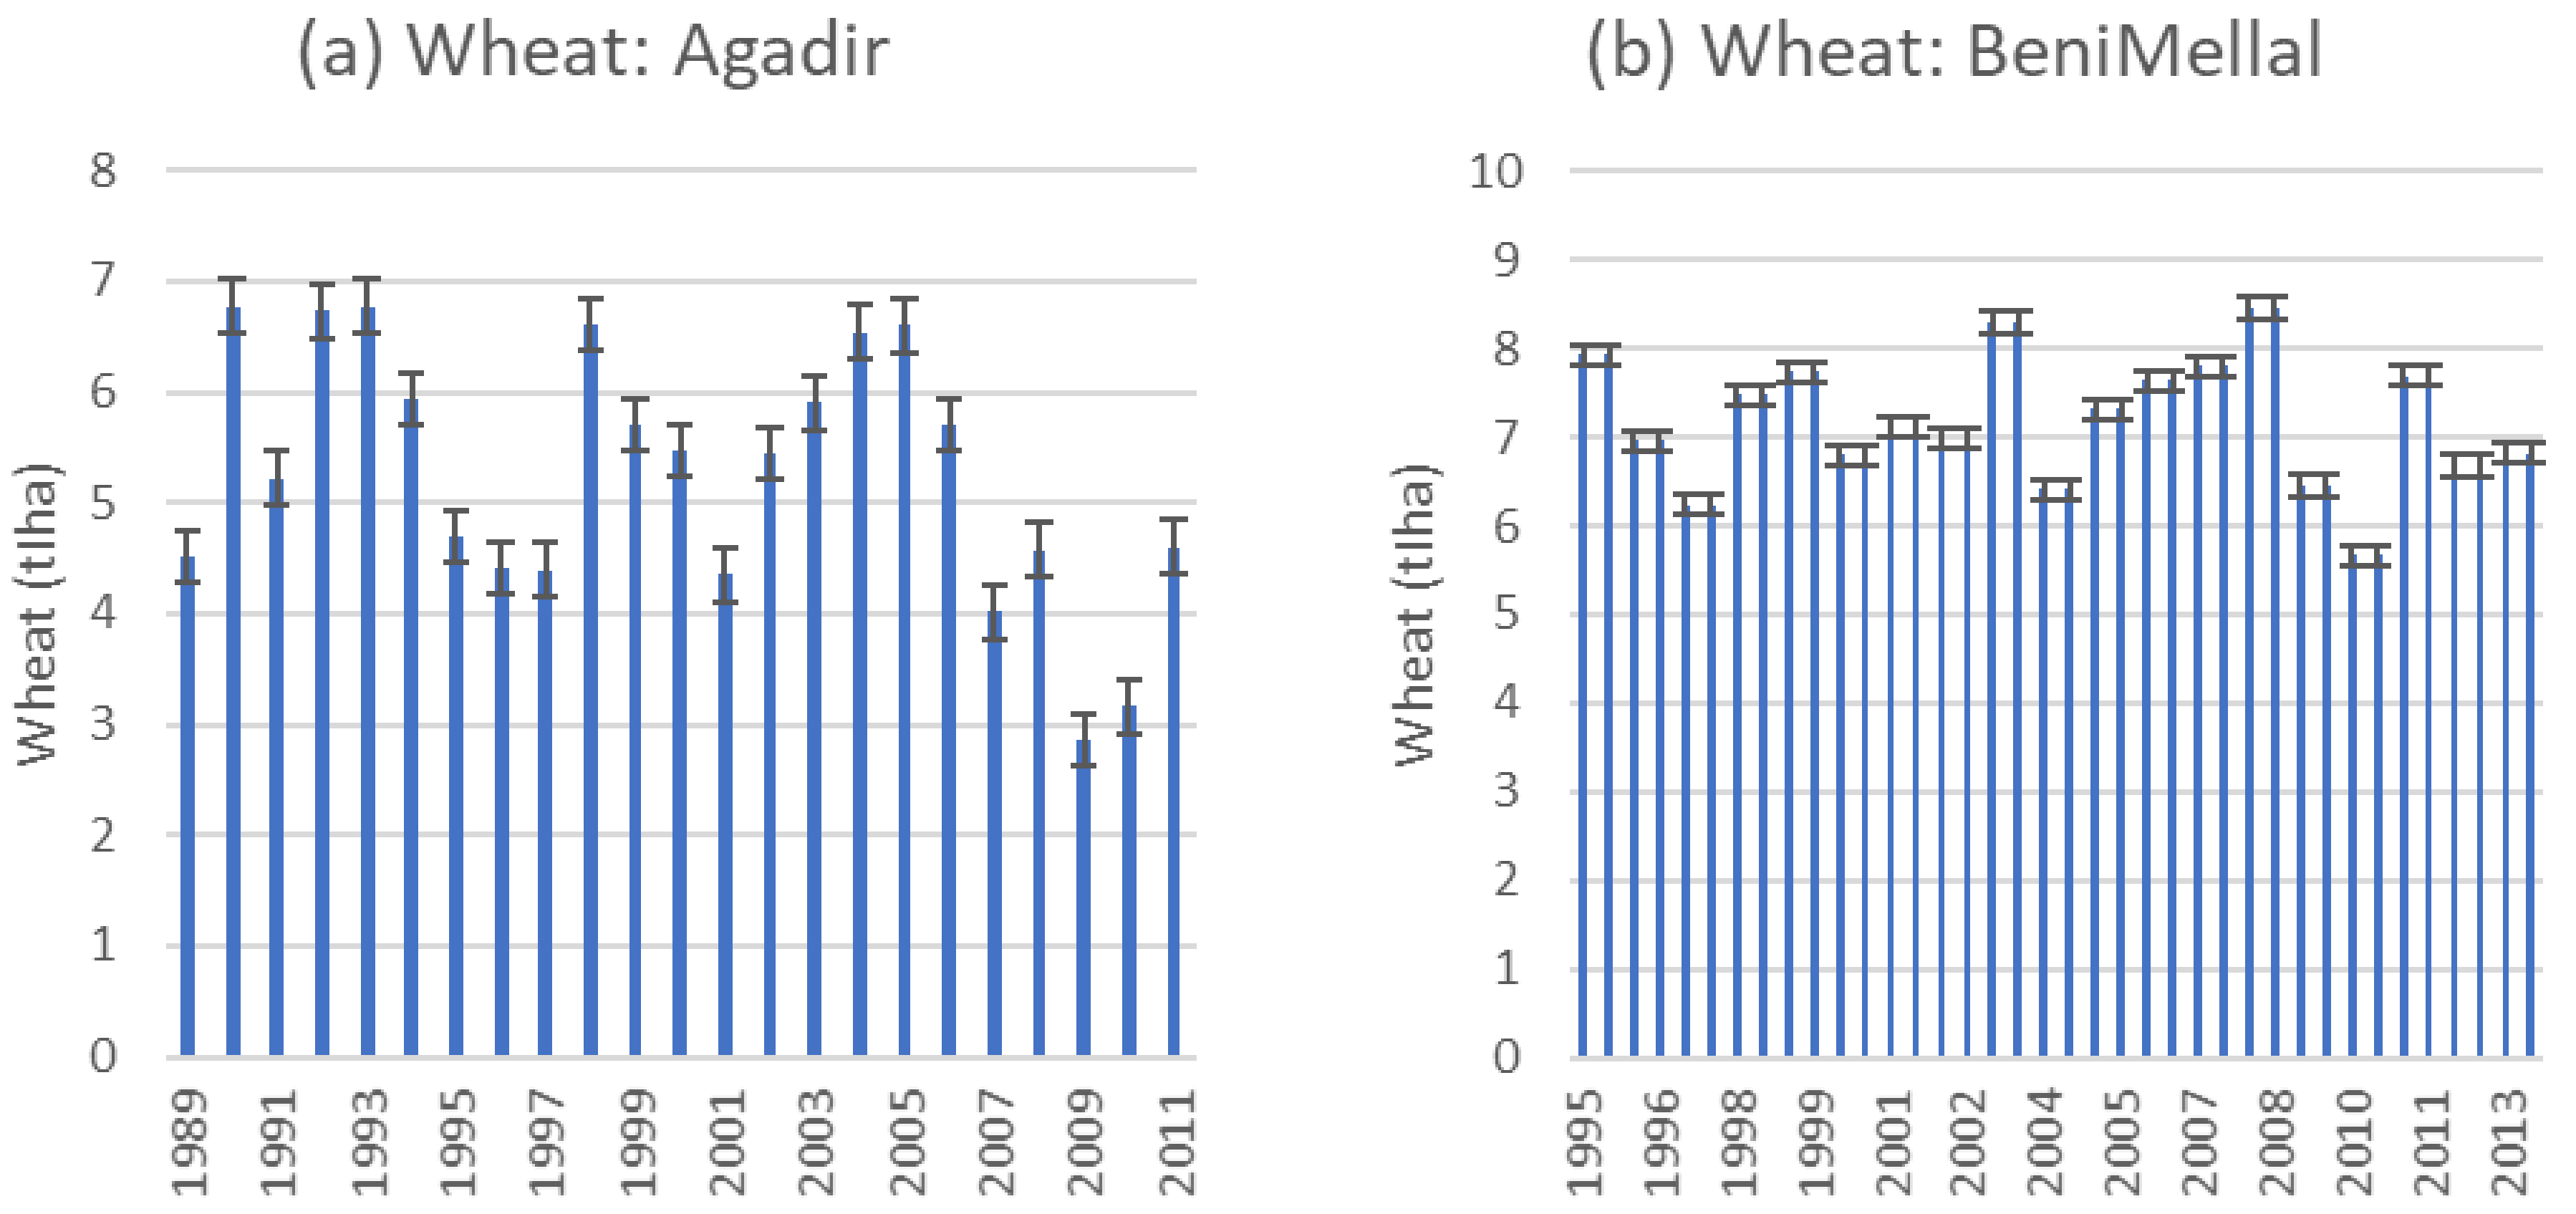

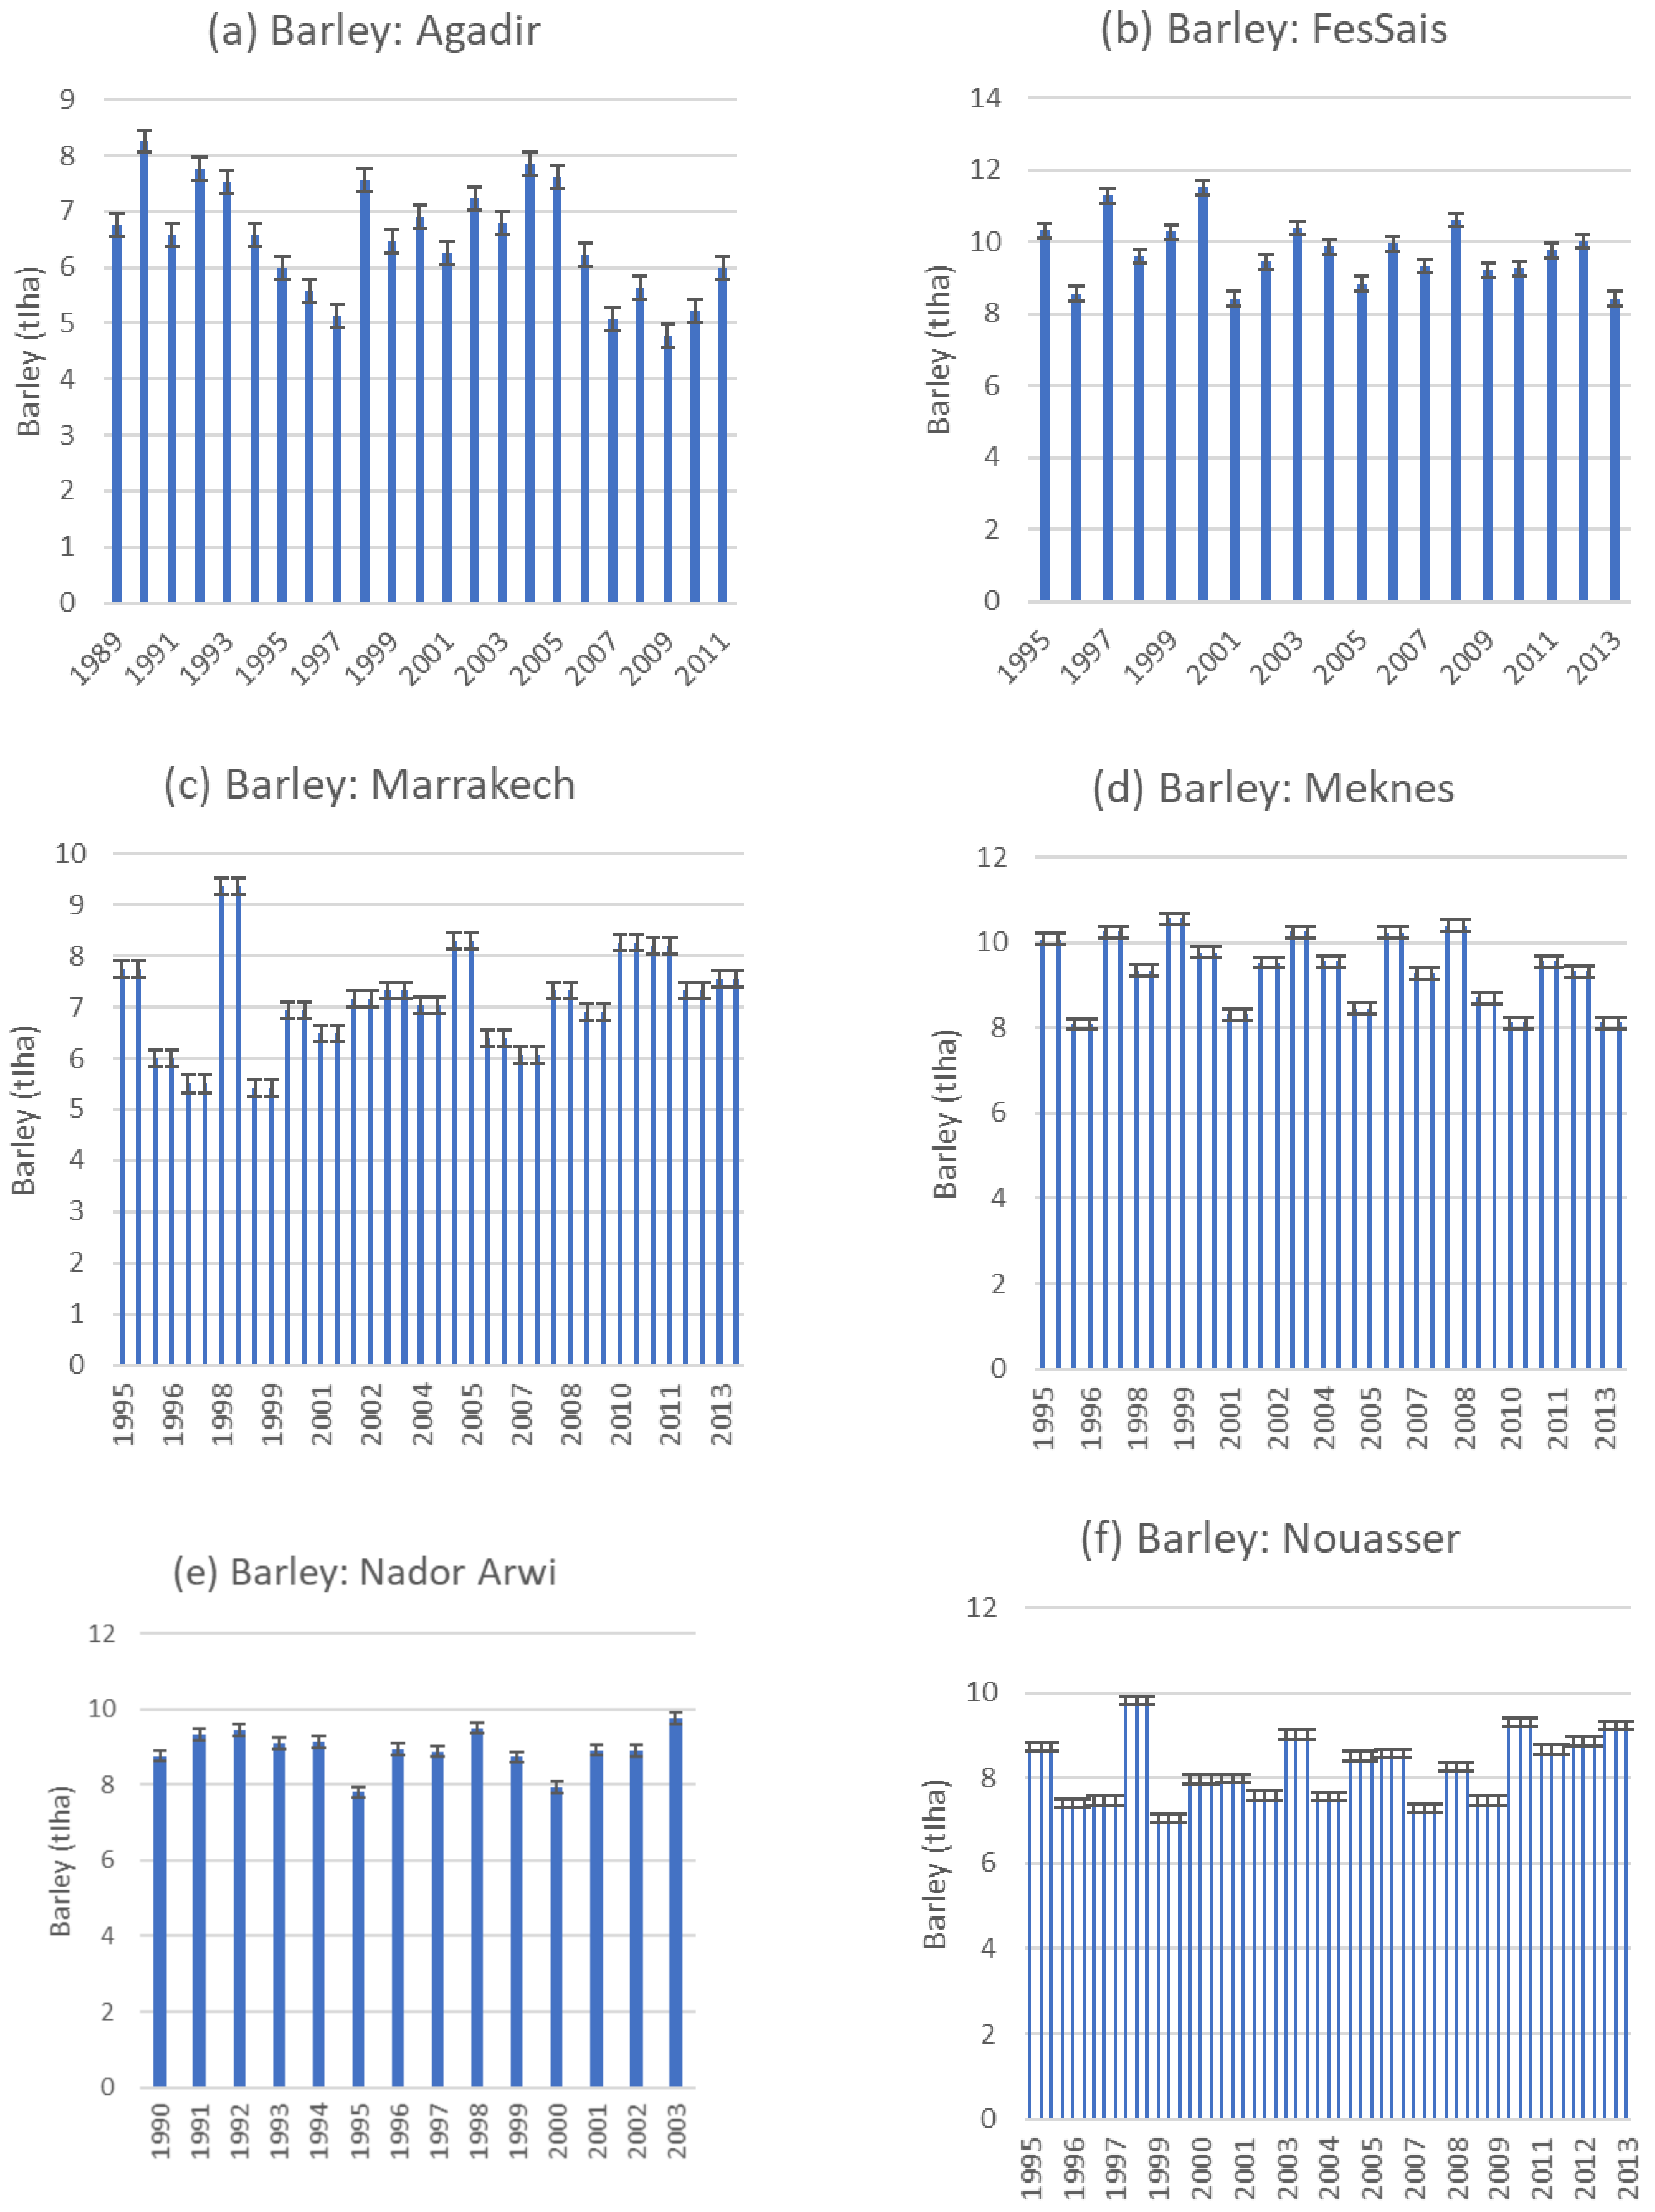


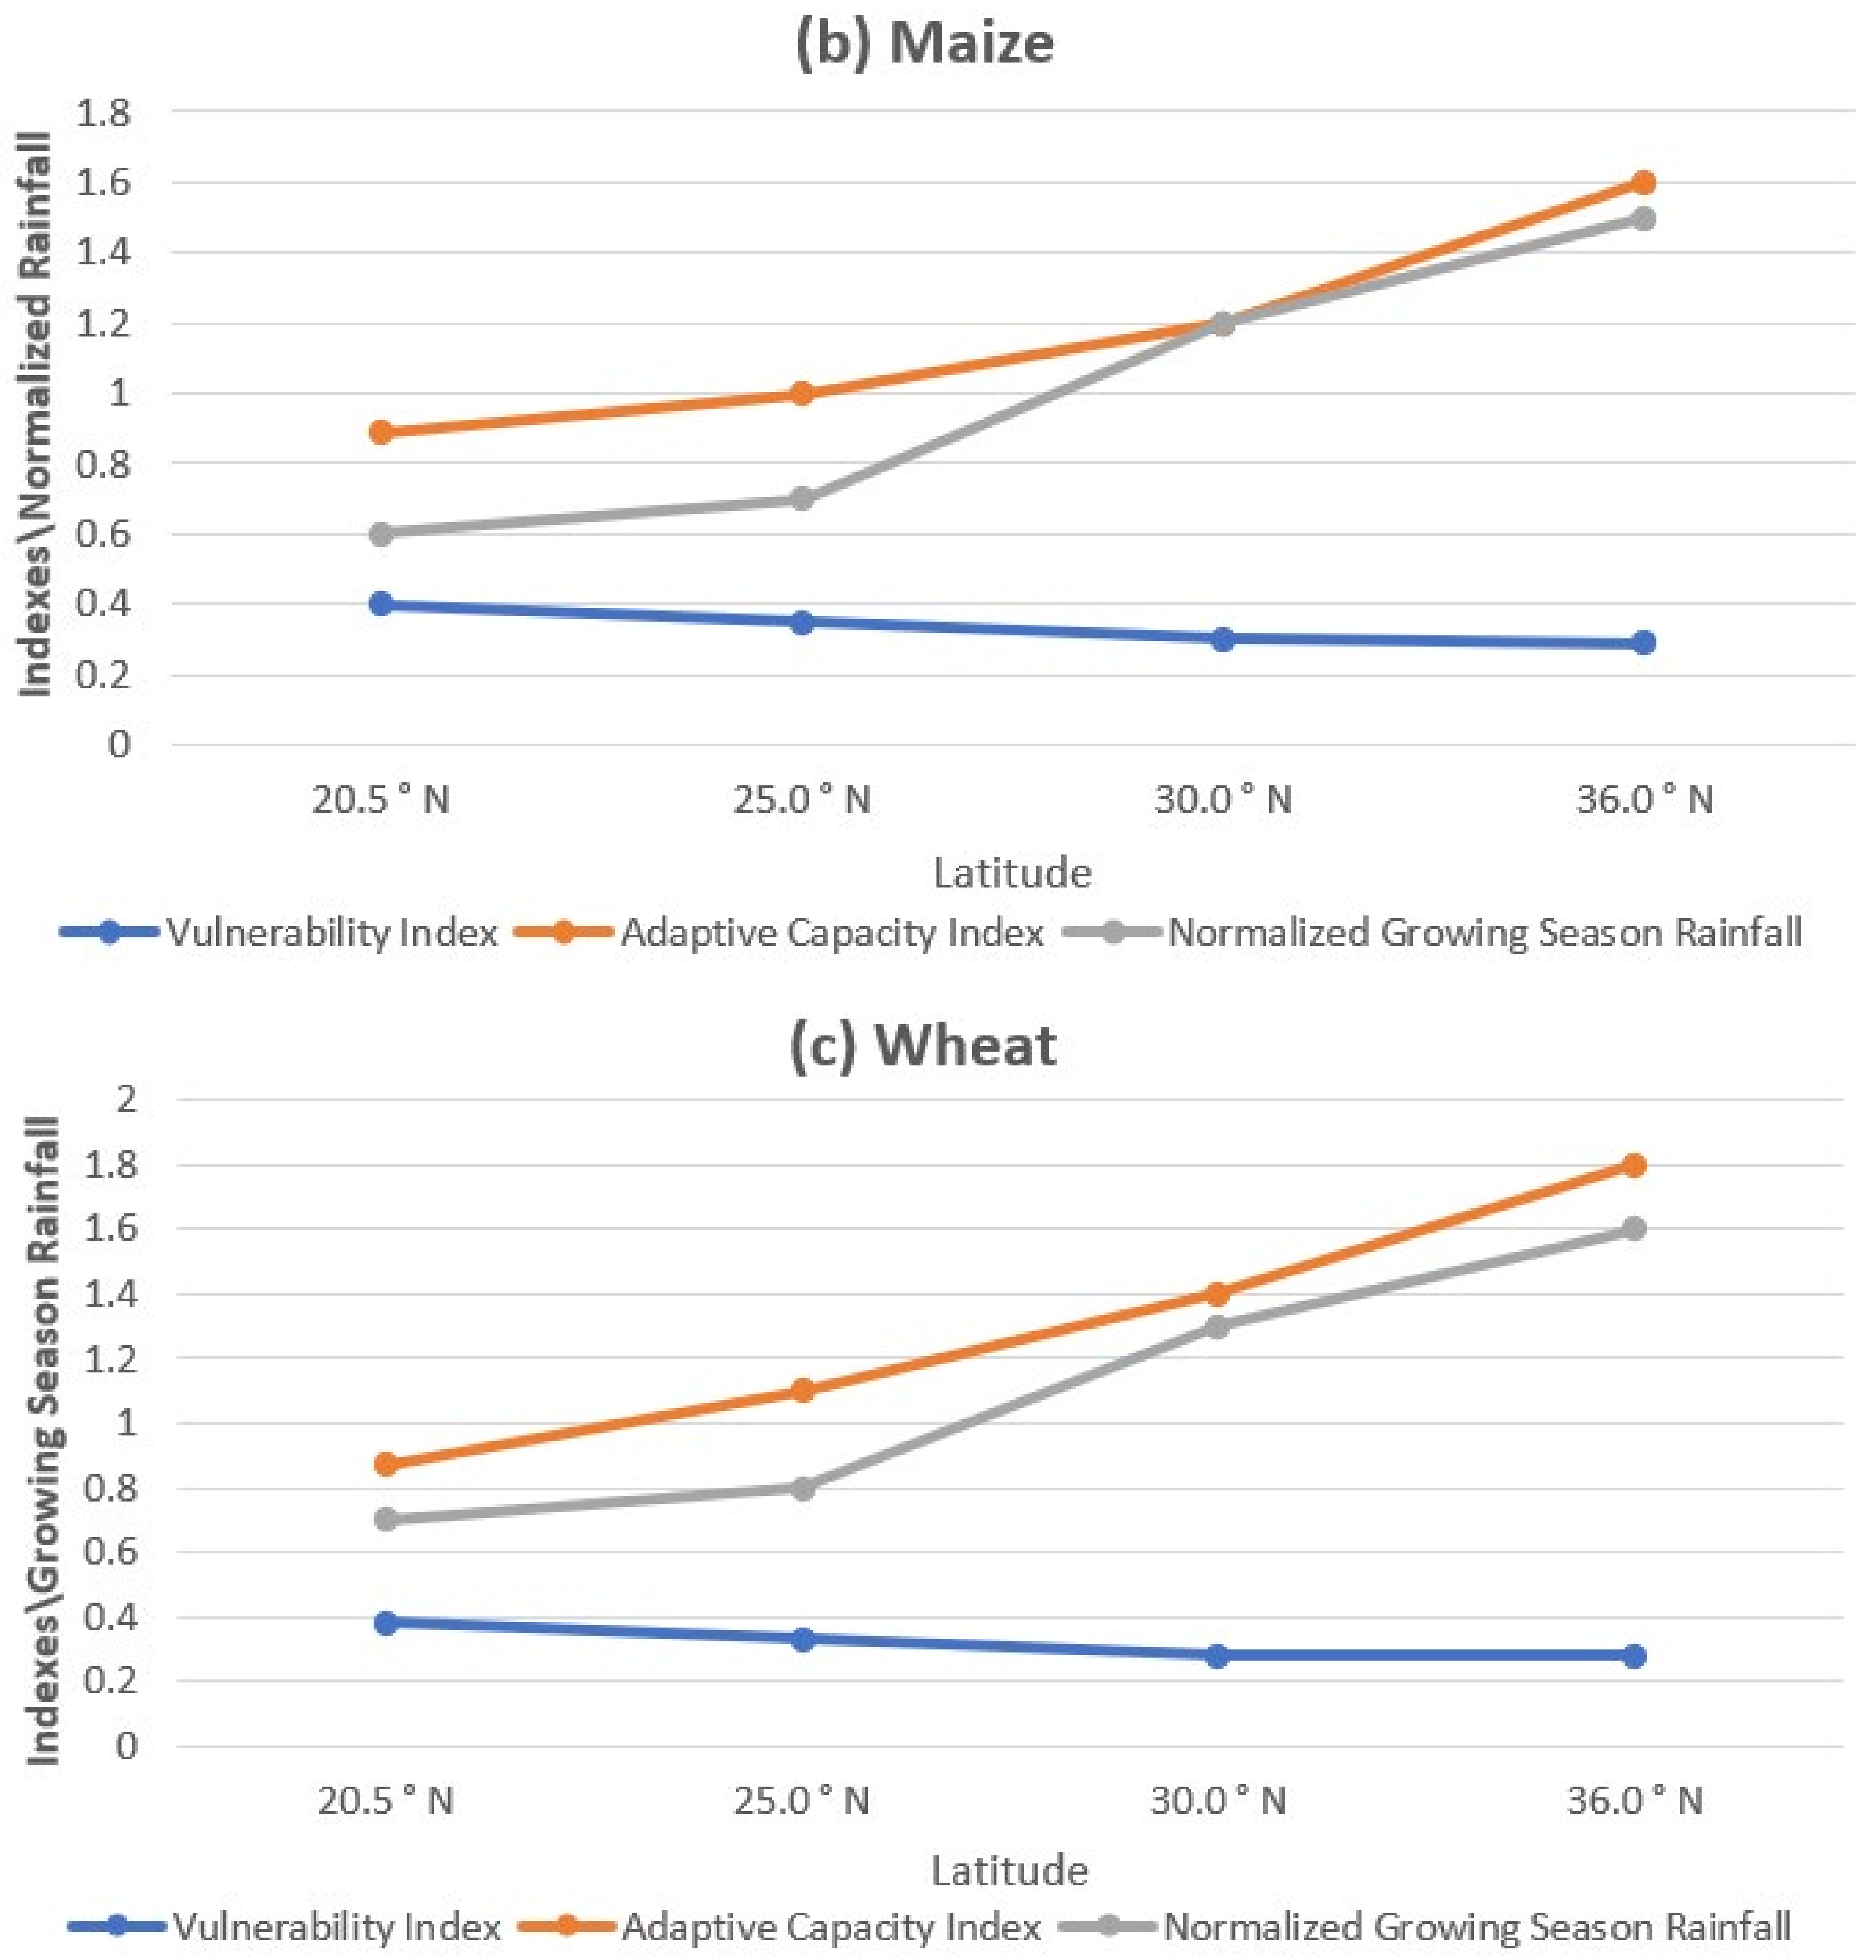
Publisher’s Note: MDPI stays neutral with regard to jurisdictional claims in published maps and institutional affiliations. |
© 2022 by the authors. Licensee MDPI, Basel, Switzerland. This article is an open access article distributed under the terms and conditions of the Creative Commons Attribution (CC BY) license (https://creativecommons.org/licenses/by/4.0/).