Analysis of Multilayered Ground Amplification Characteristics by Scaled-Down Model Tests
Abstract
:1. Introduction
2. Materials and Methods
2.1. Soil Properties and Experimental Equipment
2.2. Model Construction and Experimental Procedures
3. Multilayered Flat Model Ground Test Results and Analysis
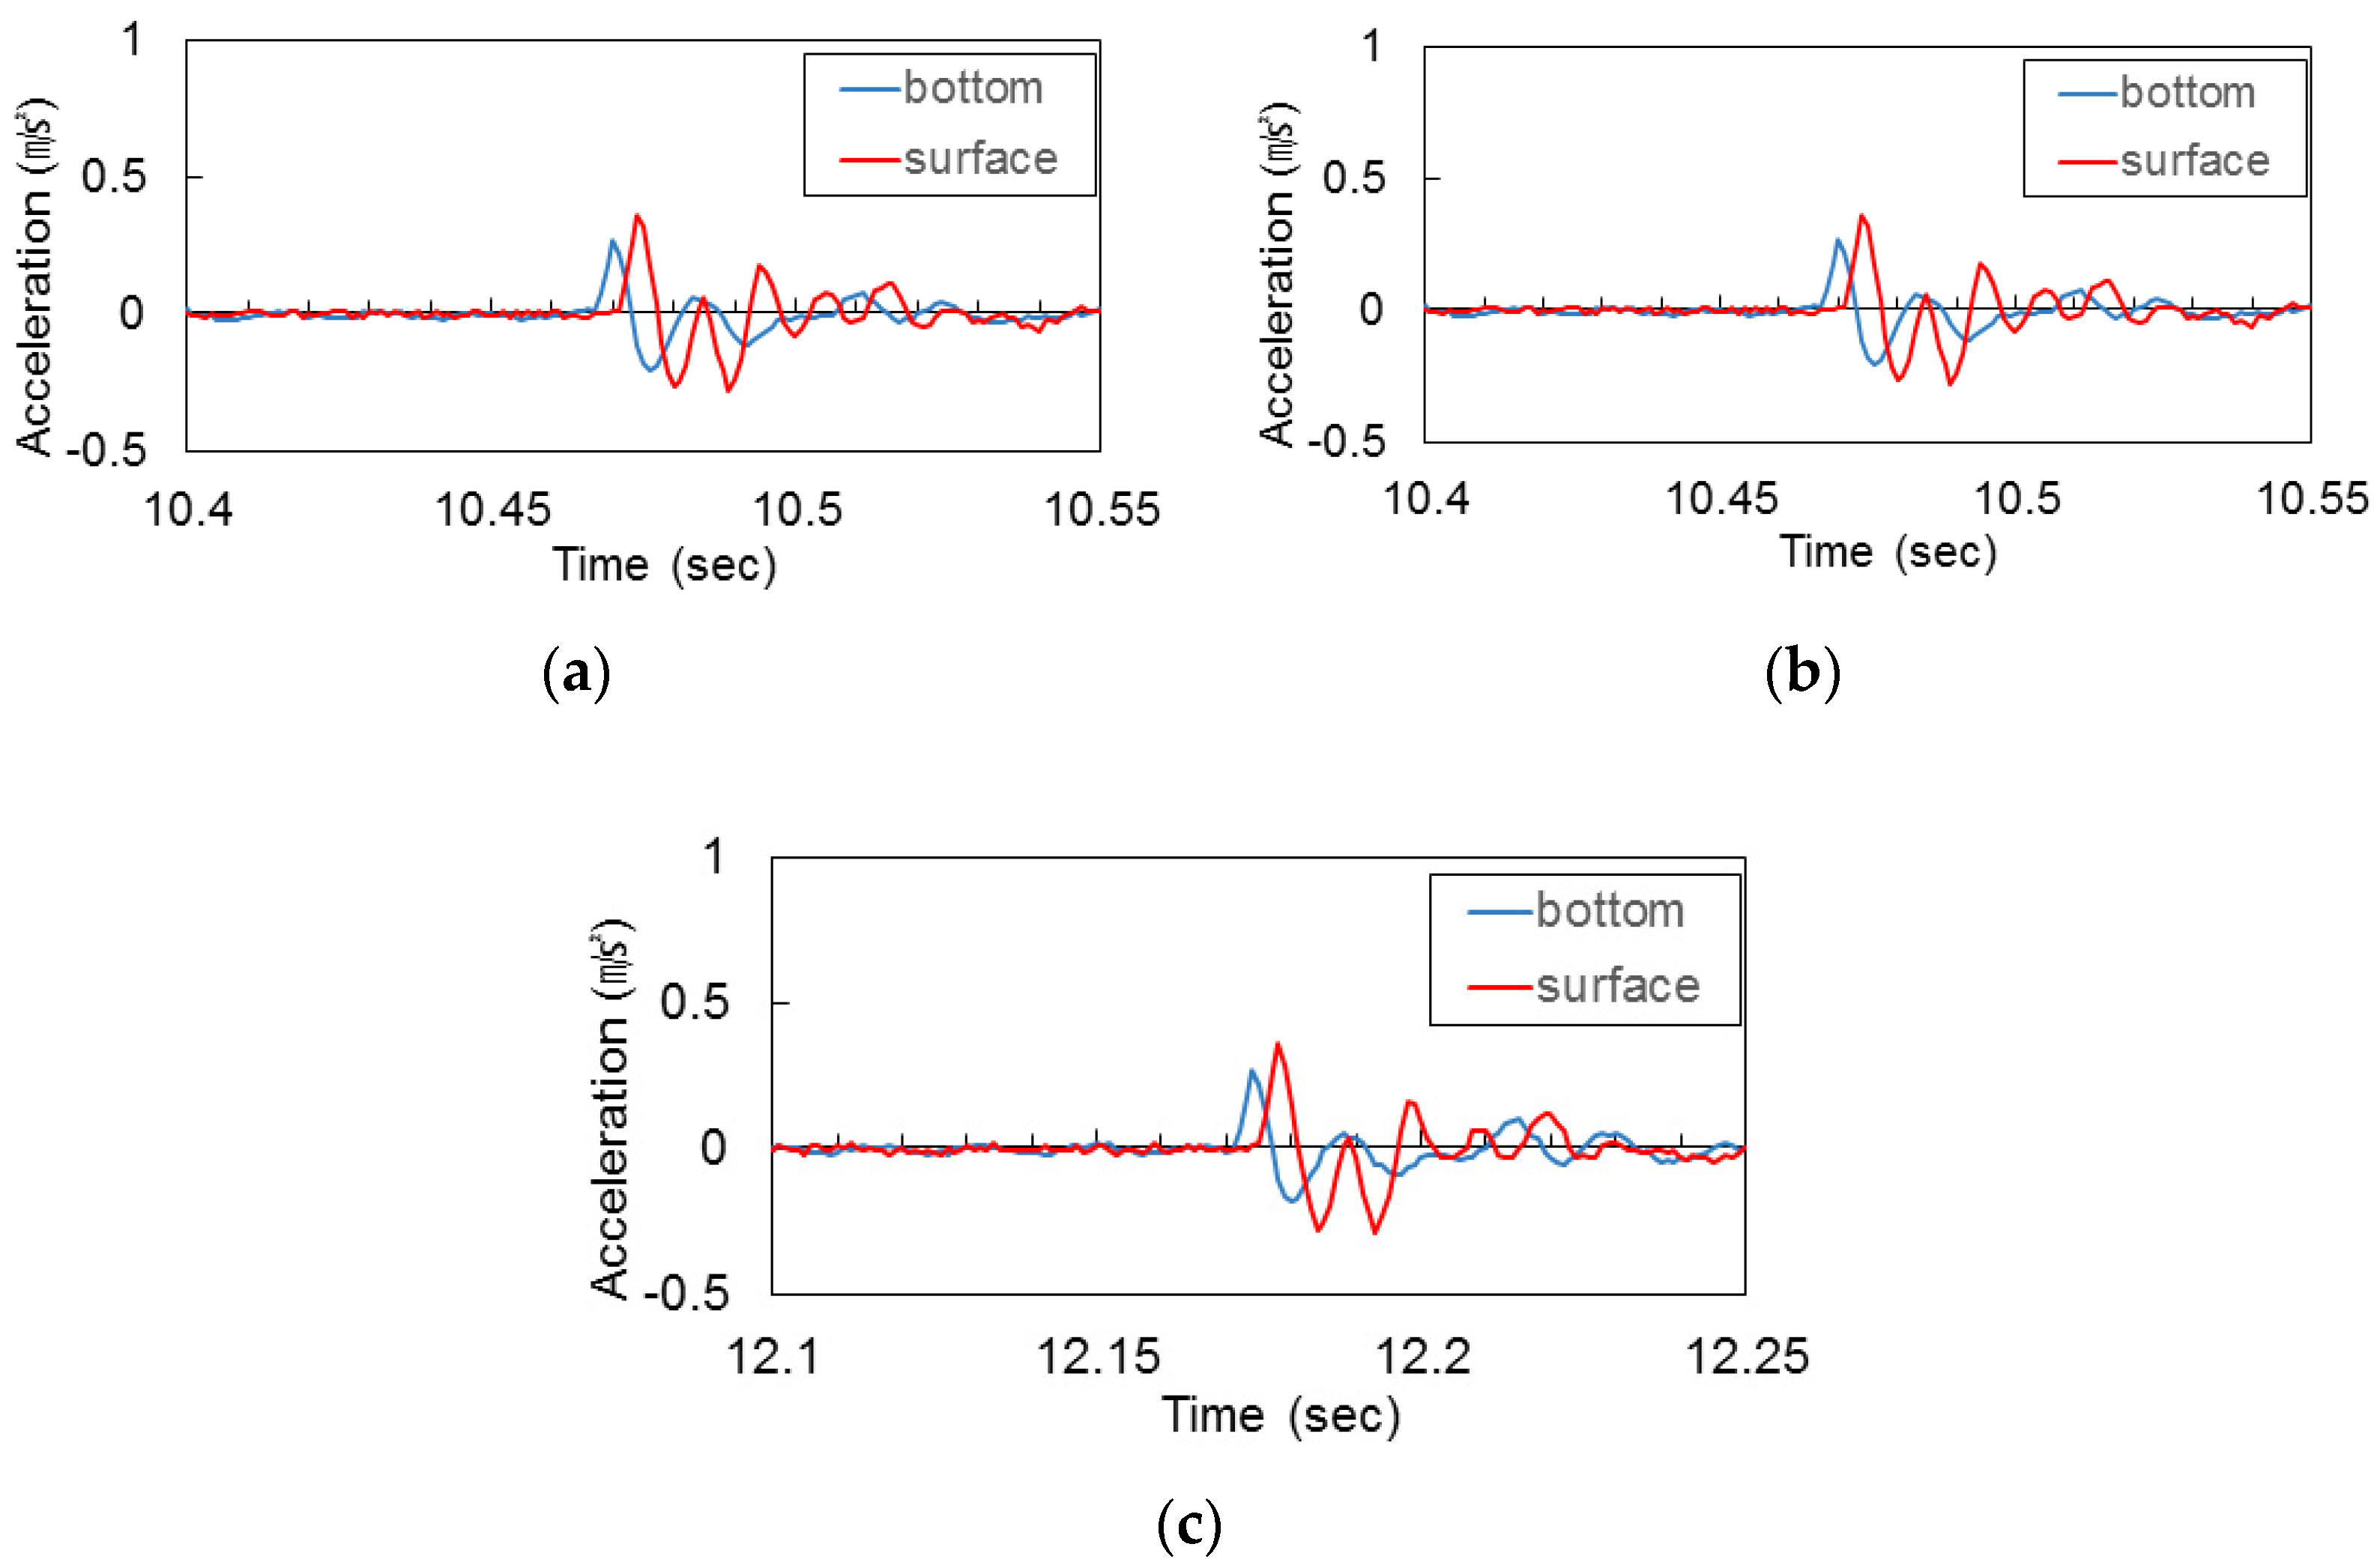
3.1. Shear Wave Velocity
3.2. Peak Ground Acceleration
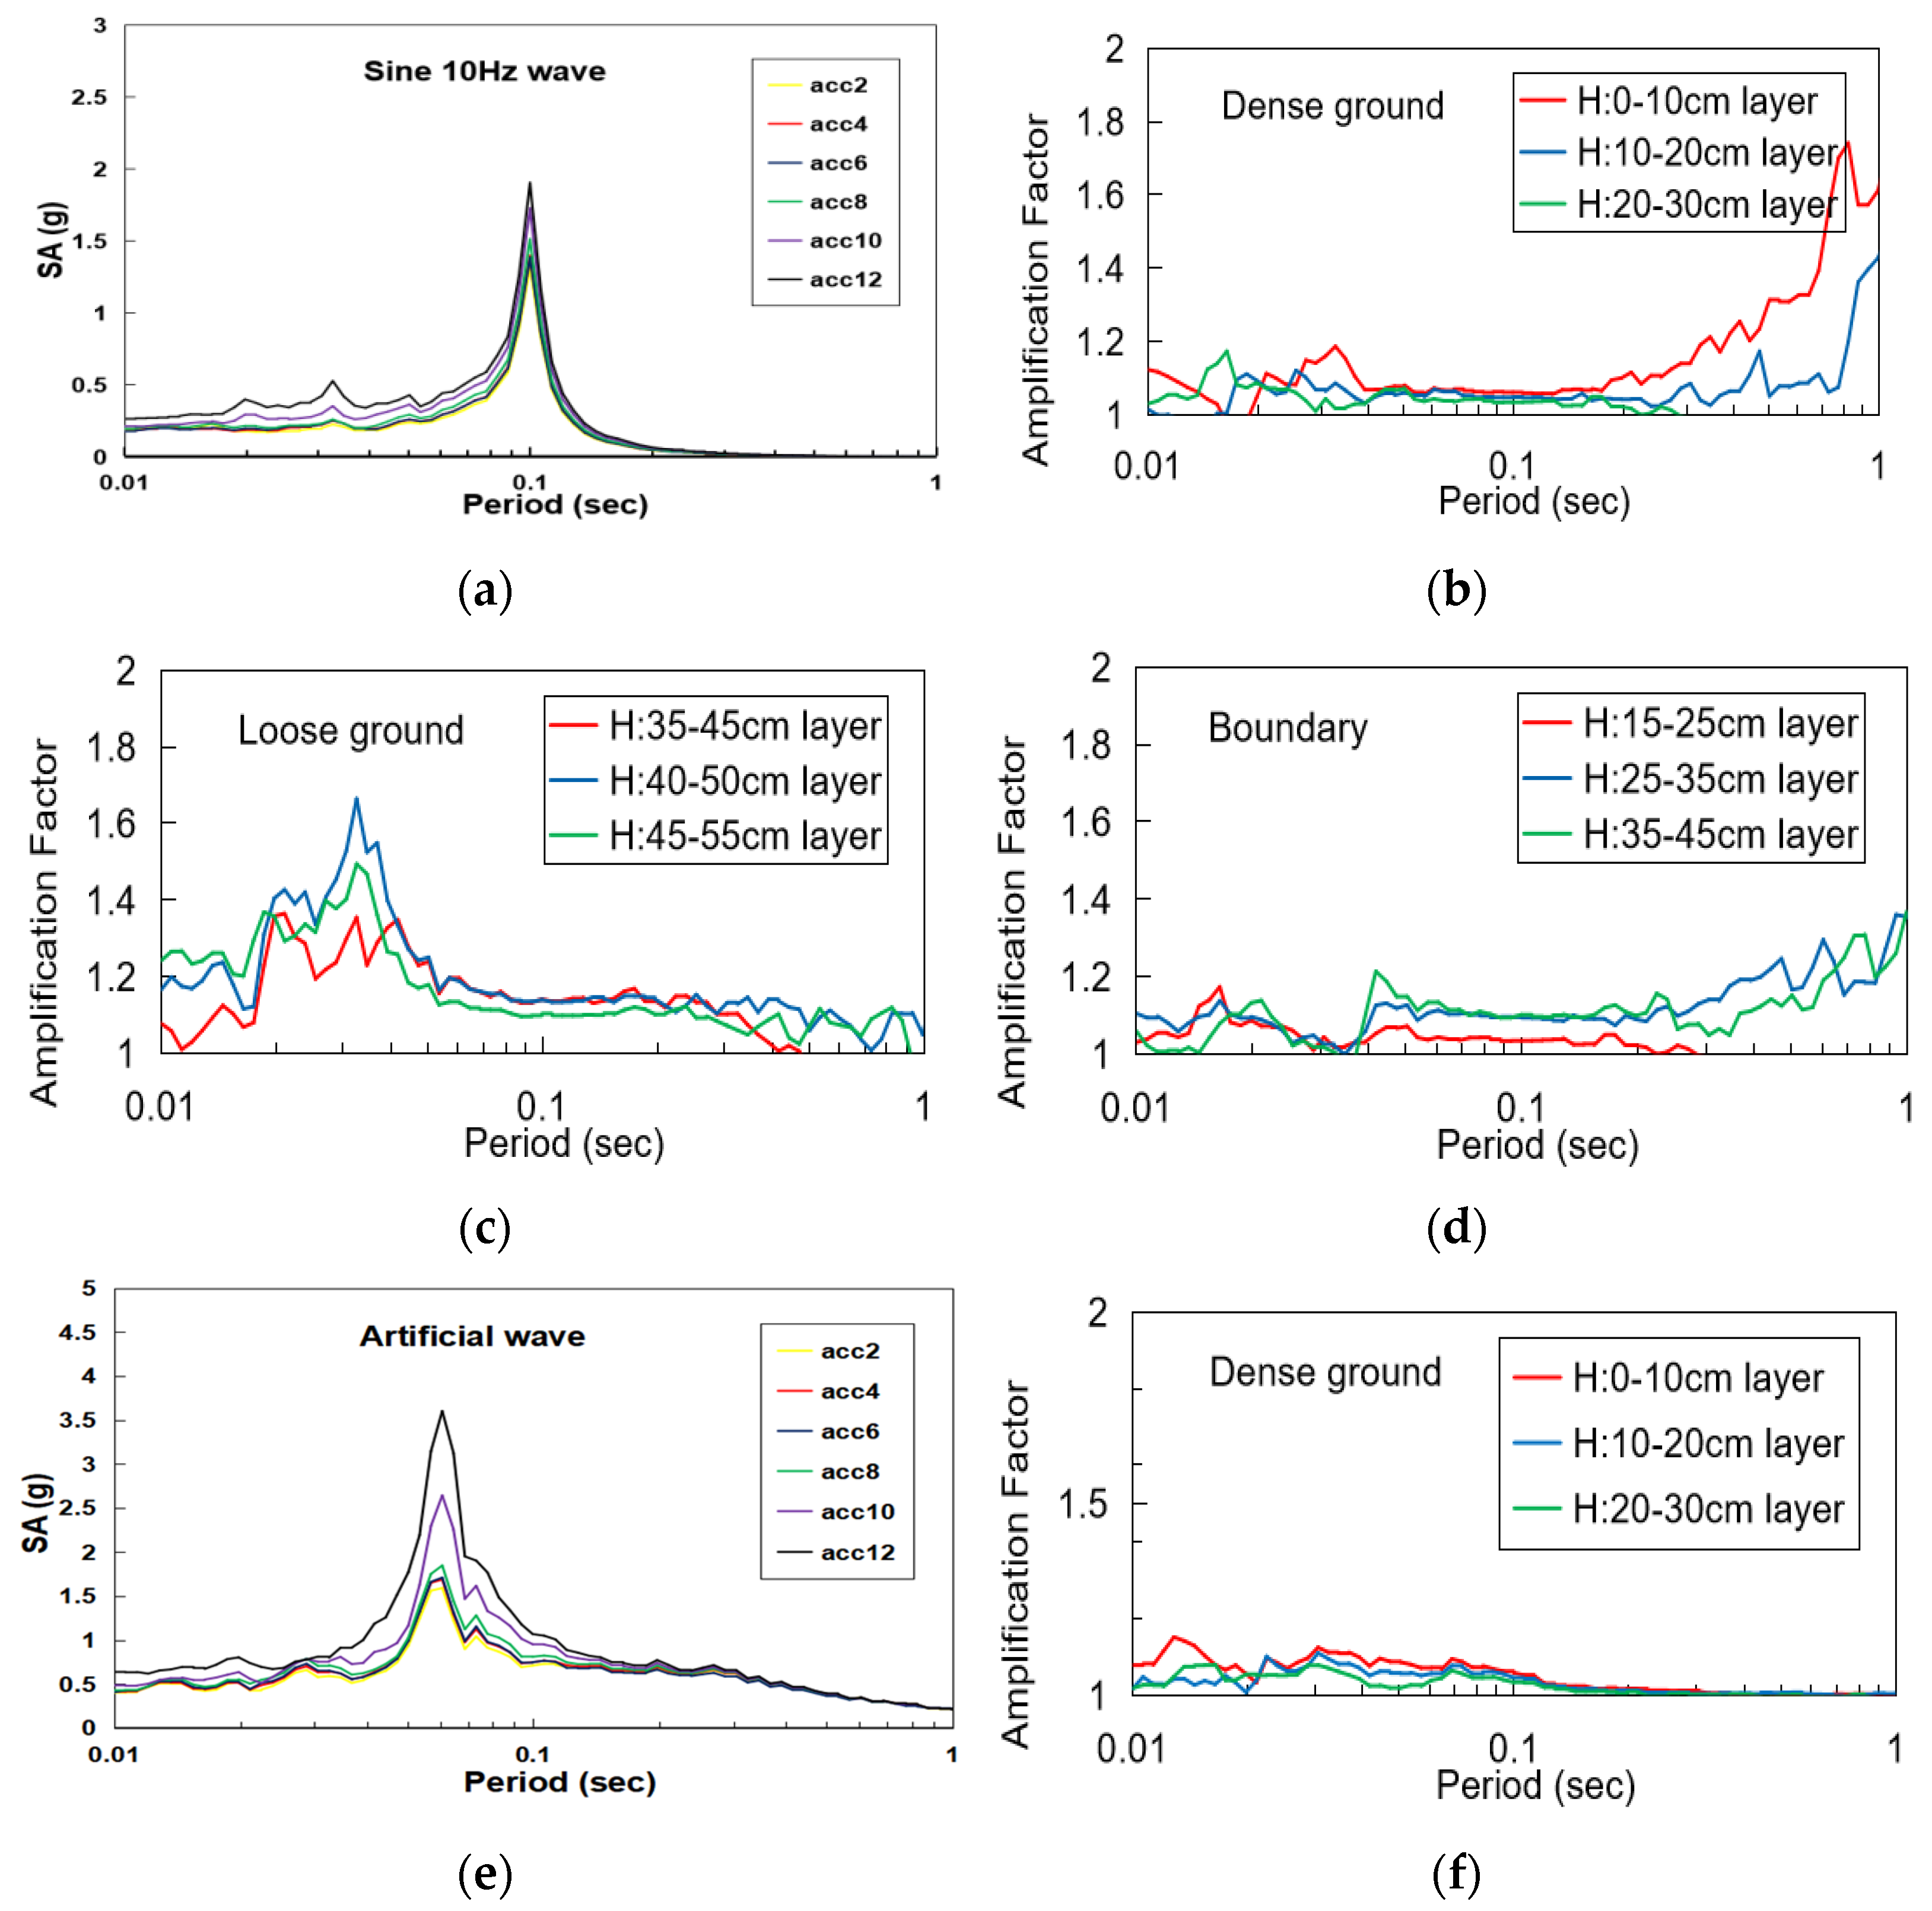
3.3. Response Spectral Acceleration
4. Comparison and Analysis of Response Acceleration Results between the Experiment and Numerical Simulation Model
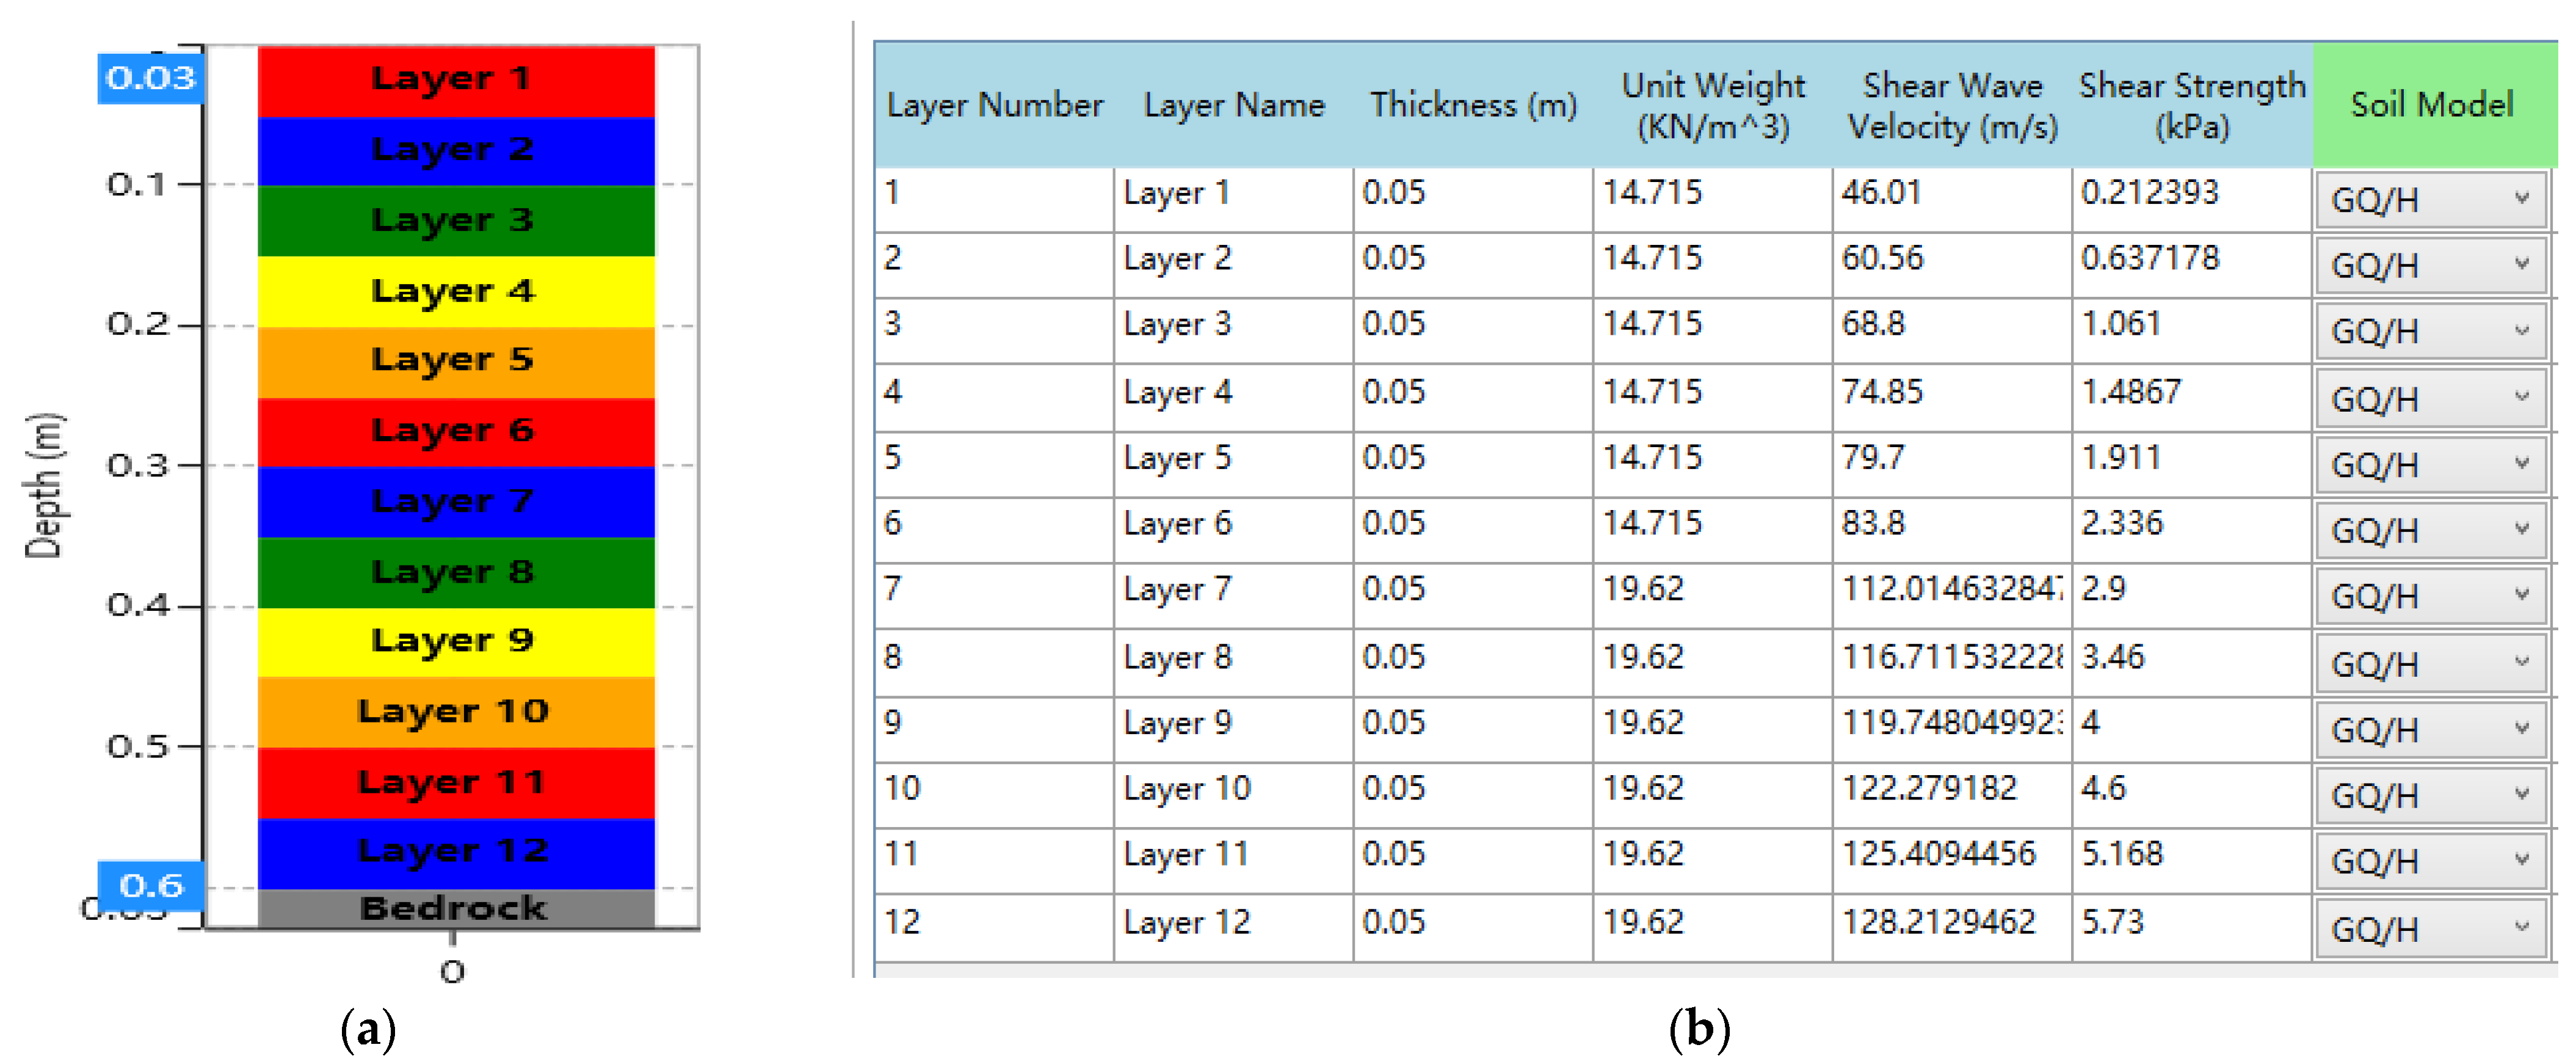
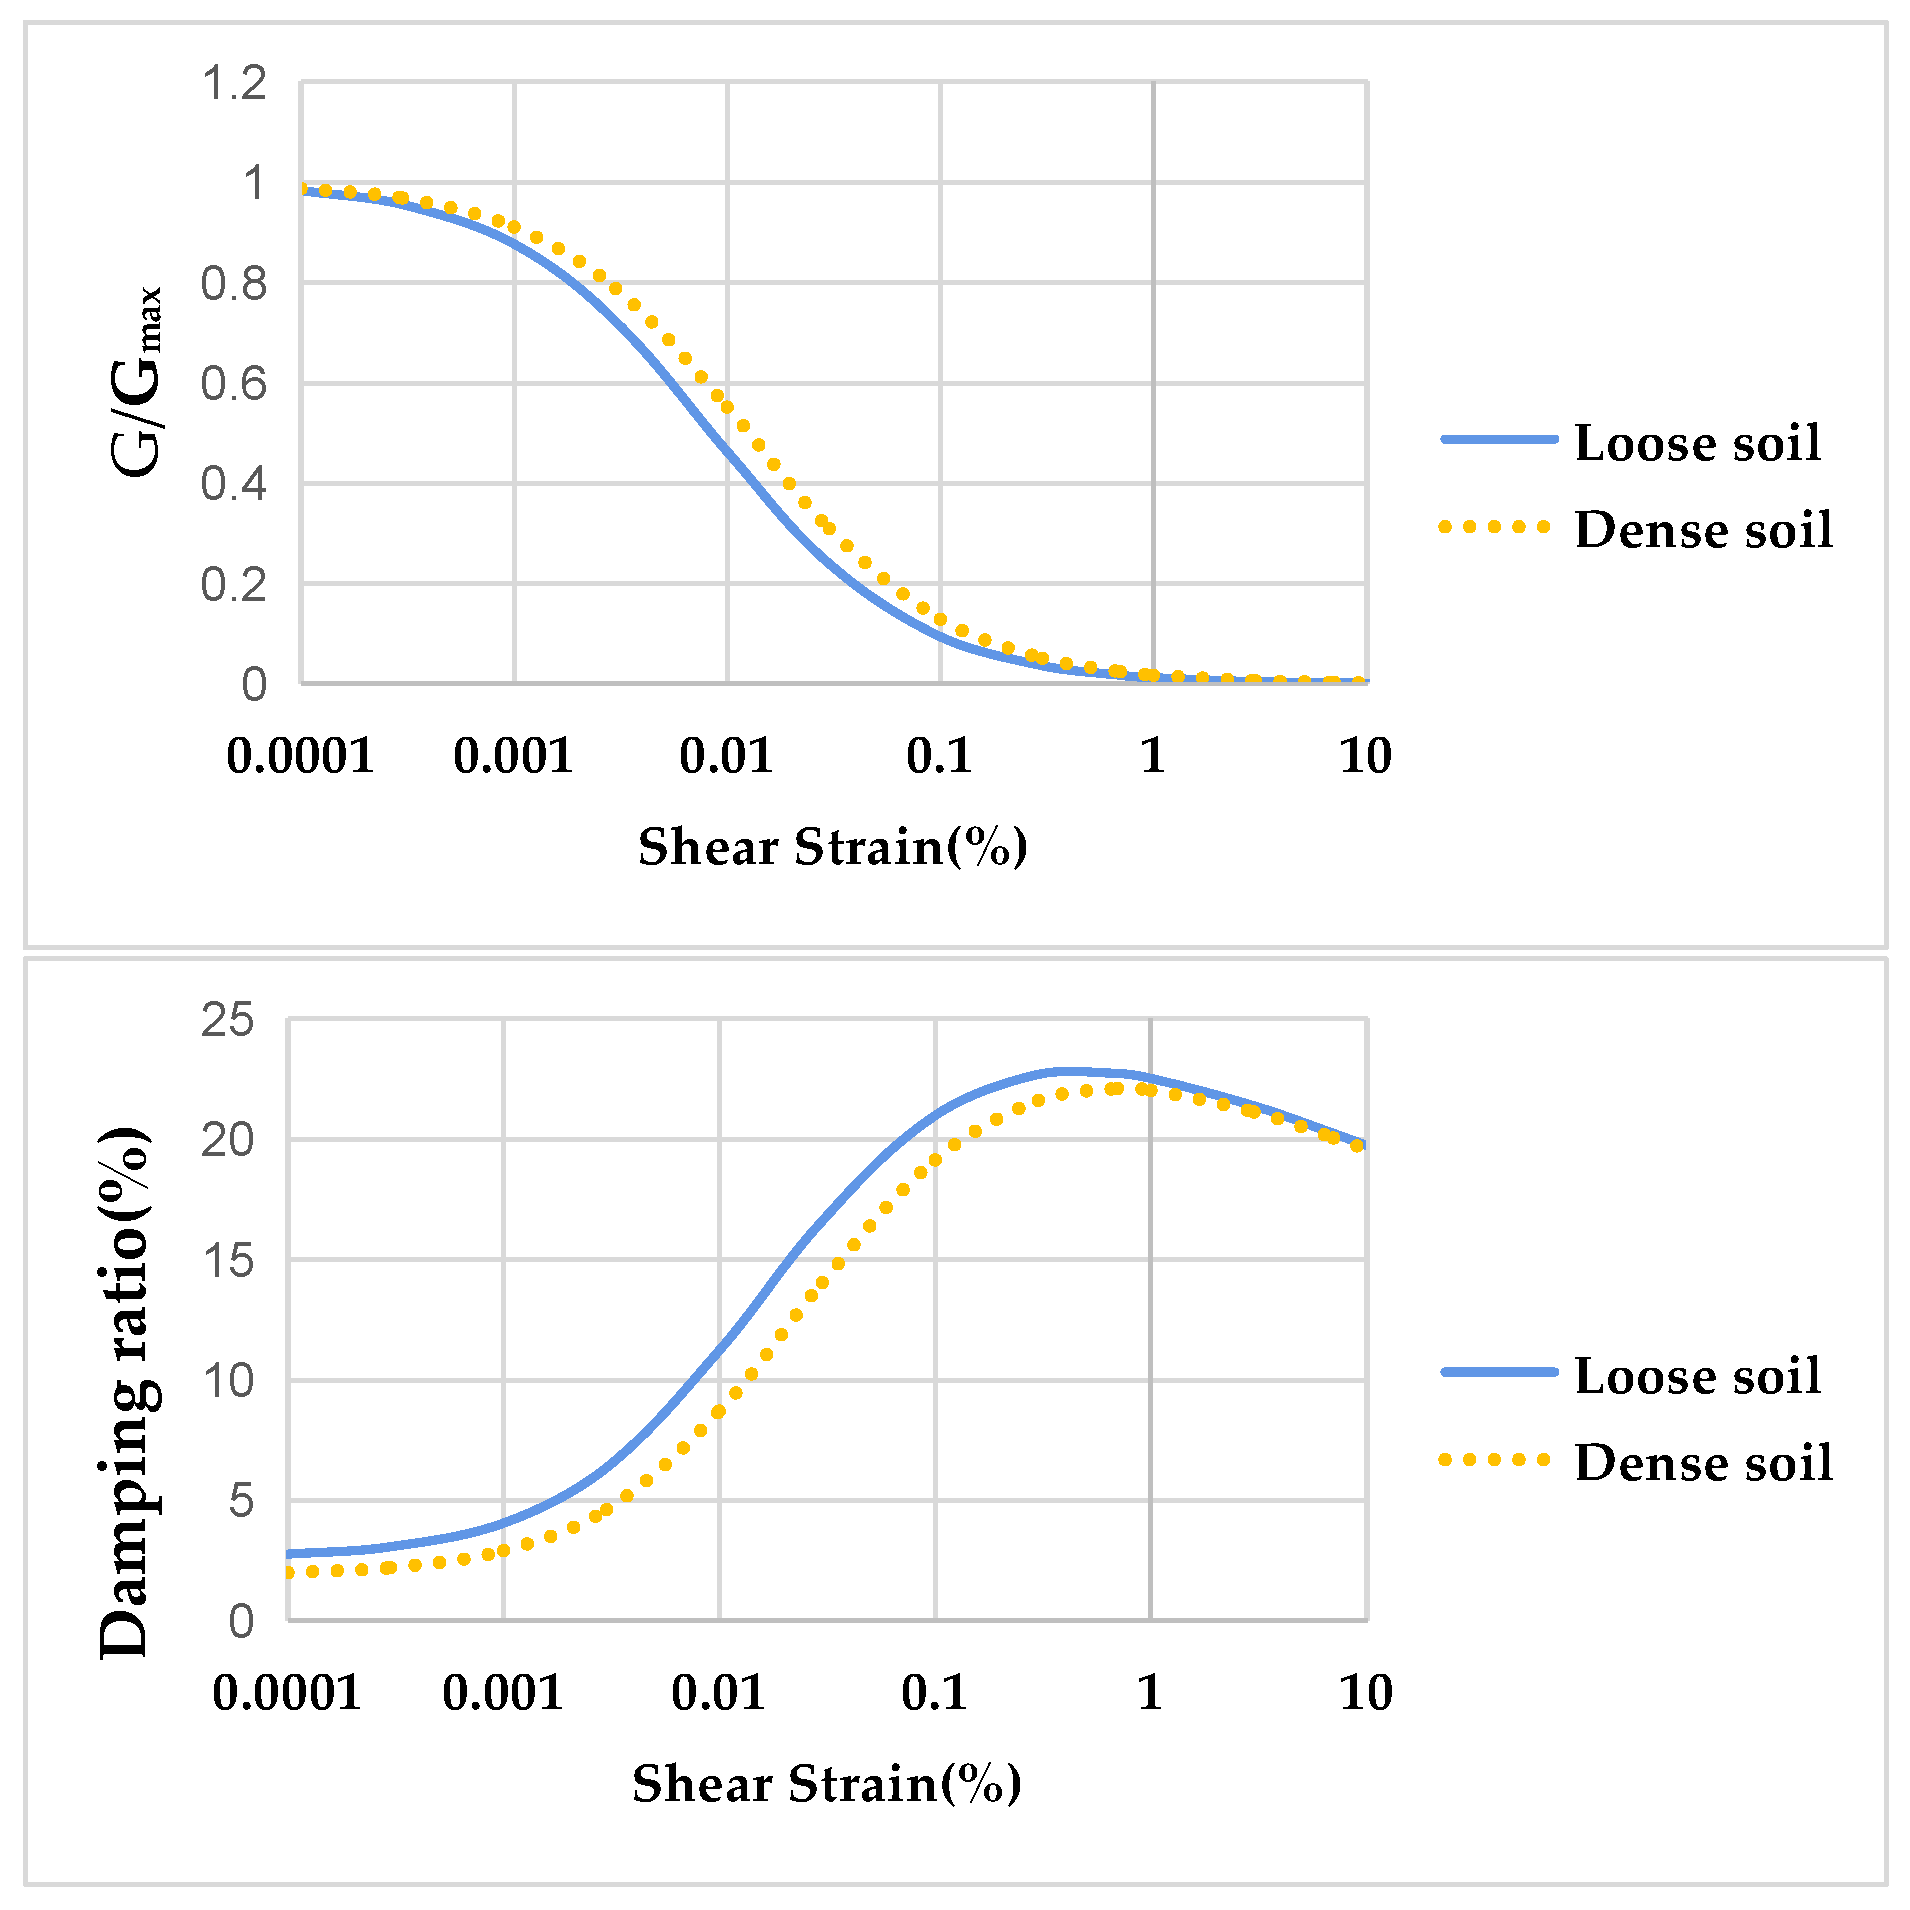
4.1. One-Dimensional Ground Response Numerical Simulation Model
4.2. Comparison of Numerical Analysis Results and Shaking Table Test Results
5. Summary and Conclusions
- (1)
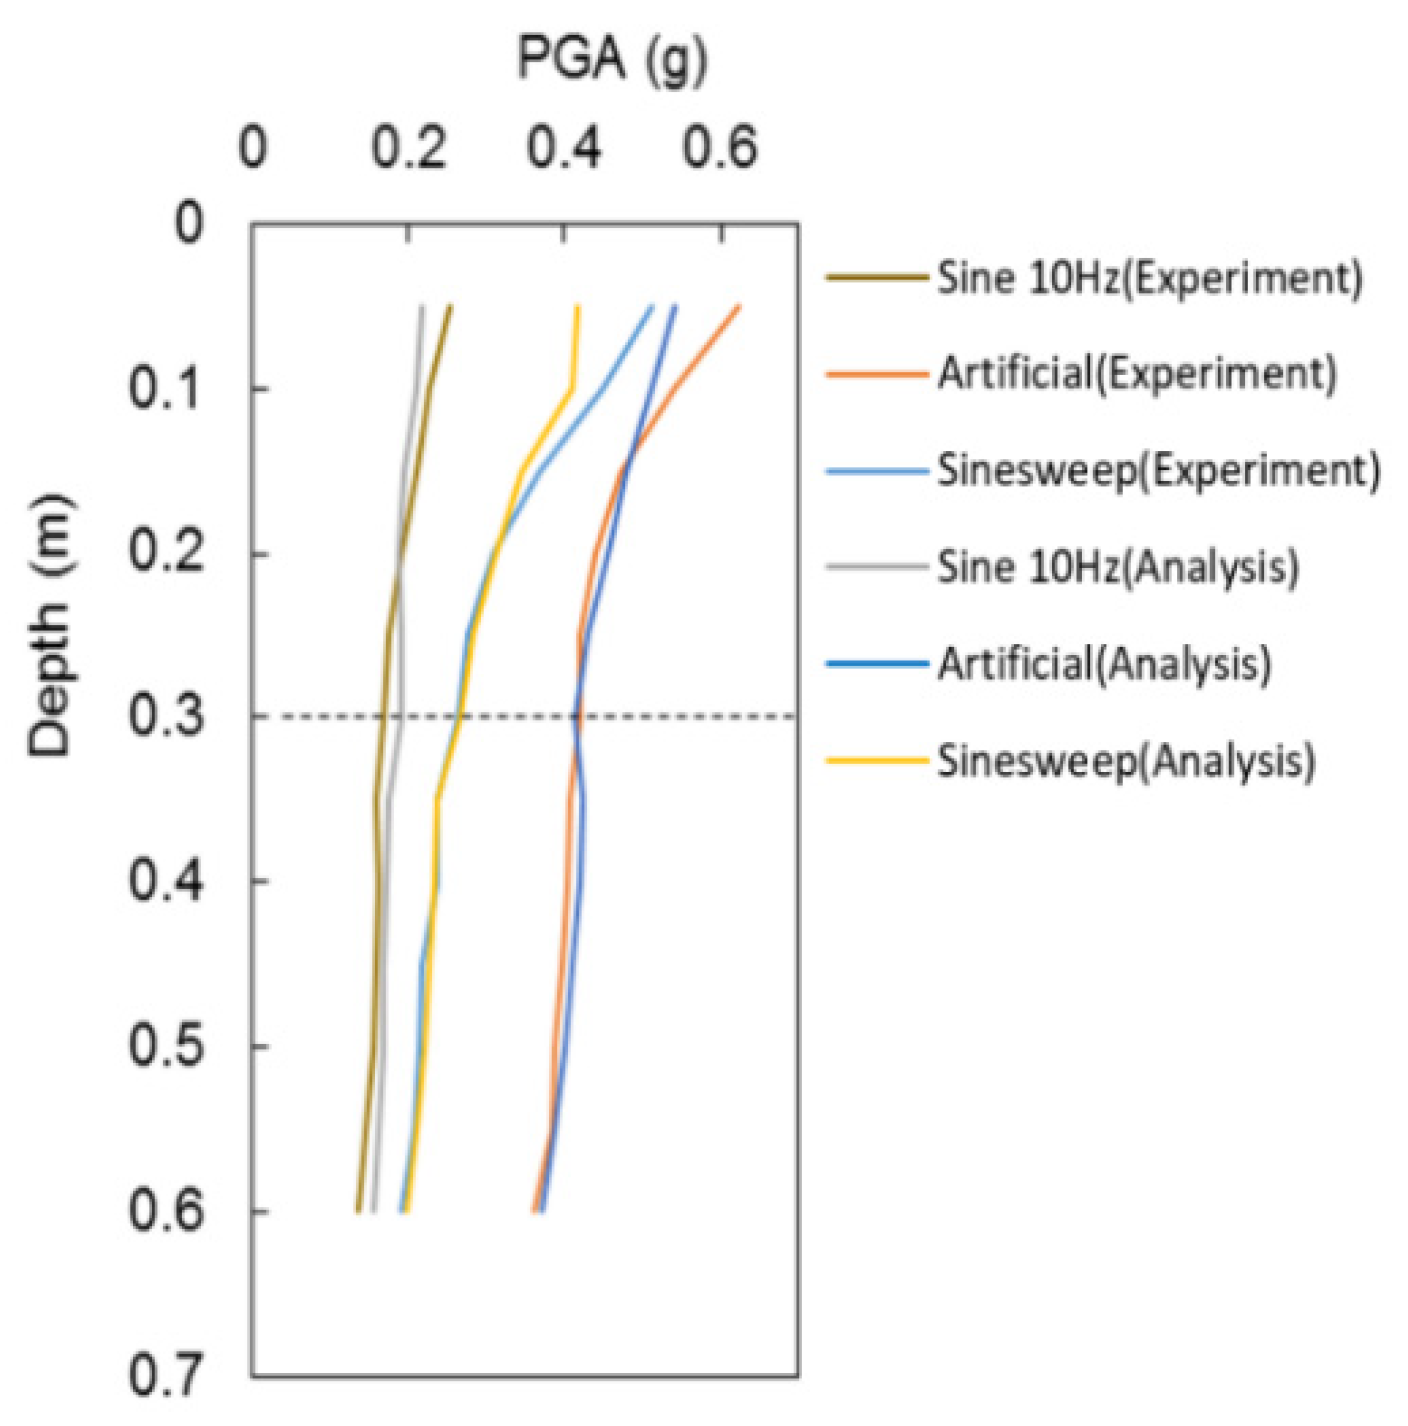
- In the absence of resonance, experimental results under a sine 10 Hz wave showed that the acceleration increase of loose ground is larger than that of dense ground on multilayered ground by PGA and SA. In the cases of artificial seismic waves and sine sweep waves, resonance appeared at the top of the experimental model, resulting in the increase of acceleration.
- (2)
- The response spectral acceleration confirmed that acceleration was amplified with depth decreases, that the upper ground amplification factor was more amplified on loose ground, and that the lower ground amplification factor was less amplified on dense ground. Compared to the amplification factor of the multilayered boundary, the inter-layer boundary was found to be amplified to the middle of the lower layers. Moreover, the spectral acceleration amplification factor of the inter-layer boundary is between that of the lower layer and the upper layer.
- (3)
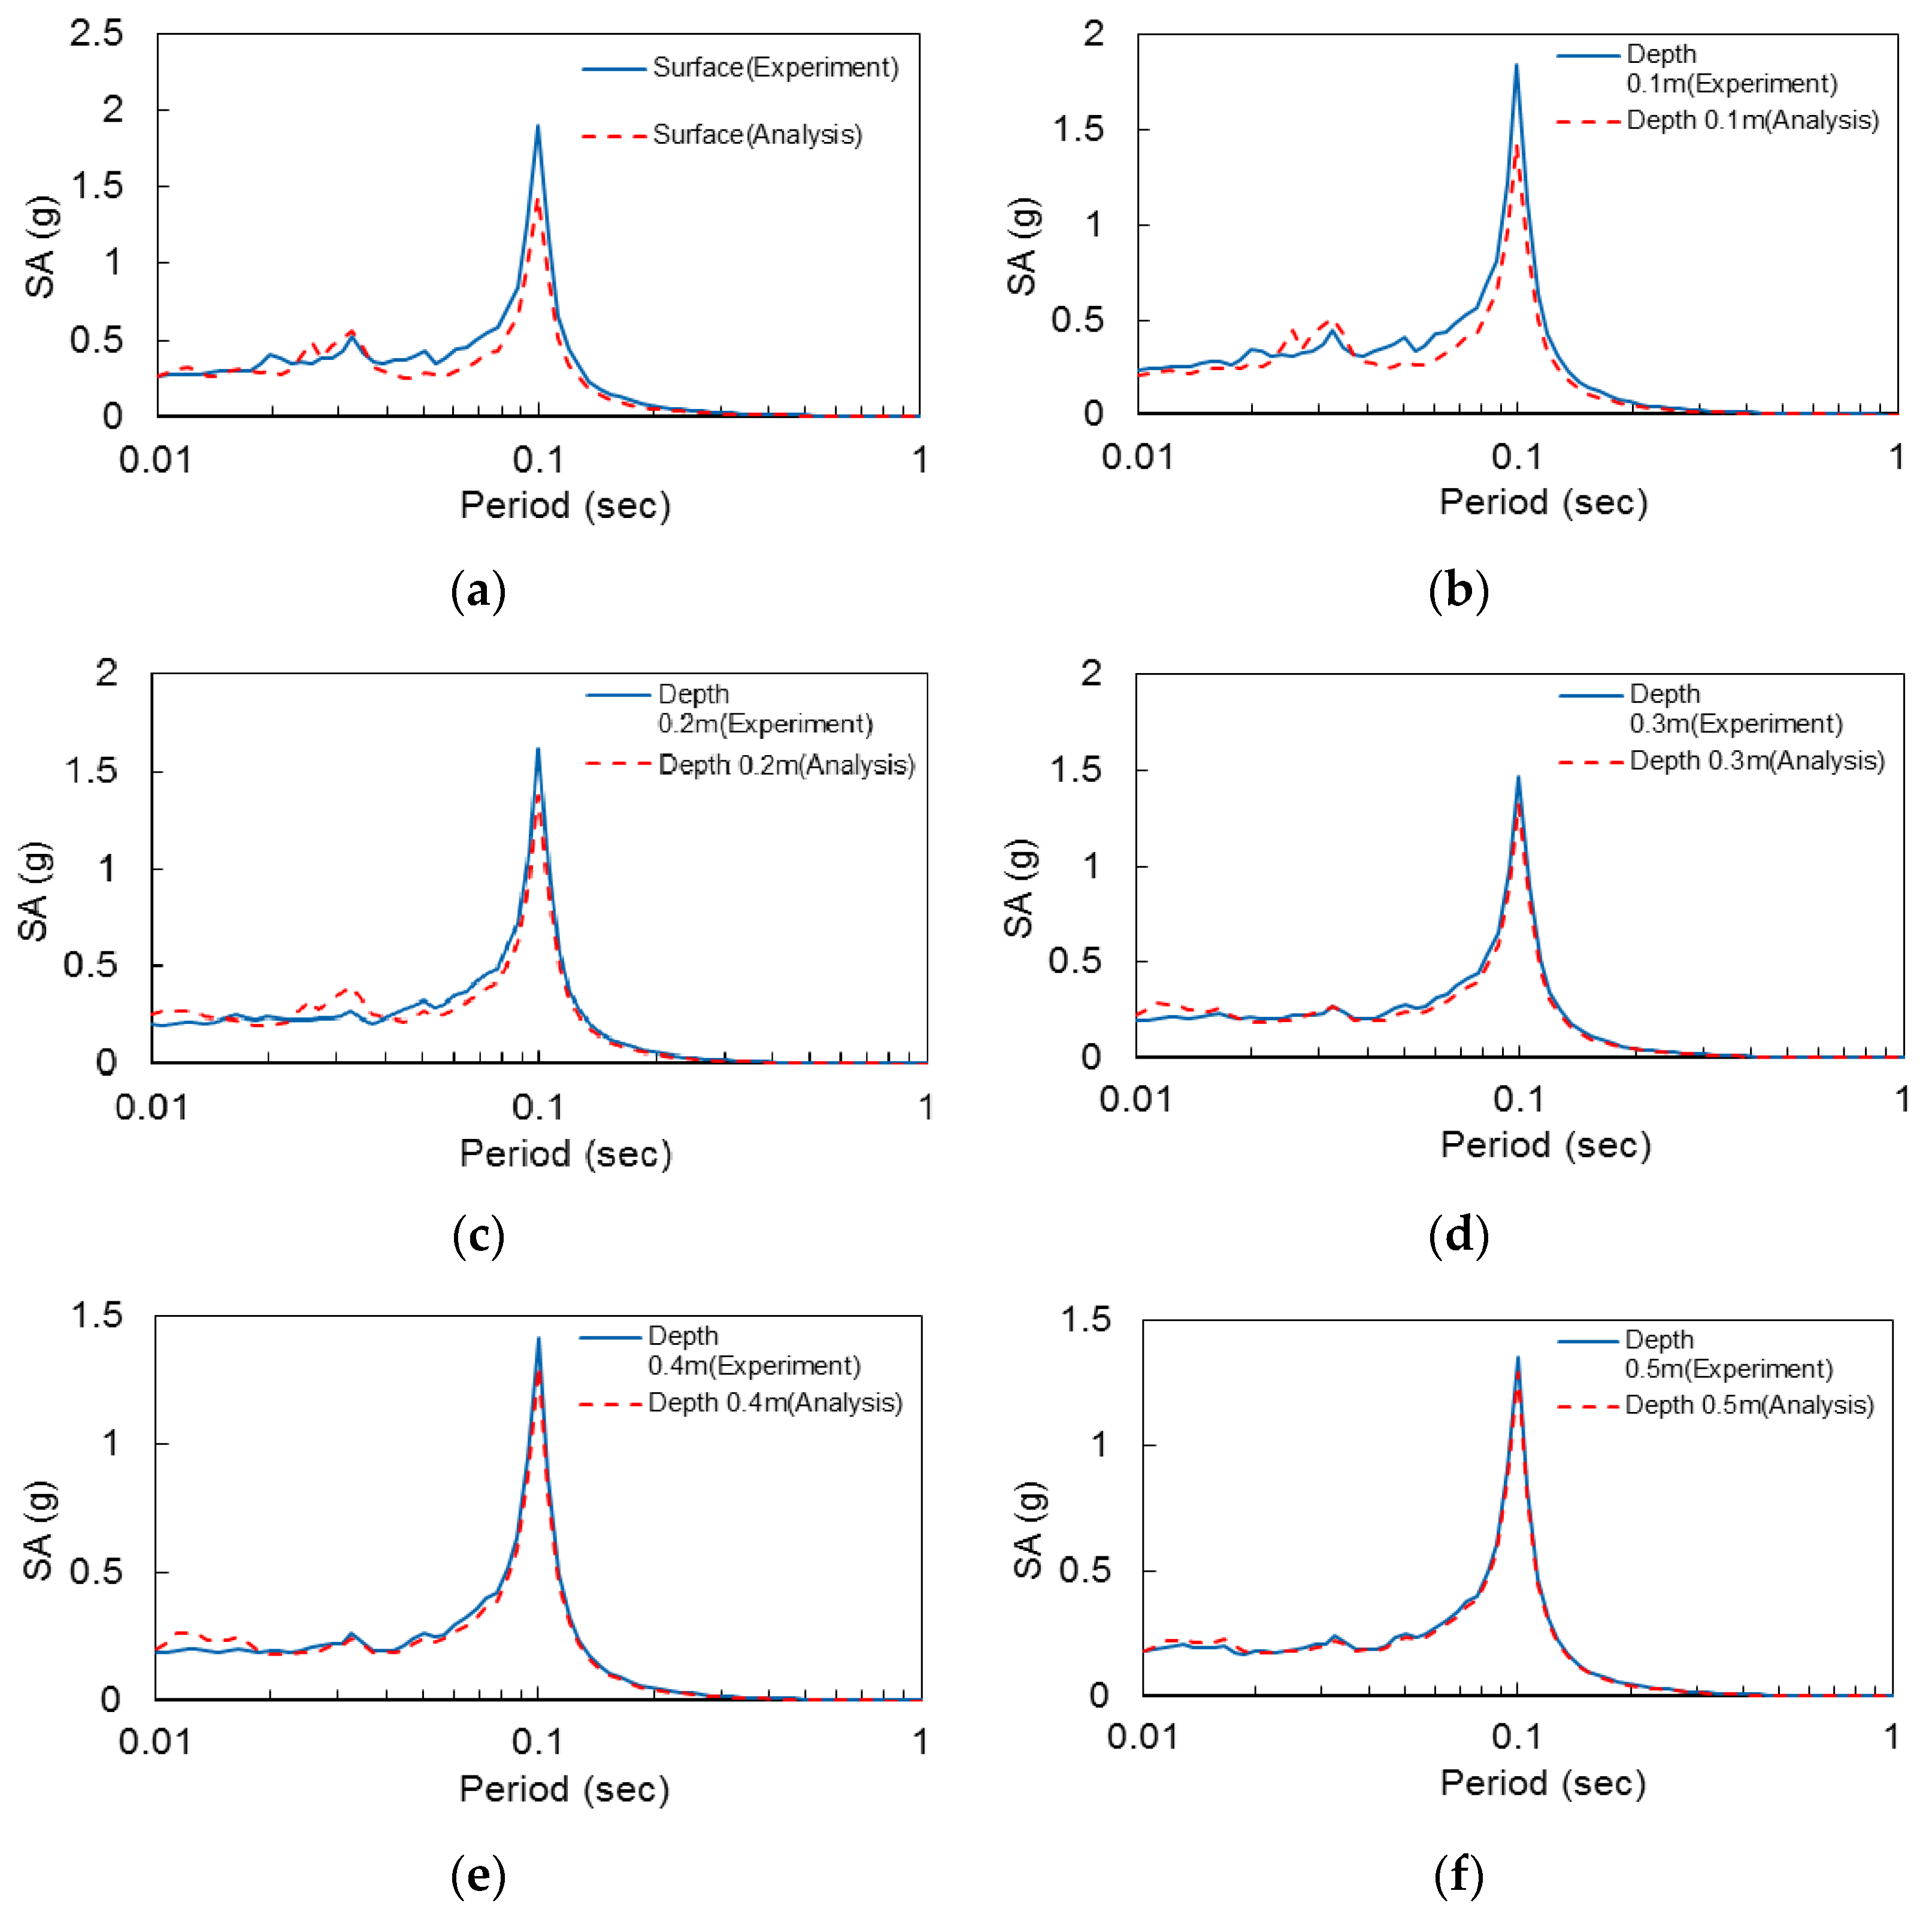
- Comparing the experimental results and numerical analysis results of the 1 g shaking table at different depths, it could be seen that the dense ground with 0.3–0.5 m had almost the same experimental and numerical analysis results. In addition, the surface layer that simulates the loose ground layer from surface to 0.3 m has some differences compared to the dense ground, but it has been found to predict the main amplification cycle well.
- (4)
- As a result of mutual comparison with the one-dimensional ground response analysis using DEEPSOIL, it was confirmed that the peak ground acceleration was generally consistent with the experimental value of each input seismic shaking. In addition, the difference between the experimental results and the numerical analysis results increases with the increase in height. The accuracy of the data is guaranteed by using multiple waveforms to simulate the multilayered ground.
- (5)
- In this study, scaled-down model experiments were carried out based on a 1 g shaking table. Overall, the results obtained using the DEEPSOIL numerical analysis software compare well with the 1 g shaking table test results performed on multilayered ground. However, there are still some limitations in using DEEPSOIL. In the future, we will focus more on large-scale flat ground and slopes, use 2D/3D simulation software for numerical simulation analysis based on the 1 g shaking table test, and study actual cases to analyze the dynamic behavior of soil.
Author Contributions
Funding
Institutional Review Board Statement
Informed Consent Statement
Data Availability Statement
Conflicts of Interest
References
- Murao, H.; Nakai, K.; Noda, T.; Yoshikawa, T. Deformation–failure mechanism of saturated fill slopes due to resonance phenomena based on 1 g shaking-table tests. Can. Geotech. J. 2018, 55, 1668–1681. [Google Scholar] [CrossRef] [Green Version]
- Shinoda, M.; Watanabe, K.; Sanagawa, T.; Abe, K.; Nakamura, H.; Kawai, T.; Nakamura, S. Dynamic behavior of slope models with various slope inclinations. Soils Found. 2015, 55, 127–142. [Google Scholar] [CrossRef] [Green Version]
- Yang, J. Saturation effects on horizontal and vertical motions in a layered soil–bedrock system due to inclined SV waves. Soil Dyn. Earthq. Eng. 2001, 21, 527–536. [Google Scholar] [CrossRef]
- Wartman, J.; Seed, R.B.; Bray, J.D. Shaking table modeling of seismically induced deformations in slopes. J. Geotech. Geoenviron. Eng. 2005, 131, 610–622. [Google Scholar] [CrossRef]
- Brennan, A.J.; Madabhushi, S.P.G. Amplification of seismic accelerations at slope crests. Can. Geotech. J. 2009, 46, 585–594. [Google Scholar] [CrossRef]
- Abe, K.; Nakamura, S.; Nakamura, H.; Shiomi, K. Numerical study on dynamic behavior of slope models including weak layers from deformation to failure using material point method. Soils Found. 2017, 57, 155–175. [Google Scholar] [CrossRef]
- Hou, C.; Zhang, T.; Sun, Z.; Dias, D.; Shang, M. Seismic analysis of nonhomogeneous slopes with cracks using a discretization kinematic approach. Int. J. Geomech. 2019, 19, 04019104. [Google Scholar] [CrossRef]
- Goktepe, F.; Celebi, E.; Omid, A.J. Numerical and experimental study on scaled soil-structure model for small shaking table tests. Soil Dyn. Earthq. Eng. 2019, 119, 308–319. [Google Scholar] [CrossRef]
- Song, D.; Che, A.; Zhu, R.; Ge, X. Natural frequency characteristics of rock masses containing a complex geological structure and their effects on the dynamic stability of slopes. Rock Mech. Rock Eng. 2019, 52, 4457–4473. [Google Scholar] [CrossRef]
- Zhang, J.; Yuan, Y.; Yu, H. Shaking table tests on discrepant responses of shaft-tunnel junction in soft soil under transverse excitations. Soil Dyn. Earthq. Eng. 2019, 120, 345–359. [Google Scholar] [CrossRef]
- Nakamura, S. Analysis of behavior of slope models for collapsing from stability by shaking table tests under 1G field. In MATEC Web of Conferences; EDP Sciences: Les Ulis, France, 2019; Volume 258, p. 05004. [Google Scholar]
- Jin, Y.; Kim, H.; Kim, D.; Lee, Y.; Kim, H. Seismic Response of Flat Ground and Slope Models through 1 g Shaking Table Tests and Numerical Analysis. Appl. Sci. 2021, 11, 1875. [Google Scholar] [CrossRef]
- Kim, H.; Kim, D.; Lee, Y.; Kim, H. Effect of soil box boundary conditions on dynamic behavior of model soil in 1 g shaking table test. Appl. Sci. 2020, 10, 4642. [Google Scholar] [CrossRef]
- Sun, C.G.; Han, J.T.; Cho, W. Representative shear wave velocity of geotechnical layers by synthesizing in-situ seismic test data in Korea. J. Eng. Geol. 2012, 22, 293–307. [Google Scholar] [CrossRef] [Green Version]
- Kaklamanos, J.; Bradley, B.A. Challenges in predicting seismic site response with 1D analyses: Conclusions from 114 KiK-net vertical seismometer arrays. Bull. Seismol. Soc. Am. 2018, 108, 2816–2838. [Google Scholar] [CrossRef] [Green Version]
- Hashash, Y.M.A.; Musgrove, M.I.; Harmon, J.A.; Ilhan, O.; Xing, G.; Numanoglu, O.; Groholski, D.R.; Phillips, C.A.; Park, D. DEEPSOIL 7.0, User Manual; Board of Trustees of University of Illinois at Urbana-Champaign: Urbana, IL, USA, 2020. [Google Scholar]
- American Society of Civil Engineers. Minimum Design Loads and Associated Criteria for Buildings and Other Structures; American Society of Civil Engineers: Reston, VA, USA, 2022. [Google Scholar]
- Labuz, J.F.; Zang, A. Mohr–coulomb failure criterion. In The ISRM Suggested Methods for Rock Characterization, Testing and Monitoring: 2007–2014; Springer: Cham, Switzerland, 2012; pp. 227–231. [Google Scholar]
- Hardin, B.O.; Drnevich, V.P. Shear modulus and damping in soils: Design equations and curves. J. Soil Mech. Found. Div. 1972, 98, 667–692. [Google Scholar] [CrossRef]
- Darendeli, M.B. Development of a New Family of Normalized Modulus Reduction and Material Damping Curves; The university of Texas at Austin: Austin, TX, USA, 2001. [Google Scholar]








| Parameter | Value | Parameter | Value |
|---|---|---|---|
| No. 200 Passing (%) | 10.8 | emax | 1.123 |
| Gs | 2.69 | emin | 0.443 |
| OMC (%) | 12.5 | rd max (kN/m3) | 18.27 |
| PI (%) | NP | rd min (kN/m3) | 12.43 |
| USCS | SW-SM | Elastic modulus (Pa) | 2 × 10⁷ |
| Internal friction angle (°) | 27.7° | Dilatancy Angle (°) | 24.4° |
| Parameter | Value | Parameter | Value |
|---|---|---|---|
| No. 200 Passing (%) | 6.48 | emax | 0.923 |
| Gs | 2.63 | emin | 0.487 |
| rd max (kN/m3) | 18.95 | OMC (%) | 8.14 |
| rd min (kN/m3) | 14.65 |
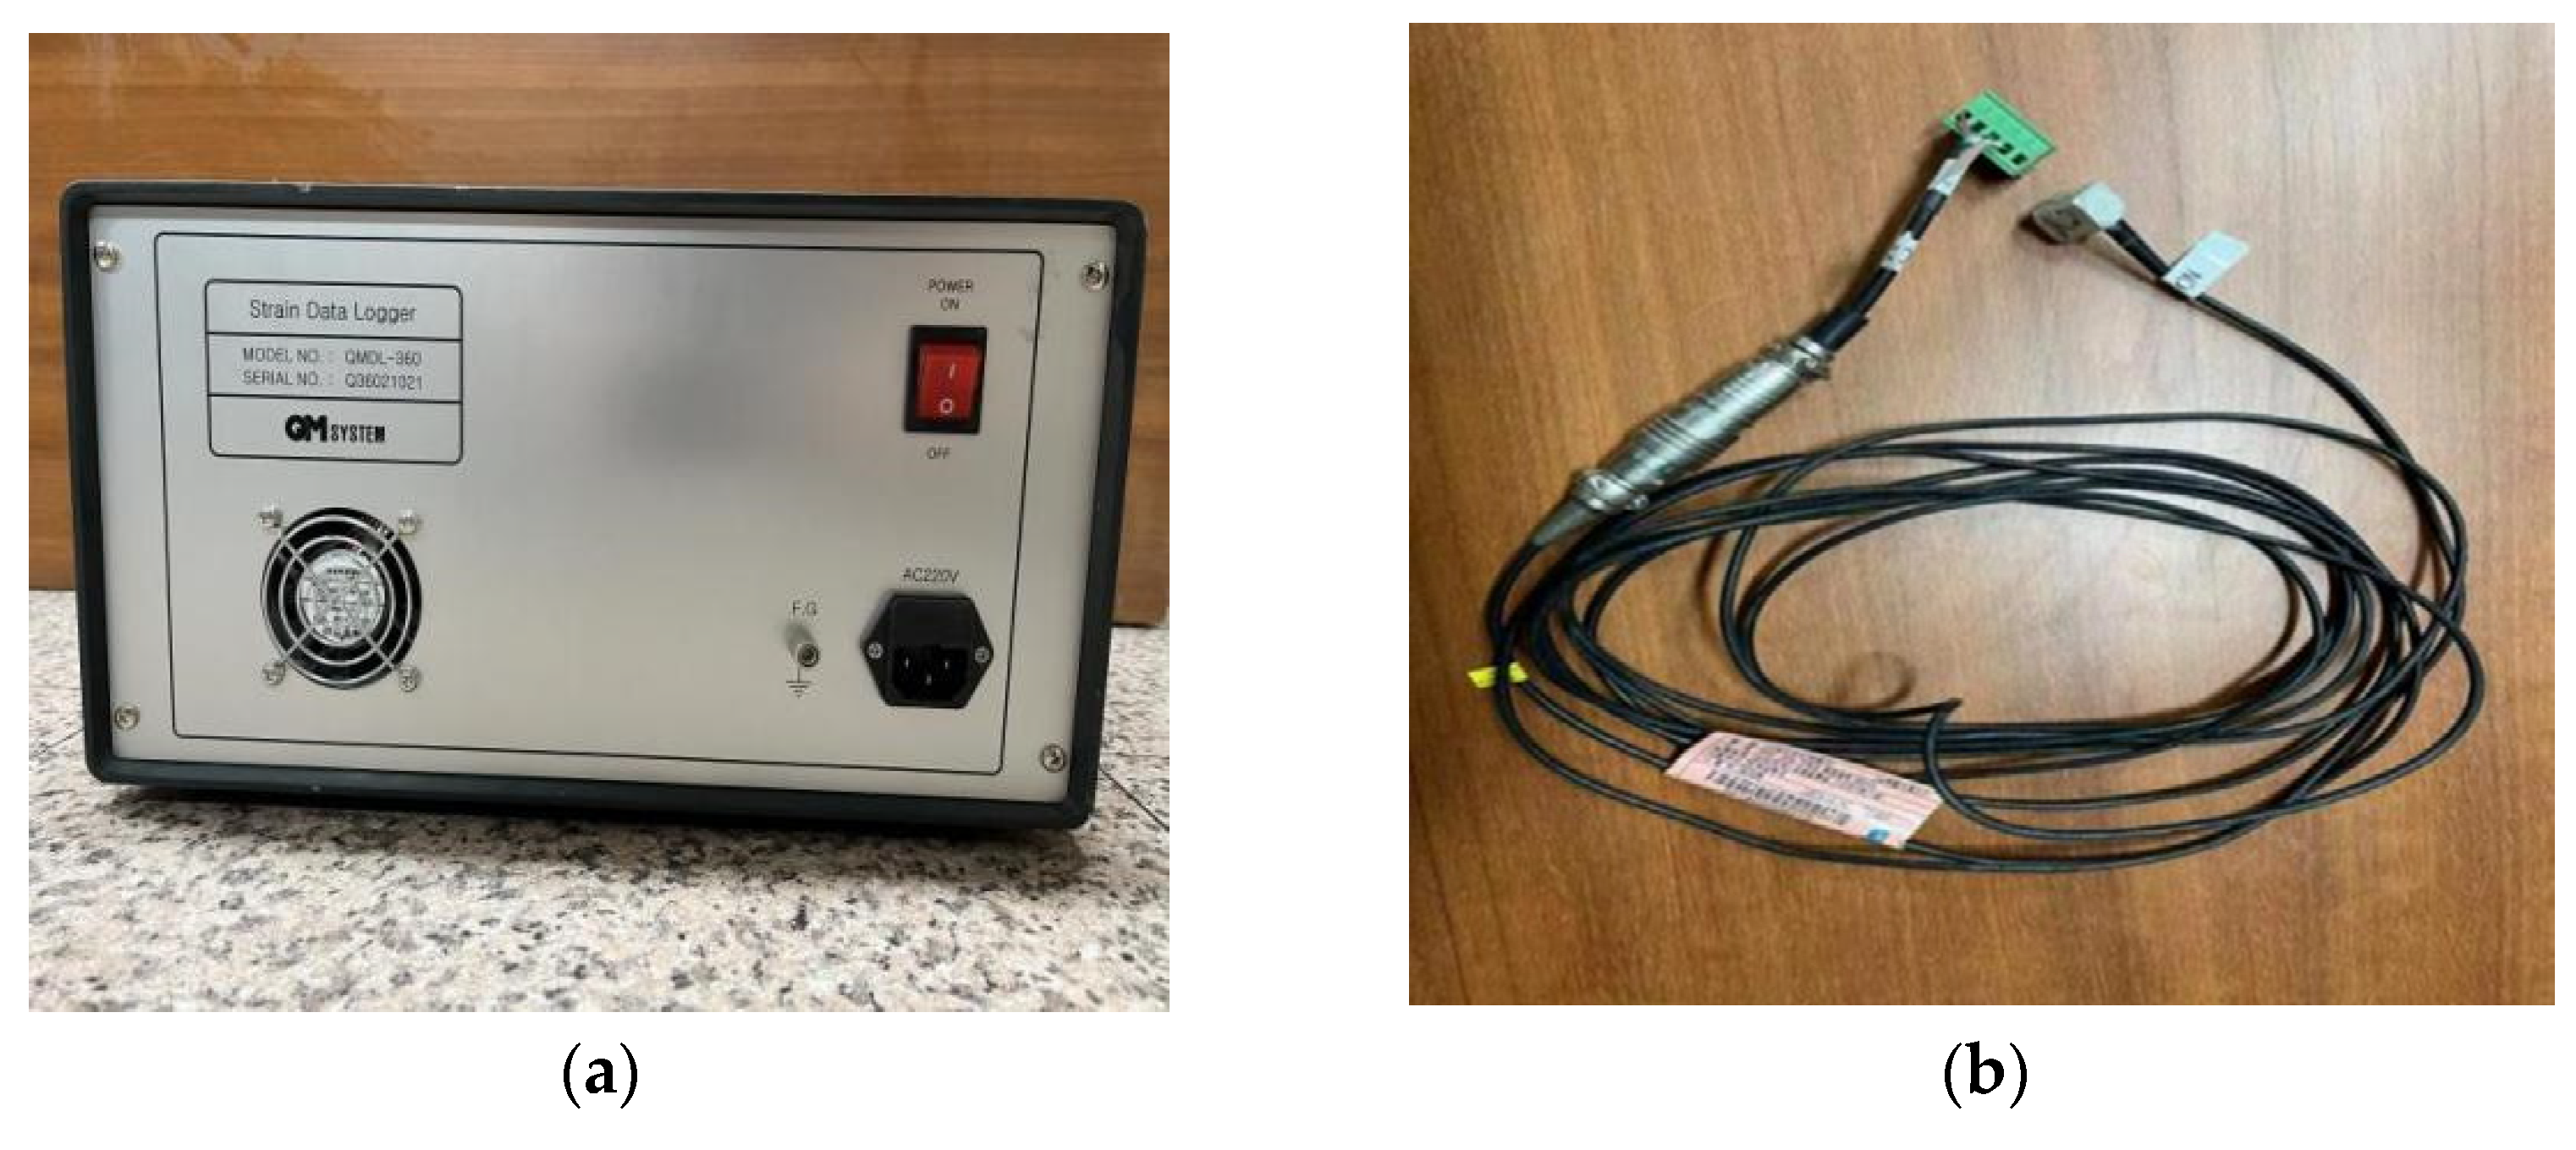
| Parameter (Accelerometer) | Value | Parameter (Data Logger) | Value |
|---|---|---|---|
| Model | ARF-20A | Model | SDL-350R |
| Capacity | 20 m/s2 | Number of channel | 24 |
| Rateped Output(RO) | 0.5 mV/V | Input Sensor | 4Gage |
| Frequency Response Range | DC~80 Hz | Low Pass filter | 10 Hz/100 Hz/1000 Hz/Pass |
| Natural Frequency | 150 Hz | Measure Hz | 200 Hz |
| Allowable Temperature | −10~50 °C |
| Parameter | Value | Parameter | Value |
|---|---|---|---|
| Thickness (m) | 0.05 | Unit weight (kN/m3) | 14.715 (loose soil) 19.62 (dense soil) |
| Shear wave velocity (m/s) | 46.01 | Effective vertical stress (kPa) | 0.367875 |
| Shear strength (kPa) | 0.212393 |
Publisher’s Note: MDPI stays neutral with regard to jurisdictional claims in published maps and institutional affiliations. |
© 2022 by the authors. Licensee MDPI, Basel, Switzerland. This article is an open access article distributed under the terms and conditions of the Creative Commons Attribution (CC BY) license (https://creativecommons.org/licenses/by/4.0/).
Share and Cite
Jin, Y.; Kim, D.; Jeong, S.; Kim, H. Analysis of Multilayered Ground Amplification Characteristics by Scaled-Down Model Tests. Appl. Sci. 2022, 12, 3432. https://doi.org/10.3390/app12073432
Jin Y, Kim D, Jeong S, Kim H. Analysis of Multilayered Ground Amplification Characteristics by Scaled-Down Model Tests. Applied Sciences. 2022; 12(7):3432. https://doi.org/10.3390/app12073432
Chicago/Turabian StyleJin, Yong, Daehyeon Kim, Sugeun Jeong, and Hoyeon Kim. 2022. "Analysis of Multilayered Ground Amplification Characteristics by Scaled-Down Model Tests" Applied Sciences 12, no. 7: 3432. https://doi.org/10.3390/app12073432
APA StyleJin, Y., Kim, D., Jeong, S., & Kim, H. (2022). Analysis of Multilayered Ground Amplification Characteristics by Scaled-Down Model Tests. Applied Sciences, 12(7), 3432. https://doi.org/10.3390/app12073432


