Abstract
Wheat is one of the most important crops in the world, mainly used for human consumption and animal feed. To overcome the increasing demand in wheat production, it is necessary to better understand the mechanisms involved in the growth of the wheat grain. X-ray computed tomography is an efficient method for the non-destructive investigation of the 3D architecture of biological specimens, which does not require staining, sectioning, or inclusion. In particular, phase-contrast tomography results in images with better contrast and an increased resolution compared to that obtained with laboratory tomography devices. The aim of this study was to investigate the potential of phase-contrast tomography for the study of the anatomy of the wheat grain at early stages of development. We provided 3D images of entire grains at various development stages. The image analysis allowed identifying a large number of tissues, and to visualize individual cells. Using a high-resolution setup, finer details were obtained, making it possible to identify additional tissues. Three-dimensional rendering of the grain also revealed the pattern resulting from the epidermis cells. X-ray phase-contrast tomography appears as a promising imaging method for the study of the 3D anatomy of plant organs and tissues.
1. Introduction
Wheat is one of the most important crops in the world, mainly used for human consumption and animal feed. To overcome the increasing demand in wheat production, one of the solutions is to increase the final weight of the individual grain. Moreover, the wheat grain shape influences milling performance, an important step of grain processing [1,2]. Final grain weight and shape are linked to grain dimensions. To improve the knowledge of the determinism of grain dimensions, it is necessary to have a better comprehension of the growth mechanisms within the grain, and to better describe the changes in composition, morphology, and mechanical properties of the cells and tissues that compose the grain.
Wheat grain is a complex organ composed of three major parts: the embryo, the starchy endosperm, and the outer layers, all including several tissues with distinct functions [3]. The final grain shape and size result from developmental processes occurring in those three main parts of the grain. The grain development is initiated by ovule fertilization. However, it is highly dependent on the prior ovary development [4]. Grain development is classically divided into three phases: early-(lag-) phase (from 10 to 15 days after anthesis), filling phase, and maturation phase [5].
At anthesis, the wheat ovary consists of ovary tissues surrounding an ovule. Following fertilization, the ovary epidermis and parenchyma give the grain pericarp tissues (epicarp or pericarp epidermis and mesocarp, or pericarp parenchyma), while the endosperm and embryo develop. In the very early stages of development, the cereal grain is composed mostly of outer tissues: pericarp and integuments. The endosperm forms from free nuclei, then cellularization takes place followed by cell division, and cell differentiation into starchy endosperm, aleurone, and transfer cells. At the end of the early phase of development, the wheat grain reaches its final length. Between 15 and 35–40 days after anthesis, the endosperm fills with storage compounds (mainly starch and proteins). During this phase, the outer tissues undergo drastic changes. In particular, the mesocarp parenchyma cells undergo programmed cell death [6]. At the end of the filling phase, the grain enters the maturation phase and desiccates because of water loss. During this early development, the shape of the wheat grain changes from a triangular shape to an ellipsoid [7], and a crease and two lobes appear.
The study of plant tissues anatomy traditionally involves optical microscopy of stained cross-sections and this is the case for the wheat grain [8,9,10]. Early observations of wheat grain tissues were conducted using transmission or scanning electron microscopy on sections or dissected tissues [11,12,13]. However, as grain development is not spatially uniform [14], understanding the development or the physiology of the grain needs to investigate its anatomy in three dimensions.
Several possibilities are available to study entirely the 3D anatomy of a plant organ. The acquisition by optical or electron microscopy of a large number of serial sections, followed by a registration process, can lead to the reconstruction of the 3D anatomy [15,16,17,18]. Magnetic resonance imaging is a non-destructive imaging technique that can be used to analyze both the anatomy and the functions of plant tissues at the organ scale [19,20,21]. The resolution is however limited to a few dozens of microns, making it difficult to investigate thin tissues or cell organization.
X-ray computed tomography is a popular method for the non-destructive investigation of the 3D architecture of biological specimens, without requiring staining, sectioning, or inclusion. The high resolution reached by computed tomography makes it a method of choice for the investigation of plant organs [22,23,24,25,26]. X-ray computed tomography makes use of many X-ray measurements taken from different angles to produce projection images. The set of projections can be processed to generate a 3D image of the whole specimen, allowing observation through virtual slices along arbitrary angles. Dry specimens present high contrast to X-rays, and many impressive 3D reconstructions have been performed on seeds [27,28]. In the case of cereals, the resolution provided by micro-computed tomography (µCT) allows 3D imaging of the whole grain. Several studies were conducted on mature dry wheat grains [29,30,31] and barley spikes [32]. In the case of developing grain, tissues are highly hydrated and present relatively low contrast to X-rays, making the tissues difficult to distinguish [7]. The coherent beam light provided by synchrotron facilities allows phase-contrast µCT at an enhanced scale, making it possible to better differentiate the tissues within the organs [33,34,35].
Preliminary observations conducted using a laboratory microtomography (Nanotom 180, G&E) have shown that X-ray µCT is a relevant technique for in vivo 3D imaging of the developing wheat grain [7]. In those acquisitions, the spatial resolution varied between 4.4 and 15 μm/voxel allowing the visualization of the whole grain and the exploration of the grain internal structures. In particular, it allowed the distinction between an outer and an inner compartment separated by empty spaces but not the identification of the various tissues composing these compartments. By comparison with light microscopy images of cross-sections, the outer compartment was found to contain the outer pericarp, while the inner compartment encompassed several tissues: starchy endosperm, aleurone, nucellar epidermis, testa, inner pericarp, and the embryo.
Based on these results, we investigated the potential of the synchrotron radiation for a better understanding of the 3D morphology of the wheat grain at the early stages of its development. In particular, we aimed at identifying the level of the details that could be revealed depending on the experimental settings.
2. Materials and Methods
2.1. Plant Material
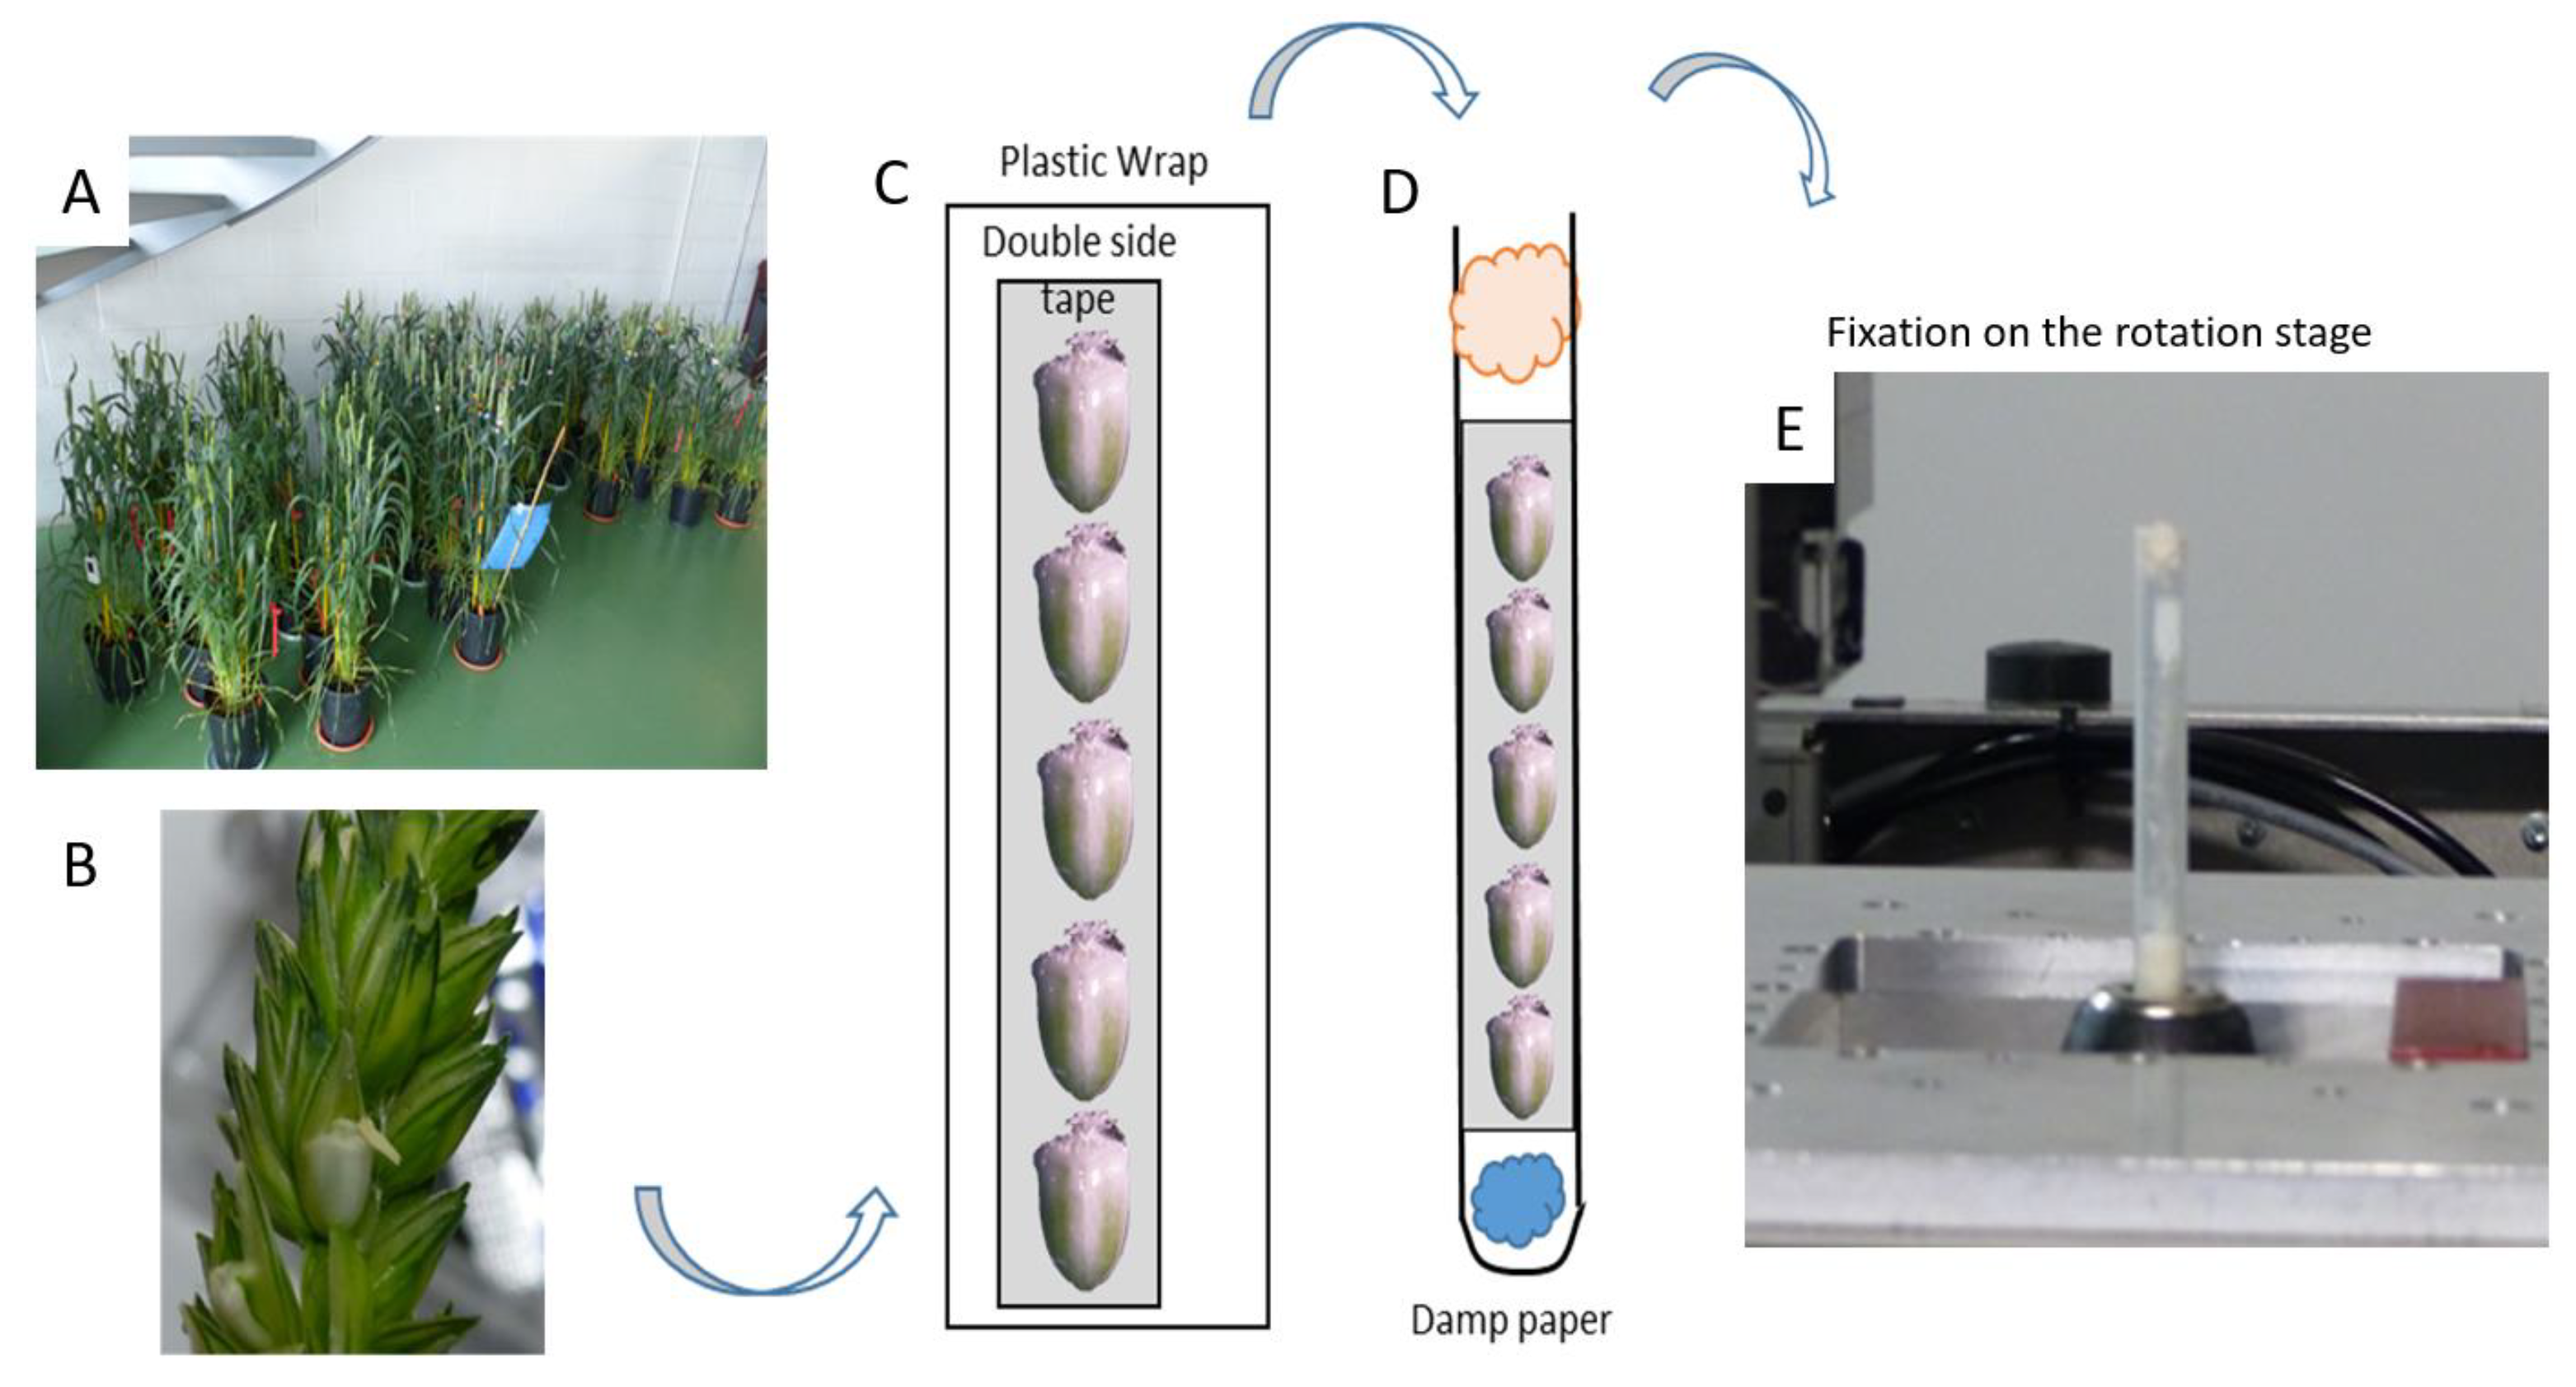
Wheat (Triticum aestivum L.) plants, cultivar Recital, were cultivated from sowing to spike emergence in a controlled greenhouse at INRAE Clermont-Ferrand (France). At this developmental stage, the plants were transported to the synchrotron SOLEIL (Gif-sur-Yvette, France) where they were stored in a naturally lighted hall (Figure 1A). The air temperature was recorded every 15 min. The date of anthesis of the florets of the middle spikelets was noted for each spike and from this date, the grain development stage was calculated based on the thermal time method (cumulated average day temperature (with 0 °C as base temperature) since anthesis in degrees-days after anthesis: °DAA). For a particular stage, fresh grains were sampled on spikes selected for their homogeneity in terms of morphology (same number of spikelets). The basal grain of the two middle spikelets was collected (Figure 1B). The grains were harvested just before the X-ray scans. Nine developmental stages were selected covering the early phase of the grain development (from 0 to 250 °DAA i.e., anthesis to the beginning of the filling phase).
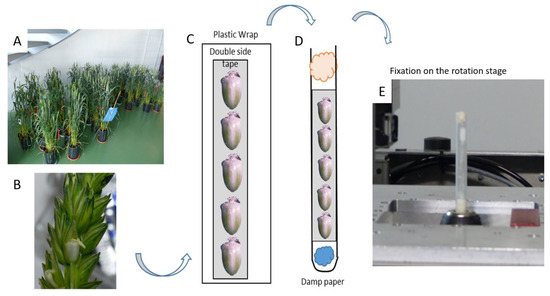
Figure 1.
Grain sampling and preparation for acquisition. (A) Wheat plants. (B) A wheat grain within a spikelet. (C) Fixation of the grains using adhesive and plastic wrap. (D) Insertion into the tube. (E) Installation on the rotation stage in front of the X-ray beam.
2.2. Sample Preparation and Specimen Holder
The grains were placed on a strip of double-sided adhesive then wrapped with a layer of plastic wrap (Figure 1C). The wrap was then introduced in a plastic tube in order to avoid any movement of the grains during the scan (Figure 1D). A small piece of watered paper was inserted at the bottom of the tube, in order to maintain high relative humidity inside the tube and to prevent the desiccation of the grains during the acquisitions. This device offered reproducible grain positioning and then time-saving. The tube was placed in a specimen holder (a drill chuck fixed on a motorized stage) allowing motorized movements along the vertical axis within a range of 50 mm (Figure 1E).
2.3. X-ray Tomography Acquisitions
X-ray tomography acquisitions were conducted at the PSICHE beamline of the Synchrotron SOLEIL [36]. Monochromatic beam (25 keV) was used in order to optimize contrast, and thus reduce the required X-ray dose, limiting beam damage to the grains (especially drying and collapse of living cells if they die). Paganin’s phase retrieval algorithm was applied to the projections to enhance contrast [37]. The sets of 1000 projection images were transformed to volumetric images using filtered back projections [38].
Two different settings were used: the low-resolution µCT settings allowed the coverage of the entire grains while the high-resolution settings allowed the observation of specific regions of the grain with an increased level of detail.
At “low resolution” settings, up to five grains of the same developmental stage were placed within the same tube. Using these settings, the time of acquisition was only about 1 min per grain. For each stage, at least 4 grains were imaged. The propagation distance between sample and detector for phase contrast was 70 mm. The size of the reconstructed images ranged from around 1000 × 900 × 1200 voxels to around 1700 × 1700 × 2800 voxels, depending on the size of the grain. The voxel size of reconstructed images was equal to 2.86 µm.
With the “high resolution” settings, three z-positions (middle, basal and upper) in three targeted regions of interest (crease or ventral groove, dorsal part, and lobes) were acquired for each grain. The propagation distance was set to 22 mm. Using these settings, grains were imaged one by one and carefully positioned in the middle of the tube. The resulting images had a size of 2048 × 2048 × 2048, with a voxel size equal to 0.64 µm. In this case, a complete tomogram required 10 min.
2.4. Light Microscopy Image Acquisitions
Microscopy images of cross-sections made in the equatorial region of wheat grains were acquired in order to compare the information obtained by microscopy and by synchrotron X-ray tomography.
Grain samples were fixed, embedded with London Resin White acrylic, cut, stained with toluidine blue O, and imaged with a multi-zoom macroscope (AZ100M, Nikon, Tokyo, Japan; bright-field acquisitions) as described in previous work [7].
2.5. Image Processing and Analysis
Image data generated by the PSICHE beamline consisted of data files in raw format, with intensity coded into 32-bits floating-point values. The whole image processing of 3D images was performed using the ImageJ/Fiji software [39]. The interactive visualization of 3D images was performed either using slice-by-slice display or using the 3D Viewer plugin.
Raw data files were converted to 3D grayscale images, with the intensity re-calibrated between 0 and 255 (8 bits), and saved as 3D Tiff stacks. For each 3D image, three 2D slices corresponding to the middle position along each of the X, Y, and Z directions were generated to provide a quick overview of the grain morphology.
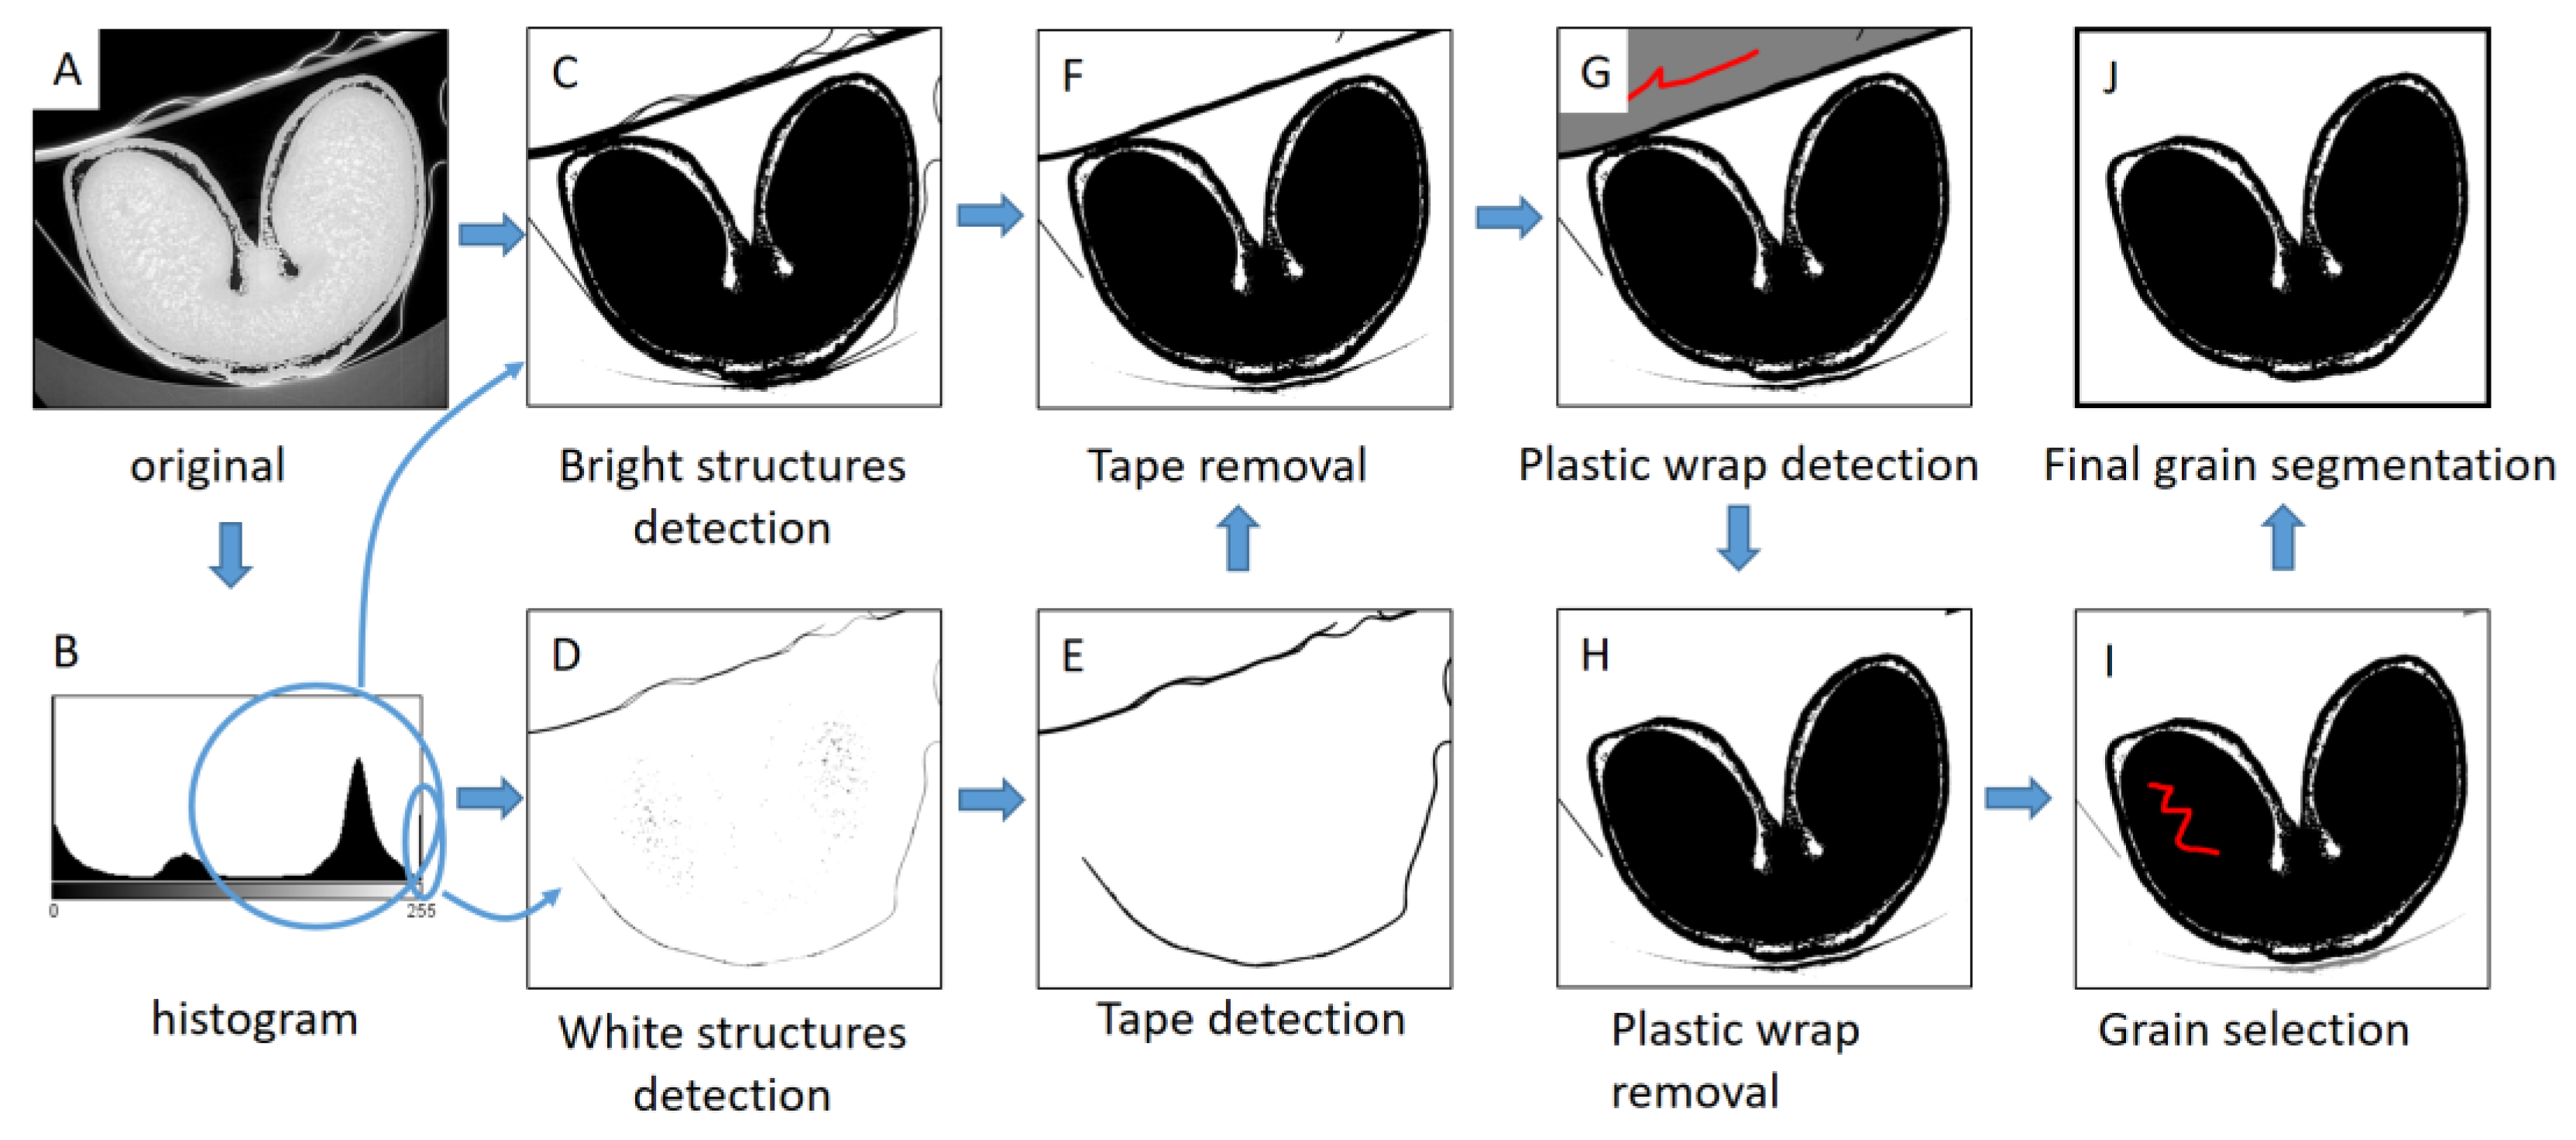
Three-dimensional visualizations of wheat grain were generated for representative images acquired at low resolution. As images contained the grain, but also items used to fix the sample (tube, plastic wrap, adhesive tape), it was necessary to apply an image processing workflow to segment the wheat grain (Figure 2). The workflow was performed using the ImageJ/Fiji software, using the MorphoLibJ plugin for morphological operations [40]. A threshold was applied to generate a 3D binary mask corresponding to the bright structures (including the grain tissues, the plastic wrap, and the adhesive tape) (Figure 2C). The tape appeared as the brightest structure. Therefore, a 3D binary mask of the tape was created by using a threshold with a high value (254) (Figure 2D). A slight morphological dilation of the tape mask with a cube structuring element with a diameter of 5 voxels was applied (Figure 2E), and the result was subtracted from the mask of the bright structures (Figure 2F). In some places, the plastic wrap touched the grain. To remove it, the background region behind the wrap was first retrieved with aid of 3D morphological reconstruction, using a manual selection as a marker image (Figure 2G). The application of a 3D morphological dilation with a radius equal to the thickness of the plastic wrap allowed removing it from the image (Figure 2H). Finally, 3D morphological reconstruction was applied to remove spurious structures and retrieve the region of the grain (Figure 2I,J).
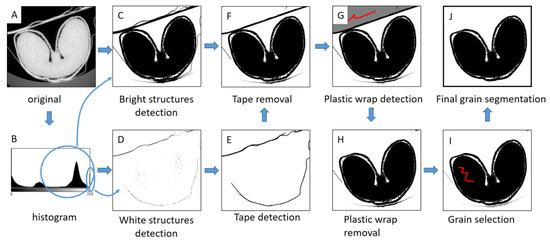
Figure 2.
Image processing workflow for segmentation of wheat grain. (A) Original (8-bits converted) image. (B) Histogram of image gray levels. (C) Segmentation of bright structures. (D) Segmentation of white structures. (E) Selection of the tape voxels. (F) Result of tape removal. (G) Selection of the region behind the plastic wrap. (H) Result of plastic wrap removal. (I) Selection of a marker within the grain region. Red color corresponds to the manual selection of binary markers for morphological reconstructions. (J) Final segmentation of wheat grain.
3. Results
3.1. X-ray Tomography, 3D Segmentation, and Reconstruction Revealed the Global Shape and Detailed Surface of the Developing Grain
X-ray tomography acquisitions at the low-resolution settings were performed for wheat grains at several stages of development. For clarity and simplification, we will present the results obtained for only two contrasted stages to illustrate the level of details revealed by the synchrotron device using our settings.
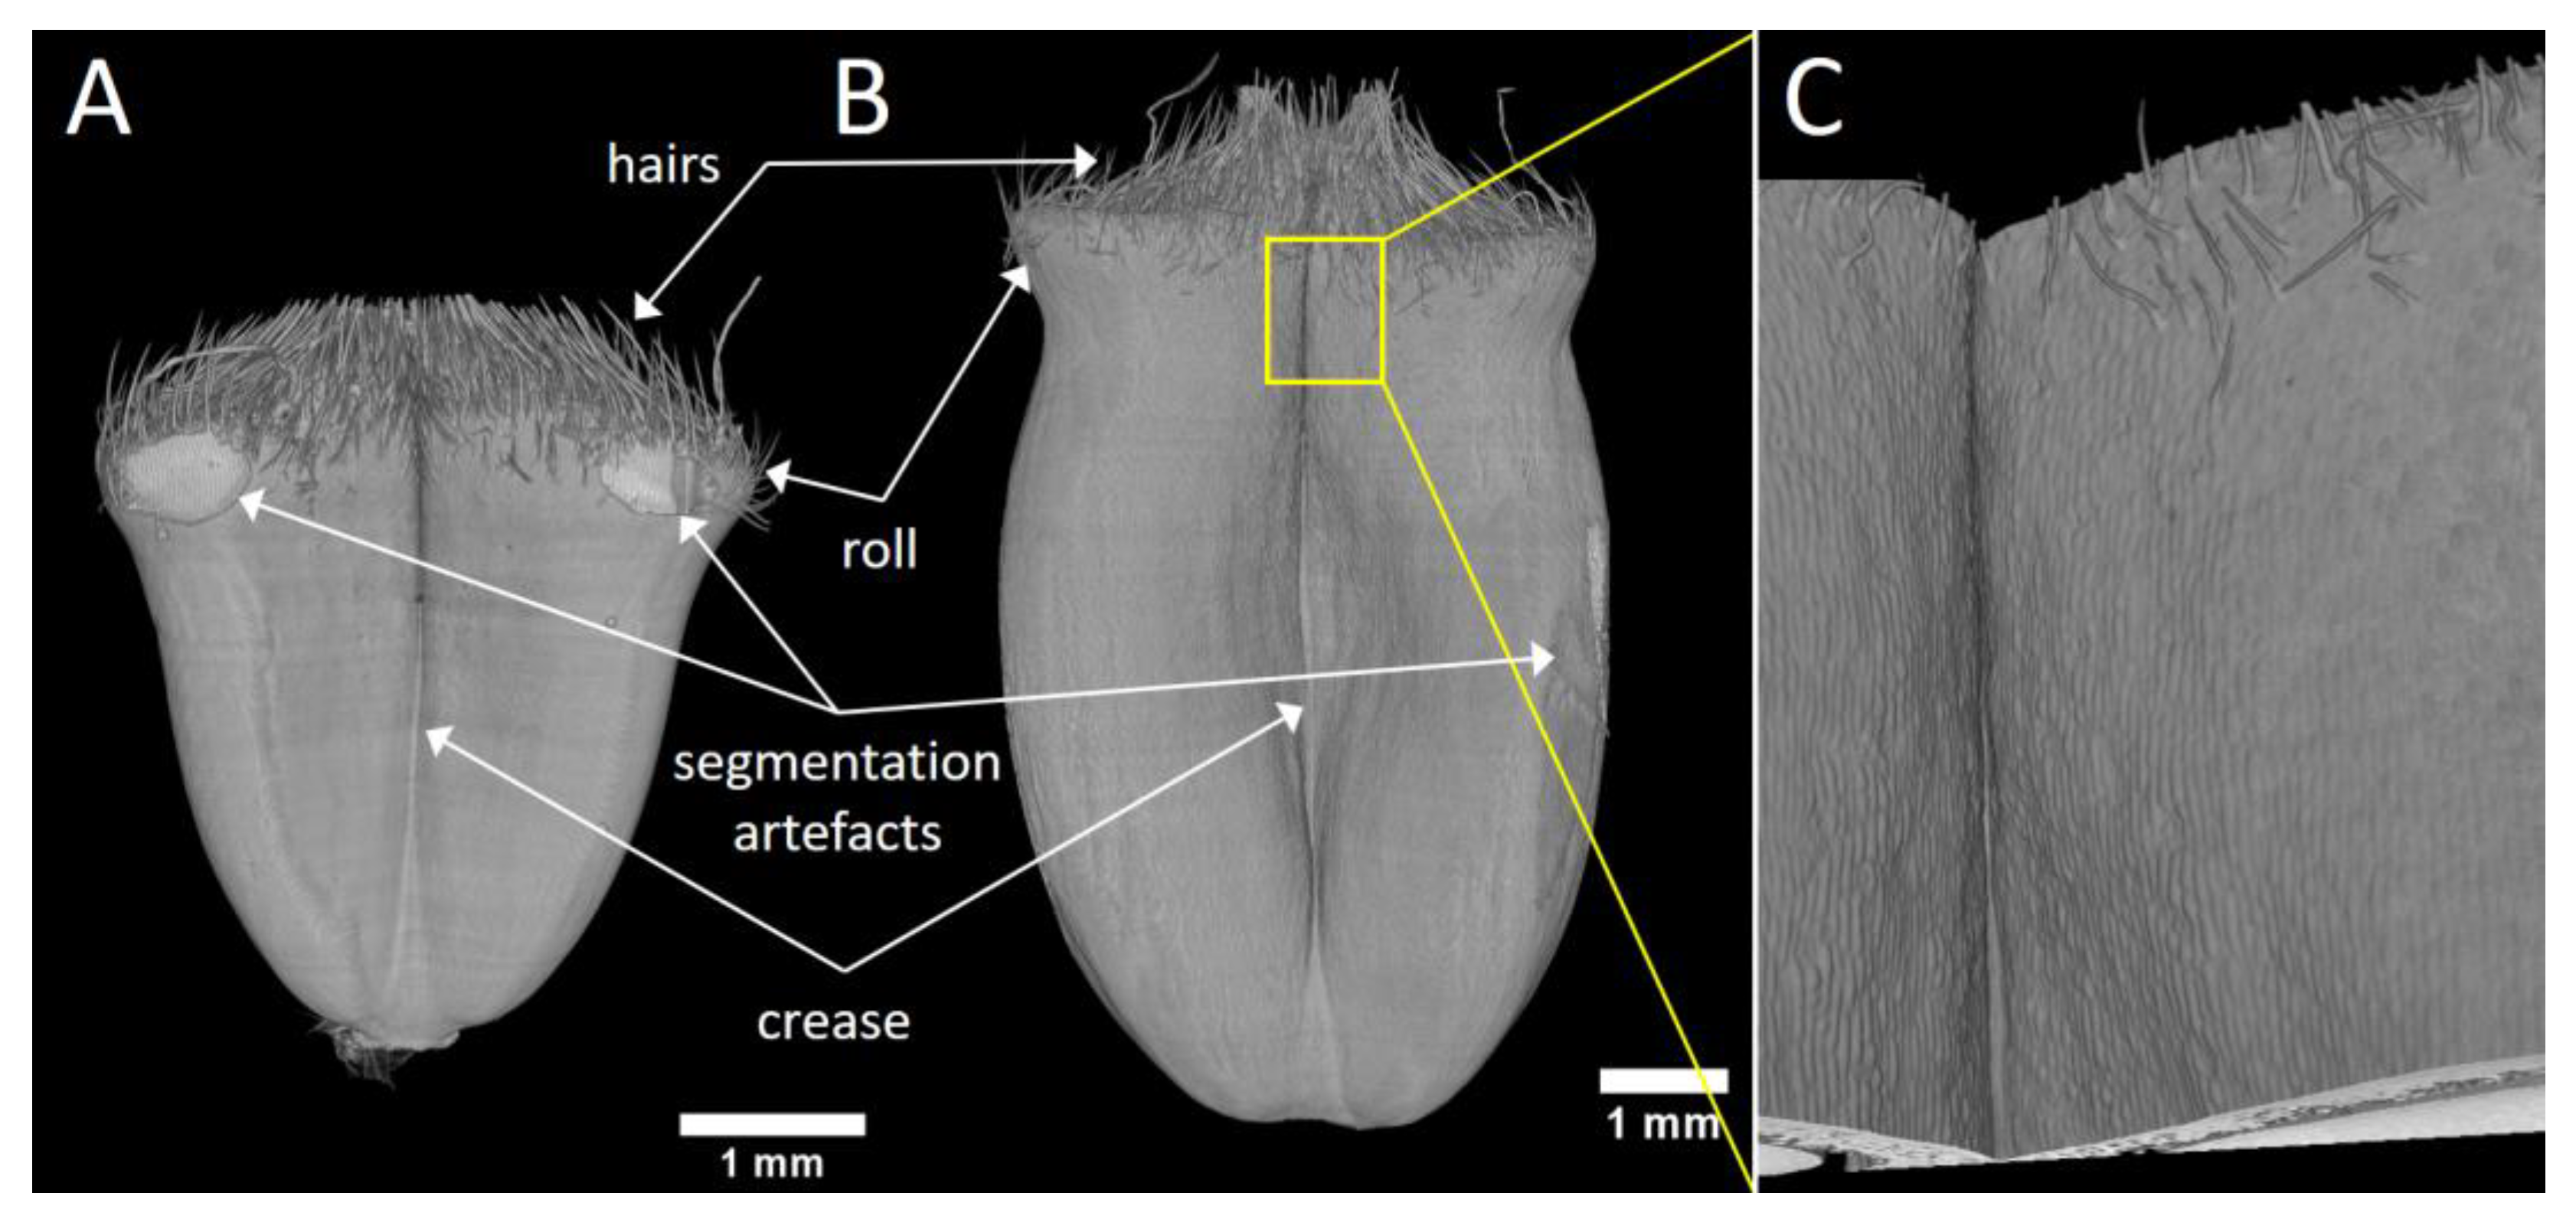
The 3D representations of the whole wheat grain were obtained from segmented images (Figure 3). Figure 3A represents a grain at the beginning of its development when it starts elongating (100 °DAA), while Figure 3B represents a grain when elongation has nearly ended (200 °DAA). The different regions of the grains can easily be identified: the two lobes, the middle crease, a roll in the upper part of the grain, and on the top hairs, and the basis of the styles. The 3D representation highlights the changes in grain size and shape during its development. At the beginning of its development, the grain looks like an inverted pyramid. During development, the grain elongates, the lobes thicken, and the roll visible in the upper part of the grain progressively disappears. The 3D representations are comparable to those obtained previously with a lower resolution using our laboratory tomography device [7]. However, the resolution and the enhanced contrast of the phase-contrast tomography reveal a number of details within the three-dimensional images. The hairs in the upper part of the grain are clearly visible.
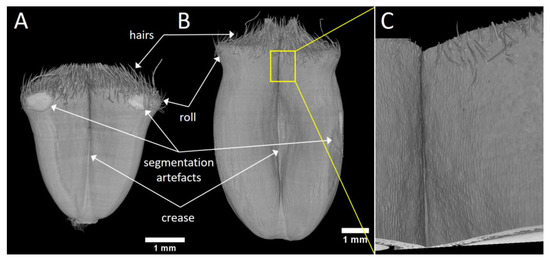
Figure 3.
3D representations of wheat grain after image segmentation. The binary mask obtained after segmentation was combined with the grayscale image and rendered with the 3D Viewer plugin of the ImageJ software. (A) Sample grain at 100 °DAA, front view. (B) Sample grain at 200 °DAA, front view. (C) Zoom on the epidermis of the grain at 200 °DAA, on the region depicted by the white frame in (B).
When zooming on a specific region, the epidermis cells may be distinguished (Figure 3C). At some positions, it is possible to investigate their elongation and preferred longitudinal orientation.
In some regions, the segmentation process was difficult due to the contact between the tape and the grain sample (see for example both sides on the top of the grain Figure 3A). However, our experimental settings and segmentation pipeline allowed a good representation of the surface of the developing grain.
3.2. D Imaging of the Whole Grain Revealed Internal Individual Tissues
Figure 4 presents virtual slices within grey level images at two contrasted stages. Stage 100 °DAA corresponded to the beginning of the growth phase, while stage 250 °DAA corresponded to grains that reached their final length. The images contain signals that can be attributed to the grain samples but also signals due to the tape used to maintain the grain samples and to the tube. In addition, an artefact due to the detector known as the “ring artefact” was often observed in the center of the images, sometimes hampering the detailed observation of the tissues (Figure 4A,D).
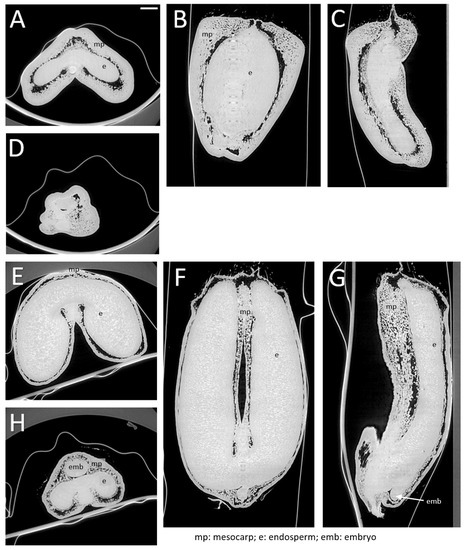
Figure 4.
Virtual slices within low-resolution images of whole grains at contrasted development stages. (A) XY slice at middle z-position for grain at 100 °DAA. (B,C) XZ slice at middle y-position and YZ slice at middle x-position of the same grain. (D) XY slice in the bottom of the grain, showing a portion of the embryo. (E–H) same representations for a grain at 250 °DAA. Scale bar represents 1000 µm.
Low-resolution images show pixels with different grey levels corresponding to internal tissues with varying density and X-ray absorption capacity. In addition, dark spots and large dark regions, which do not absorb X-rays, are revealed. The dark regions are voids that were already described [7]. They are the result of the lysis of the pericarp parenchyma (mesocarp) due to developmentally programmed cell death [6]. Smaller dark spots localized in the pericarp between cells are voids due to intercellular spaces.
Several tissues can be distinguished in the grey images. The pericarp parenchyma with its intercellular spaces contrasts with tissues that do not contain intercellular spaces such as a bright and continuous layer at the surface of the grain, vascular tissues, the embryo, the endosperm, and its surrounding tissues. Individual cells surrounded by intercellular spaces are distinguished within the pericarp parenchyma. At later stages, bright spots appear within the endosperm, corresponding to the accumulation of starch grains (Figure 4E–G).
Characteristic changes in grain morphology associated with development can be observed. The difference in grain length can be assessed from the vertical slices (Figure 4B,C compared to Figure 4F,G). From the XY cross-sections, one can observe the development of the endosperm, the growth of the lobes, as well as the progressive thinning of the pericarp (mesocarp). Compared to previous results obtained with laboratory tomography, the spatial resolution was equivalent (2.86 µm compared to 4–6 µm), but a much greater contrast was obtained. This increased contrast facilitates the discrimination of tissues and the observation of cell layers. It also highlights the presence of air spaces within the pericarp due to intercellular spaces and tissue lysis in the mesocarp.
3.3. High-Resolution 3D Imaging Improves Cell Distinction but Greatly Reduces the Field of View
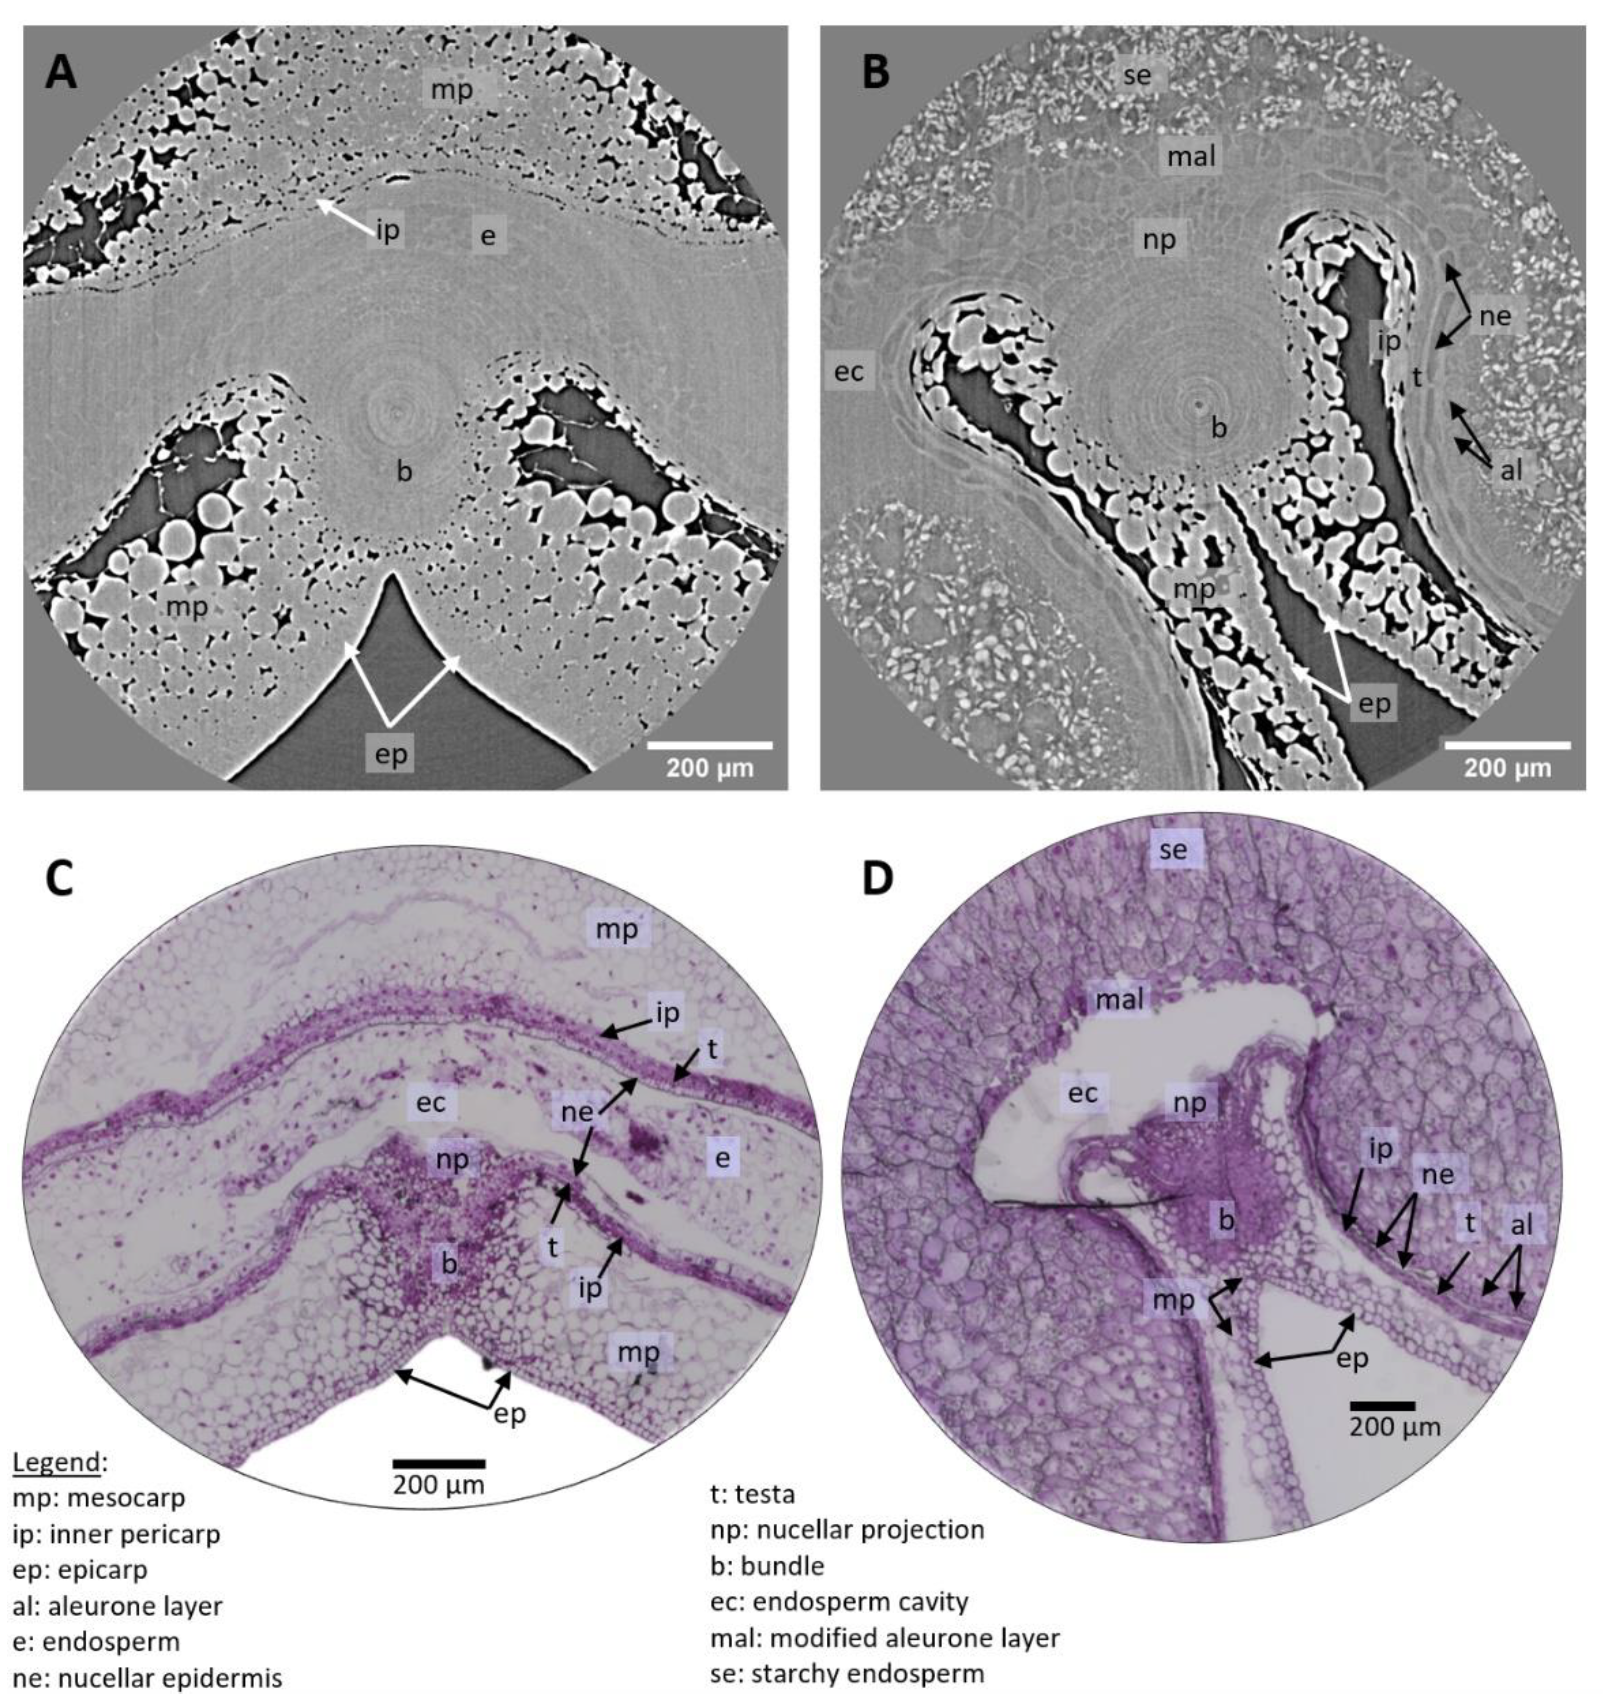
Using high-resolution settings, the observed field of view was restricted. However, a much larger number of details can be distinguished (Figure 5A,B). In order to facilitate the interpretation of the images, light microscopy images of wheat grains at similar development stages, stained with toluidine blue O to highlight cell structures, are presented (Figure 5C,D). Differences between tomography and microscopy images may be due to the differences between grains, but also to preparation artifacts in microscopy images.

Figure 5.
High-resolution images of grain tissues. (A,B) XY slices of 3D tomography images of a wheat grain at 100 °DAA and 250 °DAA in the crease region. (C,D) Microscopy images of wheat grain at 100 °DAA and 250 °DAA (Toluidine Blue O stained) in similar regions as (A,B).
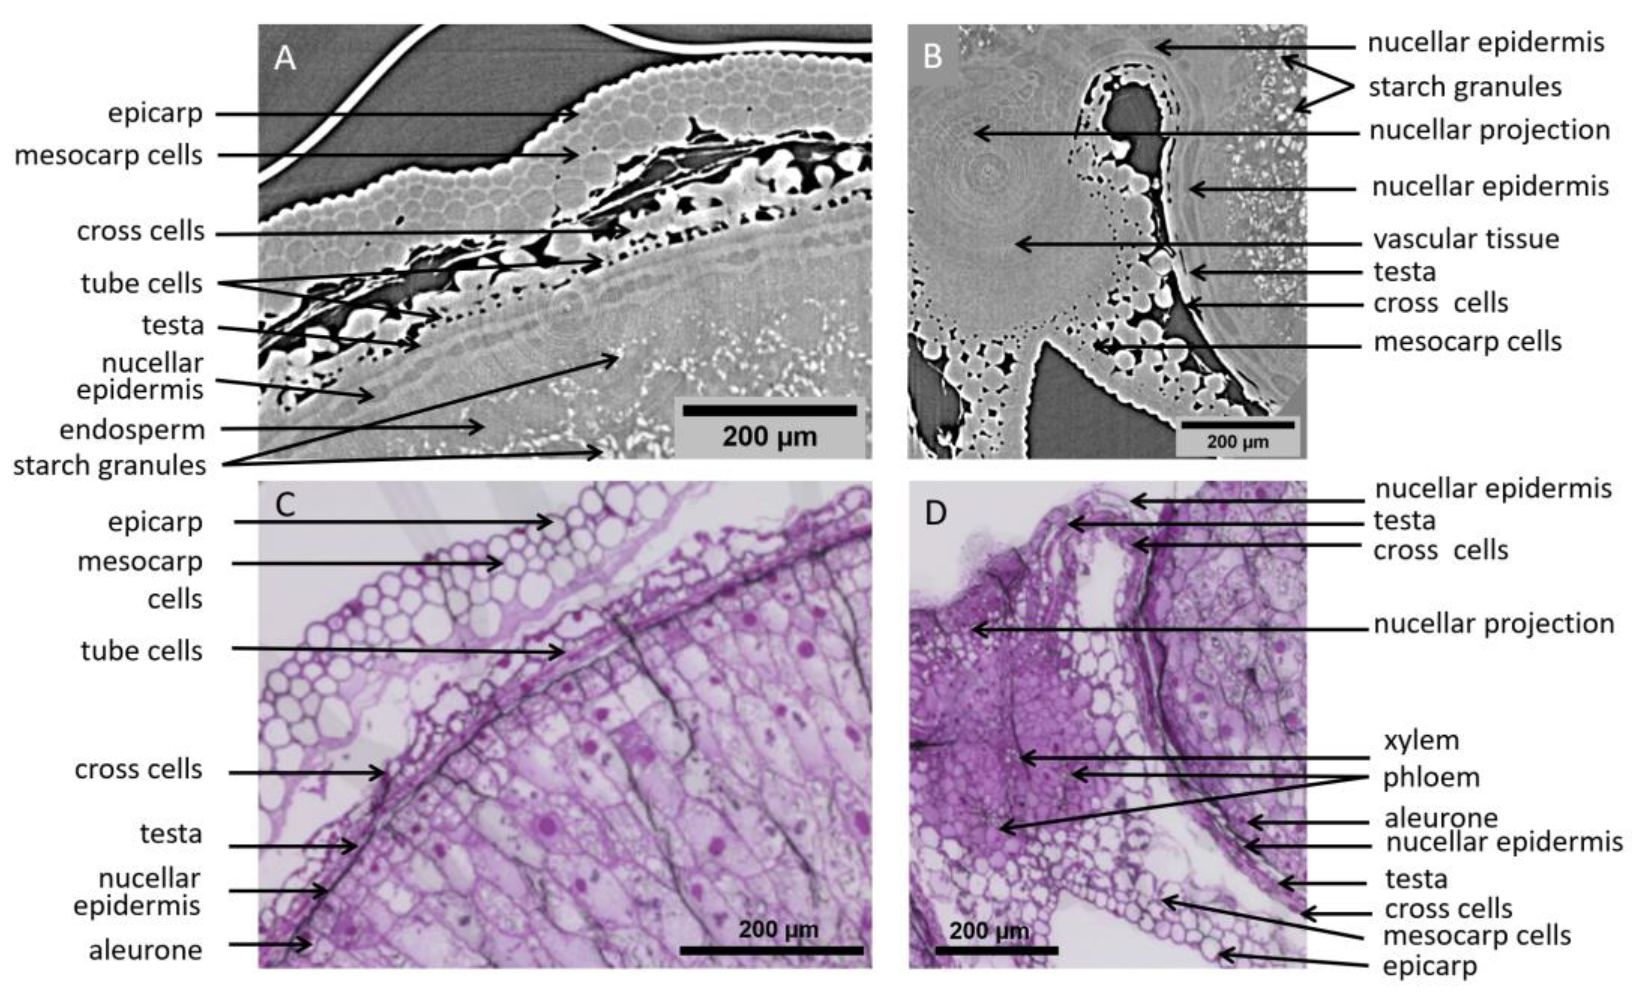
On the tomography images, individual cells are clearly distinguished in several tissues. In the pericarp parenchyma, cells are surrounded by intercellular spaces and are easily distinguished. Cell layers of the inner pericarp (cross cells and tube cells) can be recognized between the endosperm and the pericarp parenchyma (Figure 6A,C). Individual cells within tissues with no voids are also detected due to differences in contrast which reflect differences in density/composition. This is the case for cells of the nucellar epidermis, nucellar projection, and modified aleurone at 250 °DAA for which cell walls appear thick and bright while their cytoplasm appears dark (Figure 5B and Figure 6A,B). The contours of some cells in the inner compartment can be seen at 100 °DAA but these cells are not as recognizable as at 250 °DAA. At 250 °DAA, almost all tissue layers revealed by optical microscopy were observed using high-resolution tomography. Cells surrounding the vascular bundle were less defined and the testa was not revealed by the X-rays (Figure 6B). The testa lays between the nucellar epidermis and the inner pericarp which are both distinguished. The main difference between the two techniques is that the inside of cells is not contrasted in the X-ray images while it is well-defined using histological staining and microscopy. The only detail of the inside of cells revealed by X-rays is the presence of starch grains in the endosperm that are particularly highlighted due to their high density. The endosperm cavity, which contains water, proteins, and carbohydrates, is visible in the ventral crease region although its shape appears different than in microscopy images of grain sections where it is altered and emptied by preparation steps (Figure 5B,D) [21]. At 100 °DAA (Figure 5A), apart from pericarp tissues, fewer internal tissues are distinguished in the X-ray images probably because their developing cell walls are thinner and because the wheat grains are more highly hydrated (75% and 68% at 100 °DAA and 250 °DAA respectively).
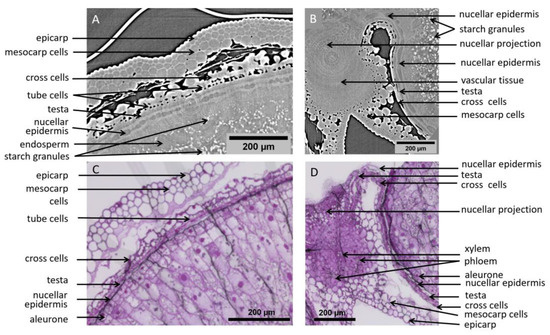
Figure 6.
Highlighted region from high-resolution images of wheat grains at 250 °DAA. (A) Zoom on the dorsal region, revealing several cell layers. (B) Zoom on a region around the bundle. (C,D) Microscopy images (Toluidine Blue O stained) in similar regions as (A,B) respectively.
Microscopy imaging revealed a large number of cells (Figure 5C,D and Figure 6C,D), delineated by their cell wall. The coloration of the cell walls also provided information about their chemical composition. With our tomography setups cell walls were visible only in some tissues (e.g., nucellar epidermis, modified aleurone), making most cells visible only within highly porous tissues. On the other hand, the required sample preparation steps and slicing for the microscopy images induced deformations (local dilations, shrinks, or folds) that may complicate its analysis.
3.4. Comparison of the Inputs of Low and High Resolutions in the Understanding of Grain Development
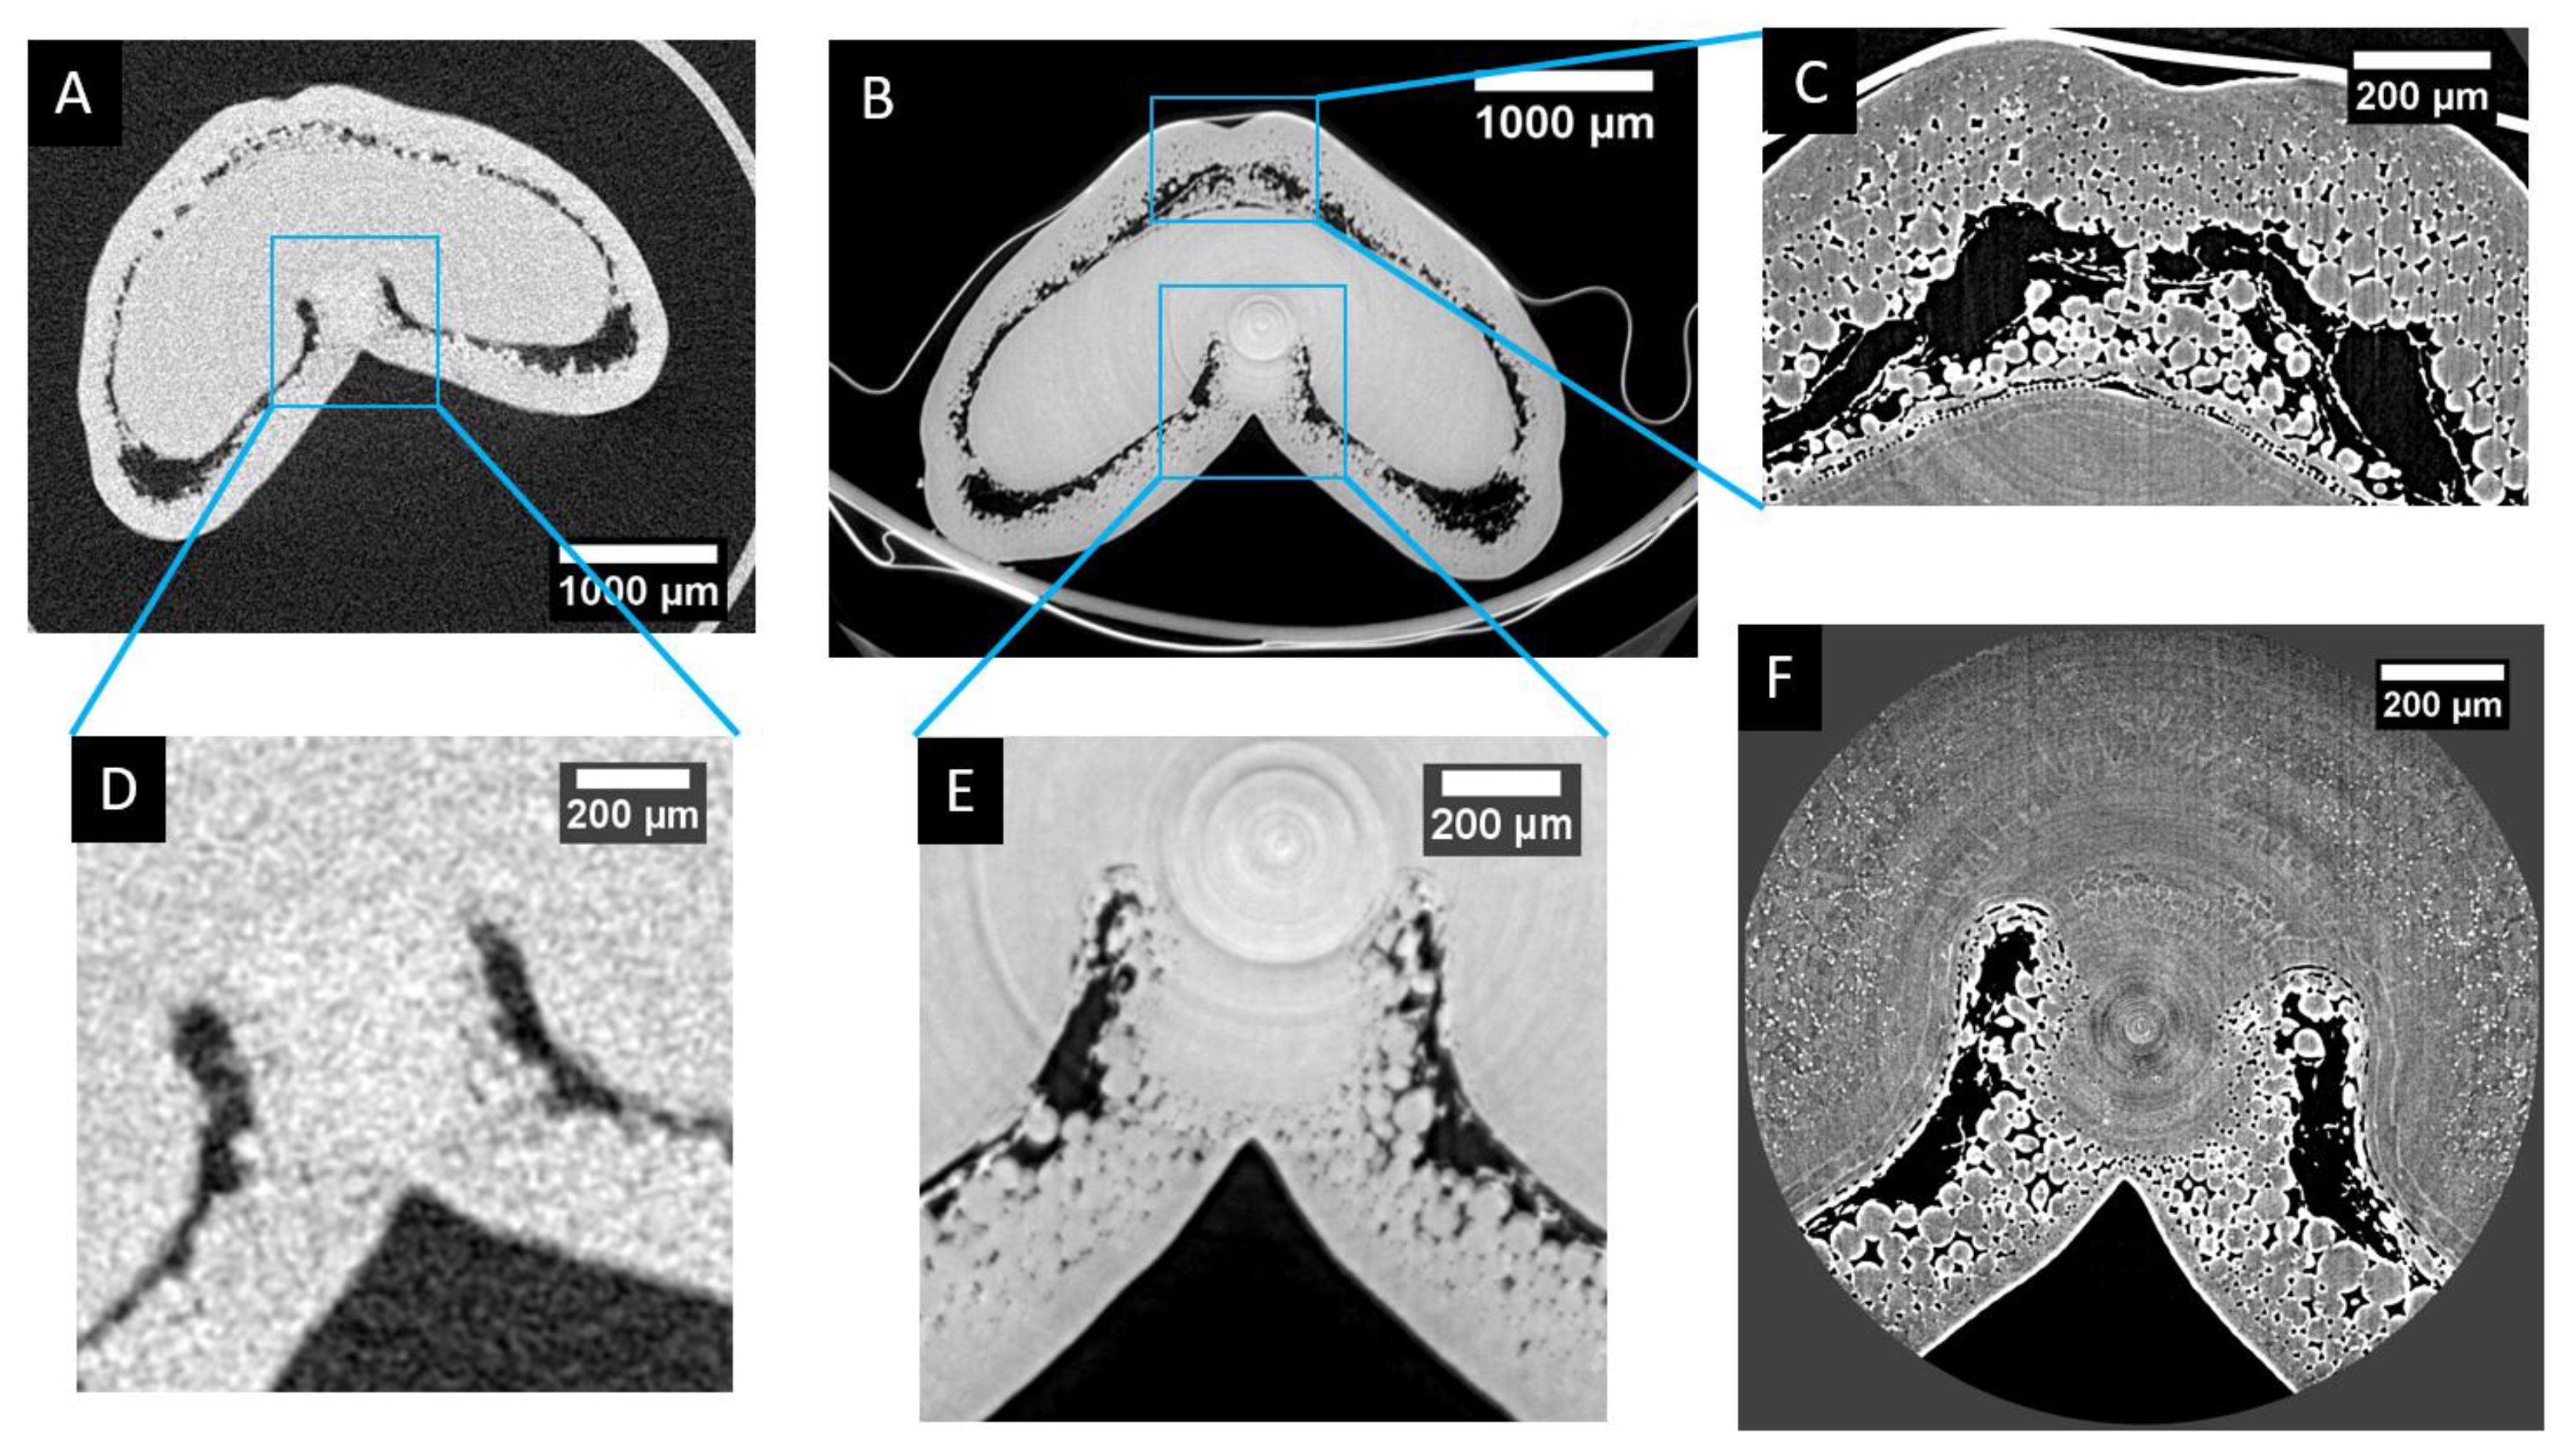
Figure 7 provides a visual comparison of the differences of resolutions and level of details that can be provided by the different devices and settings: laboratory microtomograph (Phoenix Nanotom 180NF, GE Sensing & Inspection Technologies GmbH, Wunstorf, Germany) and synchrotron beamline. Using laboratory microtomography (Figure 7A,D), the global size and shape of the grain can be assessed, as well as the difference between inner and outer compartments for stages older than 50 °DAA (for which mesocarp lysis clearly separates the two compartments) [7]. However, few details can be observed within tissues. For instance, cell layers can hardly be distinguished.
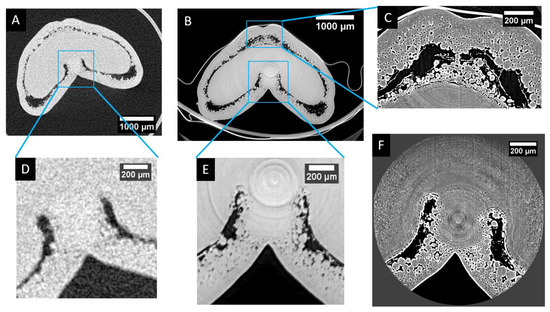
Figure 7.
Visual comparison of the resolution obtained with three different X-ray micro-tomography setups. (A) Laboratory microtomography of the whole grain (using the same settings as in [7]). (B) “Low-resolution” synchrotron phase-reconstruction tomography (2.86 µm/voxel). (C) “High-resolution” synchrotron phase-reconstruction tomography of the dorsal region (0.64 µm/voxel). (D,E) Zoom of the highlighted region of (A) and (B), respectively. (F) “High-resolution” synchrotron phase-reconstruction tomography of the ventral region (0.64 µm/voxels).
The use of phase-contrast base synchrotron tomography (Figure 7B,E) provides similar resolution but greatly improves the quality of the image, especially the signal-to-noise ratio that improves the contrast (see Figure 7E compared to Figure 7D). Individual cells can be observed, cell layers can be identified, and variations of tissue porosity due to intercellular spaces become explicit.
Using higher resolution settings (in our case, 0.64 µm voxel size after reconstruction) drastically improves the level of details that can be observed (Figure 7C,F). More cells become apparent, while their 3D delineation remains challenging when they are not surrounded by empty spaces. Very thin tissue layers become visible. The counterparty is a reduction of the field of view that imposes a local observation.
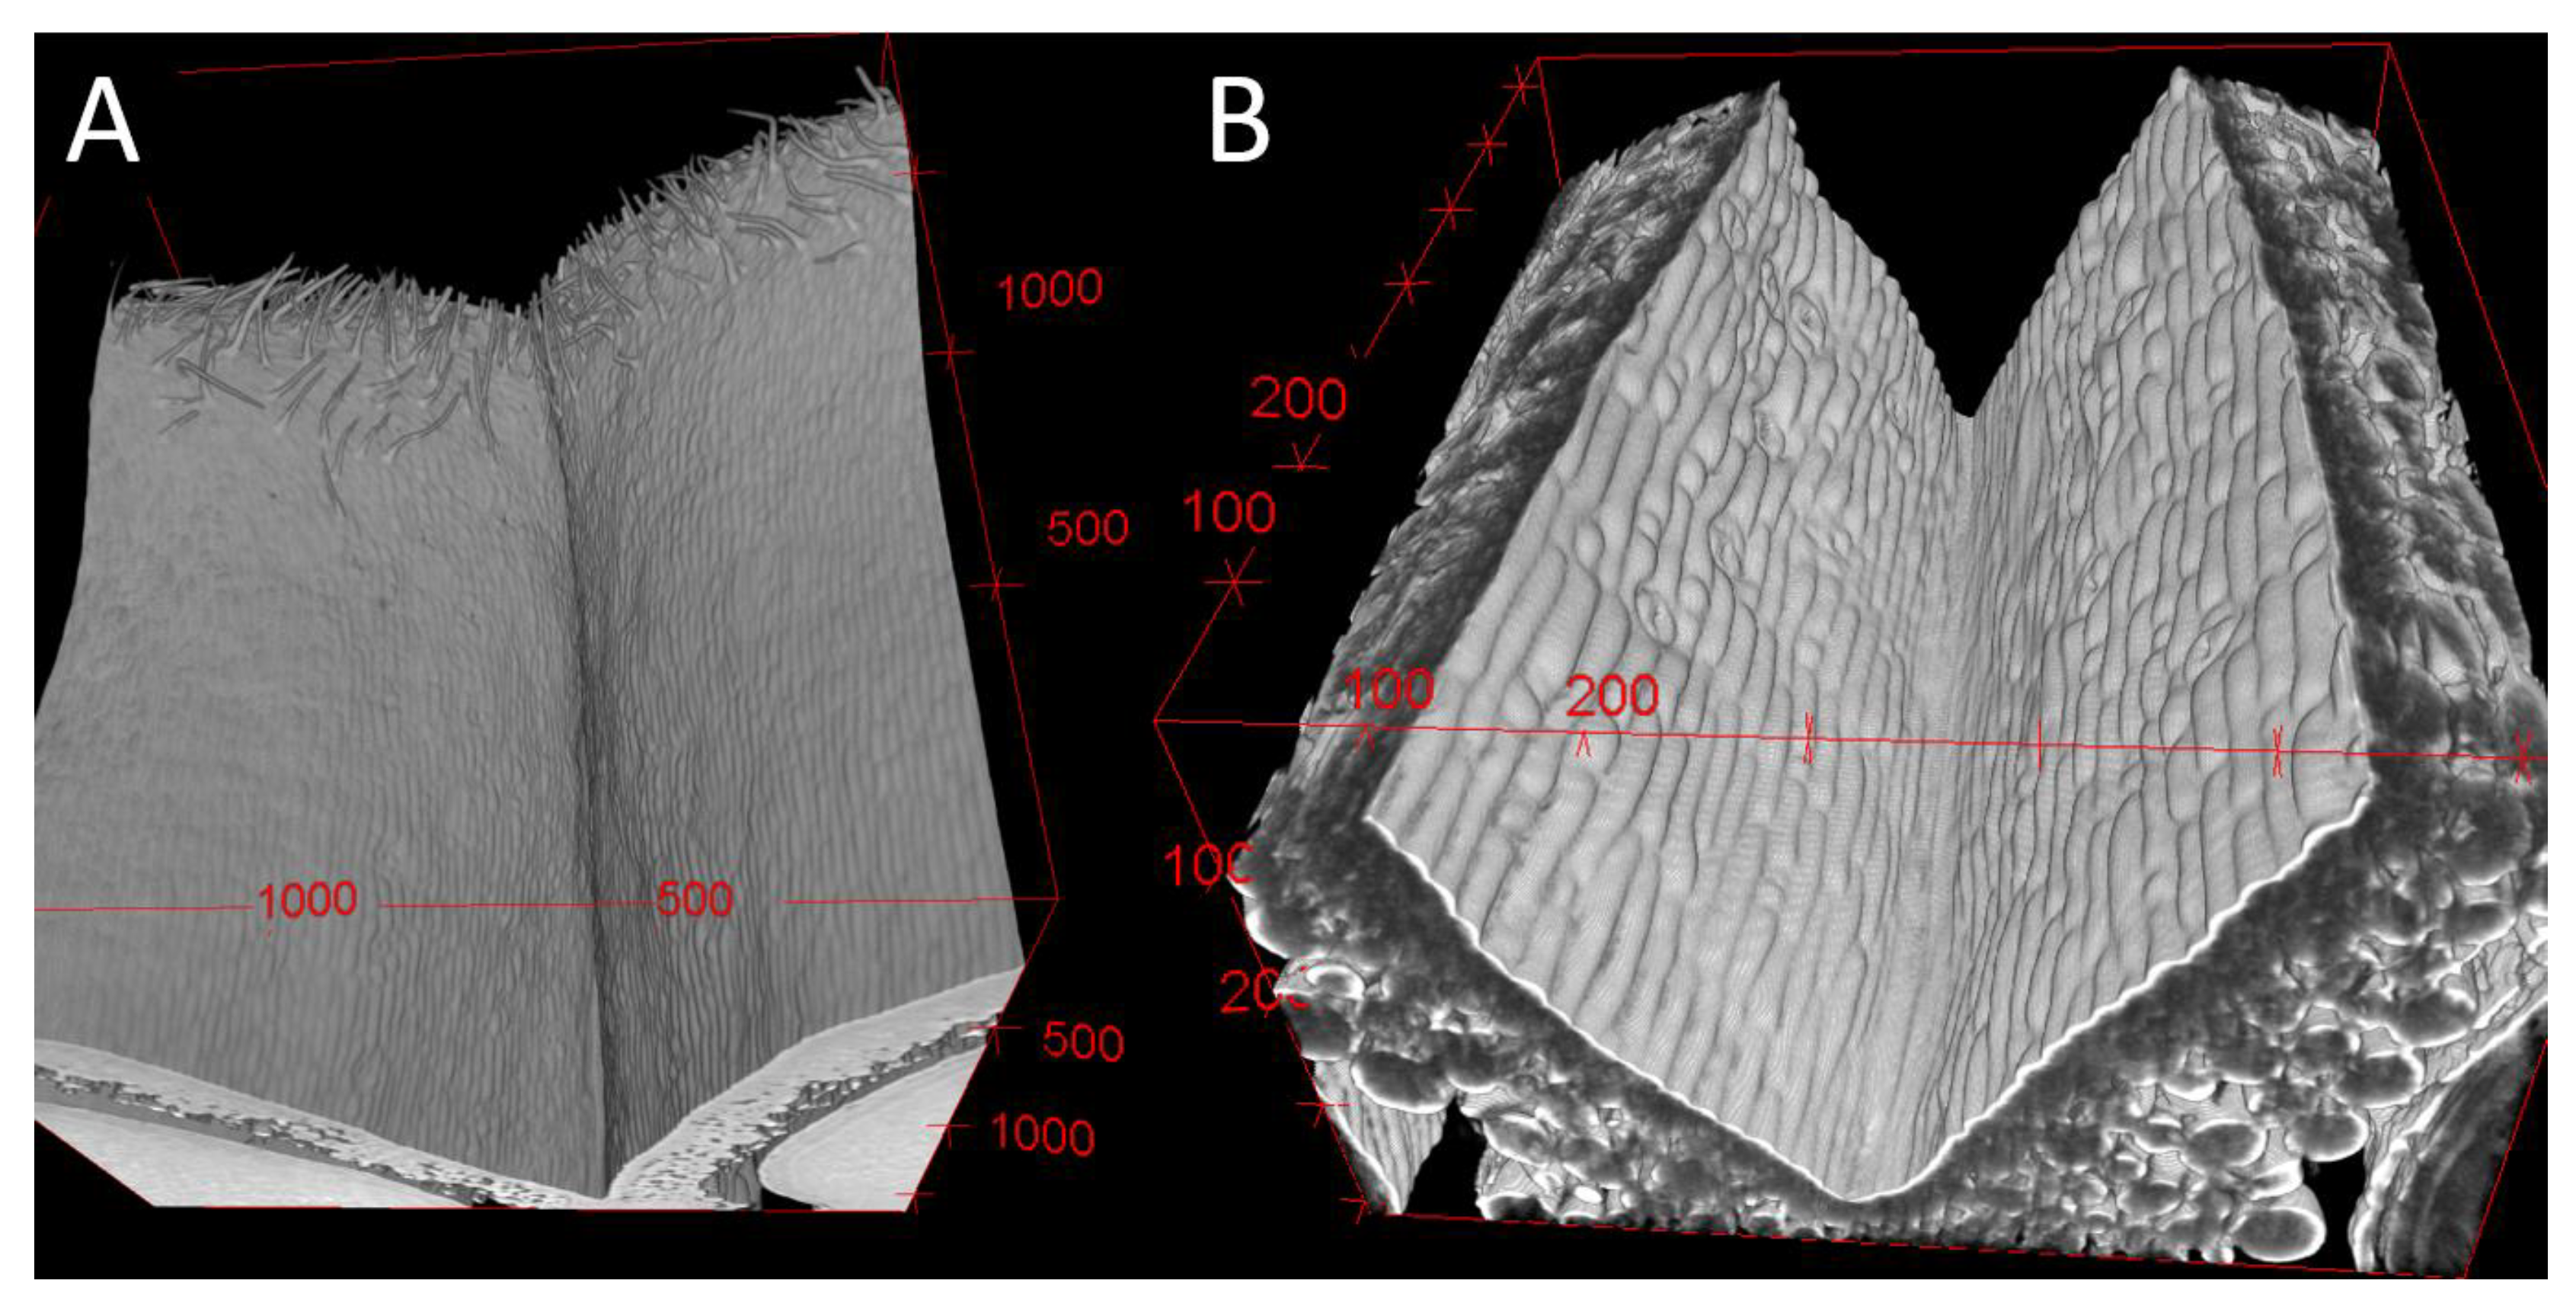
High-resolution settings greatly improve the resolution of individual cells in virtual slices but also in 3D representations of the tissue surface as shown in Figure 8 for pericarp epidermis. Individual cells can be seen using lower resolution settings (Figure 8A) but they are clearly distinguished at higher resolution (Figure 8B): long epidermal cells and their elongation axis are revealed as well as smaller round cells.
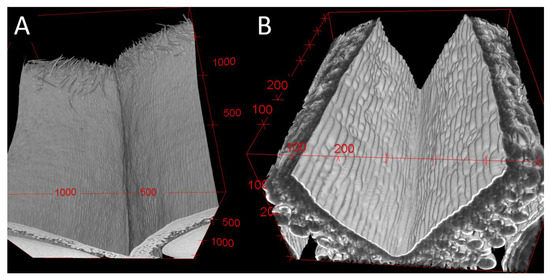
Figure 8.
3D visualization of the epidermis of grains at 200 °DAA using a low-resolution (A) or high-resolution (B) scan. Both images correspond to a crop of the original 3D stack to better visualize the epidermis cells. Red digits and ticks correspond to spatial calibration in microns.
4. Discussion
Phase-contrast tomography provided by synchrotron radiation is a relevant approach for exploring the three-dimensional organization of highly hydrated plant tissues, without the destructive cut and the use of any contrasting agent. In particular, it was possible to identify a large number of biological structures within whole wheat grains at various stages of development without cutting artefacts.
Low-resolution setup in synchrotron provided high-quality 3D images of the whole grains, with an enhanced level of contrast compared to that obtained from classical laboratory microtomography. However, some reconstruction defaults like rings artefact could be still noticed. They were thin enough to allow identification of the structures of interest. Image processing allowed for segmentation of the grains, and visualization of their 3D shapes. This information is of interest for the study of the development of the grain.
When using a higher resolution, a larger number of details can be revealed from 3D images: more tissue layers can be identified, cells can be better individualized, and dense molecular structures (starch grains) can be observed within cells.
However, there are several drawbacks using synchrotron-based tomography. The synchrotron facilities are restricted in access and the planification should be organized months in advance. Therefore, one should carefully plan the plant production (especially when it takes a rather long time to get plants at the proper stage; in our case 5 months), experimental setup, and anticipate possible difficulties. For instance, our settings were designed to fix the grains in a vertical position in order to scan several grains without further manipulations and prevent dehydration of tissues. However, the tape we used produced a strong signal and was too tightly attached to the grains at some positions. For some applications, such as studying the shape or dimensions of organs, lab-based microtomography remains a relevant tool.
Details can be compared with that obtained from microscopy: microscopy provides finer anatomical details, as well as information about the local chemical composition. However, microscopy imaging requires physical cross-sections of the sample. This results in usual 2D information, with approximate location and orientation, and the presence of artifacts caused by the preparation steps of the slice (sectioning, drying, embedding, staining, etc. In literature, 3D reconstruction of entirely sectioned and imaged grain samples is scarce because it is complicated and time-consuming [15]. The three-dimensional nature of the images resulting from synchrotron tomography lets us envision the investigation of the 3D architecture of the tissues, their organization within the grain, as well as the 3D morphology of the cells within specific tissues. Segmentations of some tissues and cells are feasible; however, systematic segmentation of tissues and cells for a comprehensive study remains impossible so far with the experimental setups and processing methods used. The exploration and interpretation of dense 3D data have however shown to be difficult. Generating and interpreting 3D sliced with arbitrary orientation requires orientation skills, the opacity of the tissues makes 3D rendering difficult, and the size of the data sets (several GB) requires powerful hardware and/or software. Further exploration of dense 3D data will require smart integration of 3D image processing algorithms together with an interactive selection of regions or adjustment of algorithm parameters.
Comparison with optical microscopy images illustrates the complementarity of the imaging approaches. Promising future works would be to combine the detailed information obtained from 2D microscopy with the global 3D anatomical description of the grain. This would require efficient algorithms for 2D to 3D registration of images from different modalities, as well as a more exhaustive sampling of the wheat grain using microscopy. Other imaging modalities provide information that would be of interest to relate to the ones obtained from X-ray tomography and microscopy. For example, magnetic resonance imaging gives access to local water status within the grain (e.g., for wheat [21]) but scans are very time-consuming, and spatial resolution is still low (cellular level cannot be reached). Mass-spectrometry imaging reveals chemical composition within tissues with improved discrimination power (e.g., for wheat [41]). To have a better understanding of the biological functions within a complex organ such as the wheat grain, it becomes necessary to merge the complementary information provided by the various imaging source. Due to its high resolution and to the 3D nature of the provided data, X-ray phase-contrast tomography appears as a crucial imaging method that can generate reference geometries of biological organs or tissues. Such reference geometries can be used to track the changes of morphology along the development of the grain, or to serve as a reference model for registering and merging the information provided by other complementary imaging modalities [42,43].
Author Contributions
Conceptualization: D.L., A.-L.C.-B. and C.G.; Methodology: E.B., A.K., C.R. and C.A.; Data Processing and Visualization: D.L., T.D.Q.L. and L.P.; Writing: D.L., A.-L.C.-B. and C.G.; Review editing: D.L., C.A., E.B., C.G., A.K., F.G., C.R., L.P., T.D.Q.L. and A.-L.C.-B.; Funding: A.-L.C.-B., C.G. and D.L. Authorship is limited to those who have contributed substantially to the work reported. All authors have read and agreed to the published version of the manuscript.
Funding
This research was funded in part by the PSICHE beamline (SOLEIL synchrotron facility, project 20170220). This project was also supported by grants from INRAE TRANSFORM (THESECEPIA-2017) and the financial assistance received from the region Pays de la Loire (AAP-ATC-2017).
Institutional Review Board Statement
Not applicable.
Informed Consent Statement
Not applicable.
Data Availability Statement
The data presented in this study are available on request.
Acknowledgments
We thank the greenhouse team of IE Végépole from INRAE Clermont-Ferrand for valuable assistance in plant preparation and care.
Conflicts of Interest
The authors declare no conflict of interest.
References
- Marshall, D.R.; Mares, D.J.; Moss, H.J.; Ellison, F.W. Effects of grain shape and size on milling yields in wheat. II. Experimental studies. Aust. J. Agric. Res. 1986, 37, 331–342. [Google Scholar] [CrossRef]
- Campbell, G.M.; Fang, C.; Muhamad, I.I. On Predicting Roller Milling Performance VI: Effect of Kernel Hardness and Shape on the Particle Size Distribution from First Break Milling of Wheat. Food Bioprod. Process. 2007, 85, 7–23. [Google Scholar] [CrossRef]
- Evers, T.; Millar, S. Cereal grain strcture and development: Some implications for quality. J. Cereal Sci. 2002, 36, 261–284. [Google Scholar] [CrossRef]
- Calderini, D.F.; Castillo, F.M.; Arenas-M, A.; Molero, G.; Reynolds, M.P.; Craze, M.; Bowden, S.; Milner, M.J.; Wallington, E.J.; Dowle, A.; et al. Overcoming the trade-off between grain weight and number in wheat by the ectopic expression of expansin in developing seeds leads to increased yield potential. New Phytol. 2021, 230, 629–640. [Google Scholar] [CrossRef] [PubMed]
- Nadaud, I.; Girousse, C.; Debiton, C.; Chambon, C.; Bouzidi, M.F.; Martre, P.; Branlard, G. Proteomic and morphological analysis of early stages of wheat grain development. Proteomics 2010, 10, 2901–2910. [Google Scholar] [CrossRef] [PubMed]
- Domínguez, F.; Cejudo, F.J. Programmed cell death (PCD): An essential process of cereal seed development and germination. Front. Plant Sci. 2014, 28, 366. [Google Scholar] [CrossRef] [PubMed] [Green Version]
- Le, T.D.Q.; Alvarado, C.; Girousse, C.; Legland, D.; Chateigner-Boutin, A.-L. Use of X-ray micro computed tomography imaging to analyze the morphology of wheat grain through its development. Plant Methods 2019, 15, 84. [Google Scholar] [CrossRef] [PubMed] [Green Version]
- Xiong, F.; Yu, X.R.; Zhou, L.; Wang, F.; Xiong, A.S. Structural and physiological characterization during wheat pericarp development. Plant Cell Rep. 2013, 32, 1309–1320. [Google Scholar] [CrossRef] [PubMed]
- Xu, A.; Wei, C. Comprehensive comparison and applications of different sections in investigating the microstructure and histochemistry of cereal kernels. Plant Methods 2020, 16, 8. [Google Scholar] [CrossRef] [PubMed]
- Xurun, Y.; Xinyu, C.; Liang, Z.; Jing, Z.; Heng, Y.; Shanshan, S.; Fei, X.; Zhong, W. Structural development of wheat nutrient transfer tissues and their relationships with filial tissues development. Protoplasma 2015, 252, 605–617. [Google Scholar] [CrossRef]
- Morrison, I.N. The structure of the chlorophyll-containing cross cells and tube cells of the inner pericarp of wheat during grain development. Bot. Gaz. 1976, 187, 85–93. [Google Scholar] [CrossRef]
- Lee, D.R.; Atkey, P.T. Water loss from the developing caryopsis of wheat (Triticum aestivum). Can. J. Bot. 1984, 62, 1319–1326. [Google Scholar] [CrossRef]
- Evers, A.D.; Bechtel, D.B. Microscopic structure of the wheat grain. In Wheat: Chemistry and Technology; Pomeranz, Y., Ed.; American Association of Cereal Chemists: St. Paul, MN, USA, 1988. [Google Scholar]
- Shewry, P.R.; Mitchell, R.A.C.; Tosi, P.; Wan, Y.; Underwood, C.; Lovegrove, A.; Freeman, J.; Toole, G.A.; Mills, E.N.C.; Ward, J.L. An integrated study of grain development of wheat (cv. Hereward). J. Cereal Sci. 2012, 56, 21–30. [Google Scholar] [CrossRef]
- Gubatz, S.; Dercksen, V.J.; Bruss, C.; Weschke, W.; Wobus, U. Analysis of barley (Hordeum vulgare) grain development using three-dimensional digital models. Plant J. 2007, 11, 779–790. [Google Scholar] [CrossRef]
- Bhawana; Miller, J.L.; Cahoon, A.B. 3D Plant Cell Architecture of Arabidopsis thaliana (Brassicaceae) Using Focused Ion Beam–Scanning Electron Microscopy. Appl. Plant Sci. 2014, 2, 1300090. [Google Scholar] [CrossRef]
- Kittelmann, M.; Hawes, C.; Hughes, L. Serial block face scanning electron microscopy and the reconstruction of plant cell membrane systems. J. Microsc. 2016, 263, 200–211. [Google Scholar] [CrossRef]
- Miki, Y.; Saito, S.; Niki, T.; Gladish, D.K. Three-dimensional digital image construction of metaxylem vessels in root tips of Zea mays subsp. mexicana from thin transverse sections. Appl. Plant Sci. 2020, 8, e11347. [Google Scholar] [CrossRef]
- Glidewell, S.M. NMR imaging of developing barley grains. J. Cereal Sci. 2006, 43, 70–78. [Google Scholar] [CrossRef]
- Borisjuk, L.; Rolletschek, H.; Neuberger, T. Surveying the plant’s world by magnetic resonance imaging. Plant J. 2012, 70, 129–146. [Google Scholar] [CrossRef]
- Chateigner-Boutin, A.-L.; Alvarado, C.; Devaux, M.-F.; Durand, S.; Foucat, L.; Gearon, A.; Grélard, F.; Jamme, F.; Rogniaux, H.; Saulnier, L.; et al. The endosperm cavity of wheat grains contains a highly hydrated gel of arabinoxylan. Plant Sci. 2021, 306, 110845. [Google Scholar] [CrossRef]
- Stuppy, W.H.; Maisano, J.A.; Colbert, M.W.; Rudall, P.J.; Rowe, T.B. Three-dimensional analysis of plant structure using high-resolution X-ray computed tomography. Trends Plant Sci. 2003, 8, 2–6. [Google Scholar] [CrossRef]
- Dhondt, S.; Vanhaeren, H.; Loo, D.V.; Cnudde, V.; Inze, D. Plant structure visualization by high-resolution X-ray computed tomography. Trends Plant Sci. 2010, 15, 419–422. [Google Scholar] [CrossRef] [PubMed]
- Mooney, S.J.; Pridmore, T.P.; Helliwell, J.; Bennett, M.J. Developing X-ray Computed Tomography to non-invasively image 3-D root systems architecture in soil. Plant Soil 2012, 352, 1–22. [Google Scholar] [CrossRef]
- Cochard, H.; Delzon, S.; Badel, E. X-ray microtomography (micro-CT): A reference technology for high-resolution quantification of xylem embolism in trees. Plant Cell Environ. 2015, 38, 201–206. [Google Scholar] [CrossRef] [PubMed]
- Piovesan, A.; Vancauwenberghe, V.; Van De Looverbosch, T.; Verboven, P.; Nicolaï, B. X-ray computed tomography for 3D plant imaging. Trends Plant Sci. 2021, 26, 1171–1185. [Google Scholar] [CrossRef] [PubMed]
- Suresh, A.; Neethirajan, S. Real-time 3D visualization and quantitative analysis of internal structure of wheat kernels. J. Cereal Sci. 2015, 63, 81–87. [Google Scholar] [CrossRef]
- Guelpa, A.; du Plessis, A.; Manley, M. A high-throughput X-ray micro-computed tomography (μCT) approach for measuring single kernel maize (Zea mays L.) volumes and densities. J. Cereal Sci. 2016, 69, 321–328. [Google Scholar] [CrossRef]
- Strange, H.; Zwiggelaar, R.; Sturrock, C.; Mooney, S.J.; Doonan, J.H. Automatic estimation of wheat grain morphometry from computed tomography data. Funct. Plant Biol. 2014, 42, 452–459. [Google Scholar] [CrossRef] [Green Version]
- Schoeman, L.; Williams, P.; du Plessis, A.; Manley, M. X-ray micro-computed tomography (micro-CT) for non-destructive characterisation of food microstructure. Trends Food Sci. Technol. 2016, 47, 10–24. [Google Scholar] [CrossRef]
- Hughes, N.; Askew, K.; Scotson, C.P.; Williams, K.; Sauze, C.; Corke, F.; Doonan, J.H.; Nibau, C. Non-destructive, high-content analysis of wheat grain traits using X-ray micro computed tomography. Plant Methods 2017, 13, 76. [Google Scholar] [CrossRef] [Green Version]
- Tracy, S.R.; Gómez, J.F.; Sturrock, C.J.; Wilson, Z.A.; Ferguson, A.C. Non-destructive determination of floral staging in cereals using X-ray micro computed tomography (µCT). Plant Methods 2017, 13, 9. [Google Scholar] [CrossRef] [PubMed] [Green Version]
- Cloetens, P.; Mache, R.; Schlenker, M.; Lerbs-Mache, S. Quantitative phase tomography of Arabidopsis seeds reveals intercellular void network. Proc. Natl. Acad. Sci. USA 2006, 103, 14626–14630. [Google Scholar] [CrossRef] [Green Version]
- Rousseau, D.; Widiez, T.; Di Tommaso, S.; Rositi, H.; Adrien, J.; Maire, E.; Langer, M.; Olivier, C.; Peyrin, F.; Rogowsky, P. Fast virtual histology using X-ray in-line phase tomography: Application to the 3D anatomy of maize developing seeds. Plant Methods 2015, 11, 55. [Google Scholar] [CrossRef]
- Kunishima, N.; Takeda, Y.; Hirose, R.; Kalasová, D.; Šalplachta, J.; Omote, K. Visualization of internal 3D structure of small live seed on germination by laboratory-based X-ray microscopy with phase contrast computed tomography. Plant Methods 2020, 16, 7. [Google Scholar] [CrossRef] [PubMed]
- King, A.; Guignot, N.; Zerbino, P.; Boulard, E.; Desjardins, K.; Bordessoule, M.; Leclerq, N.; Le, S.; Renaud, G.; Cerato, M.; et al. Tomography and imaging at the PSICHE beam line of the SOLEIL synchrotron. Rev. Sci. Instrum. 2016, 87, 093704. [Google Scholar] [CrossRef] [PubMed] [Green Version]
- Paganin, D.; Mayo, S.C.; Gureyev, T.E.; Miller, P.R.; Wilkins, S.W. Simultaneous phase and amplitude extraction from a single defocused image of a homogeneous object. J. Microsc. 2002, 206, 33–40. [Google Scholar] [CrossRef]
- Mirone, A.; Brun, E.; Gouillart, E.; Tafforeau, P.; Kieffer, J. The PyHST2 hybrid distributed code for high speed tomographic reconstruction with iterative reconstruction and a priori knowledge capabilities. Nucl. Instrum. Methods Phys. Res. Sect. B 2014, 324, 41. [Google Scholar] [CrossRef] [Green Version]
- Schindelin, J.; Arganda-Carreras, I.; Frise, E.; Kaynig, V.; Longair, M.; Pietzsch, T.; Preibisch, S.; Rueden, C.; Saalfeld, S.; Schmid, B.; et al. Fiji: An open-source platform for biological-image analysis. Nat. Methods 2012, 9, 676–682. [Google Scholar] [CrossRef] [Green Version]
- Legland, D.; Arganda-Carreras, I.; Andrey, P. MorphoLibJ: Integrated library and plugins for mathematical morphology with ImageJ. Bioinformatics 2016, 32, 3532–3534. [Google Scholar] [CrossRef] [PubMed] [Green Version]
- Fanuel, M.; Ropartz, D.; Guillon, F.; Saulnier, L.; Rogniaux, H. Distribution of cell wall hemicelluloses in the wheat grain endosperm: A 3D perspective. Planta 2018, 248, 1505–1513. [Google Scholar] [CrossRef]
- Rousseau, D.; Chéné, Y.; Belin, E.; Semaan, G.; Trigui, G.; Boudehri, K.; Franconi, F.; Chapeau-Blondeau, F. Multiscale imaging of plants: Current approaches and challenges. Plant Methods 2015, 11, 6. [Google Scholar] [CrossRef] [PubMed] [Green Version]
- Grélard, F.; Legland, D.; Fanuel, M.; Arnaud, B.; Foucat, L.; Rogniaux, H. Esmraldi: Efficient methods for the fusion of mass spectrometry and magnetic resonance images. BMC Bioinform. 2021, 22, 56. [Google Scholar] [CrossRef] [PubMed]

Publisher’s Note: MDPI stays neutral with regard to jurisdictional claims in published maps and institutional affiliations. |
© 2022 by the authors. Licensee MDPI, Basel, Switzerland. This article is an open access article distributed under the terms and conditions of the Creative Commons Attribution (CC BY) license (https://creativecommons.org/licenses/by/4.0/).