Article

Anti-Hyperuricemic Effect of Ethyl Acetate Sub-Fractions from Chrysanthemum morifolium Ramat. Dried Flowers on Potassium Oxonate-Induced Hyperuricemic Rats

1
Department of Bioscience, Faculty of Applied Sciences, Tunku Abdul Rahman University College, Jalan Genting Kelang, Setapak, Kuala Lumpur 53300, Malaysia
2
Department of Physical Science, Faculty of Applied Sciences, Tunku Abdul Rahman University College, Jalan Genting Kelang, Setapak, Kuala Lumpur 53300, Malaysia
*
Author to whom correspondence should be addressed.
Appl. Sci. 2022, 12(7), 3487; https://doi.org/10.3390/app12073487
Submission received: 22 February 2022 / Revised: 24 March 2022 / Accepted: 24 March 2022 / Published: 30 March 2022

Abstract

:
Xanthine oxidase (XO) plays an important role in purine degradation in humans. The study aimed to determine the XO inhibitory potential of Chrysanthemum morifolium dried flower ethyl acetate sub-fractions and its anti-hyperuricemic effect in rat models. Bioassay-guided fractionation based on XO inhibitory assay was employed to obtain bioactive fractions and sub-fractions. In vitro cytotoxicity and cellular antioxidant capacity of the sub-fraction and its mode of XO inhibition were also investigated. The anti-hyperuricemic effect of the bioactive sub-fraction was investigated using rat models via oral consumption, and followed by an XO mRNA gene expression study. The compounds in the bioactive sub-fractions were identified putatively using HPLC-Q-TOF-MS/MS. Ethyl acetate (EtOAc) fraction exhibited the highest XO inhibition among the fractions. It was further fractionated into 15 sub-fractions. F10 exhibited high XO inhibitory activity, cellular pro-proliferative effect, and intracellular antioxidant activity among the sub-fractions tested. This sub-fraction was non-cytotoxic at 0.1–10 µg/mL, and very effective in lowering serum and urine uric acid level in rat models upon oral consumption. A total of 26 known compounds were identified and seven unknown compounds were detected via HPLC-Q-TOF–MS/MS analysis. The possible mechanisms contributing to the anti-hyperuricemic effect were suggested to be the non-competitive inhibition of XO enzyme, XO gene expression down-regulation, and the enhancement of uric acid excretion.

Graphical Abstract

1. Introduction

Gout is a common form of inflammatory arthritis that affects the joints and musculoskeletal system. It is induced by monosodium urate crystals deposition within the synovial fluid and other body tissues [1]. Hyperuricemia is a condition of the overproduction or under-excretion of uric acid. This condition is caused by high dietary intake of foods that are rich in nucleic acids, and is defined as a serum uric acid level greater than 7.0 mg/mL [2]. Xanthine oxidase (XO) is the key enzyme that catalyses the oxidation of hypoxanthine and xanthine to uric acid. During purine metabolism, XO produces reactive oxygen species (ROS) by transferring electrons to oxygen from hypoxanthine and xanthine [3]. Superoxide anion radicals generated by XO catalysing reactions are involved in various pathological conditions such as inflammation, hepatitis, and carcinogenesis.
Allopurinol is being used clinically as an XO inhibitor for gout treatment by blocking the terminal step of uric acid biosynthesis. However, it results in many side effects, such as hepatitis, nephropathy, and allergic reactions [4]. Therefore, it is necessary to search for new alternatives which confer higher therapeutic activity and lesser side effects. Natural products are excellent sources of lead compounds in the search of new medication for clinical disorders with fewer side effects. Botanical extracts have been used to treat diseases, and play a major role in primary health care in many developing countries.
Chrysanthemum morifolium is an edible flower that is commonly used in traditional Chinese medicine, particularly for its liver balancing properties. The flower portion of C. morifolium has been used as an edible and medicinal material for hundreds of years as a sedative due to its cooling abilities [5]. It contains essential oils, sesquiterpenes, and phenolic compounds, and has been reported to demonstrate various biological activities, such as anti-oxidative, anti-inflammatory, anti-mutagenicity, and anti-HIV [1]. Numerous in vivo studies on the anti-hyperuricemic activity of other plant extracts have been conducted [4,6], but deeper investigation into C. molifolium has not been performed. Therefore, the present study investigated the anti-hyperuricemic potential of C. morifolium flower ethyl acetate sub-fractions in rat models, followed by an XO mRNA gene expression study.
The objectives of the present study were to investigate the XO inhibitory activity, cytotoxicity, and cellular antioxidant capacity of ethyl acetate sub-fractions of C. morifolium Ramat. dried flower and its mode of XO inhibition. The effects of C. morifolium flower ethyl acetate sub-fraction on rats’ uric acid levels and XO gene expression were also determined in this study. The compounds present in the bioactive sub-fractions were identified using HPLC-Q-TOF-MS/MS.

2. Materials and Methods

2.1. Plant Materials

Dried flowers of C. morifolium Ramat. originating from Hang Zhou, China, were procured from a Chinese drug store (Lee Mun Onn Medicine Store) in Petaling Jaya (GPS coordinates: 3.0875° N, 101.6451° E), Selangor, Malaysia, in May 2017. Authentication of the plant sample was carried out by a botanist, Dr. Mohd. Firdaus Ismail, at the Biodiversity Unit, Institute of Bioscience, Universiti Putra Malaysia, and a voucher specimen (SK3139/17) was deposited at the unit’s herbarium.

2.2. Chemicals and Reagents

HPLC grade solvents such as methanol, petroleum ether, ethyl acetate, dimethyl sulfoxide (DMSO), hexane, chloroform, and acetonitrile, as well as celite and culture Dulbecco’s Modified Eagle Medium: Nutrient Mixture F-12 (DMEM-F12), were purchased from ThermoFisher Scientific (Waltham, MA, USA). Potassium phosphates monobasic, dibasic, xanthine, allopurinol, crystal violet, trypan blue staining solution, sodium dodecyl sulfate (SDS), 2′-7′dichlorofluorescin diacetate (DCFH-DA), tert-butyl hydroperoxide (tBuOOH), 5-sulfosalicyclic acid dihydrate (SSA), and 2-vinylpyridine were purchased from Sigma Aldrich (St. Louis, MO, USA). Enzyme of xanthine oxidase from cow’s milk was purchased from Roche Diagnostics (Mannheim, Germany). Preparative layer plates (Silica gel 60 F254, 20 cm × 20 cm) and silica gel 60 (230–400 meshes ASTM; 0.040–0.063 mm) were purchased from Merck (Rahway, NJ, USA). Phosphate buffered saline was purchased from First Base Laboratories Sdn Bhd (Selangor, Malaysia). SYBR Green Master Mix was purchased from Bio-Rad Laboratories (Hercules, CA, USA), and ultrapure water from a Mili-Q® purification system was used in this research.

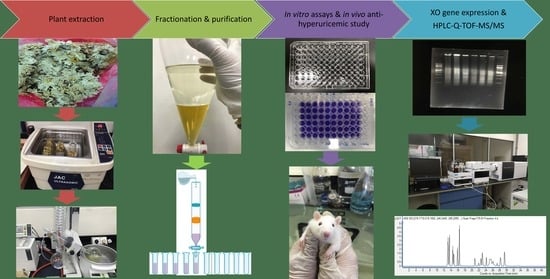
2.3. Plant Extraction and Solvent-Solvent Partition

Dried flowers of C. morifolium were ground and approximately 500 g of the dried powder was sonicated in 80% methanol (2 L) for 2 h at 25 °C. The 80% hydromethanolic filtrate was evaporated using a rotary evaporator to obtain a crude extract. The crude extract (58.86 g) was dissolved in 400 mL of methanol and then partitioned thrice using equal volume of petroleum ether. The residual crude extract was added to distilled water (1:1 v/v), and then partitioned with equal volume of ethyl acetate (EtOAc) thrice. Each fraction was concentrated under reduced pressure to obtain petroleum ether (PE) fraction, ethyl acetate (EtOAc) fraction, and residual (RS) fraction. All fractions were weighed and stored at −80 °C until further use.

2.4. Xanthine Oxidase Inhibitory Activity

The XO inhibitory activity was determined by evaluating the formation of uric acid from xanthine measured at 295 nm [7]. Test samples were dissolved in DMSO and diluted to different concentrations (12.5–400 µg/mL). All reactions were performed in triplicates (n = 3) in a 96-well UV microplate (Infinite M200Pro, Tecan Group Ltd., Männedorf, Switzerland). Blank (without enzyme) and negative control containing the assay mixture without sample extract were also prepared. Allopurinol was used as a positive control in the assay mixture.

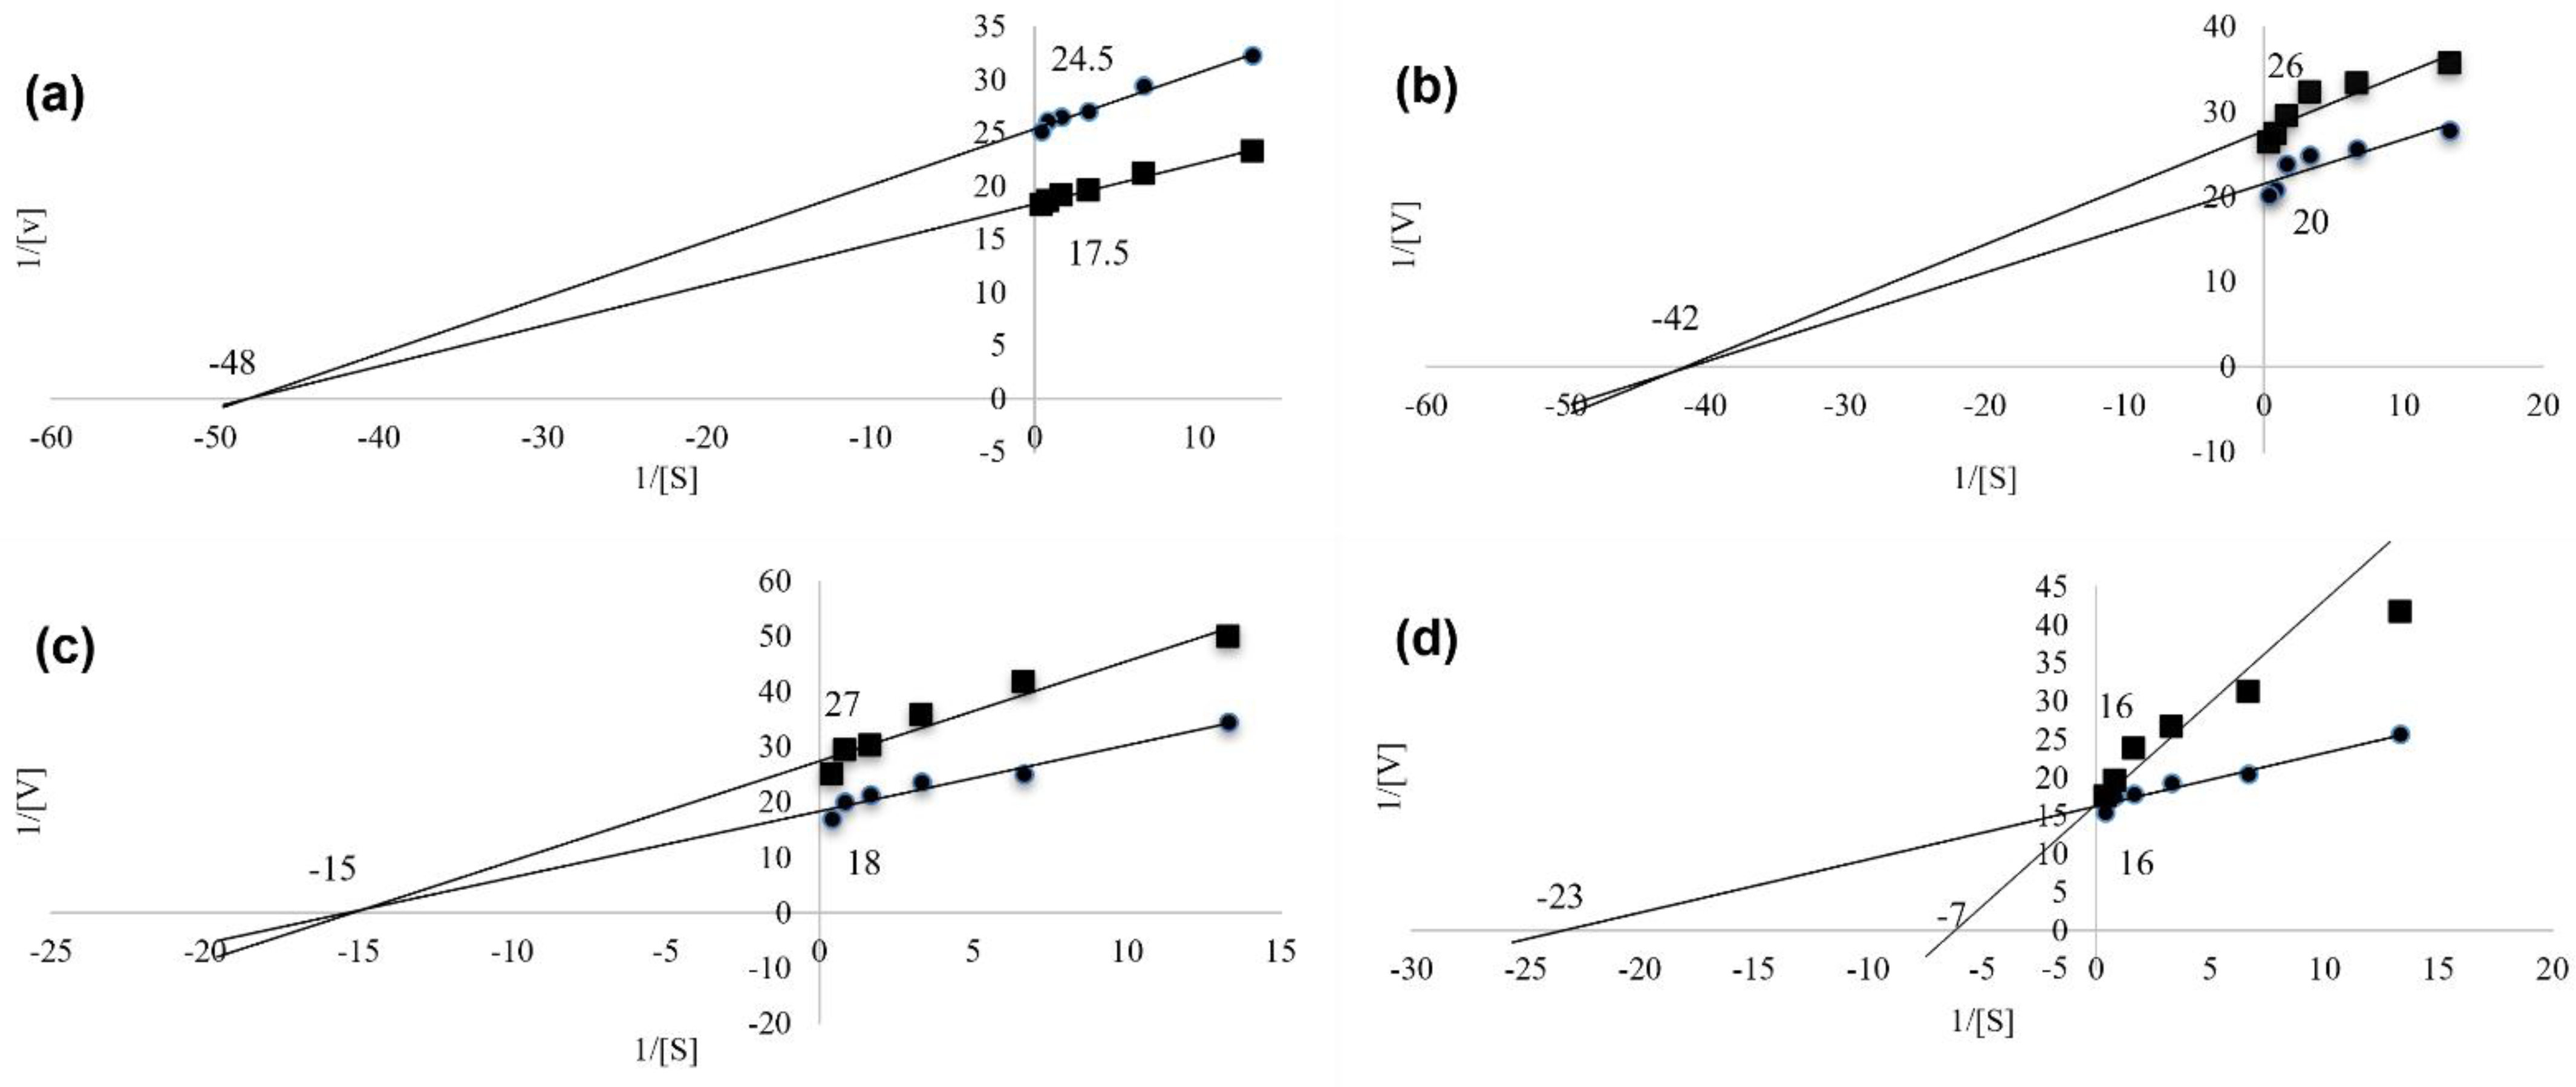
2.5. Xanthine Oxidase Enzyme Kinetic

Lineweaver-Burk plot analysis was performed to determine the inhibitory mode of the active fractions and sub-fractions. The kinetic study was carried out in the absence and presence of inhibitor with varying concentrations (0.075–2.4 mM) of xanthine as substrate, by using the XO inhibitory activity assay. The mode of inhibition was determined from the slope of the Lineweaver-Burk plot for competitive, non-competitive, and mixed-type inhibition.

2.6. Bioassay-Guided Fractionation Using Column Chromatography

Approximately 2.50 g of the ethyl acetate fraction of C. morifolium was subjected to silica gel open column chromatography using silica gel 60 (230–400 meshes ASTM; 0.040–0.063 mm; Merck, Kenilworth, NJ, USA) as stationary phase. Separation was accomplished by eluting 660 mL of various solvent mixtures using mobile phase of increasing polarity from 70:30, 60:40, 50:50, 40:60, 30:70, 20:80, 10:90, 0:100 (v/v) of hexane: ethyl acetate. The residuals in the column were recovered by the sequential elution of an equal volume of methanol, followed by an equal volume of methanol: chloroform mixture (1:1, v/v). The sub-fractions were collected and evaporated. They were subjected to thin layer chromatography (TLC) (Silica gel 60 F254 20 cm × 20 cm; Merck) profiling by using hexane: ethyl acetate (1:1) as mobile phase. The sub-fractions with the same retention factor (Rf) were pooled together to obtain 15 sub-fractions (F1–F15). All the sub-fractions were subjected to XO inhibitory assay and the bioactive sub-fraction was fractionated further. Refer to the flow chart (Figure 1) of bioassay-guided fractionation.

2.7. Trypan Blue Exclusion Assay

HepG2 cells were seeded and grown in a six-well plate (3 × 10⁵ cells/well) with fetal bovine serum containing solution (1.5 mL). The medium was washed and replaced until the cell confluency reached 70%. The cells were treated with test samples and incubated for 24 h in a CO2 incubator at 37 °C. The medium was aspirated and 0.5 mL trypsin was added and incubated for 5 min. Next, the cell suspension was collected into tubes accordingly. Tubes containing HepG2 cells were re-suspended. The cells were then stained by combining 20 µL of cell sample with 20 µL of trypan blue staining solution to obtain 0.1% final concentration. Next, 20 µL of mixed cell sample was loaded into the Nexcelom Cellometer counting chamber and inserted into an Auto T4 sample slot. The cell sample was analysed. Live cells, as well as dead cells, total cells, percentage of viability, live cell concentration, and total cell concentration were determined and calculated [8].

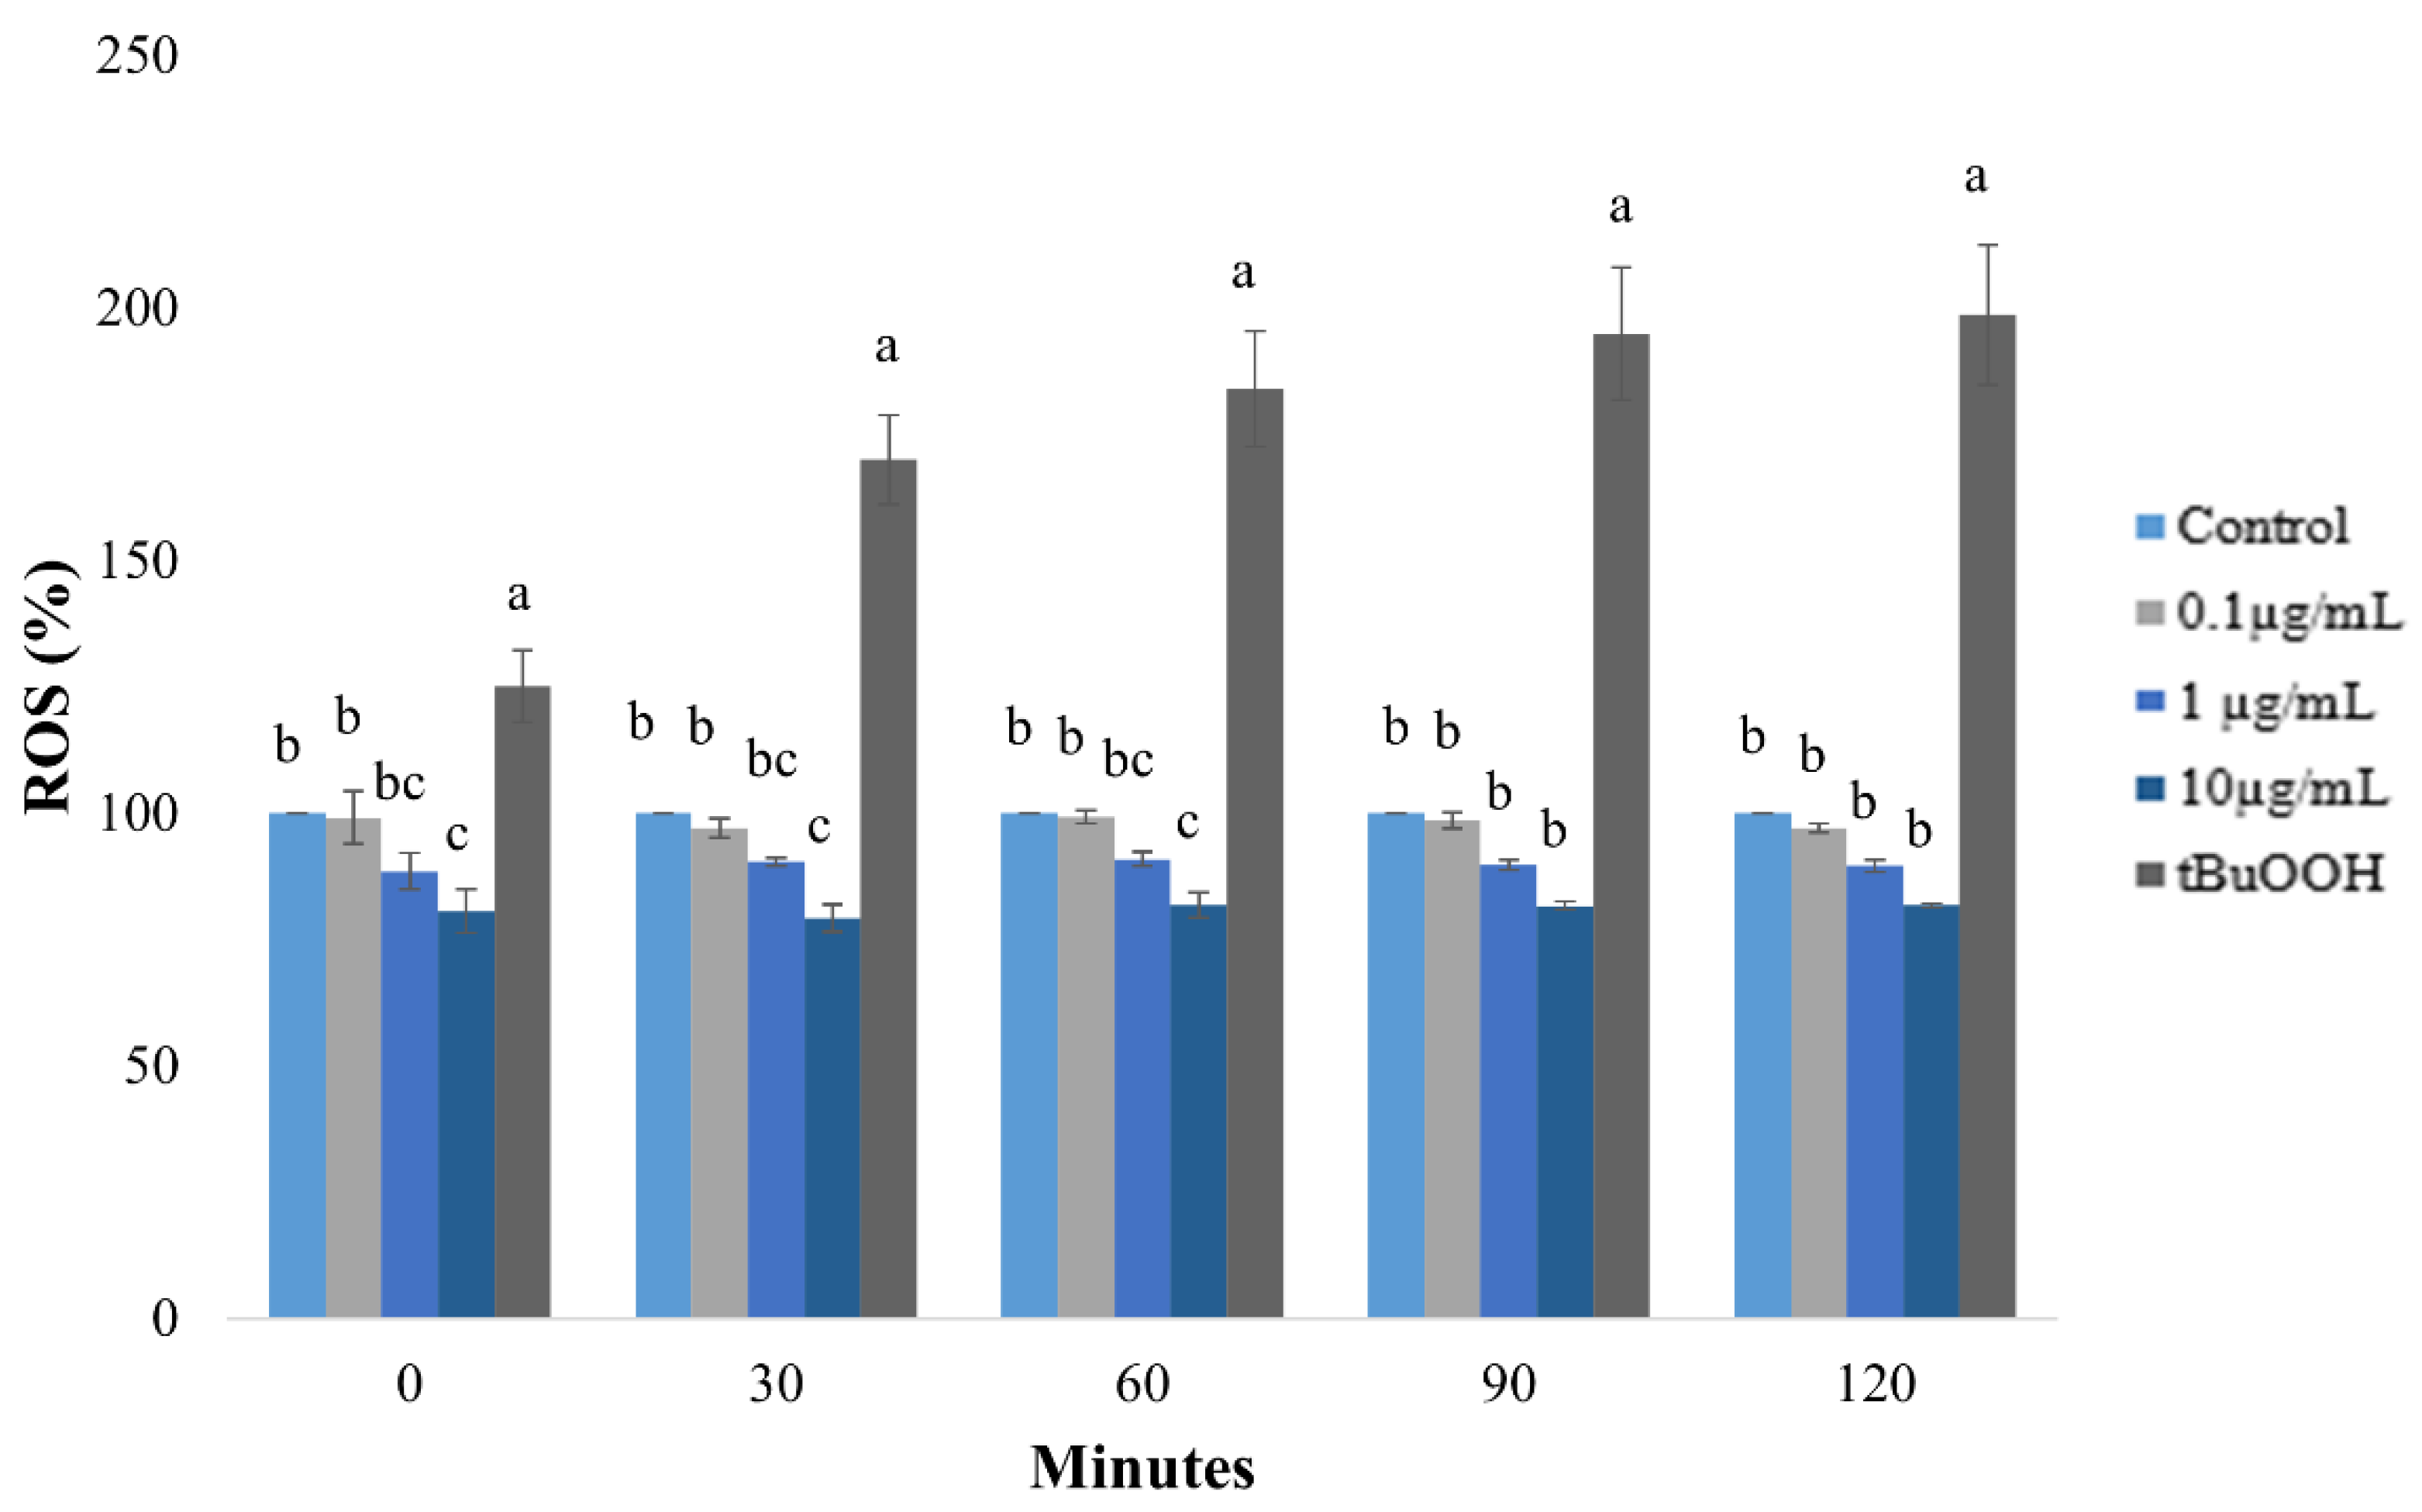
2.8. Reactive Oxygen Species (ROS) Direct Assay

HepG2 cells were seeded and grown in 24-multiwell plates (2 × 10⁵ cells/well) with FBS containing solution (500 µL). The medium was washed and replaced until the cell confluency reached 70%. The medium was changed to DMEM-F12 without FBS and incubated for 24 h in a CO2 incubator at 37 °C. Then, 10 µL of 2′,7′-dichlorodihydrofluorescein diacetate (5 µM) reagent was added into the wells and incubated in a CO2 incubator for 45 min. The medium was washed out using one mL of 1× PBS solution twice. The cells were treated with 500 µL of tert-butyl hydroperoxide (400 µM) as a positive control, and with test samples at different concentrations (0.1–10 µg/mL). Absorbance was obtained immediately at an excitation of 485 nm/± 20 and emission of 528 nm/± 20, and repeated every 30 min for 2 h [9].

2.9. Anti-Hyperuricemic Effects of C. morifolium in Potassium Oxonate-Induced Rats

Male Sprague Dawley® (SD) rats (7 weeks) were acclimatized to the laboratory conditions on a normal diet for at least one week prior to the experiment. The animals were provided with a rodent diet and clean water ad libitum, except during the hour prior to drug administration, whereby access to food was restricted. All the animal experimental protocols were approved by Tunku Abdul Rahman University College Ethics Committee (approval number: TARUC/EC/2017/04-2). All efforts were made to minimize the suffering and distress of the rats.
All the rats were randomly divided into five groups of six (n = 6) rats each. Experimental hyperuricemia was induced by injection of a uricase inhibitor, potassium oxonate (PO). The rats were intraperitoneally injected with phosphate-buffered saline (PBS) containing 250 mg/kg of PO (except normal control group) 1 h before the administration of test samples to increase the serum uric acid (SUA) level on a daily basis for 7 days. After 1 h, the rats were treated with 25 mg/kg and 50 mg/kg of C. morifolium EtOAc F10 via oral gavage. The extract was replaced by PBS (pH 7.4) and water in negative and normal control groups, respectively.
Allopurinol (10 mg/kg) was used as a positive control in this study. On day 6, each rat was kept separately for urine collection using the single animal method [10]. Blood samples were collected by rats’ tail vein bleeding on day 7. On day 8, the rats were euthanized under CO2 and blood samples were collected by cardiac puncture. Blood samples were transferred to sterile tubes and allowed to clot on ice for 30 min. The blood was centrifuged at 2000× g for 15 min at 4 °C to obtain serum. The urine and serum samples were stored at −80 °C until assays. The rat livers were dissected immediately on ice and homogenized at frequency of 20 kHz for 5 min. The homogenate was frozen in liquid nitrogen and stored at −80 °C until XO inhibitory assay and gene expression analysis. SUA and urine uric acid (UUA) levels were measured by using an Amplex® Red uric acid/uricase assay kit (ThermoFisher Scientific, Waltham, MA, USA), while liver XO activity was measured by using an Amplex® Red xanthine/xanthine oxidase assay kit (ThermoFisher Scientific, Waltham, MA, USA).

2.10. qPCR Analysis of XO Gene Expression

qPCR analysis was carried out using Bio-Rad CFX96 Real-Time PCR, version 3.1 to determine the expression level of XO after drug administration. Three rats with serum uric acid (SUA) levels close to the mean value in each group (day 7) were selected. Total RNA was extracted from their livers using a NucleoSpin RNA kit (Macherey-Nagel GmbH & Co. KG, Düren, Germany). Next, RNA quality and quantity were determined by performing agarose gel electrophoresis and Nanodrop spectrophotometry. One-step Real-Time SYBR Green qPCR was performed. The primers (forward primer: 5′-GCATGCCAGACCATACTGAA-3′; and the reverse primer: 5′-AAATCCAGTTGCGGACAAAC-3′) for rat xanthine dehydrogenase (XDH; Gene ID: 497811, mRNA sequence: NM_017154) were purchased from IDT Singapore Pte Ltd., Singapore. The housekeeping gene, β-actin for rat (mRNA sequence: NM_031144) with primer sequences of 5′-ATTGTGATGGACTCCGGAGA-3′ (forward) and 5′-CAGCTCATAGCTCTTCTCCA-3′ (reverse) was purchased from MYTACG Bioscience Enterprise, Kuala Lumpur, Malaysia.

2.11. Putative Identification of XO Inhibitors Using HPLC-Q-TOF-MS/MS

EtOAc sub-fractions were analysed by using a Hypersil GOLD C18 column (150 × 4.6 mm, 5 µm, ThermoFisher Scienctific, Waltham, MA, USA) at 25 °C on Agilent 1260 Infinity HPLC with UV detector at 210 nm, 254 nm, and 280 nm wavelengths. The mobile phase consisted of water (A) and acetonitrile (B) with gradient elution (0–5 min, 98% A, 0.7 mL/min; 5–7 min, 85% A, 0.5 mL/min; 7–20 min, 25% A, 0.2 mL/min; 20–40 min, 15% A, 0.2 mL/min; 40–45 min, 10% A, 0.5 mL/min; 45–50 min, 0% A, 0.7 mL/min; 50–55 min, 98% A, 0.7 mL/min). A test sample of 20 µL was injected in each run. Samples were prepared at 10 ppm in HPLC grade methanol, filtered through 0.45 µm syringe filter (ThermoFisher Scientific, Waltham, MA, USA), and sent to Infra Advanced Laboratory, University of Malaya for the identification of compounds by using the Agilent 6200 series TOF/6500 series Q-TOF (Santa Clara, CA, USA) with ESI source (Santa Clara, CA, USA). HPLC-Q-TOF-MS/MS was performed in positive mode under the following operating parameters: scanning mode, total ion current (TIC), and extracted ion chromatogram (EIC); scanning range, 10–1700 m/z; fragmentor voltage, 175V; Gas flow, 14 L/minutes; and nebulizer, 35 psig. The mass spectrometry data were qualitatively analysed using MassHunter Workstation software (version B.05.01, Agilent Technologies) for possible markers, and were compared to standard online database such as METLIN metabolite database, Human Metabolome Database (HMDB), FooDB, PubChem, and KEGG metabolite databases.

2.12. Statistical Analysis

All data were analysed using Statistical Package for Social Sciences (SPSS) version 21.0 and expressed as mean ± standard error of mean (SEM). The data in the present study were subjected to one-way analysis of variance (ANOVA), and the significance of difference between the means was determined by post-hoc Duncan’s multiple range tests at 95% least significant difference (p ≤ 0.05).

3. Results

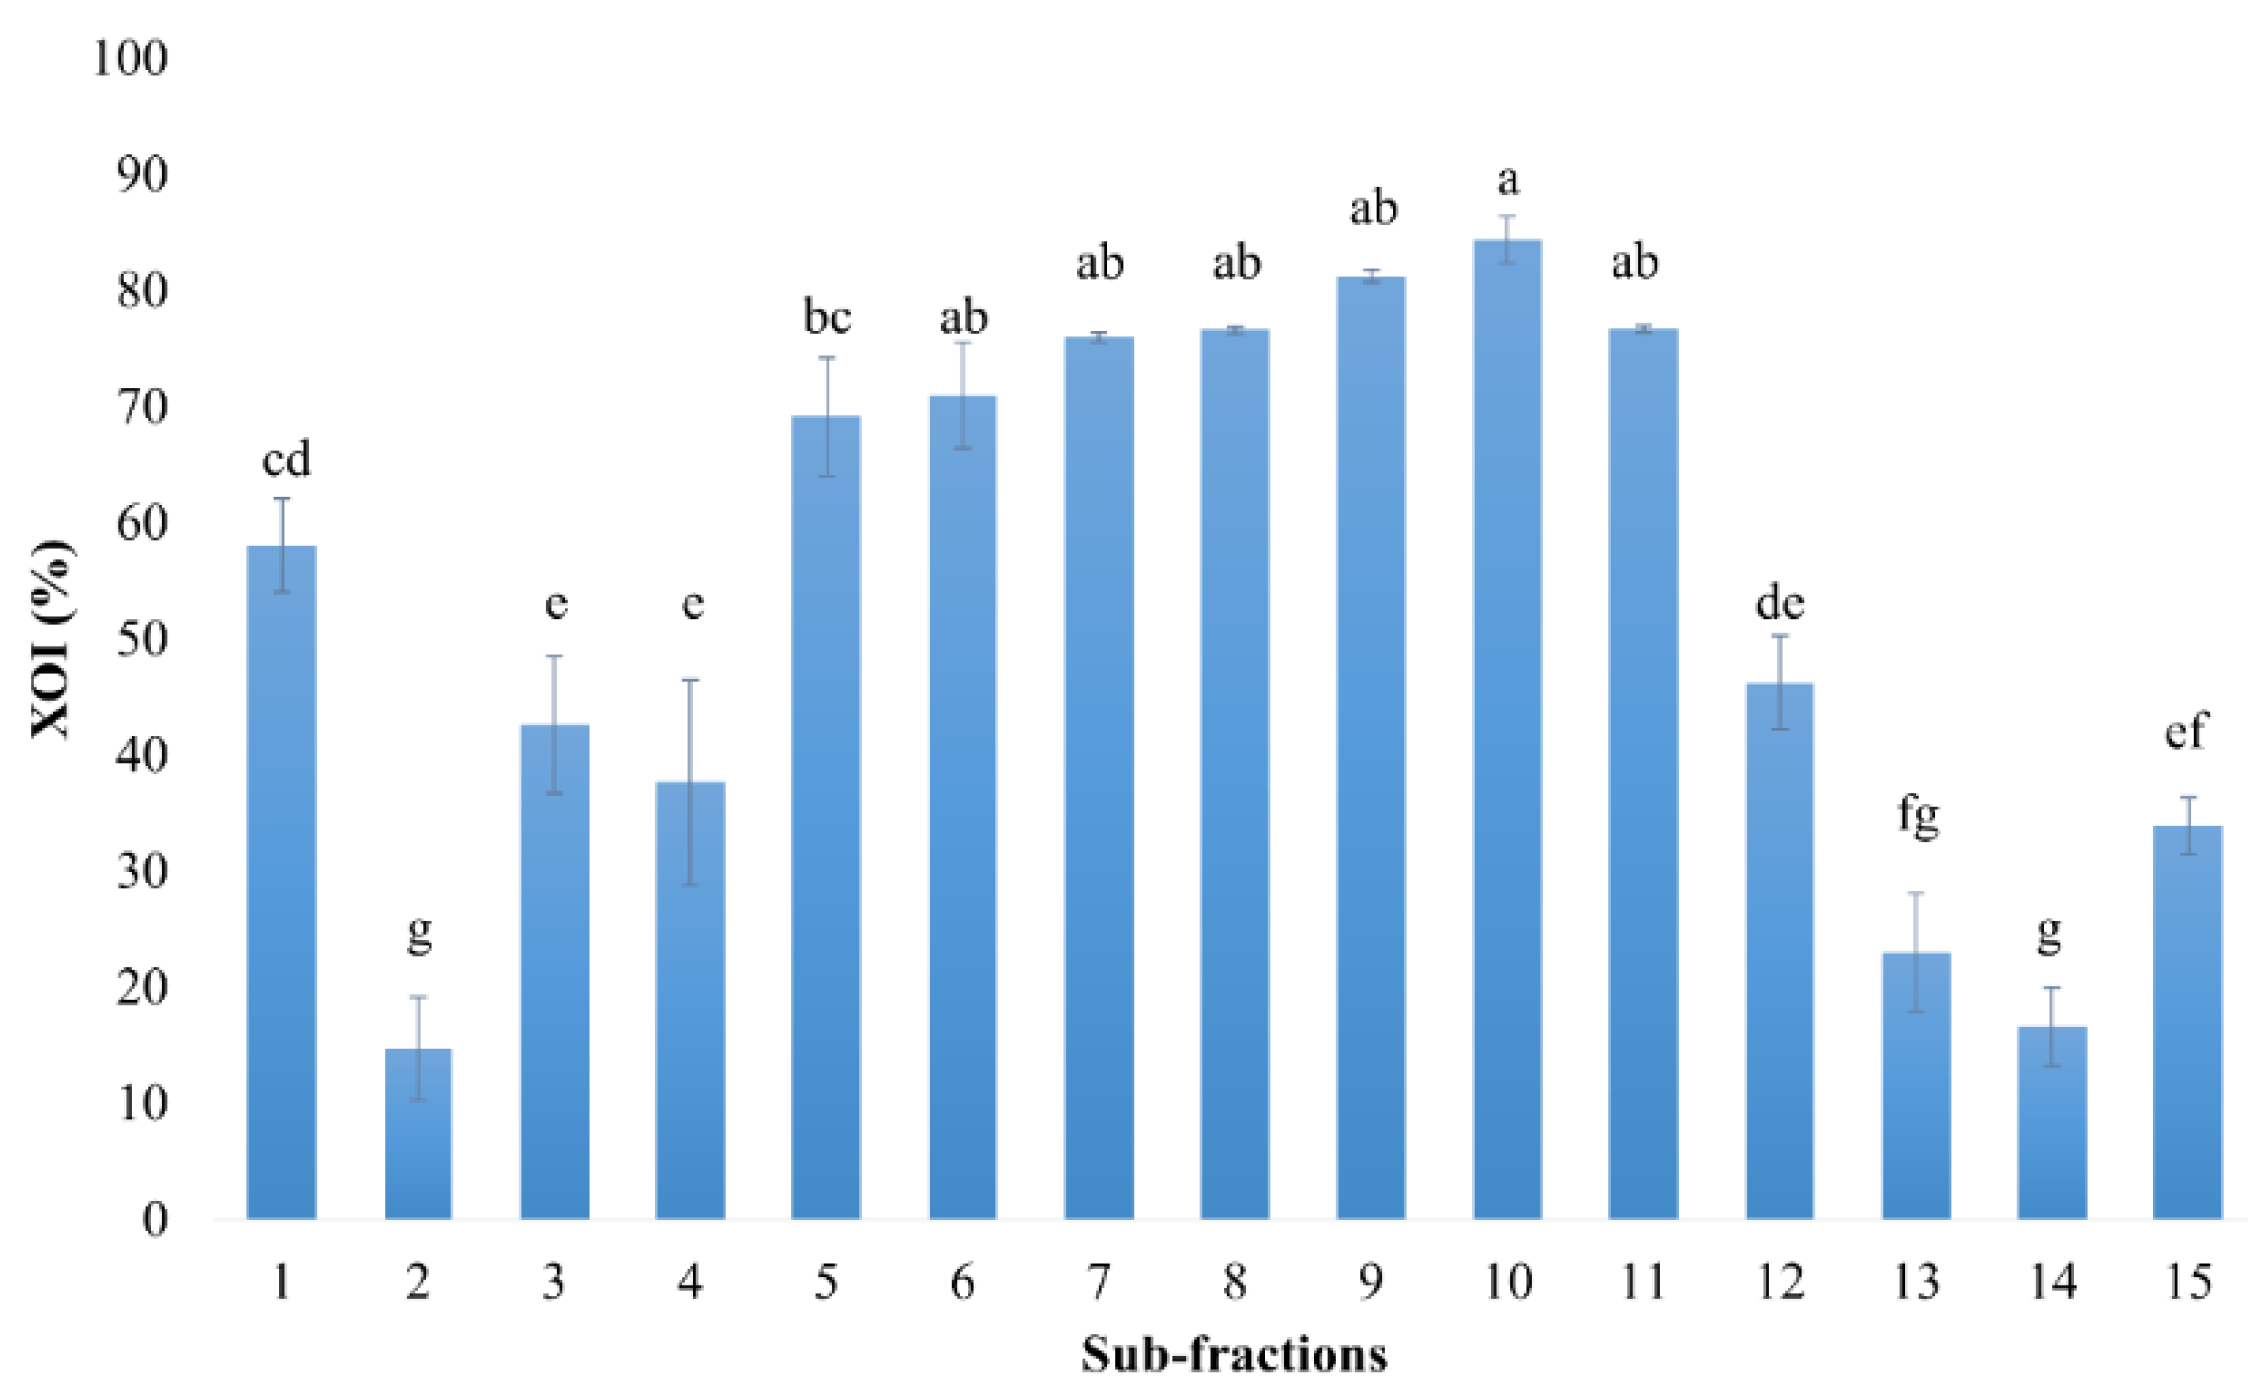
3.1. XO Inhibitory Activity of C. morifolium Fractions

The yield of fractions and sub-fractions of the bioassay-guided fractionation is presented in Figure 1. All the C. morifolium fractions and sub-fractions were analysed for their XO inhibitory activity and the results were tabulated in Table 1. One-way ANOVA analysis demonstrated that EtOAc fraction exhibited the highest XO inhibitory activity among the fractions. The activity was lower than the standard drug, allopurinol (positive control), which showed nearly 100% inhibition at the same concentration.
The inhibitory mechanism of the C. morifolium crude extract and its fractions were studied by using a double-reciprocal plot of enzyme kinetic. Lineweaver-Burk plots of XO activity in the presence and absence of inhibitor were shown in Figure 2. The results indicated that the mode of XO inhibition for the RS fraction was competitive, whereas the crude extract, EtOAc, and PE fractions were shown to be non-competitive. The most bioactive EtOAc fraction was fractionated through open column chromatography, and 15 sub-fractions were obtained. The XO inhibitory activity of the 15 sub-fractions showed that F7, F8, F9, F10, and F11 possessed high XO inhibitory activity (>75%) at 100 µg/mL, whereas other sub-fractions exhibited low to moderate inhibitory activity (Figure 3). The most bioactive subfraction F10 was chosen for all the subsequent cell culture experiments.

3.2. Cellular Assays

Prior to the in vivo experiment, the non-cytotoxic concentration of F10 was determined by using trypan blue exclusion assay. Based on Figure 4, there was a gradual rise in cell viability as the concentration of F10 was increased. The increased cell viability in F10 indicated that it is non-cytotoxic and has pro-proliferative effects towards HepG2 cells. These data suggested that F10 was highly non-cytotoxic to human liver carcinoma (HepG2) cells. Hence, the non-cytotoxic concentrations (0.1, 1 and 10 µg/mL) were selected for ROS direct assay for the determination of F10 innate antioxidant capacity.
Tert-Butyl hydroperoxide was used as a positive control in the ROS direct assay to increase the ROS level of HepG2 cells. Figure 5 showed the ROS activity of F10 at different concentrations. F10 reduced the intracellular ROS level significantly up to 60 min at 10 µg/mL. Hence, the EtOAc F10 was chosen for the in vivo study to investigate its anti-hyperuricemic effect in rat models.

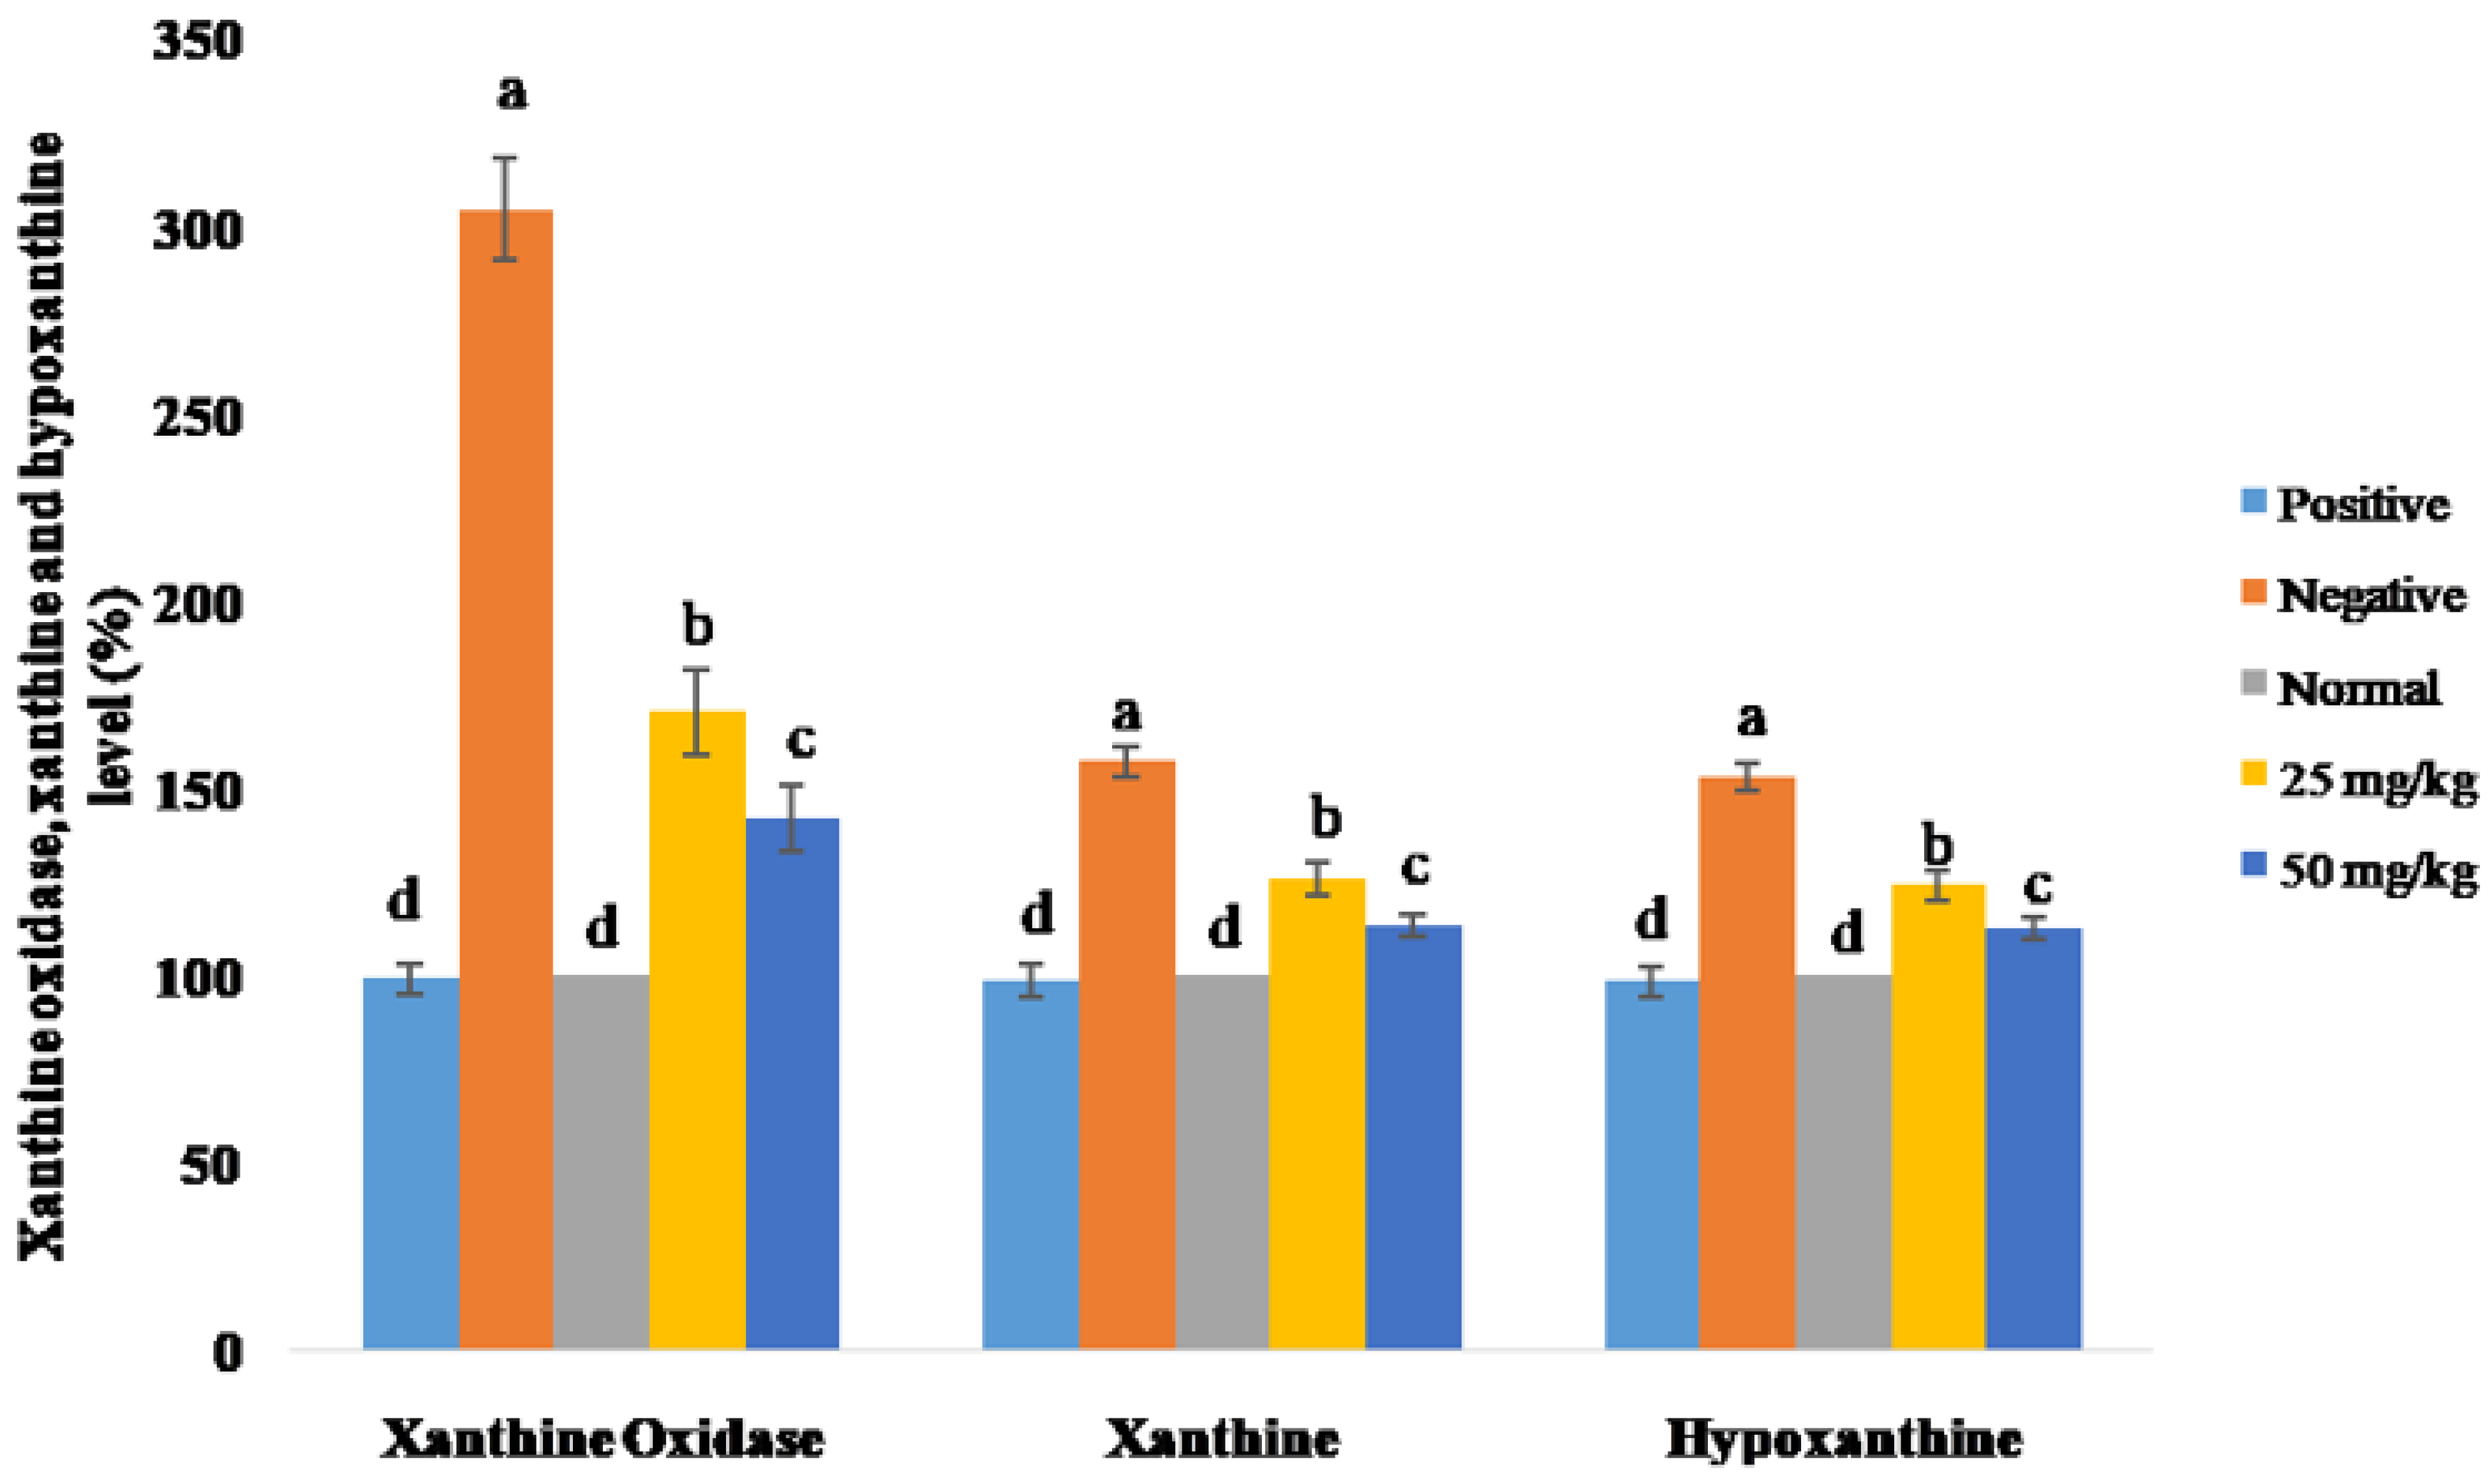
3.3. Anti-Hyperuricemic Effects of C. morifolium in Potassium Oxonate-Induced Rats

The results showed that the administration of potassium oxonate (250 mg/kg, i.p.) increased the SUA level of the negative control rats significantly (Table 2). Oral administration of allopurinol (positive control) at 10 mg/kg resulted in significant reductions of SUA level. The SUA level of the rats that received 25 mg/kg and 50 mg/kg of F10 was also lowered significantly as compared to the negative control. This indicated that both doses of F10 were effective in SUA level suppression. In addition to that, the SUA lowering efficacy of 50 mg/kg of F10 was not significantly different from that of the positive control.
On the other hand, the UUA level of the rats was shown to be significantly reduced by the administration of both doses of F10. However, the UUA level in rats treated with F10 was shown to be higher than that of allopurinol, which reduced the UUA to the basal level (similar to the normal control level). To elucidate the underlying mechanisms of the anti-hyperuricemic effects of F10, its effect on XO enzyme was evaluated. The results demonstrated that the administration of F10 significantly reduced the XO level in rats (Figure 6). Besides, administration of F10 also significantly reduced the xanthine and hypoxanthine levels relative to the negative control. However, the levels were shown to be higher than the normal control.

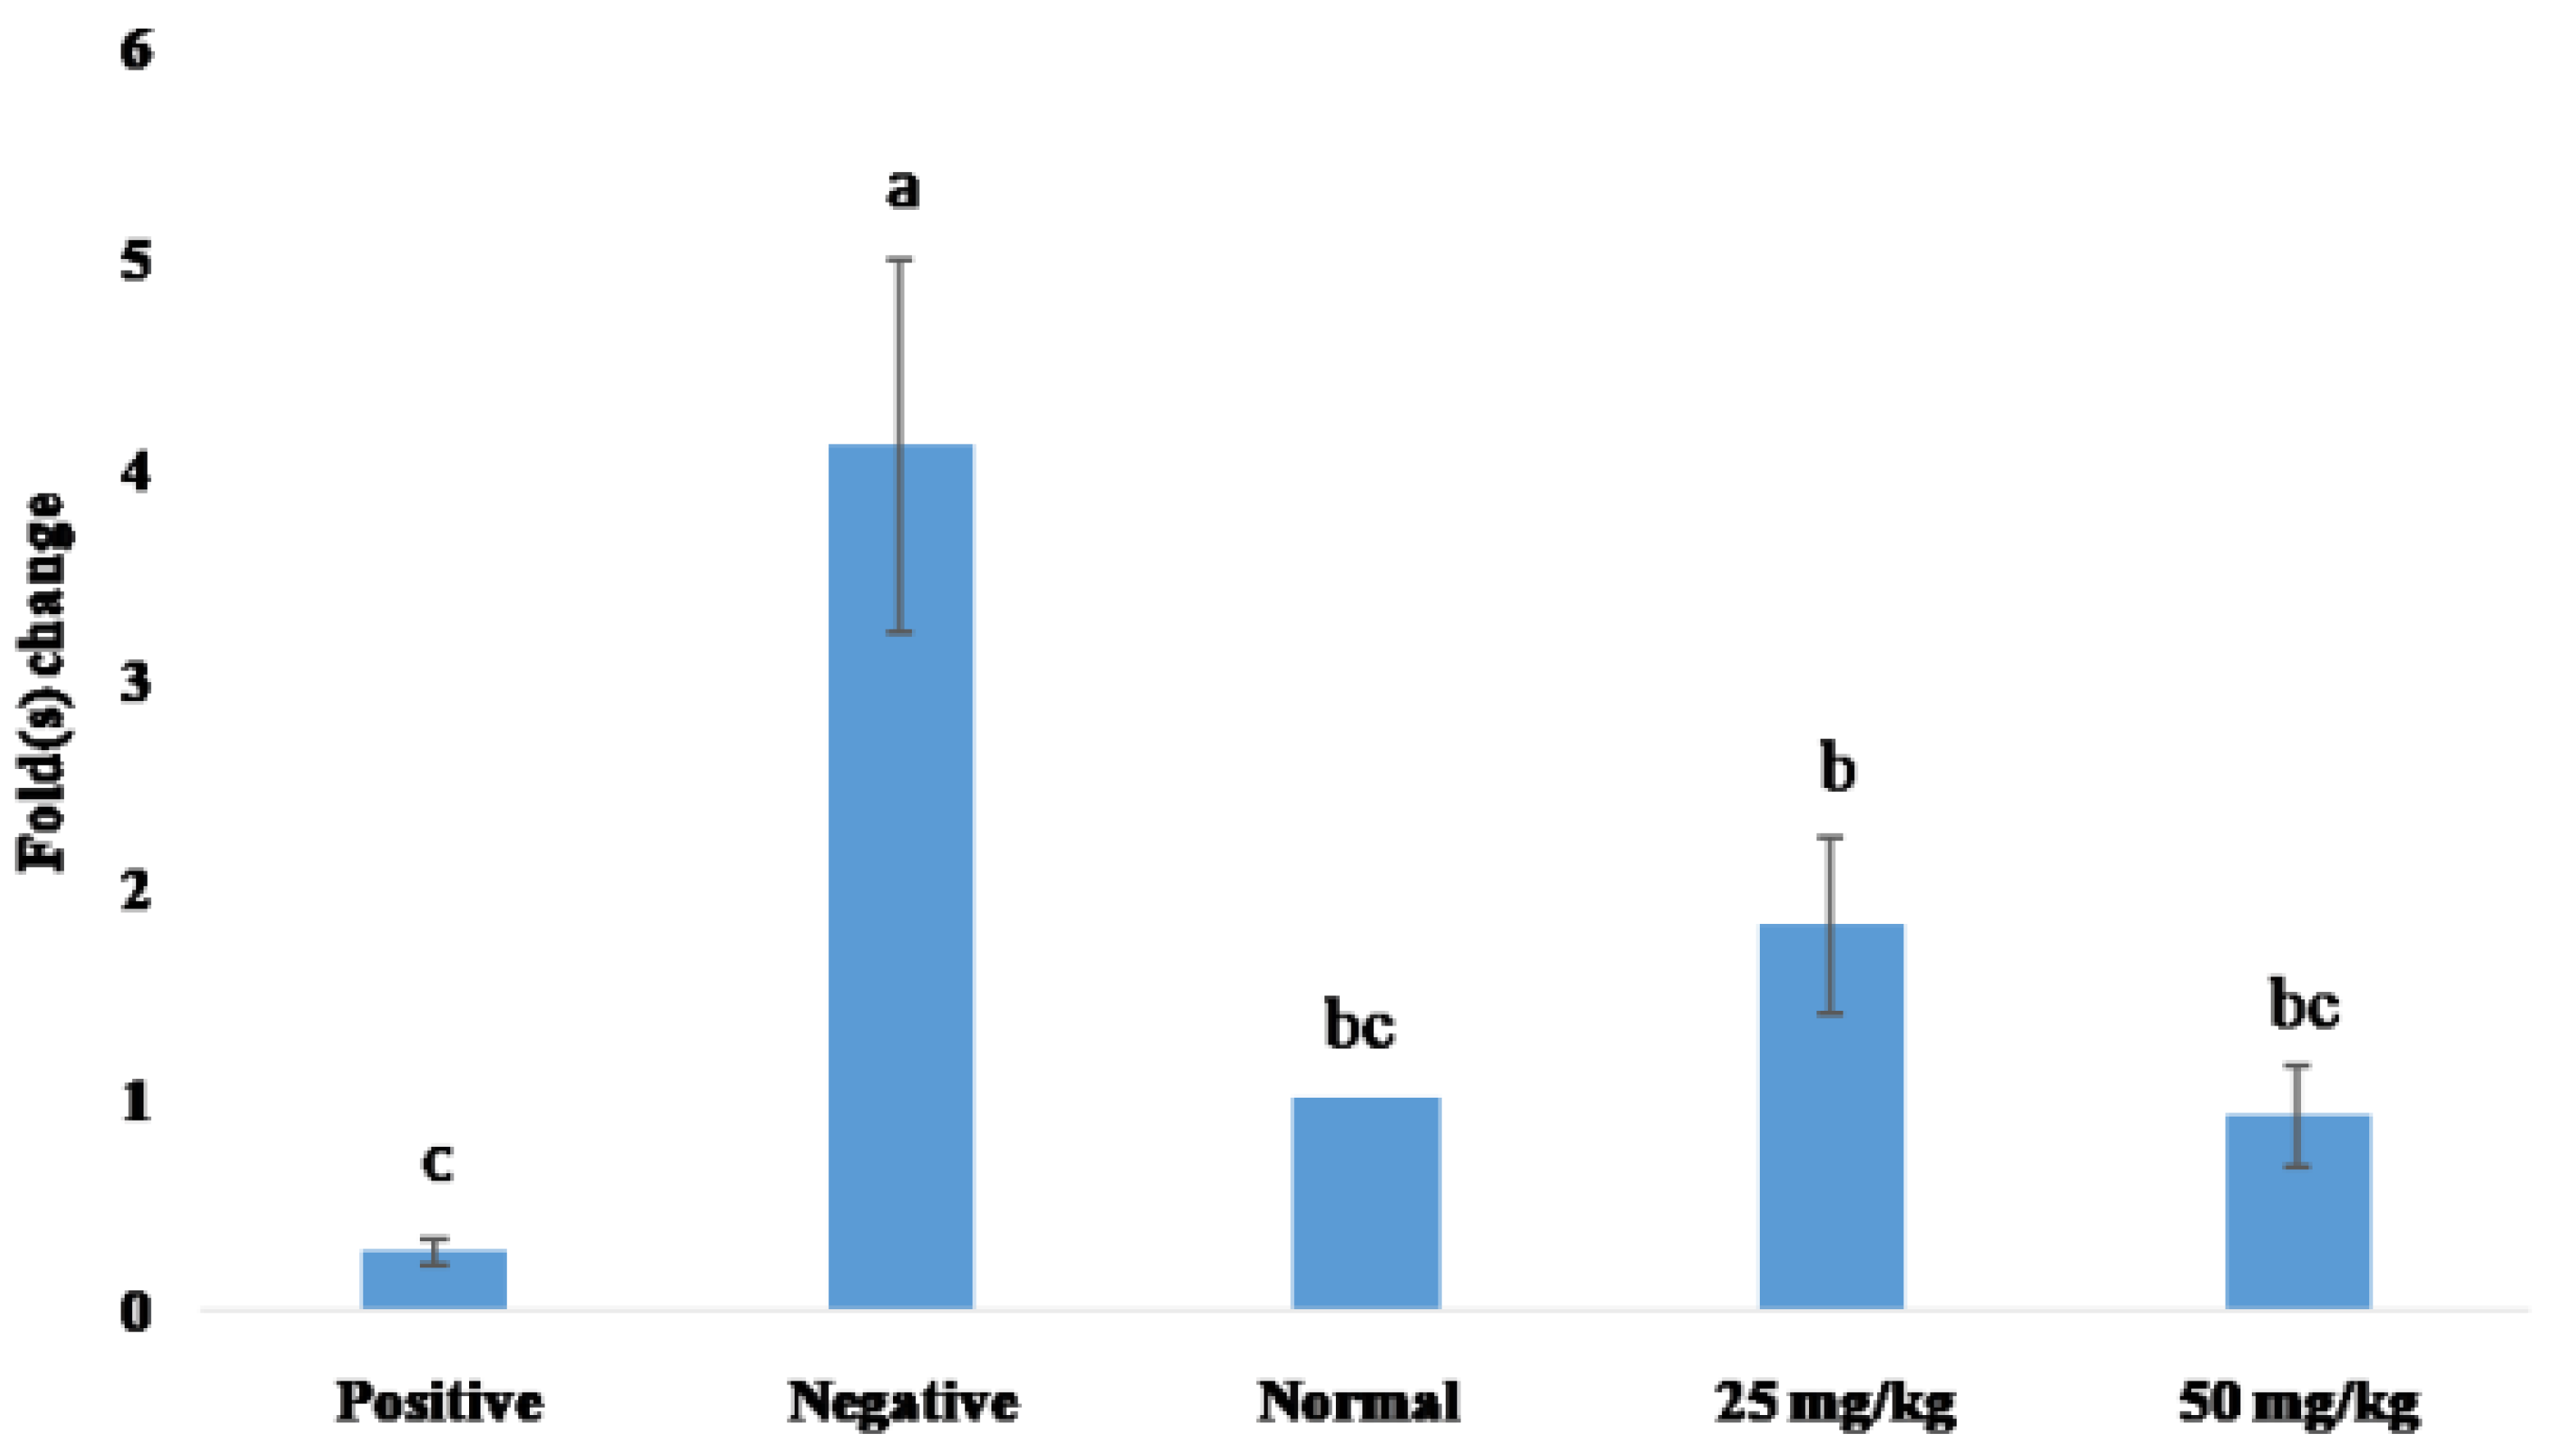
3.4. qPCR Analysis of XO Gene Expression

XO gene expression in fold change after various treatments (Figure 7) was determined by obtaining the difference between the samples’ ΔΔCT values and the ΔCT value of housekeeping gene (β-actin). Hyperuricemic (negative) control showed a threefold increase in XO gene expression as compared to the normal control group. F10 at 25 mg/kg and 50 mg/kg doses significantly downregulated the XO gene expression relative to the negative control, with a 50 mg/kg dose showing no significant difference in XO gene expression from the normal and positive control. Hence, these results suggested the ability of F10 to downregulate the XO gene expression, with a 50 mg/kg dose being more effective, comparable to the effect of allopurinol.

3.5. Putative Identification of XO Inhibitors Using HPLC-Q-TOF-MS/MS

In view of the promising anti-hyperuricemic effect of F10, it was further analysed to identify the bioactive compounds responsible for the XO inhibitory activity. In this part of the study, F10 was further purified by using preparative TLC to obtain 11 sub-fractions. It was found that the F10-4, F10-8, F10-9, and F10-10 possessed high XO inhibitory activity of >90% inhibition. Hence, these four sub-fractions were subjected to HPLC-Q-TOF-MS/MS analysis for putative identification of XO inhibitor(s).
HPLC analysis of the four F10 sub-fractions revealed the presence of multiple compounds (Figure S1). The compounds were identified by using Q-TOF-MS/MS equipped with MassHunter Workstation software (version B.05.01, Agilent Technologies). Compound identification was also confirmed by matching the m/z of the precursor and fragment ions with standard databases (Table 3). There were 33 major compounds detected, with 26 known compounds identified. The known compounds identified were terpenoids (3, 7, 8, 9, 33), caffeoylquinic acid (6), flavonoids (12, 17, 18, 19, 21, 29), alkaloids (20, 32), psoralens (23, 28), and some primary metabolites (1, 10, 13, 14, 15, 16, 24, 25, 27, 30). There were seven unknown compounds detected, and their molecular formulas are shown in this study. Positive Dragendorff tests and the molecular formula of the unknown compounds suggested that most of them might be alkaloid compounds.

4. Discussion

4.1. XO Inhibitory Activity of C. morifolium Fractions

Our study provides, for the first time, data showing that C. morifolium sub-fractions are effective in XO inhibition and uric acid reduction. At the beginning, EtOAc fraction was shown to exhibit moderate (High: 71–100%; moderate: 41–70%; low: 0–40%) XO inhibition. This might be due to its higher polyphenolic content as compared to the other fractions. C. morifolium EtOAc fraction has been shown to contain significantly higher total phenolic and flavonoid content than other fractions in our preliminary study [14]. This is because natural phenols show solubility preference to solvents with intermediate polarity [15]—EtOAc in this study—rather than more polar or non-polar solvents. Thus, majority phenolic and flavonoid compounds of C. morifolium flower in this study might have been drawn to the EtOAc fraction during solvent-solvent partitioning, which conferred its higher bioactivity.
The results agree with Kennouche et al. (2016) [16], according to whom Chrysanthemum segetum EtOAc extract showed the highest polyphenol level and flavonoid contents. Although the inhibitory effect of a complex mixture could not be directly compared to a pure compound, the moderate XO inhibitory activity exhibited by the EtOAc fraction suggested that it might serve as a potential XO inhibitor. In other words, the EtOAc fraction might exhibit higher XO inhibition at higher purity or concentration. Therefore, it was subjected to bioassay-guided fractionation to obtain higher purity sub-fractions for further analysis.
Kinetic studies indicated that the mode of XO inhibition for the RS fraction was competitive, whereas the crude extract, EtOAc, and PE fractions were shown to be non-competitive. Non-competitive inhibitor inactivates an enzyme by altering its active site or overall conformation [17]. This indicates that the inhibitor in the crude, EtOAc, and PE fractions does not compete for the XO active site with xanthine (substrate); but rather, inhibits the XO enzyme, possibly by causing conformational change to the XO active site. According to Spanou (2012) [18], pure polyphenolic compounds, such as quercetin and kaempferol derivatives, possessed non-competitive XO inhibition. The RS fraction in this study inhibited XO enzyme via competitive inhibition. This indicated that the inhibitor present in the RS fraction might resemble the structure of xanthine, thereby competing for the same active site. Competitive inhibitor can only bind to the free enzyme but not enzyme-substrate complex, thus inhibition activity can be overcome by increasing the substrate concentration within the reaction [19]. According to Liu et al. (2020) [20], polyphenols also inhibit XO competitively by binding to its active site, therefore the inhibitory activities of competitive inhibitors are directly proportional to their concentrations.
The increased bioactivity of sub-fractions F7 to F11 might be due to the greater concentration of potent bioactive compounds present in the semi-purified sub-fractions as compared to the crude extract. Fractionation is a crucial step to increase the purity of bioactive compounds, and hence the bioactivity. In some cases, a mixture of compounds possesses higher bioactivity than a pure compound [21]. Hence, the anti-hyperuricemic effect of the semi-purified EtOAc sub-fractions was investigated in this study. Before that, cytotoxic assays were carried out to determine the range of non-cytotoxic concentration of the sub-fractions.

4.2. Cellular Assays

Trypan blue exclusion assay demonstrated an increase in cell viability and pro-proliferative effect in F10 treated cells. Limited studies about the influence of C. morifolium sub-fractions on the viability of HepG2 cell lines have been published. In the literature, some plant species of the genus Chrysanthemum were reported to have cell proliferative effects at lower extract concentrations. Chrysanthemum zawadskii extract was shown to increase cellular proliferation at 1–10 ppm but shows cytotoxicity at 1000 ppm [22]. On the other hand, C. coronaria and C. flosculosus were shown to be cytotoxic to HeLa and Velo cell lines with maximum nontoxic dose (MNTD50) above 16 µg/mL [23].
ROS direct assay demonstrated that F10 reduced the intracellular ROS level significantly. High flavonoids content in plant extract has been shown to possess excellent antioxidant and oxygen radicals scavenging activity [24]. Correlation between radical scavenging activity and flavonoids compounds has been reported in C. morifolium [25]. In addition, C. morifolium has been demonstrated to contain abundant amounts of phenolic and flavonoid compounds, which significantly improves the antioxidant activity [14]. Hence, it was suggested that the antioxidant effect of F10 might be largely attributed to the presence of flavonoid compounds.

4.3. Anti-Hyperuricemic Effects of C. morifolium in Potassium Oxonate-Induced Rats

Potassium oxonate serves as a uricase inhibitor, causes hyperuricemia by inhibiting uric acid decomposition [1], and thereby increases the uric acid level in the negative control. Our results showed that the oral administration of F10 significantly reduced the SUA level at both doses. However, the SUA levels of rats treated with 25 mg/kg of the F10 were significantly higher than the normal and positive control. In contrast, the SUA levels in the 50 mg/kg treatment and positive control were similar to that of the normal control (not induced to be hyperuricemic). This revealed the effectiveness of the 50 mg/kg treatment (55.58 ± 4.81% reduction relative to the negative control) in lowering SUA levels, comparable to the positive control, allopurinol (50.27 ± 5.05% reduction relative to the negative control). This agrees with a previous report which demonstrates the effectiveness of Chrysanthemum flower oil in reducing SUA levels [1]. Thus, it is noteworthy that F10 at 50 mg/kg exhibited excellent anti-hyperuricemic effects, comparable to that of allopurinol.
Oral administration of F10 lowered the rats’ UUA levels at both doses, but the level was higher than that of the positive control. The reduced, but higher than normal UUA level in the F10 treated rats might be due to the enhanced excretion of uric acid. The uric acid-lowering effect of C. morifolium is a consequence of both enhanced excretion and suppressed production of uric acid, in which the uric acid transporter genes in the kidney is upregulated in rats treated with Chrysanthemum flower oil [1]. The goal of gout therapy is long-term management of hyperuricemia, which can be achieved by SUA suppression as well as uric acid excretion enhancement. Therefore, this study suggested that the oral consumption of 50 mg/kg of F10 may be suitable to be used as a long-term serum-uric acid lowering therapy for the management of hyperuricemia, and as a preventive measure for gout. It could be explored further as a potential source of natural anti-hyperuricemic and uricosuric agent.
XO is an enzyme that catalyses the oxidation of hypoxanthine and xanthine to uric acid in purine catabolism [1]. Since hyperuricemia results from uric acid overproduction, XO inhibitors that can inhibit the production of uric acid have been considered for hyperuricemia treatment. In this study, the administration of F10 extract significantly reduced the XO levels in rats. This result suggested that one of the uric acid-lowering mechanisms associated with F10 administration involved the suppression of uric acid production via XO enzyme inhibition. This corroborates the findings of Honda et al. (2014), which demonstrate that the administration of Chrysanthemum flower oil suppresses uric acid production by inhibiting the XO enzyme in the liver [1]. Our finding also agrees with a previous report which depicted that C. morifolium possesses significant XO inhibitory activity in a concentration-dependent manner [7].
According to Aziz and Jamil (2020), xanthine accumulates when XO enzyme is inhibited [26]. In the present study, the xanthine and hypoxanthine levels increased relative to the normal control after the administration of F10. Therefore, it was suggested that the suppression of uric acid production in rats was achieved by XO enzymes inhibition. However, both hypoxanthine and xanthine showed only slight increases compared to the negative control. This might be explained by the re-utilization or enhanced excretion of xanthine and hypoxanthine when XO action is inhibited. Puig et al. (1988) reported a direct relationship between the excretion of uric acid, xanthine, and hypoxanthine [27]. In addition, our results also suggested that the lower XO activity may be attributed to the downregulation of XO gene expression. However, to date, there is no report about the regulation of XO gene expression by semi-purified plant sub-fraction. Therefore, qPCR analysis of XO gene expression was conducted in this study to gain further insight into the mechanism of XO inhibition by C. morifolium EtOAc F10.

4.4. qPCR Analysis of XO Gene Expression

The three-fold increase in XO gene expression in the negative control might be due to the increase in inflammatory cytokines. Elevated SUA level was shown to be associated positively with inflammatory cytokines [28], and the increase in inflammatory cytokines in turned upregulate the XDH/XO gene expression [29]. The present study showed that both doses of F10 downregulated the XO gene expression. This result confirmed our inference about the XO gene expression downregulation by F10, with 50 mg/kg dosage being more effective, comparable to that of allopurinol. The expression of XO gene was probably down-regulated due to the lower level of ROS, and subsequently lower concentration of inflammatory cytokines. McNally et al. (2005) reported that lower level of ROS could directly down-regulate the xanthine dehydrogenase (XDH) and XO gene expressions [30]. They also indicate that lower hydrogen peroxide level reduces calcium ions release from the endoplasmic reticulum, subsequently supressing the conversion of XDH to XO.
Chrysanthemum flower oil has been shown to suppress uric acid production by inhibiting the XO enzyme in the liver and accelerating the renal uric acid excretion [1]. The findings of Honda et al. demonstrated that the up regulation of uric acid transporter genes in the kidney increases the excretion of uric acid [1]. However, the regulation of liver XO gene expression was not reported. In the present study, the down-regulation of the XO gene expression might be related to the reduced oxidative stress in the treated rats attributed to the high antioxidant activity of the F10.

4.5. Putative Identification of XO Inhibitors Using HPLC-Q-TOF-MS/MS

Based on HPLC-Q-TOF-MS/MS analysis, only five compounds, namely 3,4,5-tricaffeoylquinic acid, apigenin 7-O-6”-acetylglucoside, 6-C-glucosyl-8-C-arabinosylapigenin, apigenin 7-O-glucoside, and eupatilin have been reported previously in C. morifolium, while other known compounds were reported for the first time in C. morifolium. Several phenolic compounds, including caffeoylquinic acid and flavonoids, were identified from EtOAc F10-4 (6, 12), F10-8 (17, 18, 19, 21), and F10-9 (29). The flavonoid compounds identified in this study were speculated to be responsible for the high XO inhibitory activity of F10. Flavonoid compounds such as apigenin isolated from Chrysanthemum spp. have been shown to possess good XO inhibitory activity [31]. Apigenin 7-O-glucoside has been shown to have multiple significant biological activities, such as anti-inflammatory, antioxidant, anticancer, antiviral, antibacterial, and pro-apoptotic effects [32]. Apigenin, on the other hand, has been reported to be the most potent inhibitor for XO, attributed to its stable interaction with the enzyme active site in a molecular modelling study [33]. Prunetin and Prunetin 4′-O-galactoside were identified for the first time from C. morifolium in the present study. It has been isolated from the leaves and stem bark of Dalbergia spinose and has been related to anti-inflammatory activity [34]. Since the current treatment for gout include the use of anti-inflammatory agent, apigenin and prunetin could be investigated further as a lead compound for gout therapy.
Other than the phenolic compounds, five terpenoid compounds were identified from F10-4 (3, 7, 8, 9) and F10-10 (33). Medicagenic acid is a bioactive triterpenoid and has been demonstrated to exhibit only low XO inhibitory activity [35]. So far, there is no report about the XO inhibitory activity of schizonepetoside E, zerumbone, vulgarone A and B. Besides, psoralens identified from F10-8 (23) and F10-9 (28) have also not been reported to inhibit XO enzyme. The primary metabolites identified from different F10 sub-fractions were regarded as possessing important functions in the primary metabolism of plants; it was postulated that they might not possess any direct inhibitory potential on the XO enzyme. To date, there are a limited number of reports about the bioactivities of these compounds.
The majority of the compounds in the highly bioactive F10 might be alkaloids, but only two known compounds were identified in this study, namely acetylintermedine (20) and prosopinine (32) from F10-8 and F10-9, respectively. Acetylintermedine is a naturally occurring pyrrolizidine alkaloid reported to be hepatotoxic. Pyrrolizidine alkaloids are common secondary metabolites in plants, which possess significant hepato-toxicity, genotoxicity, cytotoxicity, tumorigenicity, as well as neurotoxicity, on human and animal models [36]. Although alkaloid compounds are often toxic to human beings, they are widely used in modern medicines. For instance, colchicine is used as an anti-inflammatory agent for acute gout attack treatment and prevention [37], and is currently used as a clinically effective anti-gout medicine. However, its risk to benefit ratio is considered high, as gastrointestinal effects such as nausea, diarrhoea, vomiting, and stomach upset occur in about 80% of patients [38].
Metabolite profiling of the EtOAc F10 suggested that flavonoid compounds might be responsible for the XO inhibitory activity and anti-hyperuricemic activity of C. morifolium flowers. Since an abundance of alkaloids are also present in Chrysanthemum flowers [39] and alkaloid has been shown to exhibit XO inhibitory activity [40], it is highly recommended to isolate and elucidate the structure of the unknown compounds in the bioactive sub-fractions by other spectroscopic methods, including 1 H and 13 C NMR.

5. Conclusions

In a nutshell, the dried flower EtOAc fraction and sub-fractions of C. morifolium were shown to be effective in XO inhibition and anti-hyperuricemic activity. EtOAc F10 was shown to be very effective in both serum and urine uric acid lowering properties in rat models upon oral consumption, comparable to that of allopurinol. Based on the results, the possible mechanisms that contributed to the anti-hyperuricemic effect of F10 were suggested to be the non-competitive inhibition of XO enzyme, XO gene expression down-regulation, and the enhancement of uric acid excretion. A total of 26 known compounds were identified and seven unknown compounds were detected in the EtOAc F10. Both known and unknown compounds found in this study could potentially serve as lead compounds for the development of an XO inhibitor which confers higher therapeutic activity and lesser side effects. Hence, it is highly recommended to isolate and elucidate their structure by other spectroscopic methods, including NMR spectroscopy. In addition to that, the evaluation of the XO inhibitory activity of one or a mixture of these compounds is also suggested, in order to identify possible synergism between them.

Supplementary Materials

The following are available online at https://www.mdpi.com/article/10.3390/app12073487/s1, Figure S1: Extracted-ion Chromatogram of EtOAc (a) F10-4, (b) F10-8, (c) F10-9, and (d) F10-10.

Author Contributions

Conceptualization, T.L.N. and K.E.L.; Data curation, T.L.N. and K.E.L.; Formal analysis, T.L.N.; Funding acquisition, K.E.L.; Investigation, T.L.N.; Methodology, T.L.N.; Project administration, K.E.L.; Resources, K.E.L.; Software, T.L.N.; Supervision, K.E.L.; Validation, K.E.L., S.-A.T., H.Y.T. and C.S.Y.; Visualization, K.E.L., S.-A.T., H.Y.T., C.S.Y. and S.P.W.; Writing—original draft, T.L.N.; Writing—review & editing, K.E.L., S.-A.T., H.Y.T. and Z.T.T. All authors have read and agreed to the published version of the manuscript.

Funding

This research was funded by Fundamental Research Grant Scheme (FRGS), project number FRGS/1/2020/STG02/TARUC/02/1.

Institutional Review Board Statement

The study was conducted according to the Code of Practice for the Housing and Care of Animals Used in Scientific Procedures and all the animal experimental protocols were approved by Tunku Abdul Rahman University College Ethics Committee (approval number: TARUC/EC/2017/04-2).

Informed Consent Statement

Not applicable.

Acknowledgments

The authors wish to thank the Ministry of Higher Education (MOHE), Malaysia for financial support through FRGS, project number FRGS/1/2020/STG02/TARUC/02/1.

Conflicts of Interest

The authors declare no conflict of interest.

References

  1. Honda, S.; Kawamoto, S.; Tanaka, H.; Kishida, H.; Kitagawa, M.; Nakai, Y.; Abe, K.; Hirata, D. Administered chrysanthemum flower oil attenuates hyperuricemia: Mechanism of action as revealed by DNA microarray analysis. Biosci. Biotechnol. Biochem. 2014, 78, 655–661. [Google Scholar] [CrossRef]
  2. Villegas, R.; Xiang, Y.B.; Elasy, T.; Xu, W.H.; Cai, H.; Cai, Q.; Linton, M.; Fazio, S.; Zheng, W.; Shu, X.O. Purine-rich foods, protein intake, and the prevalence of hyperuricemia: The Shanghai Men’s Health Study. Nutr. Metab. Cardiovasc. Dis. 2012, 22, 409–416. [Google Scholar] [CrossRef] [Green Version]
  3. Park, J.E.; Yeom, Z.; Park, K.T.; Han, E.H.; Yu, H.J.; Kang, H.S.; Lim, Y.H. Hypouricemic effect of ethanol extract of Aster glehni leaves in potassium oxonate-induced hyperuricemic rats. Clin. Nutr. Res. 2018, 7, 126–135. [Google Scholar] [CrossRef] [Green Version]
  4. Lin, L.; Yang, Q.; Zhao, K.; Zhao, M. Identification of the free phenolic profile of Adlay bran by UPLC-QTOF-MS/MS and inhibitory mechanisms of phenolic acids against xanthine oxidase. Food Chem. 2018, 253, 108–118. [Google Scholar] [CrossRef]
  5. Chinese Pharmacopoeia Committee. Pharmacopoeia of the People’s Republic of China; Chinese Medical Science and Technology Press: Beijing, China, 2010; Volume 1, p. 292. [Google Scholar]
  6. Hirano, M.; Takeda, S.; Hitoe, S.; Shimoda, H. Luteolin-rich chrysanthemum flower extract suppresses baseline serum uric acid in Japanese subjects with mild hyperuricemia. Integr. Mol. Med. 2017, 4, 1–5. [Google Scholar] [CrossRef] [Green Version]
  7. Loh, K.E.; Chin, Y.S.; Ismail, I.S.; Tan, H.Y. Rapid characterization of xanthine oxidase inhibitors from the flowers of Chrysanthemum morifolium Ramat using metabolomics approach. Phytochem. Anal. 2021, 33, 12–22. [Google Scholar] [CrossRef] [PubMed]
  8. Chan, L.L.Y.; Kuksin, D.; Laverty, D.J.; Saldi, S.; Qiu, J. Morphological observation and analysis using automated image cytometry for the comparison of trypan blue and fluorescence-based viability detection method. Cytotechnology 2015, 67, 461–473. [Google Scholar] [CrossRef] [Green Version]
  9. Tan, S.A.; Lim, S.Y.; Law, C.S.; Yue, C.S.; Poh, T.V.; Saad, W.Z.; Ismail, S.; Yusoff, K.M.; Loke, C.F. Antioxidative and photocytotoxic effects of standardized Clinacanthus nutans and Strobilanthes crispus extracts toward HepG2 liver cells. Pharmacogn. Mag. 2019, 15, 613–620. [Google Scholar]
  10. Kurien, B.T.; Everds, N.E.; Scofield, R.H. Experiment animal urine collection: A review. Lab. Anim. 2004, 38, 333–361. [Google Scholar] [CrossRef]
  11. Lin, L.Z.; Harnly, J.M. Identification of the phenolic components of chrysanthemum flower (Chrysanthemum morifolium Ramat). Food Chem. 2010, 120, 319–326. [Google Scholar] [CrossRef]
  12. Cecilia, M.K.; Abrha, A.H.; Hlengilizwe, N.; Hintsa, A.T.; Umer, M.; Nixwell, M.F.; Ali, S.W.; Afzal, M.I.; Martorell, M.; Salehi, B.; et al. Untargeted profiling of field cultivated bush tea (Athrixia phylicoides DC.) based on metabolite analysis. Cell. Mol. Biol. 2020, 66, 104–109. [Google Scholar] [CrossRef] [PubMed]
  13. Chen, S.; Liu, J.; Dong, G.; Zhang, X.; Liu, Y.; Sun, W.; Liu, A. Flavonoids and caffeoylquinic acids in Chrysanthemum morifolium Ramat flowers: A potentially rich source of bioactive compounds. Food Chem. 2021, 344, 128733. [Google Scholar] [CrossRef]
  14. Chang, K.L.; Tey, M.K.; Chow, W.M.; Loh, K.E.; Intan, S.I. In-vitro antioxidant, xanthine oxidase inhibitory activity and antimicrobial properties of Chrysanthemum morifolium. In Proceedings of the 14th Symposium of Malaysian Society of Applied Biology: Bridging between Knowledge and Innovation, Melaka, Malaysia, 29–31 May 2016; pp. 161–166. [Google Scholar]
  15. Galanakis, C.M.; Goulas, V.; Tsakona, S.; Manganaris, G.A.; Gekas, V. A knowledge base for the recovery of natural phenols with different solvents. Int. J. Food Prop. 2013, 16, 382–396. [Google Scholar] [CrossRef] [Green Version]
  16. Kennouche, S.; Bicha, S.; Bentamene, A.; Crèche, J.; Benayache, F.; Benayache, S. In vitro antioxidant activity, phenolic and flavonoid contents of different polarity extracts from Chrysanthemum segetum L. growing in Algeria. Int. J. Pharmacogn. Phytochem. Res. 2016, 8, 1522–1525. [Google Scholar]
  17. Gomez, A.R.; Rocha-Santos, T.A.P. Bioassays, enzyme assays. In Encyclopedia of Analytical Science, 3rd ed.; Elsevier: Amsterdam, The Netherlands, 2019; pp. 271–277. [Google Scholar]
  18. Spanou, C.; Veskoukis, A.S.; Kerasioti, T.; Kontou, M.; Angelis, A.; Aligiannis, N.; Skaltsounis, A.L.; Kouretas, D. Flavonoid glycosides isolated from unique legume plant extracts as novel inhibitors of xanthine oxidase. PLoS ONE 2012, 7, e32214. [Google Scholar] [CrossRef] [Green Version]
  19. Mohan, C.; Long, K.D.; Mutneja, M. An Introduction to Inhibitors and Their Biological Applications, 1st ed.; EMD Millipore Corporation: Billerica, MA, USA, 2013; pp. 3–41. [Google Scholar]
  20. Liu, L.; Zhang, L.; Ren, L. Advances in structures required of polyphenols for xanthine oxidase inhibition. Food Front. 2020, 1, 152–167. [Google Scholar] [CrossRef]
  21. Nile, S.H.; Keum, Y.S.; Nile, A.S.; Kwon, Y.D.; Kim, D.H. Potential cow milk xanthine oxidase inhibitory and antioxidant activity of selected phenolic acid derivatives. J. Biochem. Mol. Toxicol. 2018, 32, e22005. [Google Scholar] [CrossRef] [PubMed]
  22. Kim, Y.D.; Pi, L.Q.; Lee, W.S. Effect of Chrysanthemum zawadskii extract on dermal papilla cell proliferation and hair growth. Ann. Dermatol. 2020, 32, 395–401. [Google Scholar] [CrossRef]
  23. Marongiu, B.; Piras, A.; Porcedda, S.; Tuveri, E.; Laconi, S.; Deidda, D.; Maxia, A. Chemical and biological comparisons on supercritical extracts of Tanacetum cinerariifolium (Trevir) Sch. Bip. with three related species of chrysanthemums of Sardinia (Italy). Nat. Prod. Res. 2009, 23, 190–199. [Google Scholar] [CrossRef]
  24. Panche, A.N.; Diwan, A.D.; Candra, S.R. Flavonoids: An overview. J. Nutr. Sci. 2016, 5, e47. [Google Scholar] [CrossRef] [Green Version]
  25. Sugawara, T.; Igarashi, K. Cultivar variation in flavonoid components and radical scavenging activity of polyphenol fractions among edible chrysanthemum flowers. J. Jpn. Soc. Food Sci. Technol. 2009, 56, 600–604. [Google Scholar] [CrossRef] [Green Version]
  26. Aziz, N.; Jamil, R.T. Biochemistry, xanthine oxidase. In StatPearls; StatPearls Publishing LLC: Treasure Island, FL, USA, 2021. [Google Scholar]
  27. Puig, J.G.; Mateos, F.A.; Jiménez, M.L.; Ramos, T.H. Renal excretion of hypoxanthine and xanthine in primary gout. Am. J. Med. 1988, 85, 533–537. [Google Scholar] [CrossRef]
  28. Lyngdoh, T.; Marques-Vidal, P.; Paccaud, F.; Preisig, M.; Waeber, G.; Bochud, M.; Vollenweider, P. Elevated serum uric acid is associated with high circulating inflammatory cytokines in the population based colaus study. PLoS ONE 2011, 6, e19901. [Google Scholar] [CrossRef] [Green Version]
  29. Battelli, M.G.; Polito, L.; Bortolotti, M.; Bolognesi, A. Xanthine oxidoreductase-derived reactive species: Physiological and pathological effects. Oxid. Med. Cell Longev. 2016, 2016, 1–8. [Google Scholar] [CrossRef] [Green Version]
  30. McNally, J.S.; Saxena, A.; Cai, H.; Dikalov, S.; Harrison, D.G. Regulation of xanthine oxidoreductase protein expression by hydrogen peroxide and calcium. Arterioscler. Thromb. Vasc. Biol. 2005, 25, 1623–1628. [Google Scholar] [CrossRef] [PubMed] [Green Version]
  31. Abu Bakar, F.I.; Abu Bakar, M.F.; Rahmat, A.; Abdullah, N.; Sabran, S.F.; Endrini, S. Anti-gout potential of Malaysian medicinal plants. Front. Pharmacol. 2018, 9, 261. [Google Scholar] [CrossRef] [Green Version]
  32. Cai, J.; Zhao, X.L.; Liu, A.W.; Nian, H.; Zhang, S.H. Apigenin inhibits hepatoma cell growth through alteration of gene expression patterns. Phytomedicine 2011, 18, 366–373. [Google Scholar] [CrossRef] [PubMed]
  33. Lin, C.M.; Chen, C.S.; Chen, C.T.; Liang, Y.C.; Lin, J.G. Molecular modeling of flavonoids that inhibits xanthine oxidase. Biochem. Biophys. Res. Commun. 2002, 294, 167–172. [Google Scholar] [CrossRef]
  34. Sarg, T.; Ateya, A.M.; Abdel-Ghani, A.; Badr, W.; Shams, G. Phytochemical and pharmacological studies of Dalbergia sissoo growing in Egypt. Pharm. Biol. 1999, 37, 54–62. [Google Scholar] [CrossRef]
  35. Kozachok, S.; Pecio, L.; Orhan, I.E.; Deniz, F.S.S.; Marchyshyn, S.; Oleszek, W. Reinvestigation of Herniaria glabra L. saponins and their biological activity. Phytochemistry 2020, 169, 112162. [Google Scholar] [CrossRef]
  36. Schramm, S.; Köhler, N.; Rozhon, W. Pyrrolizidine alkaloids: Biosynthesis, biological activities and occurrence in crop plants. Molecules 2019, 24, 498. [Google Scholar] [CrossRef] [PubMed] [Green Version]
  37. Hainer, B.L.; Matheson, E.; Wilkes, R.T. Diagnosis, treatment, and prevention of gout. Am. Fam. Physician 2014, 90, 831–836. [Google Scholar] [PubMed]
  38. Burns, C.M.; Wortmann, R.L. Latest evidence on gout management: What the clinician needs to know. Ther. Adv. Chronic Dis. 2012, 3, 271–286. [Google Scholar] [CrossRef] [Green Version]
  39. Husain, N.; Kumar, A. Comparative study of phytochemical constituents in flower of Wedelia trilobata, Achyranthes aspera and Chrysanthemum from Durg District of Chhattisgarh, India. Int. J. Curr. Microbiol. Appl. Sci. 2015, 4, 150–156. [Google Scholar]
  40. Fachriyah, E.; Ghifari, M.A.; Anam, K. Isolation, identification, and xanthine oxidase inhibition activity of alkaloid compound from Peperomia pellucid. IOP Conf. Ser. Mater. Sci. Eng. 2018, 349, 012017. [Google Scholar] [CrossRef]
Figure 1. Flow chart of bioassay-guided fractionation and the yield of Chrysanthemum morifolium fractions and sub-fractions. PE, petroleum ether; EtOAc, ethyl acetate; RS, residual; PO, potassium oxonate; XO, xanthine oxidase; * Moderate XO inhibitory activity; ** > 75% XO inhibitory activity; *** > 90% XO inhibitory activity; **** High cellular antioxidant activity and pro-proliferative rate.
Applsci 12 03487 g001
Figure 2. The Lineweaver-Burk plots for Chrysanthemum morifolium: (a) crude extract; (b) ethyl acetate (EtOAc) fraction; (c) petroleum ether (PE) fraction; (d) residual (RS) fraction. • is in the absence of inhibitor; ■ is in the presence of inhibitor.
Applsci 12 03487 g002
Figure 3. The XO inhibitory activity of EtOAc sub-fractions from C. morifolium flower. All values are mean ± SEM (n = 3). Final concentration of tested samples in reaction mixture was fixed at 100 μg/mL. Bar labelled with different letter are significantly different (p ≤ 0.05).
Applsci 12 03487 g003
Figure 4. Cell viability (%) of HepG2 cells treated with various concentrations of Chrysanthemum morifolium sub-fraction F10 in trypan blue exclusion assay. Values are mean ± SEM (n = 3). Bars labelled with a different letter are significantly different (p ≤ 0.05).
Applsci 12 03487 g004
Figure 5. Reactive oxygen species level (%) of HepG2 cells treated with Chrysanthemum morifolium EtOAc sub-fraction F10. Significant differences were compared between different concentrations at each time point. Bars labelled with a different letter are significantly different (p ≤ 0.05).
Applsci 12 03487 g005
Figure 6. Xanthine oxidase, xanthine, and hypoxanthine content in SD rats treated with Chrysanthemum morifolium EtOAc F10. All values are mean ± SEM (n = 6). The values of normal control have been normalized to 100%. Bars labelled with a different letter indicate significant difference (p ≤ 0.05) between different treatments within xanthine oxidase, xanthine, and hypoxanthine group. Positive: hyperuricemia induced + 10 mg/kg allopurinol; negative: hyperuricemia induced + phosphate buffered saline; normal: not induced for hyperuricemia + water, 25 mg/kg: hyperuricemia induced + 25 mg/kg of EtOAc F10 sub-fraction; 50 mg/kg: hyperuricemia induced + 50 mg/kg of EtOAc F10 sub-fraction.
Applsci 12 03487 g006
Figure 7. Xanthine oxidase gene expression (fold change) in SD rats treated with Chrysanthemum morifolium EtOAc F10. All values are mean ± SEM (n = 6). The value of normal control has been normalized. Bars labelled with a different letter indicate significant difference (p ≤ 0.05). Positive: hyperuricemia induced + 10 mg/kg allopurinol; negative: hyperuricemia induced + phosphate buffered saline; normal: not induced for hyperuricemia + water, 25 mg/kg: hyperuricemia induced + 25 mg/kg of EtOAc F10 sub-fraction; 50 mg/kg: hyperuricemia induced + 50 mg/kg of EtOAc F10 sub-fraction.
Applsci 12 03487 g007
Table 1. Xanthine oxidase inhibitory activity of different fractions of the C. morifolium crude extract and fractions.
SamplesXanthine Oxidase Inhibition (%)
PE28.09 ± 2.09 c
RS33.86 ± 3.25 c
EtOAc51.77 ± 0.98 b
Crude11.55 ± 1.21 d
Allopurinol99.79 ± 0.21 a
Values are mean ± SEM (n = 3). Means with a different superscript letter showed significant difference (p ≤ 0.05). Percentage of inhibition was measured at 100 µg/mL. PE, petroleum ether fraction; RS, residual fraction; EtOAc, ethyl acetate fraction.
Table 2. Uric acid content in SD rats treated with Chrysanthemum morifolium EtOAc F10.
TreatmentsSerum Uric Acid Content (%)Urine Uric Acid Content (%)
Positive control108.30 ± 5.05 c98.97 ± 5.17 c
Negative control217.79 ± 10.28 a249.67 ± 9.93 a
Normal control100.00 ± 0.00 c100.00 ± 0.00 c
25 mg/kg EtOAc F10134.38 ± 7.91 b157.13 ± 5.71 b
50 mg/kg EtOAc F1096.74 ± 4.81 c143.97 ± 5.80 b
All values are mean ± SEM (n = 6). The values of normal control have been normalized to 100%. Means with a different superscript letter (vertical) showed significant difference (p ≤ 0.05). Positive control: hyperuricemia induced + 10 mg/kg allopurinol; negative control: hyperuricemia induced + phosphate buffered saline; normal control: not induced for hyperuricemia + water; 25 mg/kg EtOAc F10: hyperuricemia induced + 25 mg/kg of EtOAc F10 sub-fraction; 50 mg/kg EtOAc F10: hyperuricemia induced + 50 mg/kg of EtOAc F10 sub-fraction.
Table 3. Assignments of putative compounds for the major peaks identified in HPLC-Q-TOF-MS/MS spectra.
PeaktR (min)Chemical FormulaMassAdductParent Ions (m/z)Fragments (m/z)IdentificationReferences
113.172C18H28N2O2304.2135[M+Na]327.2028133.0860, 177.11244′-HydroxybupivacaineMassHunter library
213.566C17H30N4O5370.2218[M+H]371.2291133.0862--
314.544C30H46O6502.3005[M+H]503.3087 221.1386, 459.2797Medicagenic acidHMDB0034551
414.840C25H24O14546.3268[M+H]547.3342---
515.929C31H55N6O2543.4393[M+Na]566.4286 283.7175--
616.403C34H30O15678.5065[M+H]679.5138354.26103,4,5-Tricaffeoylquinic acid [11]
720.947 C15H22O218.1682[M+H]219.1756 201.1644ZerumboneHMDB0036667
822.531C15H22O218.1680[M+H]219.1754201.1644Vulgarone BHMDB0035657
923.094C15H22O218.1684[M+H]219.1758201.1644Vulgarone AFDB015670
1024.161C18H26O3290.1895[M+H]291.1969 273.18554-oxo-9Z, 11Z, 13E,
15E-octadecatetraenoic
acid
MassHunter library
1125.207C14H31NO2245.2366[M+H]246.2440 ---
1228.133C16H12O5284.2024[M+H]285.2055211.1118PrunetinHMDB0034127
1329.319C24H30O6414.2055[M+H]415.2129 119.0856Magnoshinin[12]
1413.142C15H18O8326.1952[M+H]327.2025309.1906, 133.0859trans-p-Coumaroyl beta-D-glucopyranosideHMDB0302089
1514.247C17H23N4O9P458.2738[M+H]459.2812 441.2697Flavin mononucleotide hydroquinoneHMDB0001142
1614.527C6H4O2108.0581[M+H]109.0654 -1,2-benzoquinoneHMDB0012133
1715.225C23H22O11474.3185[M+H]475.3260 271.1588Apigenin 7- O-6”-acetylglucoside[11]
1815.891C26H28O14565.4190[M+H]566.4264 548.41346-C-glucosyl-8-C-arabinosylapigenin[11]
1917.373C21H20O10432.1066 [M+H]433.1139 271.0605Apigenin 7-O-
glucoside
MassHunter library
2019.596C17H27NO6341.1847[M+H]342.1919 337.1626AcetylintermedineMassHunter library
2120.642C22H22O10446.1223[M+H]447.1297 285.0759Prunetin 4′-O-
galactoside
MassHunter library
2223.272C8H10N4O2193.1589[M+H]194.1662 ---
2325.702C11H6O3186.1204[M+H]187.1278 115.0551, 131.0851PsoralenHMDB0034272
2427.557C9H15N3O11P2403.2004[M+H]404.2078 105.0703, 387.1805 Cytidine diphosphate (CDP)HMDB0001546
2529.395C16H27NO11409.2500[M+Na]432.2390 415.2114LinustatinHMDB0303673
2630.776C16H35NO2273.2682[M+H]274.2754---
2711.043C5H9NO99.0692[M+H]100.0765 -2-Hydroxy-2-methylbutanenitrileHMDB0060309
2811.636C12H8O4216.0988[M+H]217.1061 173.0767, 201.07165-methoxypsoralenHMDB0030637
2913.134C18H16O7344.2292[M+H]345.2320 328.2056Eupatilin [13]
3013.935C26H38O4414.2476[M+H]415.2550371.2273, 397.2434LupuloneHMDB0030140
3115.853C30H51N8O4587.4037[M+H]588.4111 318.1141--
3228.295C16H33NO3287.2464[M+H]288.2537 242.2475ProsopinineMassHunter Library
3313.280C16H28O8348.1778[M+H]349.1851 333.1541Schizonepetoside EMassHunter library
[-], unknown compound.
Publisher’s Note: MDPI stays neutral with regard to jurisdictional claims in published maps and institutional affiliations.

