1. Introduction
Smart agriculture is gaining interest of machine learning researchers to solve the real and challenging problem of crop disease detection. Owing to leaf diseases, in the USA, more than USD 6 billion are lost by either crop management or yield reduction [
1]. Excessive use of agro-chemicals without precise knowledge of crop disease is increasing production cost along with adversely affecting the environment [
2].
Several diseases may attack on crop leaves simultaneously. For instance, the
Phytophthora infestans and
Alternaria solani diseases commonly known as ‘Late and Early Blight’ affecting potato leaves. Late blight is a fungal disease which spreads very quickly in warm and humid weather conditions. Owing to this disease, potato tubers are affected, hence a swift tuber rot [
3]. On the other hand, ‘Early Blight’ is also a fungal disease which damages crop foliar. Major factors of ‘Early Blight’ include relative humidity, temperature, and wetness duration of leaf [
4]. At initial stages, differentiation of the most leaf diseases are difficult for common growers and they applied agro-chemicals excessively. The domain experts can differentiate infected crop leaves even at initial stages. Such experts especially in developing countries is not easily available for crop health assessment. The early detection of crop leaf diseases may prevent a huge economic loss. In this scenario, an intelligent and automatic computer-aided diagnostic system is inevitable to identify the leaf diseases precisely.
In this paper, we present a new technique to classify crop leaf diseases by feature fusion followed by PCA based feature reduction and LDA for classification. Owing to the fusion of deep and handcrafted hybrid features, the proposed approach bypasses the major step of segmentation. Potato crop leaf images are used as a case study for system validation. The proposed approach maybe used as SaaS with an ordinary camera to acquire leaf images for better monitoring of crop health.
The rest of the paper is organized as follows. In
Section 2, the related work is presented. The proposed approach is described in
Section 3. Moreover,
Section 4 explains the experimental results. The discussion is presented in
Section 5. Finally,
Section 6 provides conclusion and future recommendation.
2. Related Work
Several methods based on RGB, multi-spectral, and hyper-spectral imaging technologies are developed for plant leaf disease classification [
5,
6,
7].
Dhaygude and Kumbhar proposed an imaging-based leaf disease severity system by utilizing segmentation approach. It composed two stages: (i) segmentation and (ii) classification. The classification efficiency highly depends upon quality segmentation. A slight variation in segmentation may considerably decline the classification performance [
8].
Bindushree and Sivasankari proposed a plant leaf disease detection system by employing K-means algorithm for segregation of region-of-interest followed by feature extraction and SVM classification. Their approach mainly depends on precise segmentation of affected leaf areas [
9]. Similarity,
Revathi and Hemalatha reported a cotton leaf disease detection technique, which utilizes edge identification for segmentation to identify the affected region. Their approach requires user intervention and may not be useful when applied on massive scale analysis [
10].
Tian et al. [
11] proposed image segmentation and performed statistical analysis for plant leaf disease identification. The acquired images are passed through a kernel and then compared with the original images. Statistical analysis of the results defined disease type. Although the process seems useful, however, the optimal selection of kernel size for various diseases may significantly affect the whole disease identification process.
Hu et al. [
12] proposed a hyper-spectral-image-based potato leaf disease detection approach. This technique produced acceptable results; however, the technology for acquiring hyper-spectral imaging might be inaccessible for an ordinary grower.
Recently, deep-learning-based approaches have gained the attention of researchers to solve real world problems in computer vision, object detection in videos and images, human disease diagnosis, and crop disease detection [
13,
14,
15,
16]. It has an advantage of automatic image feature extraction by the stacking of convolution and pooling layers. On the other hand, conventional approaches utilized handcrafted features for classification.
Several deep learning based approaches reported in the literature for classification of crop disease diagnosis [
13]. Selvarj et al. [
17] proposed banana plant disease detection using deep learning and obtained an accuracy of 90.0%. In another study, Zeng and Li [
18] proposed deep learning model based on self-attention for crop disease detection. Saleem et al. [
19] used convolutional neural networks for plant disease classification and achieved F-score value of 97.0%. Several other researchers used deep learning to develop different types of models for crop disease predictions [
20,
21,
22,
23].
In summary, conventional approaches have some associated challenges such as: quality image segmentation, numbers and types of handcrafted features for classification, and user intervention at certain levels. To minimize these limitations, it is highly desired to develop an automatic, efficient, scalable approach for crop disease classification. To this end, we have proposed feature fusion and the most discriminant features-selection-based PCA-LDA classifier for plant disease diagnosis. This will not only enhance accuracy but also reduce the computational complexity of the classifier.
3. Material and Methods
In this section, first, we describe the material used in this research and followed by the proposed methodology for plant leaf disease detection.
3.1. Material
The benchmark dataset of plant leaf disease images is obtained from
PlantVillage (
plantvillage.psu.edu). It comprises a variety of crops with labeled images. For validation of the proposed model, potato images dataset is considered. It has three classes, namely,
Healthy, Early, and
Late Blight. Class-wise distribution of Healthy, Early, and Late Blight are 142, 234, and 961 having different image sizes.
Figure 1 shows sample class images of potato leaves.
3.2. Methods
The proposed approach comprises four parts: (i) handcrafted feature extraction, (ii) deep features extraction, (iii) feature fusion and selection of discriminant features by PCA, and (iv) LDA-based classification. The benchmark dataset was split into 75%:25% for training and testing. The 75% data used for model training. During model development, 5-fold cross validation was used on training data, where 4 folds were used for training and a fifth was used for validation. This process continued for several iterations. Once model training is finished, the unseen 25% data were fed to the trained model for evaluation. The schematic block diagram of the proposed approach is shown in
Figure 2. Subsequently, the methodology of the proposed technique is explained in detail.
3.3. Handcrafted Feature Extraction
In this step, four different types of handcrafted features, namely, moments of gray level histogram
, local binary patterns
, histogram-oriented gradient
, and gray level co-occurrence matrix
are extracted from an input image. These features are widely reported in the literature for object identification [
24].
3.3.1. Moments of Gray-Level Histogram
The MGH features utilize intensity histogram, and it has an advantage to represent the image. Nine MGH features are extracted from the input image [
24,
25]. Generally, these features are extracted using
nth order moment from expression (1):
where
z shows the intensity level, and
represents the frequency of a given image intensity. The total intensity levels and the mean of the given image is represented by
L and
m, respectively.
The moment features (MF) are computed from potato leaf images using the following expressions:
3.3.2. Local Binary Patterns
LBPs use the spatial information of an image pixel within a certain radii. Binary patterns are generated by employing a radius which depicts the texture of neighboring pixels by considering the central pixel as a threshold [
26]. LBPs have better representation capability to cater to the affected area of leaf disease. A total of 256 LBP features are obtained by selecting a radius of 1, 2, and 3 pixels, empirically. Details of the LBP can be found in [
27].
The following expressions are used to obtain LBP features:
where
, and
R represent the pixel, its spatial information, and its radius, respectively. The pictorial representation of the LBP is shown in
Figure 3.
The function
s in Equation (
11) can be defined as:
3.3.3. Histogram of Oriented Gradients
HOG considered shape of the object present in an input image described by intensity gradients by splitting an image into smaller regions. A total of 81 features of potato leaf images are obtained [
28,
29]. The HOG features better described object shapes and are thus appealing to use since a disease spot forms variations in crop leaves.
3.3.4. Gray Level Co-Occurrence Matrix
The GLCM are statistical features to explore spatial image relationships. Different types of relationship (e.g., horizontal, diagonal, and off-diagonal) exist in images which need to be explored [
25,
30] the frequency of spatial adjacency. A total of 22 GLCM features are extracted from the image using the following expressions:
Additionally, auto-correlation, maximum probability, and cluster prominence are extracted.
In this part, four handcrafted extracted features of MGH, LBP, HOG, and GLCM are concatenated to form a hybrid feature vector of size 437. These combined handcrafted features are later fused with the deep features used for the development of the classification model.
3.4. Deep Image Feature Extraction
There are several advantages of deep feature extraction over common methods, such as user intervention not being required to define the kernel size, types, and numbers of features for any types of crop images. In comparison, in conventional feature extraction, user intervention is vital, and it is not necessarily the case that a universal configuration of features will work for all types of images. This encourages us to extract deep features and combine them with handcrafted hybrid features for the improved classification of crop disease detection.
Deep learning models have the ability to learn hidden patterns of input images at various convolutional and pooling layers. In this research, we have modified the ResNet50 model by employing the transfer learning (TL) concept for feature extraction. TL utilizes the partial weights of the original model and replaces new layers to solve new challenging problems [
31]. In case of relatively less annotated data, TL is an effective way of solving classification problems.
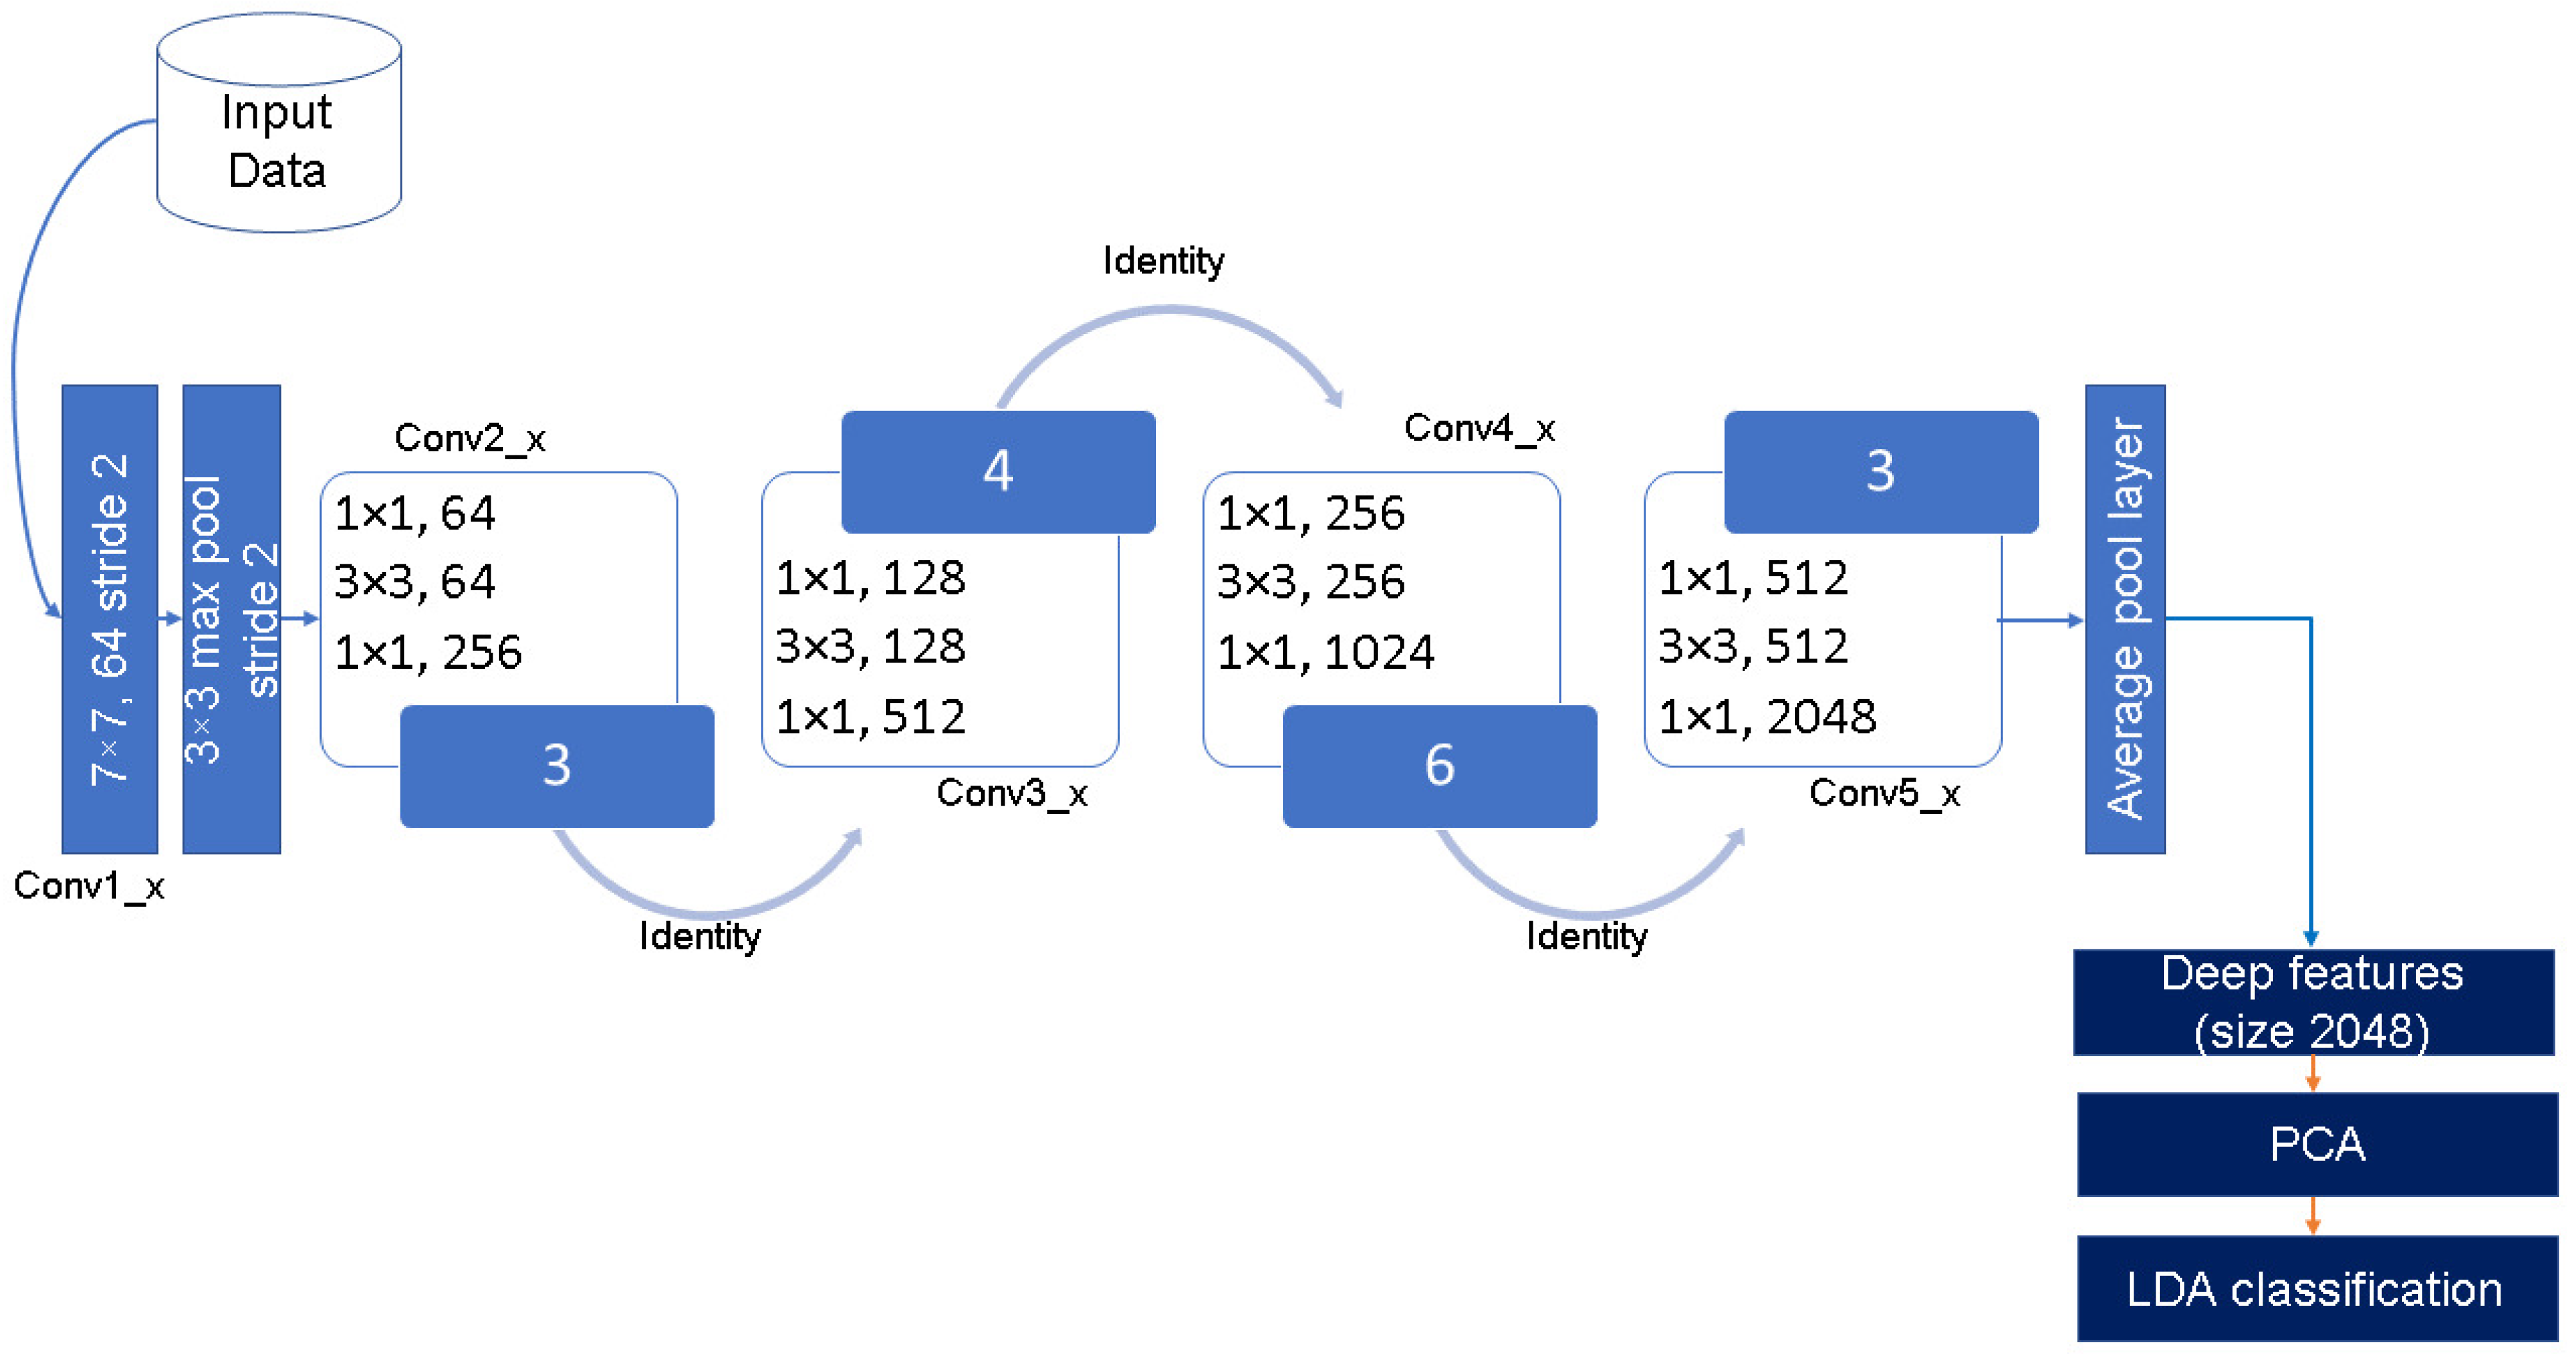
The original ResNet50 was trained for 1000 classes and having the last 3 layers of ResNet50, namely, ‘FC_1000’, ‘FC1000_Softmax’, and ‘FC_Classification. In the current study, ResNet50 is modified by replacing the mentioned layers with the new layers of ‘FC_3’, ‘FC3_Softmax’, and ‘Class_output’ for our three classes ‘Healthy’, ‘Early’, and ‘Late Blight’. The ‘avg_pool’ layer of the TL-ResNet50 has 2048 neurons connected with succeeding layers of 3 neurons, each representing a crop class.
The pictorial representation of the modified ResNet50 deep feature extraction using the TL concept is shown in
Figure 4. The numbers in blue blocks ‘3, 4, 6, and 3’ of
Figure 4 show that each block of ResNet50 perform total number of operations in a particular block. For example, ‘conv2_x’ block has 3 layers of 1 × 1, 64; 3 × 3, 64; and 1 × 1, 256, and these are repeated in total 3 time, so providing 9 layers in total in this part. Similarly, the ‘conv3_x’, ‘conv4_x’, and ‘conv5_x’ blocks have a total of 3 × 4 = 12, 3 × 6 = 18, and 3 × 3 = 9 layers in each part, respectively. Owing to the residual function, ResNet has better learning and generalization ability compared to its competitors.
The benefit of features extracted using deep learning algorithms is that the network learns image features automatically layer-by-layer. Generally, the last layer of any deep learning network such as ResNet50 produces an output class predication using softmax classification. However, high-level features can be extracted before the FC layers.
In this research, deep (high-level) features are extracted using TL-ResNet50 model after the fifth residual block (Conv5_x,
Figure 4) at the ‘avg_pool’ layer. This output serves as a deep image feature extractor. The dimension of the deep feature vector is of size 2048. These features are obtained once training of the TL-ResNet50 is completed. Details of the deep feature extraction and utilization for classification can be found in [
14]. For better performance, the network hyper-parameter tuning of TL-ResNet50 is set empirically as follows: a learning rate of 0.0001, a batch size of 32, data augmentation of (−30, 30), and the number of epochs is set to 600.
3.5. Feature Fusion
This paper comprises two feature extraction parts: (i) handcrafted hybrid features and (ii) deep features from TL-ResNet50. A total of 437 handcrafted features are concatenated with 2048 deep features to form a single fused vector of length 2485. The combined features are utilized to design the PCA-LDA classification model.
3.6. Dimension Reduction Using PCA
PCA uses orthogonal transformations to identify the correlated variables and convert them into uncorrelated ones. For efficient classification, the dimension of the fused feature (FF) vectors is reduced by employing PCA. Consequently, the most discriminant features are obtained for the construction of the model. FF has the n dimensions , which needs to be reduced into dimensions. The following steps are used by the PCA to obtain a reduced fused feature (RFF) set:
Co-variance matrix computation:
Eigenvector and Eigenvalue calculation:
Eigenvalue selection. We have selected the top 100 Eigenvalues from K-dimensional space to be used in LDA classification, as shown in the following equation:
3.7. PCA-LDA Model Development
The classification model is developed using the
set:
During model development, the LDA searches the linear combinations, where the optimal separation of multiple classes is achieved. It finds the optimal weights matrix
, where
l number of solutions exists, and selects the solution to maximize the rate between and within class scatters, as shown in the following equation:
where
represents the scatter between classes. Scatters within classes are shown in the expression below:
where
is
ith class mean, observation of
ith class
, and
T represents the transpose. The objective function obtained from combining (
31) and (
32) is as follows:
It requires finding weight vector
, which is associated with discrimination function in a way that
J is maximum. The resultant
Z matrix comprehensively represents the original features for the discrimination of one class among others. Details of the LDA can be found in [
14,
32].
3.8. Model Testing
The testing step is straightforward, in which the trained FF-PCA-LDA model is used at an independent dataset to predict ‘Healthy’, ‘Early’, or ‘Late Blight’ classes. As mentioned in
Section 3.2, the model is tested on an unseen 25% of the data which were not presented during training. The developed model is quantitatively evaluated at various standard quality measures, which are given below.
Evaluation Measures
Performance evaluation of the developed model is carried out using various standard quantitative measures such as accuracy, sensitivity, specificity, F-score, and AUC. Moreover, the ROC of the developed model is plotted. For multi-class problems, a one-vs.-all strategy is employed to compute the following evaluation measures:
Accuracy: It is a measure used to evaluate the model effectiveness for identification of correct classifications:
where
and
are true positives and negatives. respectively, whereas,
and
are false positives and negatives, respectively.
Sensitivity: It is used to evaluate the ability of a classifier to identify correct positive samples:
Specificity: It is used to check the model performance on the identification of negative samples in the dataset:
The F-Score: It is a weighted harmonic mean of precision and recall having a range between 0 and 1:
ROC Curve and Area Under the Curve (AUC): An ROC curve is one of the effective parameters to indicate model performance. It is the ratio between the false and true positive rates. The AUC value is associated with the ROC and is used to assess the overall classification performance [
33].
4. Results
The performance of the proposed FF-PCA-LDA approach is evaluated on the benchmark dataset
Section 3.1. The experimental setup involves a Core i5 PC equipped with 16 GB RAM, along with an NVIDIA GeForce GTX 1050 TI GPU and Matlab 2020(a). Experiments are performed to determine the capability of feature fusion along with PCA-based feature reduction followed by LDA classification using ordinary RGB potato leaf images.
Figure 5a,b show the graphical representation of PC1 and PC2 of the handcrafted and deep features, respectively. The feature fusion visualization with respect to its first and second principal components, PC1 and PC2, is shown in
Figure 5c. The performance evaluations in terms of sensitivity, specificity, and F-Score are shown in
Figure 6. Class-wise ROC curves of the developed approach are depicted in
Figure 7.
Table 1 shows the classification performance of the LDA on 437 handcrafted features, achieving an accuracy of 92.21%. The feature dimension is reduced by employing PCA, and the top 100 PCs (principal components) are utilized to build the LDA model. The
classification model offers an average accuracy of 96.53%. Although the average accuracy of handcrafted-features-based PCA and LDA classifications is sufficiently high, among classes, we can observe that the
Healthy class’s performance is relatively low.
Table 2 shows the LDA classification performance on deep features extracted by the modified ResNet50, which offered an average accuracy of 97.96%. Moreover, the PCA-based FF and LDA offer an average accuracy of 98.20%.
The comparison of the proposed approach with other classifiers is shown in
Table 3. The developed approach performance is compared with published approaches in
Table 4. The average AUC of 98.46% is obtained from the ROC curves (
Figure 7).
5. Discussion
In smart agriculture, the automatic identification of plant leaf diseases is vital for yield, quality, and management control. It will not only reduce production costs but also reduce the excessive use of agro-chemicals. The advancement of digital technologies and machine learning algorithms may help to improve crop disease diagnosis with high precision.
Deep learning is being used to solve real-world problems efficiently in medical imaging, computer vision, and object recognition. It is gaining the attention of researchers to use it for smart agriculture. It reduces the problems of conventional approaches such as user intervention, threshold and kernel size selection, and optimal feature extraction for segmentation and classification. These limitations make systems complex, and even a small variation in image acquisition or in parameter selection may reduce classification performance.
To address these challenges, a novel approach is developed by the fusion of handcrafted hybrid and deep features followed by PCA-LDA (FF-PCA-LDA) classification. As a case study, we have considered a potato plant leaf disease identification problem using benchmark dataset. Classification is performed on images acquired by an ordinary camera without performing segmentation and data oversampling steps. Experiments are conducted to validate the efficacy of the proposed approach.
In this research, for the performance comparison of the proposed approach, we designed following four types of models:
model using all handcrafted hybrid features without PCA;
model using only handcrafted hybrid (HH) features;
deep learning model without PCA-LDA;
model using only Deep features (DF);
model using only fused features.
It has been observed from
Table 1 that handcrafted hybrid features based
models offer an average accuracy of 92.21%. However, it is possible that some features might be redundant and less contributing in model development. PCA has been employed for dimension reduction, and the most important 100 PCs are selected and fed to LDA for the development of the model.
offers improved average accuracy by 4.32%. This indicates the existence of redundant and less important features, which may not have contributed in classification. The visual representation of features using PC1 and PC2 is shown in
Figure 5a. It can be observed that except for the ‘Late Blight’ class, the other class features have low intraclass similarity.
Although the model has improved, the average performance for potato disease detection. However, if we considered other crops, this case may not be true because every crop’s leaves have their own feature representation. The current parameters setting of handcrafted hybrid features for potato crop may not offer such high performance for any other plant disease. Hence, it is highly desired of an automatic feature extraction technique to classify crop leaf images with high precision.
To overcome the problems of handcrafted hybrid features mentioned previously, we develop TL-ResNet50 deep learning model for the classification of potato crop leaf diseases. From
Table 1 and
Table 2, it is inferred that TL-ResNet50 model improves accuracy compared to
and
models. Furthermore, we extracted deep features by employing the modified ResNet50 deep learning model. It automatically mimicked and extracted the most dominant image features at the ‘avg_pool’ layer of the network, as shown in
Figure 4.
classification is performed on deep features, and an average accuracy of 97.96% is achieved for potato crop leaf disease identification, as shown in
Table 2. The high average accuracy indicates that TL-ResNet50 has successfully learned the image features followed by efficient LDA classification. It improved performance by 6% compared to the
model, as shown in
Table 1. Visually,
Figure 5b shows the low interclass scatter of the deep features using the first two principal components, i.e., PC1 and PC2.
In this research, the fusion of handcrafted hybrid and deep features is performed, followed by a dimension reduction using PCA and plant disease classification with LDA. A fused feature vector of dimension 2485 for every input image is obtained and fed to PCA for dimension reduction. Visual representation of reduced features with PC1 and PC2 is shown in
Figure 5c. It is observed that PCA has efficiently mapped the features with low intraclass and high interclass separation. An average accuracy of 98.20% is achieved by the
model for the identification of potato leaf diseases, as shown in
Table 2. Sufficient improvement is observed over handcrafted hybrid and deep-features-based classification models.
The average performance offered by the developed approach in terms of sensitivity, specificity, and F-score is 98.79%, 92.67%, and 95.33%, respectively, and shown in
Figure 6. It is observed that
successfully identified all samples of ‘Healthy’ and ‘Early Blight’ classes with 100% sensitivity values, with 96.0% for ‘Late Blight’ class. The high values of these performance parameters indicate the effectiveness of the FF-PCA-LDA approach.
Overall, it is deduced that the feature-fusion-based
model enhanced the classification accuracy by 1.45% over the TL-ResNet50 model for potato crop leaf diseases. Similarly, the proposed
model also performed better over the handcrafted-hybrid-based
and
models and the deep-features-based
models. This fact can be observed from
Table 1 and
Table 2. One of the objectives of this study is to improve the performance of the proposed FF-PCA-LDA crop leaf disease diagnosis system. It is achieved through the fusion of deep and handcrafted hybrid features followed by PCA-LDA classification.
Similarly, class-wise performance in terms of ROC curves of potato crop leaf diseases are shown in
Figure 7. ROC curves for all classes are very close to the vertical axis, which depicts the efficacy of the developed model. The average value of the AUC is obtained as 98.46% by the FF-PCA-LDA approach. The high value of the AUC shows the usefulness of the approach; hence, it can be used for plant leaf disease classification models. For comparison purposes, we have developed various classifiers such as MLBPNN, KNN, and PNN using a five-fold cross validation technique on the same dataset. The performance of the proposed approach with different classifiers is presented in
Table 3. The analysis shows that the proposed approach offers superior performance compared to other classifiers.
Moreover, the developed model is compared with some of the existing potato leaf disease detection techniques, as shown in
Table 4. The proposed FF-PCA-LDA approach offers high performance as compared to other state-of-the-art techniques. The high performance is evident because the fused features are used to design the
classification model.
In this study, we have developed an efficient approach using feature fusion followed by classification and achieved 98.20% accuracy for Potato leaf disease detection. It does not required any specialized image acquisition equipment. RGB images are utilized that are acquired by a smartphones or an ordinary camera to monitor crop health. The developed approach works without any user intervention for parameter selection compared to segmentation-based techniques.The proposed approach can be extended for the development of mobile or web apps, and growers can obtain benefits for accurate and swift crop health monitoring. It is an automatic, straightforward, cost-effective, efficient, scalable, and reproducible approach. It may be extended for leaf disease diagnosis of other crops such as sugar beet, cotton, tomato, and apple.


 ,
, 


