Featured Application
Pulmonary artery remodeling and 3D flow biomarkers can be useful to characterize pulmonary hypertension severity and progression.
Abstract
Poorly characterized by non-invasive diagnostic imaging techniques, pulmonary hypertension (PHT) is commonly associated with changes in vascular hemodynamics and remodeling of pulmonary artery architecture. These disease phenotypes represent potential biomarkers of interest in clinical environment. In this retrospective clinical study, 33 patients with pulmonary hypertension and seventeen controls were recruited. Architectural remodeling was characterized using 3D-contrast enhanced angiogram via the measurement of pulmonary artery diameters, bifurcation distances, and angles. Hemodynamics were characterized using 4D-flow magnetic resonance imaging (MRI) via wall shear stress, kinetic energy, vorticity, and directional flow dynamics. Parameters were compared using independent samples student’s t-tests. Correlational analysis was performed using Pearson’s correlation. PHT patients demonstrated dilation in the main and right branch of the pulmonary artery (p < 0.05). Furthermore, these patients also exhibited increases in bifurcation distances in the left and right pulmonary arteries (p < 0.05). Wall shear stress, maximum kinetic energy, and energy loss were decreased in the pulmonary artery (p < 0.001). Correlations were observed between peak velocities and right ventricle ejection fraction (r = 0.527, p < 0.05). These findings suggest that pulmonary artery remodeling and hemodynamic changes may possess clinical utility as MRI biomarkers for PHT.
1. Introduction
Pulmonary hypertension (PHT) is a complex pathophysiological disorder characterized by an elevation in pulmonary arterial pressure (PAP). This diagnosis is given when mean PAP exceeds 25 mmHg at rest using invasive right heart catheterization [1]. In early stages of the disease, elevations in PAP and architectural remodeling typically induce dilation and overload-induced hypertrophy of the right ventricle. Over time, this results in impairment of cardiac function, eventual right heart failure, and secondary pathophysiology such as right atrial dilation [2]. Although two-dimensional (2D) Doppler echocardiography is commonly used to provide evidence of the disease hallmarks in the right ventricle, and right ventricular catherization is needed for a conclusive diagnosis. Thus, other non-invasive diagnostic imaging biomarkers would be beneficial in clinical settings [3]. Magnetic resonance imaging (MRI) and angiography (MRA) could address this unmet need. Relative to 2D Doppler echocardiography, MRI possesses two advantages. First, it can perform multiplanar analysis allowing for accurate volumetric measurement of the vasculature. Second, it can evaluate hemodynamic changes in the pulmonary pathway via 4D-flow MRI. In both cases, volume and flow measurements demonstrate low variability and high test–re-test reliability [3,4]. Although MRI has improved the characterization of right ventricular pathophysiology, it has also identified potential biomarkers of the disease in the pulmonary artery (PA). Patients diagnosed with PHT often exhibit hemodynamic changes such as decreased vorticity, peak velocity, and wall shear stress (WSS) [5,6,7]. Furthermore, anatomic remodeling, including PA dilation and medial thickening, can be simultaneously observed [8]. Although promising, these novel biomarkers and their relationship must be investigated.
The purpose of this study was to test the hypothesis that hemodynamic changes within the pulmonary artery are associated with remodeling of the surrounding vascular architecture. In addition, we aimed to further characterize PHT biomarkers in the PA by investigating novel 3D flow biomarkers and bifurcation distances.
2. Materials and Methods
2.1. Study Population
A total of 51 subjects were recruited retrospectively, including 17 PHT patients and 33 controls. All subjects were registered within the Cardiovascular Imaging Registry of Calgary (CIROC). The study was approved by the University of Calgary Research Ethics Board and all subjects provided written informed consent. All research activities were performed in accordance with the Declaration of Helsinki. The study was coordinated by commercial software (cardioDITM, Cohesic Inc., Calgary, AB, Canada) for the routine capture of patient informed consent, for health questionnaires, and for standardized collection of MRI-related variables. PHT was clinically defined as a mean PA pressure ≥25 mmHg previously assessed by clinical invasive catheterization or echocardiography. Patients were recruited at the time of visit, with exclusions occurring for patients with prior surgical interventions in the pulmonary valve and/or artery; complex congenital heart disease; and/or contraindications to MRI. Control subjects (≥18 years of age) underwent similar workflow and confirmed no prior history of cardiovascular disease with a certified nurse. No catherization was performed in healthy controls. Prior to scanning, demographic measurements including age, sex, height, weight, and heart rate were obtained. Volume and mass measurements were normalized to body surface area using the Mosteller formula.
2.2. Cardiac Magnetic Resonance Imaging Protocol
Cardiac imaging examination was performed using 3T MRI scanners (Skyra and Prima, Siemens, Erlangen, Germany). Indication-based protocolling ensured consistent imaging procedures for all subjects, and cardiac imaging was performed in accordance with published recommendations [9]. Standard routine retrospective electrocardiographic gating, and time-resolved balanced steady-state free precession (SSFP) cine imaging in four-chamber, three-chamber, two-chamber, and short-axis views of LV at end-expiration, was performed. Contrast usage of gadolinium contrast volume of 0.2 mmol/kg (Gadovist®, Bayer Inc., Mississauga, ON, Canada) was administrated to acquire a contrast-enhanced 3D magnetic resonance angiogram (CE MRA) of the cardiovascular structure. Time-resolved three-dimensional phase-contrast MRI with three-directional velocity encoding and retrospective ECG-gating (4D-flow, Siemens WIP 785A) was performed for 5–10 min, following contrast administration to measure in-vivo blood flow velocities within the whole heart. We have previously reported this whole-heart protocol [10,11,12]. Briefly, 4D-flow data was acquired during free breathing using navigator gating of diaphragmatic motion; sequence parameters were as follows: flip angle = 15 degrees, spatial resolution = 2.0−3.5 × 2.0−3.5 × 2.5−3.5 mm; temporal resolution = 39–48 ms; and velocity sensitivity = 150−250 cm/s. Total acquisition time varies between 5–10 min, depending on heart rate and respiratory navigator efficiency. The number of phases was adjusted to 25.
2.3. Standard Cardiac Imaging Analysis
Standard cardiac images were analyzed by a blinded reader to the study the same day of the acquisition using dedicated software cvi42 version 5.11.5 (Circle Cardiovascular Imaging Inc, Calgary, AB, Canada) to determine left and right end-diastolic volume (LVEDV; RVEDV), LV and RV end-systolic volume (LVSEV; RVESV), and LV and RV ejection fraction (LVEF; RVEF). Furthermore, the contrast-enhanced angiogram (CE MRA) was used to measure pulmonary artery diameters (LPA, MPA, and RPA), bifurcation distances, and bifurcation angles (Figure 1D).
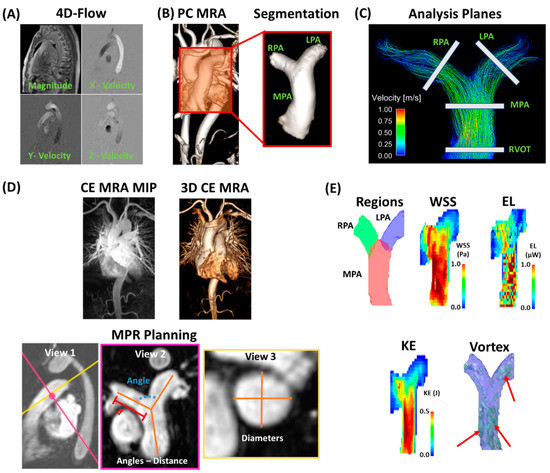
Figure 1.
Data processing and analysis workflow. Panel (A) shows an example of corrected 4D-flow images. Panel (B) illustrates a time-average phase-contrast (PC) magnetic resonance angiogram (MRA) with an optimal threshold for visualizing the anatomy. The pulmonary artery (PA) was segmented by isolating the corresponding volume and identifying the main PA (MPA), right PA (RPA), and left PA (LPA). Panel (C) shows the 2D analysis planes for basic flow quantification in the right ventricle outflow track (RVOT), MPA, RPA, and LPA. Panel (D) shows contrast-enhanced MRA (CE MRA) maximum intensity projection (MIP) and the corresponding 3D volume of a sample case. Multi-planar reconstruction (MPR) was used for planning of angle (in blue), distance (d in red), and diameter (location in pink, diameters in golden). Pink and golden lines in View 1 represent the projection planes corresponding to View 2 and 3, respectively. Distance samples (orange lines in View 2) were defined for MPA the closer point to the pulmonary valve to the PA bifurcation; right and left PA distances were defined from the PA bifurcation to the closer visible in-plane ramification. Panel (E) shows examples of sub-volume regions of MPA, RPA, and LPA; wall shear stress (WSS); energy loss (EL); kinetic energy (KE); and vortex core size (red arrows point to vortex cores identified by λ2).
2.4. 4D-Flow Data Analysis
All 4D-flow MRI data was pre-processed using in-house program developed in MATLAB 2020b (Mathworks, Natick, MA, USA), and the following tasks were performed: corrections for Maxwell terms, eddy currents, and aliasing, Figure 1A. After pre-processing, a 3D phase-contrast (PC) angiogram (PC MRA) was generated, Figure 1B. This angiogram was used to segment selected anatomical regions of the pulmonary artery, Figure 1B red in-set, using in-house MATLAB-based tool “4D-Flow Analysis Tool” [13,14]. Analysis planes were created at the right ventricular outflow tract (RVOT), main pulmonary artery (MPA), the left pulmonary artery (LPA), and right pulmonary artery (RPA) using a specialized visualization software (Ensight 10.2, CEI Inc, Research Triangle Park, North Carolina, USA) to measure peak velocity, net flow, retrograde flow, regurgitation fraction, and forward flow, Figure 1C. Furthermore, the PC MRA was used to measure pulmonary artery diameters (LPA, MPA and RPA), bifurcation distances, and bifurcation angles (Figure 1D) in cvi42 when standard CE MRA was not available in controls (n = 2). Volume sub-regions were created for local advanced 4D-flow analysis. These volume subregions were used to obtain the maximum velocities from the LPA, PA, and RPA using the approach proposed by Rose et al. [15].
Regional WSS was calculated at peak systole as previously described [16,17]. Energy loss (EL) was calculated as proposed by Barker et al. [18], which provides the rate of EL in a volume of interest (i.e., power in Watts) at a given time of the cardiac cycle, and peak systole was used in this study. Kinetic energy (KE) was calculated as reported by Geeraert et al. [13] in each sub-region at peak systole. Vortex size analysis at peak systole was performed as introduced by Garcia et al. [10] using the Lambda2 (λ2) method, which is an accepted method to identify 3D vortices. Valid vortex networks were defined as those >75 mm3 (considering a voxel resolution of 2.5 × 2.5 × 3.0 mm) with a shared connectivity neighborhood ≥4 voxels. This rule reduces the impact of possible incorrect derived vortices due to noise and/or partial derivative errors, which are directly impacted by 4D-flow spatial resolution. Examples for these advanced 4D-flow parameters are presented in Figure 1E.
2.5. Statistical Analysis
Statistical analysis was performed using SPSS 25 (SPSS, Chicago, IL, USA). Normality was assessed using normal plots and the Shapiro–Wilk test. Between-group comparisons for demographic, baseline cardiac MRI, hemodynamics, and anatomical measurements were performed using an independent samples t-test incorporating Levene’s test for equality of variances. To assess the relationship between variables, a series of linear regression tests was performed using Pearson R-Values. If a significant relationship was found, a univariate linear model was generated using variables demonstrating statistical significance during the linear regression tests. Pearson correlation coefficients were also generated in relation to LVEF and RVEF. The significance threshold was <0.05.
3. Results
3.1. Patient Characteristics
Patient and control group characteristics inclusive of demographic and cardiac function data are summarized in Table 1. There were differences in age (55 ± 17 years vs. 39 ± 15 years, p = 0.001), sex (76% vs. 31% female, p = 0.002), height (1.64 ± 0.14 m vs. 1.73 ± 0.10 m, p = 0.023), and heart rate (76 ± 16 bpm vs. 66 ± 11 bpm, p = 0.016) between PHT patients and controls. BSA (1.88 ± 0.28 m2 vs. 1.92 ± 0.34 m2, p = 0.643) and weight (78 ± 18 kg vs. 79 ± 21 kg, p = 0.791) did not differ. Of the cardiac function parameters, PHT patients demonstrated lower LVEDV (127 ± 48 mL vs. 160 ± 35 mL, p = 0.011). However, other measurements, including LVEF (59 ± 13% vs. 61 ± 6%, p = 0.752), LVESV (58 ± 42 mL vs. 66 ± 23 mL, p = 0.381), RVEF (56 ± 7% vs. 55 ± 30%, p = 0.878), RVEDV (190 ± 79 mL vs. 173 ± 48 mL, p = 0.456), and RVESV (106 ± 72 mL vs. 77 ± 28 mL, p = 0.152), did not differ.

Table 1.
Demographic, cardiac function baseline, and medications.
3.2. Anatomical Remodeling
Anatomical measurements of the PA are detailed in Table 2. Of the regions measured, only the MPA (AP: 32 ± 6 mm vs. 30 ± 4 mm, p = 0.050; RL: 32 ± 6 mm vs. 28 ± 3 mm, p = 0.005) and the RPA-AP (21 ± 4 mm vs. 19 ± 3 mm, p = 0.050) demonstrated dilatation in PHT patients. The LPA (AP: 20 ± 4 mm vs. 19 ± 4 mm, p = 0.370; CC: 21 ± 4 mm vs. 19 ± 3 mm, p = 0.226) and the RPA-CC (22 ± 4 mm vs. 21 ± 3 mm, p = 0.558) did not differ. The bifurcation distances of PHT patients were greater in the branches (LPA: 34 ± 6 mm vs. 29 ± 8 mm, p = 0.043; RPA: 34 ± 5 mm vs. 27 ± 6 mm, p < 0.001), but not the MPA (33 ± 5 vs. 30 ± 8 mm, p = 0.302) itself. Bifurcation angles did not differ (93 ± 9 degrees vs. 98 ± 15 degrees, p = 0.208).
Table 2.
Anatomical measurements.
3.3. Hemodynamic Characteristics
4D flow data is reported in Table 3, and sample datasets are illustrated in Figure 2. Maximum EL was lower in PHT patients in all regions of the PA (LPA: 1.06 ± 0.75 µW vs. 2.12 ± 1.22 µW, p = 0.002; MPA: 2.76 ± 1.20 µW vs. 4.30 ± 1.93 µW, p = 0.001; PA: 3.94 ± 1.71 µW vs. 7.27 ± 3.24 µW, p < 0.001; RPA: 0.88 ± 0.70 µW vs. 2.06 ± 1.22 µW, p = 0.001) relative to controls. Although mean EL did not differ in the MPA (1.24 ± 0.56 µW vs. 1.27 ± 0.45 µW, p = 0.800) or the entirety of the PA (1.76 ± 0.83 µW vs. 2.00 ± 1.09 µW, p = 0.439), it was increased in PHT patients in the LPA (1.76 ± 0.39 µW vs. 0.49 ± 0.51 µW, p = 0.022) and decreased in the RPA (0.06 ± 0.24 µW vs. 0.46 ± 0.56 µW, p = 0.001).
Table 3.
4D-Flow hemodynamic measurements.
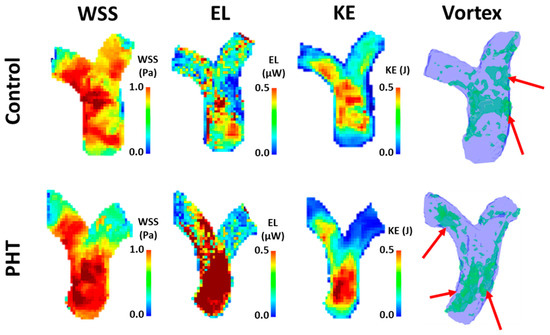
Figure 2.
Sample dataset of advanced 4D-flow based measurements. Top raw shows a healthy control, man, 36-year-old. Bottom raw shows a pulmonary hypertension (PHT) patient, man, 58-year-old. WSS: wall shear stress; EL: energy loss; KE: kinetic energy.
Maximum WSS for PHT patients was lower in all regions (LPA: 0.75 ± 0.29 Pa vs. 1.17 ± 0.26 Pa, p < 0.001; PA: 0.98 ± 0.28 Pa vs. 1.28 ± 0.28 Pa, p = 0.001; RPA: 0.64 ± 0.26 Pa vs. 1.08 ± 0.30 Pa, p < 0.001), except the MPA (0.97 ± 0.28 Pa vs. 1.06 ± 0.18 Pa, p = 0.224). Mean WSS (LPA: 0.14 ± 0.05 Pa vs. 0.19 ± 0.05 Pa, p = 0.001; MPA: 0.14 ± 0.03 Pa vs. 0.18 ± 0.04 Pa, p = 0.022; PA: 0.14 ± 0.03 Pa vs. 0.18 ± 0.04 Pa, p = 0.002; RPA: 0.12 ± 0.04 Pa vs. 0.17 ± 0.05 Pa, p < 0.001) and the mean of the highest 5% WSS values (LPA: 0.48 ± 0.20 Pa vs. 0.76 ± 0.15 Pa, p < 0.001; MPA: 0.52 ± 0.13 Pa vs. 0.68 ± 0.14 Pa, p < 0.001; PA: 0.52 ± 0.14 Pa vs. 0.74 ± 0.14 Pa, p < 0.001; RPA: 0.40 ± 0.16 Pa vs. 0.70 ± 0.18 Pa, p < 0.001) were lower in all regions of the PA. The mean of all WSS values above 95% was decreased in the LPA (0.73 ± 0.28 Pa vs. 1.14 ± 0.26 Pa, p < 0.001) and RPA (0.63 ± 0.25 Pa vs. 1.03 ± 0.32 Pa, p < 0.001), but not the MPA (0.94 ± 0.27 Pa vs. 1.03 ± 0.17 Pa, p = 0.234) or the entirety of the PA (0.96 ± 0.27 Pa vs. 1.51 ± 1.44 Pa, p = 0.123) relative to controls. Maximum vortex volume was only increased in the MPA (27.08 ± 10.66 mm3 vs. 20.33 ± 7.09 mm3, p = 0.01) but otherwise did not differ (LPA: 5.60 ± 3.01 mm3 vs. 4.44 ± 1.85 mm3, p = 0.090; PA: 33.99 ± 12.14 mm3 vs. 27.47 ± 7.08 mm3, p = 0.053; RPA: 4.11 ± 2.22 mm3 vs. 3.70 ± 1.89 mm3, p = 0.493). Mean vortex volume was increased in all regions (LPA: 3.55 ± 2.04 mm3 vs. 2.14 ± 1.11 mm3, p = 0.014; MPA: 19.00 ± 8.71 mm3 vs. 11.97 ± 4.76 mm3, p = 0.005; PA: 24.55 ± 10.60 mm3 vs. 15.58 ± 5.41 mm3, p = 0.004) except for the RPA (2.61 ± 1.41 mm3 vs. 2.09 ± 1.19 mm3, p = 0.175). Maximum KE attained was also lower in PHT patients (LPA: 1.1 ± 0.7 mJ vs. 2.2 ± 1.2 mJ, p < 0.001; MPA: 2.8 ± 1.1 mJ vs. 4.2 ± 1.9 mJ, p = 0.002; PA: 4.0 ± 1.7 mJ vs. 7.3 ± 3.3 mJ, p < 0.001; RPA: 0.7 ± 0.5 mJ vs. 2.0 ± 1.2 mJ, p < 0.001).
Peak velocity did not differ in any region of the PA (RVOT: 0.71 ± 0.26 m/s vs. 0.82 ± 0.17 m/s, p = 0.145; LPA: 0.71 ± 0.27 m/s vs. 0.81 ± 0.25 m/s, p = 0.210; MPA: 0.72 ± 0.26 m/s vs. 0.84 ± 0.22 m/s, p = 0.092; RPA: 0.69 ± 0.31 m/s vs. 0.81 ± 0.18 m/s, p = 0.173). Forward flow was lower in the RPA (26.08 ± 13.12 mL vs. 33.82 ± 12.08 mL, p = 0.042) of PHT patients but otherwise did not differ (RVOT: 74.86 ± 37.25 mL vs. 83.11 ± 23.11 mL, p = 0.413; LPA: 43.10 ± 27.79 mL vs. 43.15 ± 13.29 mL, p = 0.995; MPA: 80.52 ± 40.39 mL vs. 89.27 ± 19.41 mL, p = 0.408). Similarly, net flow was also lower in the RPA (25.84 ± 13.35 mL vs. 33.28 ± 11.83 mL, p = 0.049) of PHT patients but otherwise did not differ (RVOT: 72.38 ± 36.23 mL vs. 81.06 ± 23.71 mL, p = 0.380; LPA: 43.04 ± 27.84 mL vs. 42.58 ± 13.52 mL, p = 0.949; MPA: 79.70 ± 40.75 mL vs. 88.25 ± 20.00 mL, p = 0.424). Retrograde flow (0.06 ± 0.14 mL vs. 0.57 ± 1.15 mL, p = 0.017) was lower in the LPA of PHT patients but otherwise did not differ (RVOT: 2.48 ± 5.89 mL vs. 2.05 ± 2.48 mL, p = 0.715; MPA: 0.81 ± 1.01 mL vs. 1.02 ± 1.65 mL, p = 0.637; RPA: 0.24 ± 0.65 mL vs. 0.55 ± 0.79 mL, p = 0.162). Furthermore, regurgitation fractions were decreased in the LPA (0.33 ± 0.83% vs. 1.57 ± 3.18% p = 0.043) and RPA (0.23 ± 0.54% vs. 1.56 ± 1.89%, p = 0.001) but did not differ in the RVOT (3.48 ± 5.60% vs. 2.92 ± 4.20%, p = 0.695) or MPA (1.78 ± 3.78% vs. 1.32 ± 2.21%, p = 0.588).
3.4. Univariate Analysis
Correlational analyses were reported in Table 4. LVESV correlated with LVEF (R = −0.610, p < 0.001). RVEDV correlated with LVEF and RVEF (R = −0.454, p = 0.005; R = −0.610, p < 0.001). A similar correlation was observed for RVESV (R = −0.677, p < 0.001; R = −0.864, p < 0.001). MPA-AP (R = 0.385, p = 0.017) and MPA-RL (R = 0.418, p = 0.009) are significantly correlated to RVEF but not LVEF (MPA-AP: R = 0.097, p = 0.520; MPA-RL: R = 0.079; p = 0.603). All peak velocity measurements were significantly correlated with LVEF (RVOT: R = 0.451, p = 0.002; MPA: R = 0.489, p = 0.001; LPA: R = 0.454, p = 0.002; RPA: R = 0.527, p < 0.001) and RVEF (RVOT: R = 0.416, p = 0.009; MPA: R = 0.373, p = 0.021; LPA: R = 0.401, p = 0.013; RPA: R = 0.420, p = 0.009). The MPA RF (R = −0.447, p = 0.002), MPA max WSS (R = 0.519, p < 0.001) and MPA mean WSS (R = 0.393, p = 0.007) correlated with LVEF. LPA mean WSS also correlated with LVEF (R = 0.306, p = 0.038). MPA mean Vortex (R = −0.335, p = 0.023) and MPA max KE (R = 0.332, p = 0.024) also showed a correlation with LVEF.
Table 4.
Univariate analysis for ejection fraction.
3.5. Sex Matching for Women
Sex matching analysis is reported in Table 5. When matching a women subset of controls and patients (n = 10), significant differences (p < 0.05) were identified for weight; for MPA-AP, MPA-RL, RPA-AP diameters; and for RPA distance. Similarly, advanced parameters showed differences for mean EL MPA (p = 0.025), RPA max WSS (p = 0.003), LPA max WSS (p = 0.019), MPA max vortex (p = 0.003), MPA mean vortex (p = 0.001), RPA mean vortex (p = 0.037), LPA max vortex (p = 0.017), LPA mean vortex (p = 0.001), and RPA max KE (p = 0.004).
Table 5.
Matching analysis for women.
4. Discussion
In this study, we demonstrate that PHT is associated with both hemodynamic and anatomic changes throughout the PA. Patients with PHT demonstrated multiple changes across a variety of hemodynamic parameters, including EL, WSS, vorticity, flow direction and flow velocity. In addition, pulmonary artery dilation was observed alongside changes in bifurcation geometry. Sex matching for women identified differences for several anatomical and advanced hemodynamic biomarkers. Taken together, these findings provide additional evidence that hemodynamic and anatomic biomarkers possess clinical relevance for diagnosis of the disease.
Although hemodynamic changes are emerging biomarkers of the disease, they remain poorly understood. Previous research suggests patients with PHT demonstrate lower wall shear stress [5,7]. Although these studies were conducted using an adult PHT population, the findings possess relevance to the broader definition of PHT. For vorticity, a recent study conducted by Kroeger et al. found that vortices are observed in healthy controls and patients with PHT [19]. Similarly, Schafer et al. identified reduced vorticity but increased helicity in patients with PHT [6]. For EL, Han et al. demonstrated greater total energy losses over the cardiac cycle throughout the entirety of the PA [20] in PHT patients. PHT patients may also demonstrate greater retrograde flow and lower peak velocity [21,22]. In contrast, anatomical changes are more well-studied using CT, identifying dilation of the main pulmonary artery in various stages of the disease [23,24]. These findings have been replicated using MRI and appear to be prevalent in the later stages [25].
Our findings generally corroborate results of previous studies and provide insight into novel biomarkers. We observed lower WSS, maximum energy attained, and regurgitation fractions in the LPA and RPA in patients with PHT. Maximum EL at peak systole remained lower in patients than in controls in all PA sections. Mean EL tended to be also lower, except for the LPA. EL reported in our study was quantified at peak systole, which provides further support in addition of previous findings reported over the cardiac cycle. Contrary to other studies, we found that vorticity tended to increase in PHT patients. For anatomical changes, we observed dilation in the MPA and part of the RPA. Of note, we are the first study to our knowledge to identify greater bifurcation distances associated with PHT. We speculate this could be an additional form of anatomical remodeling associated with disease progression. However, the exact significance is unknown. Further studies investigating changes in bifurcation geometry at various disease stages are needed to better understand their significance. The difference between the RPA and LPA characterization may be influenced by the patient’s anatomy and the hemodynamic resistance from the lungs. However, the latter requires additional investigation. Furthermore, sex-matching analysis confirmed the impact of advanced hemodynamic parameters in PHT patients and highlighted the importance of subject matching in future studies.
This study has a few limitations. First, our study was limited by the spatiotemporal resolution constraints of MRI. For example, while we could visualize larger vortex networks, smaller vortices occurring at faster speeds exceeding the available resolution could be missed. Second, as a single centre study, the addition of multiple centres would improve the generalization of results. Furthermore, due to its retrospective nature, the sample size and power is limited. Third, our control patients were not age and sex-normalized to the patient cohort, which suggests normal cardiac aging and sex differences could have impacted results. Fourth, PHT is a progressive multi-factorial condition with diverse underlying etiology. Clinical protocols did not mandate further characterization of the disease into smaller subgroups such as pulmonary arterial hypertension, or patients at varying stages of the disease, limiting the characterization of disease progression. The relatively small cohort size did not allow one to explore the effect of medical therapy in 4D-flow derived parameters. The latter remains an important aspect to assess in future studies. Finally, we did not explore the right ventriculo-pulmonary arterial coupling in the present cohort. This coupling analysis may produce a better understanding of the bidirectional effects between the RV and the pulmonary artery tree.
5. Conclusions
Adult PHT patients demonstrate hemodynamic and anatomic differences throughout the PA. In addition to providing further support for established disease phenotypes such as reduced WSS and PA dilatation, these findings suggest that novel biomarkers such as energy changes and changes in bifurcation geometry may possess clinical relevance for PHT patients. Future studies are needed to investigate these phenomena at varying stages of the disease and determine how they may be affected by underlying etiology.
Author Contributions
Conceptualization, Z.M.H. and J.G.; methodology, J.G.; software, J.G.; validation, Z.M.H. and J.G.; formal analysis, Z.M.H. and J.G.; investigation, Z.M.H. and J.G.; resources, J.G.; data curation, Z.M.H. and J.G.; writing—original draft preparation, Z.M.H. and J.G.; writing—review and editing, J.G.; visualization, Z.M.H. and J.G.; supervision, J.G.; project administration, J.G.; funding acquisition, J.G. All authors have read and agreed to the published version of the manuscript.
Funding
This research was funded by The University of Calgary, URGC SEM #1054341; J.G. start-up funding. We acknowledge the support of the Natural Science and Engineering Research Council of Canada/Conseil de recherche en science naturelles et en génie du Canada, RGPIN-2020-04549 and DGECR-2020-00204.
Institutional Review Board Statement
The study was conducted according to the guidelines of the Declaration of Helsinki and approved by the Conjoint Health Research Ethics Board of University of Calgary (REB13-0902 approved on 6/18/2014 and currently active.
Informed Consent Statement
Written informed consent was obtained from all subjects involved in the study.
Data Availability Statement
The anonymized data presented in this study are available on request from the corresponding author. The data are not publicity available due to privacy and ethical restrictions.
Conflicts of Interest
The authors declare no conflict of interest.
References
- Galiè, N.; Humbert, M.; Vachiery, J.-L.; Gibbs, S.; Lang, I.; Torbicki, A.; Simonneau, G.; Peacock, A.; Vonk Noordegraaf, A.; Beghetti, M.; et al. 2015 ESC/ERS Guidelines for the diagnosis and treatment of pulmonary hypertension: The Joint Task Force for the Diagnosis and Treatment of Pulmonary Hypertension of the European Society of Cardiology (ESC) and the European Respiratory Society (ERS): Endor. Eur. Heart J. 2016, 37, 67–119. [Google Scholar] [CrossRef]
- Deng, Y.; Guo, S.-L.; Wu, W.-F.; Wang, Q.; Su, H.-Y.; Tan, Z.; Wang, F.; He, Q.-Y. Right atrial evaluation in patients with pulmonary hypertension. J. Ultrasound Med. 2016, 35, 49–61. [Google Scholar] [CrossRef]
- Freed, B.H.; Collins, J.D.; Francois, C.J.; Barker, A.J.; Cuttica, M.J.; Chesler, N.C.; Markl, M.; Shah, S.J. MR and CT imaging for the evaluation of pulmonary hypertension. JACC Cardiovasc. Imaging 2016, 9, 715–732. [Google Scholar] [CrossRef]
- Nordmeyer, S.; Riesenkampff, E.; Crelier, G.; Khasheei, A.; Schnackenburg, B.; Berger, F.; Kuehne, T. Flow-sensitive four-dimensional cine magnetic resonance imaging for offline blood flow quantification in multiple vessels: A validation study. J. Magn. Reson. Imaging 2010, 32, 677–683. [Google Scholar] [CrossRef] [PubMed]
- Barker, A.J.; Roldán-Alzate, A.; Entezari, P.; Shah, S.J.; Chesler, N.C.; Wieben, O.; Markl, M.; Francois, C.J. Four-dimensional flow assessment of pulmonary artery flow and wall shear stress in adult pulmonary arterial hypertension: Results from two institutions. Magn. Reson. Med. 2015, 73, 1904–1913. [Google Scholar] [CrossRef] [Green Version]
- Schäfer, M.; Barker, A.J.; Kheyfets, V.; Stenmark, K.R.; Crapo, J.; Yeager, M.E.; Truong, U.; Buckner, J.K.; Fenster, B.E.; Hunter, K.S. Helicity and vorticity of pulmonary arterial flow in patients with pulmonary hypertension: Quantitative analysis of flow formations. J. Am. Hear. Assoc. 2017, 6. [Google Scholar] [CrossRef] [Green Version]
- Tang, B.T.; Pickard, S.S.; Chan, F.P.; Tsao, P.S.; Taylor, C.A.; Feinstein, J.A. Wall shear stress is decreased in the pulmonary arteries of patients with pulmonary arterial hypertension: An image-based, computational fluid dynamics study. Pulm. Circ. 2012, 2, 470–476. [Google Scholar] [CrossRef] [Green Version]
- Boerrigter, B.; Mauritz, G.-J.; Marcus, J.T.; Helderman, F.; Postmus, P.; Westerhof, N.; Vonk-Noordegraaf, A. Progressive dilatation of the main pulmonary artery is a characteristic of pulmonary arterial hypertension and is not related to changes in pressure. Chest 2010, 138, 1395–1401. [Google Scholar] [CrossRef]
- Kramer, C.M.; Barkhausen, J.; Bucciarelli-Ducci, C.; Flamm, S.D.; Kim, R.J.; Nagel, E. Standardized cardiovascular magnetic resonance imaging (CMR) protocols: 2020 update. J. Cardiovasc. Magn. Reson. 2020, 22, 17. [Google Scholar] [CrossRef]
- Garcia, J.; Sheitt, H.; Bristow, M.S.; Lydell, C.; Howarth, A.G.; Heydari, B.; Prato, F.S.; Drangova, M.; Thornhill, R.E.; Nery, P.; et al. Left atrial vortex size and velocity distributions by 4D flow MRI in patients with paroxysmal atrial fibrillation: Associations with age and CHA 2 DS 2 -VASc risk score. J. Magn. Reson. Imaging 2020, 51, 871–884. [Google Scholar] [CrossRef]
- Garcia, J.; Beckie, K.; Hassanabad, A.F.; Sojoudi, A.; White, J.A. Aortic and mitral flow quantification using dynamic valve tracking and machine learning: Prospective study assessing static and dynamic plane repeatability, variability and agreement. JRSM Cardiovasc. Dis. 2021, 10. [Google Scholar] [CrossRef]
- Geeraert, P.; Jamalidinan, F.; Hassanabad, A.F.; Sojoudi, A.; Bristow, M.; Lydell, C.; Fedak, P.W.M.; White, J.A.; Garcia, J. Bicuspid aortic valve disease is associated with abnormal wall shear stress, viscous energy loss, and pressure drop within the ascending thoracic aorta. Medicine 2021, 100, e26518. [Google Scholar] [CrossRef] [PubMed]
- Geeraert, P.; Jamalidinan, F.; Burns, F.; Jarvis, K.; Bristow, M.S.; Lydell, C.; Tobon, S.S.H.; Alonso, B.d.C.; Fedak, P.W.M.; White, J.A.; et al. Hemodynamic assessment in bicuspid aortic valve disease and aortic dilation: New insights from voxel-by-voxel analysis of reverse flow, stasis, and energetics. Front. Bioeng. Biotechnol. 2022, 9, 725113. [Google Scholar] [CrossRef] [PubMed]
- Hassanabad, A.F.; Burns, F.; Bristow, M.S.; Lydell, C.; Howarth, A.G.; Heydari, B.; Gao, X.; Fedak, P.W.; White, J.A.; Garcia, J. Pressure drop mapping using 4D flow MRI in patients with bicuspid aortic valve disease: A novel marker of valvular obstruction. Magn. Reson. Imaging 2020, 65, 175–182. [Google Scholar] [CrossRef]
- Rose, M.J.; Jarvis, K.; Chowdhary, V.; Barker, A.J.; Allen, B.D.; Robinson, J.D.; Markl, M.; Rigsby, C.; Schnell, S. Efficient method for volumetric assessment of peak blood flow velocity using 4D flow MRI. J. Magn. Reson. Imaging 2016, 44, 1673–1682. [Google Scholar] [CrossRef] [PubMed] [Green Version]
- Ooij, P.v.; Garcia, J.; Potters, W.V.; Malaisrie, S.C.; Collins, J.D.; Carr, J.C.; Markl, M.; Barker, A.J. Age-related changes in aortic 3D blood flow velocities and wall shear stress: Implications for the identification of altered hemodynamics in patients with aortic valve disease. J. Magn. Reson. Imaging 2016, 43, 1239–1249. [Google Scholar] [CrossRef] [PubMed]
- Potters, W.V.; Ooij, P.v.; Marquering, H.; vanBavel, E.; Nederveen, A.J. Volumetric arterial wall shear stress calculation based on cine phase contrast MRI. J. Magn. Reson. Imaging 2015, 41, 505–516. [Google Scholar] [CrossRef] [PubMed]
- Barker, A.J.; Ooij, P.v.; Bandi, K.; Garcia, J.; Albaghdadi, M.; McCarthy, P.; Bonow, R.O.; Carr, J.; Collins, J.; Malaisrie, S.C.; et al. Viscous energy loss in the presence of abnormal aortic flow. Magn. Reson. Med. 2014, 72, 620–628. [Google Scholar] [CrossRef] [Green Version]
- Kroeger, J.R.; Stackl, M.; Weiss, K.; Baeßler, B.; Gerhardt, F.; Rosenkranz, S.; Maintz, D.; Giese, D.; Bunck, A.C. K-t accelerated multi-VENC 4D flow MRI improves vortex assessment in pulmonary hypertension. Eur. J. Radiol. 2021, 145, 110035. [Google Scholar] [CrossRef]
- Han, Q.J.; Witsche, W.R.T.; Fang-Yen, C.M.; Arkles, J.S.; Barker, A.J.; Forfia, P.R.; Han, Y. Altered right ventricular kinetic energy work density and viscous energy dissipation in patients with pulmonary arterial hypertension: A pilot study using 4D flow MRI. PLoS ONE 2015, 10, e0138365. [Google Scholar] [CrossRef] [Green Version]
- Helderman, F.; Maurit, G.-J.; Andringa, K.E.; Vonk-Noordegraaf, A.; Marcus, J.T. Early onset of retrograde flow in the main pulmonary artery is a characteristic of pulmonary arterial hypertension. J. Magn. Reson. Imaging 2011, 33, 1362–1368. [Google Scholar] [CrossRef] [PubMed]
- Kondo, C.; Caputo, G.R.; Masui, T.; Foster, E.; O’Sullivan, M.; Stulbarg, M.S.; Golden, J.; Catterjee, K.; Higgins, C.B. Pulmonary hypertension: Pulmonary flow quantification and flow profile analysis with velocity-encoded cine MR imaging. Radiology 1992, 183, 751–758. [Google Scholar] [CrossRef]
- Burger, I.A.; Husmann, L.; Herzog, B.A.; Buechel, R.R.; Pazhenkottil, A.P.; Ghadri, J.R.; Nkoulou, R.N.; Jenni, R.; Russi, E.W.; Kaufmann, P.A. Main pulmonary artery diameter from attenuation correction CT scans in cardiac SPECT accurately predicts pulmonary hypertension. J. Nucl. Cardiol. 2011, 18, 634–641. [Google Scholar] [CrossRef] [Green Version]
- Lange, T.J.; Bornia, C.; Stiefel, J.L.; Stroszczynski, C.; Arzt, M.; Pfeifer, M.; Hamer, O.W. Increased pulmonary artery diameter on chest computed tomography can predict borderline pulmonary hypertension. Pulm. Circ. 2013, 3, 363–368. [Google Scholar] [CrossRef] [Green Version]
- Badagliacca, R.; Poscia, R.; Pezzuto, B.; Papa, S.; Nona, A.; Mancone, M.; Mezzapesa, M.; Nocioni, M.; Sciomer, S.; Valli, G.; et al. Pulmonary arterial dilatation in pulmonary hypertension: Prevalence and prognostic relevance. Cardiology 2012, 121, 76–82. [Google Scholar] [CrossRef] [PubMed]


Publisher’s Note: MDPI stays neutral with regard to jurisdictional claims in published maps and institutional affiliations. |
© 2022 by the authors. Licensee MDPI, Basel, Switzerland. This article is an open access article distributed under the terms and conditions of the Creative Commons Attribution (CC BY) license (https://creativecommons.org/licenses/by/4.0/).