Article

The Effect of Vapor Pressure Deficit Regulation on the Growth of Tomato Plants Grown in Different Planting Environments

Department of Software Engineering, Jeonbuk National University, Jeonju 54896, Korea
*
Author to whom correspondence should be addressed.
Appl. Sci. 2022, 12(7), 3667; https://doi.org/10.3390/app12073667
Submission received: 20 February 2022 / Revised: 2 April 2022 / Accepted: 4 April 2022 / Published: 6 April 2022
(This article belongs to the Section Agricultural Science and Technology)

Abstract

:
Vapor pressure deficit (VPD) has been identified as an increasingly important driver of plant functioning, and thus VPD regulation has been widely recognized as having the potential to improve plant growth and productivity. We monitored the trend of the VPD and observed the effect of VPD regulation by irrigating the water using VPD control equipment that automatically inserts fogging water when the VPD exceeds 1.2 kPa. Tomato crops were planted in soil, coconut fiber, and soil above poly vinyl chloride trays to observe the effectiveness of VPD regulation and the planting environment. As a result, there was no significant difference in the effect of VPD regulation on the overall growth stages of tomato crops whether they grew in soil, trays with soil, or trays with coconut fiber. However, in the case of crops grown in a tray with coconut fiber, the initial growth was similar, but the total yield and total commercial yield showed approximately 89% and 88% improvement, respectively. The number of total fruits was also improved by 49% on average.

1. Introduction

Research is being carried out on the use of modern technologies for agriculture, and advances are being made in this field [1]. Vapor pressure deficit (VPD) has been identified as an increasingly important driver of plant functioning [2], because VPD affects plant transpiration rates, which are closely related to the water condition of a plant. If the VPD is high, meaning high transpiration, it pulls water that contains the nutrients required for plants. This would cause plant metabolism to accelerate, furthering development. If the VPD is low, the opposite occurs. Thus, VPD regulation has been widely recognized as having the potential to improve plant growth and productivity.
SVP = 0.6108   exp ( 17.27 T T + 237.3 )
VPD is the difference, i.e., the deficit, between the amount of moisture in the air and how much moisture the air can hold when it is saturated. The atmosphere can hold only a certain amount of water vapor at a specific temperature, and the maximum amount of water vapor that can be held at a specific temperature is called the saturation vapor pressure (SVP). The SVP is determined by the air temperature (T). The value of the SVP at air temperature can be calculated by Equation (1).
When the temperature of the atmosphere increases, the SVP increases, and when the temperature decreases, the SVP decreases. Because it increases or decreases non-linearly, the mean SVP at the mean daily maximum and minimum air temperatures is used for a given period. The actual amount of water vapor held at the current temperature is called the active vapor pressure (AVP). The value of the AVP for a given relative humidity ( RH ) is determined by Equation (2) [3].
AVP = SVP RH 100
The VPD can be obtained simply using the SVP and AVP with Equation (3).
VPD = SVP AVP
J. C. Bakker [4] reported that most plants grow well at a VPD between 0.5 and 0.8 kPa (kilopascals). According to the guidance offered by [5], the optimum range of VPD for plants is around 0.5 to 1.2 kPa. However, the recommended levels of VPD differ from the growth stages of a plant [6]. For example, research recommends 0.8 kPa as an ideal VPD for clones, around 1.0 kPa for the vegetative stage, and around 1.2 to 1.5 kPa for the flower stage. A very high VPD of 2.2 kPa could cause plant stress and fruit cracking in tomato crops [7]. Studies on VPD have empirically observed the impacts of a high or low VPD on the physiological responses of plants [4,8,9,10].
There is an uncertainty associated with VPD impacts on crops because of the difficulty in disentangling VPD effects from other climate parameters such as radiation, temperature, and atmospheric CO2 concentrations [11]. For example, responses of stomatal conductance to high-VPD conditions generally follow an exponential decrease [12]. However, a high VPD accompanies high radiation, and the leaf-level stomatal conductance of individual plants is sensitive to variation in radiation and temperature [13]. This makes it difficult to untangle their relative effects on crops. While some effects may be explained by a high VPD, others may be partially explained by high radiation. High humidity, i.e., a low VPD, reduces transpiration, growth, and photosynthesis [11]. However, because the water retention on the leaf surface can impair stomatal functioning, not all effects can be explained with a reduced VPD [14]. Therefore, these recommendations can be coordinated in accordance with diverse species and environmental factors under the careful observation of crop growth.
The VPD can be adjusted through temperature, humidity, and light intensity. Modern technologies have been used for regulating the VPD [15,16,17]. Increasing temperature, decreasing humidity, and increasing light intensity increase the VPD, while vice versa, they decrease the VPD. Adjusting the temperature and light intensity can consume a considerable amount of energy, while adjusting the humidity consumes relatively little energy. Additionally, there is a solution based on water vaporization under high pressure, but this solution has a risk of infection because the vapor condenses on the leaf [18].
However, to our knowledge, there is a report studying the effects of a fluctuating VPD condition on plant growth performance [19]. The report examined the effects of VPD fluctuation on the plant growth in lettuce. There have been reports studying the relationships between the VPD condition and the growth performance of a plant. The VPD condition affects the soil moisture regime, and the soil moisture regime is linked to the leaf water potential and plant growth [11]. There are reports considering the relationships among the VPD condition, soil water availability, and growth performance [14,20]. The growing medium holds water and nutrients and provides a zone for gaseous exchange and anchorage for plant roots. There is research on the relationships between the growing medium and growth performance [21,22,23,24]. These studies examined the condition of the soil water content when polymer [21] or differently treated soils [22,23,24] were used as growing media. The growing medium does not affect the VPD condition, but it affects the growing conditions. As the VPD condition affects the growing conditions, the growing medium can be related to the effects of VPD regulation. Therefore, it is necessary to deeply explore the effects. In this paper, we monitored the trend of the VPD and observed the effect of VPD regulation by irrigating the water using VPD control equipment that automatically inserts fogging water when the VPD deviates from the recommended range. To observe the effectiveness of VPD regulation depending on the growing medium, tomato crops were planted in three different growing media, i.e., soil, soil above poly vinyl chloride (PVC) trays, and coconut fiber above PVC trays.
Our hypotheses are that, in these conditions, VPD regulation improves the growth performance of tomato crops, and the improvements are relevant to the growing media. The first hypothesis of our study is “H1. VPD regulation influences crop growth performance”, and the second hypothesis is “H2. The growing medium influences the effect of VPD regulation.” The objective of this paper was to observe any significant variation in the growth parameters and yields of tomato crops grown in different growing media.

2. Materials and Methods

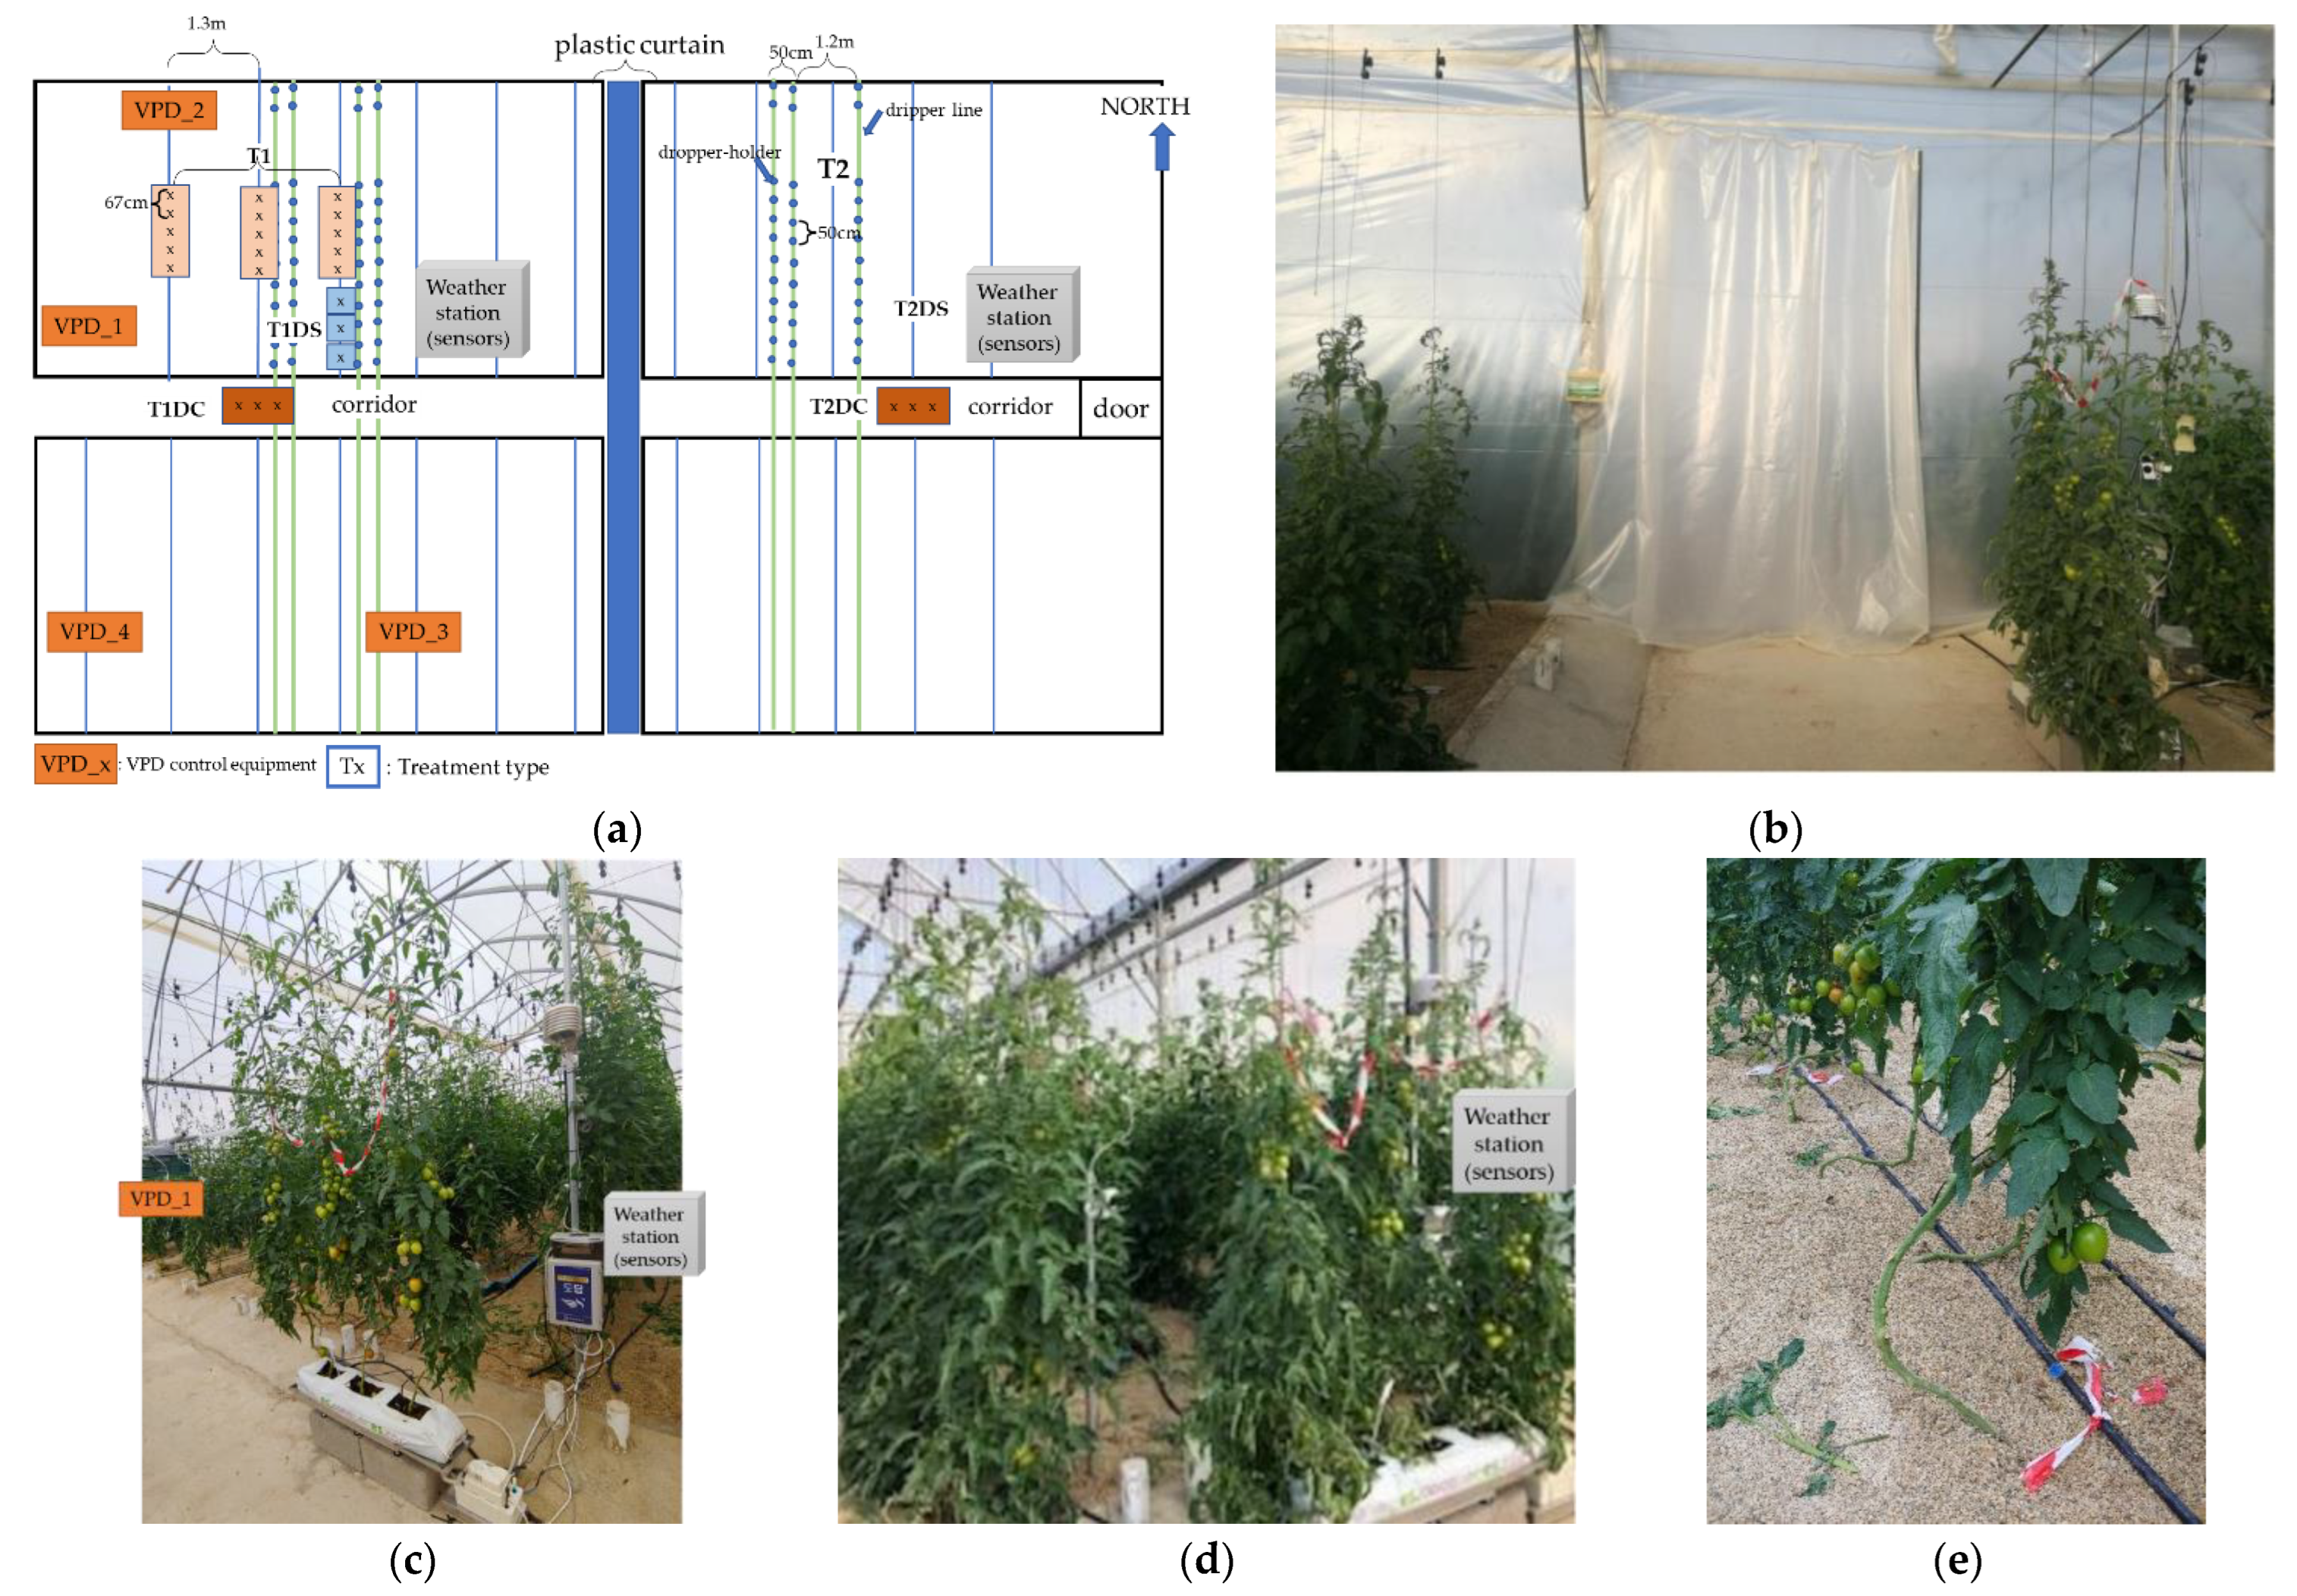
2.1. Location and Facilities

This trial was carried out in the Experimental Centre of the National Technological Centre of the Auxiliary Industry of Agriculture, Tecnova Foundation, located at the Majada Ortigas Site (36°53′ N; 2°22′ W, 184 m elevation above sea level), in the Municipal District of Viator, in the province of Almeria, in the southeast of Spain. The trial was carried out during an autumn–winter crop cycle in which the climatic conditions were the usual ones in the southeast of Spain, with values of the air temperature close to 18 °C from the beginning of the trial until the month of November and almost with the absence of cloudy days [25].
The execution of this trial was carried out in a multi-span greenhouse of 1.344 m2 in total area. The structure of this greenhouse was made with galvanized steel pipes and wires, with lateral and central enclosures made with flexible plastic covers, with a height of 6.5 m in the ridge, 4.5 m in the gutter, and 4 m in the grid. The lateral and upper windows were automatically controlled with a climatic control system.
The soil of this greenhouse was an imported soil with three different layers: a heavy imported soil of 20 cm depth placed over the original soil of the Experimental Centre, covered with a layer of manure of 3 cm depth, and covered with an upper sand layer of 10 cm depth used as mulch.
The irrigation and fertilization of the crop were carried out using a drip irrigation system, with paired rows of dripper lines located at a distance of 1.2 m between pairs of lines and 0.5 m between two dropper holder branches that are part of the same pair of lines, and with the emitters within the same dropper holder branch located every 50 cm. The installation of the drip irrigation system had self-compensating drippers with a unit flow of 3 L per hour. The fertigation system used in this experiment was controlled automatically with an irrigation unit provided with a programmer and six tanks of concentrated nutrient solution.
Fogging water was supplied with a particle size of 8 μm and water supply pressure of 0.2–3.0 bar between 10 a.m. and 4 p.m. when the VPD exceeded 1.2 kPa, so the VPD values were controlled not to exceed 1.2 kPa during that period. In addition to VPD regulation through the fogging water supply, other cultivation conditions such as the composition of the nutrient solution and the root zone environment in all treatments were carried out in the same manner. In addition, the VPD was artificially lowered through a consistent fogging water supply to the experimental environment without considering the recommended VPD values for each crop growth stage mentioned above.

2.2. Cultivation Environment Settings

The cultivated area of the greenhouse was divided into two different zones: east and west areas. Four VPD control instruments were installed in the western area of the greenhouse, i.e., two in the north zone of the greenhouse and two in the south zone. The effects of VPD regulation on tomato growth and productivity were examined with three different treatments, named T1, T1DS, and T1DC, grown in a different growing medium with the same VPD regulation condition. Treatment T1 consisted of fifteen tomato crops developed in soil. The treatment developed in the soil (T1DS) above one PVC tray had three different pots and one tomato plant per pot. The treatment developed in coconut fiber substrate (T1DC) located above one weight tray had one bag of coconut fiber and three different tomato plants.
No VPD control equipment was installed in the east area of the greenhouse, and three different treatments were evaluated in the eastern area of the greenhouse, named T2, T2DS, and T2DC. All conditions except for VPD regulation were the same as those for the treatments with VPD control equipment. Table 1 summarizes the six treatments.
Figure 1a schematically shows the spatial distribution of the different areas and treatments inside of the greenhouse in which this trial was carried out. As shown in Figure 1b, each area (eastern and western) was separated from the other by a plastic curtain that was installed during week 37. Figure 1c,d show the settings and crops of each area, and Figure 1d is a view of the installed dripper lines.

2.3. Sensor Installation

Two weather stations were installed inside the greenhouse: one station was installed in the west area of the greenhouse provided with four VPD control instruments, and the other station was installed in the east area of the greenhouse without the installation of any VPD control equipment (see Figure 1a). Here, the VPD control equipment was an instrument that automatically inserted fogging water for regulating the VPD. Each weather station had sensors to measure different parameters inside the greenhouse such as the air temperature, air relative humidity, carbon dioxide concentration in the air, and incident radiation above the crop. These sensors were programmed to measure data every minute and to estimate average data every 20 min. The data measured with the installed sensors were collected and reviewed weekly, to check their behavior and to elaborate a weekly report describing the data measured and the behavior of the sensors. The collected data were sent to the monitoring platform of the Smart Software Lab. Inc. [26].
During the period of the field trial in the summer and autumn seasons, the VPD control equipment was turned on during the hottest hours of the day, and it was turned off during the wet hours of the day. During the winter season, when the relative humidity of the air reached high values, the VPD control equipment was turned off all day. Tecnova technicians turned off the VPD control equipment to avoid the incidence of the fungal disease Botrytis cinerea in the tomato crops (the establishment of this disease in tomato crops is higher with high-relative-humidity conditions in the air).

2.4. Tomato Crop Management

The field trial was developed during a long cycle of tomato crops (six months in duration). The tomato crops, variety ‘Caniles’, were transplanted on 22 August 2018 with more than 30 days since their germination in the nursery, and with at least three developed leaves per plant. The plant density used was 1.5 plant m−2. During this trial, the tomato crops were guided using a black polypropylene cord vertically joined to the wire structure of the greenhouse. The duration of the crop cycle was 184 days, and the tomato crops were removed on 22 February 2019. The composition of the nutrient solution applied to the tomato crops in most of the trials is indicated in Table 2.
The amount of applied fertilizers was estimated from data of the volume of the nutrient solution applied in each irrigation episode and the concentration of anions and cations in the applied nutrient solution. For this purpose, a sample of the nutrient solution applied by the drip irrigation system was collected in each experimental treatment, three times during the cropping cycle (during the vegetative growth period, during the fruit development period, and during the fruit maturity period). The volume of the nutrient solution and the amount of mineral fertilizers applied to the tomato crops during this trial were the same for all treatments.
Figure 2a shows the total volume of the nutrient solution applied during the trial during the three different periods of the cropping cycle. Figure 2b shows the results of the composition of the nutrient solution that was applied to the tomato crops during this trial: macronutrient content and physical-chemical parameters (Figure 2c). The sample of the nutrient solution was taken at three moments of the trial (during the vegetative growth period (27 DAT), during the fruit development period (83 DAT), and during the fruit maturity period (141 DAT)).
The evolution of the air temperature inside the greenhouse during the field trial is shown in Figure 3a. The minimum air temperature measured during the field trial ranged between 4.7 and 14.6 °C, with an average value of the minimum air temperature of 7.8 °C for the period of study. The maximum air temperature measured during the field trial ranged between 26.0 and 41.5 °C, with an average value of the maximum air temperature of 30.5 °C for the period of study. The medium air temperature measured ranged between 13.3 and 25.1 °C, with an average value of 17.4 °C.
The evolution of the air relative humidity inside the greenhouse during the field trial is shown in Figure 3b. The minimum air relative humidity measured during the field trial ranged between 23.0% and 56.0%, with an average value of the minimum air relative humidity of 42.6% during the period of study. The maximum air relative humidity measured during the field trial ranged between 84.0% and 100%, with an average value of the maximum air relative humidity of 94.6% for the period of study. The medium air relative humidity measured ranged between 51.4% and 94.5%, with an average value of 79.7%.
Figure 3c–e show the evolutions of the illumination, air CO2 concentration, and air VPD condition. All values were maintained with similar trends. In particular, the VPD values during the field trial were controlled during the period when the values exceeded the recommended range. The yellow box of Figure 3e shows the recommended range. The graph in Figure 3e shows that the VPD values rose since around 10 a.m. local time in Spain, but the values gradually fell after the operation of the VPD control equipment.

2.5. Data Collection from Field Trials

Along with the collected data from the installed sensors, we collected data from each treatment as follows:
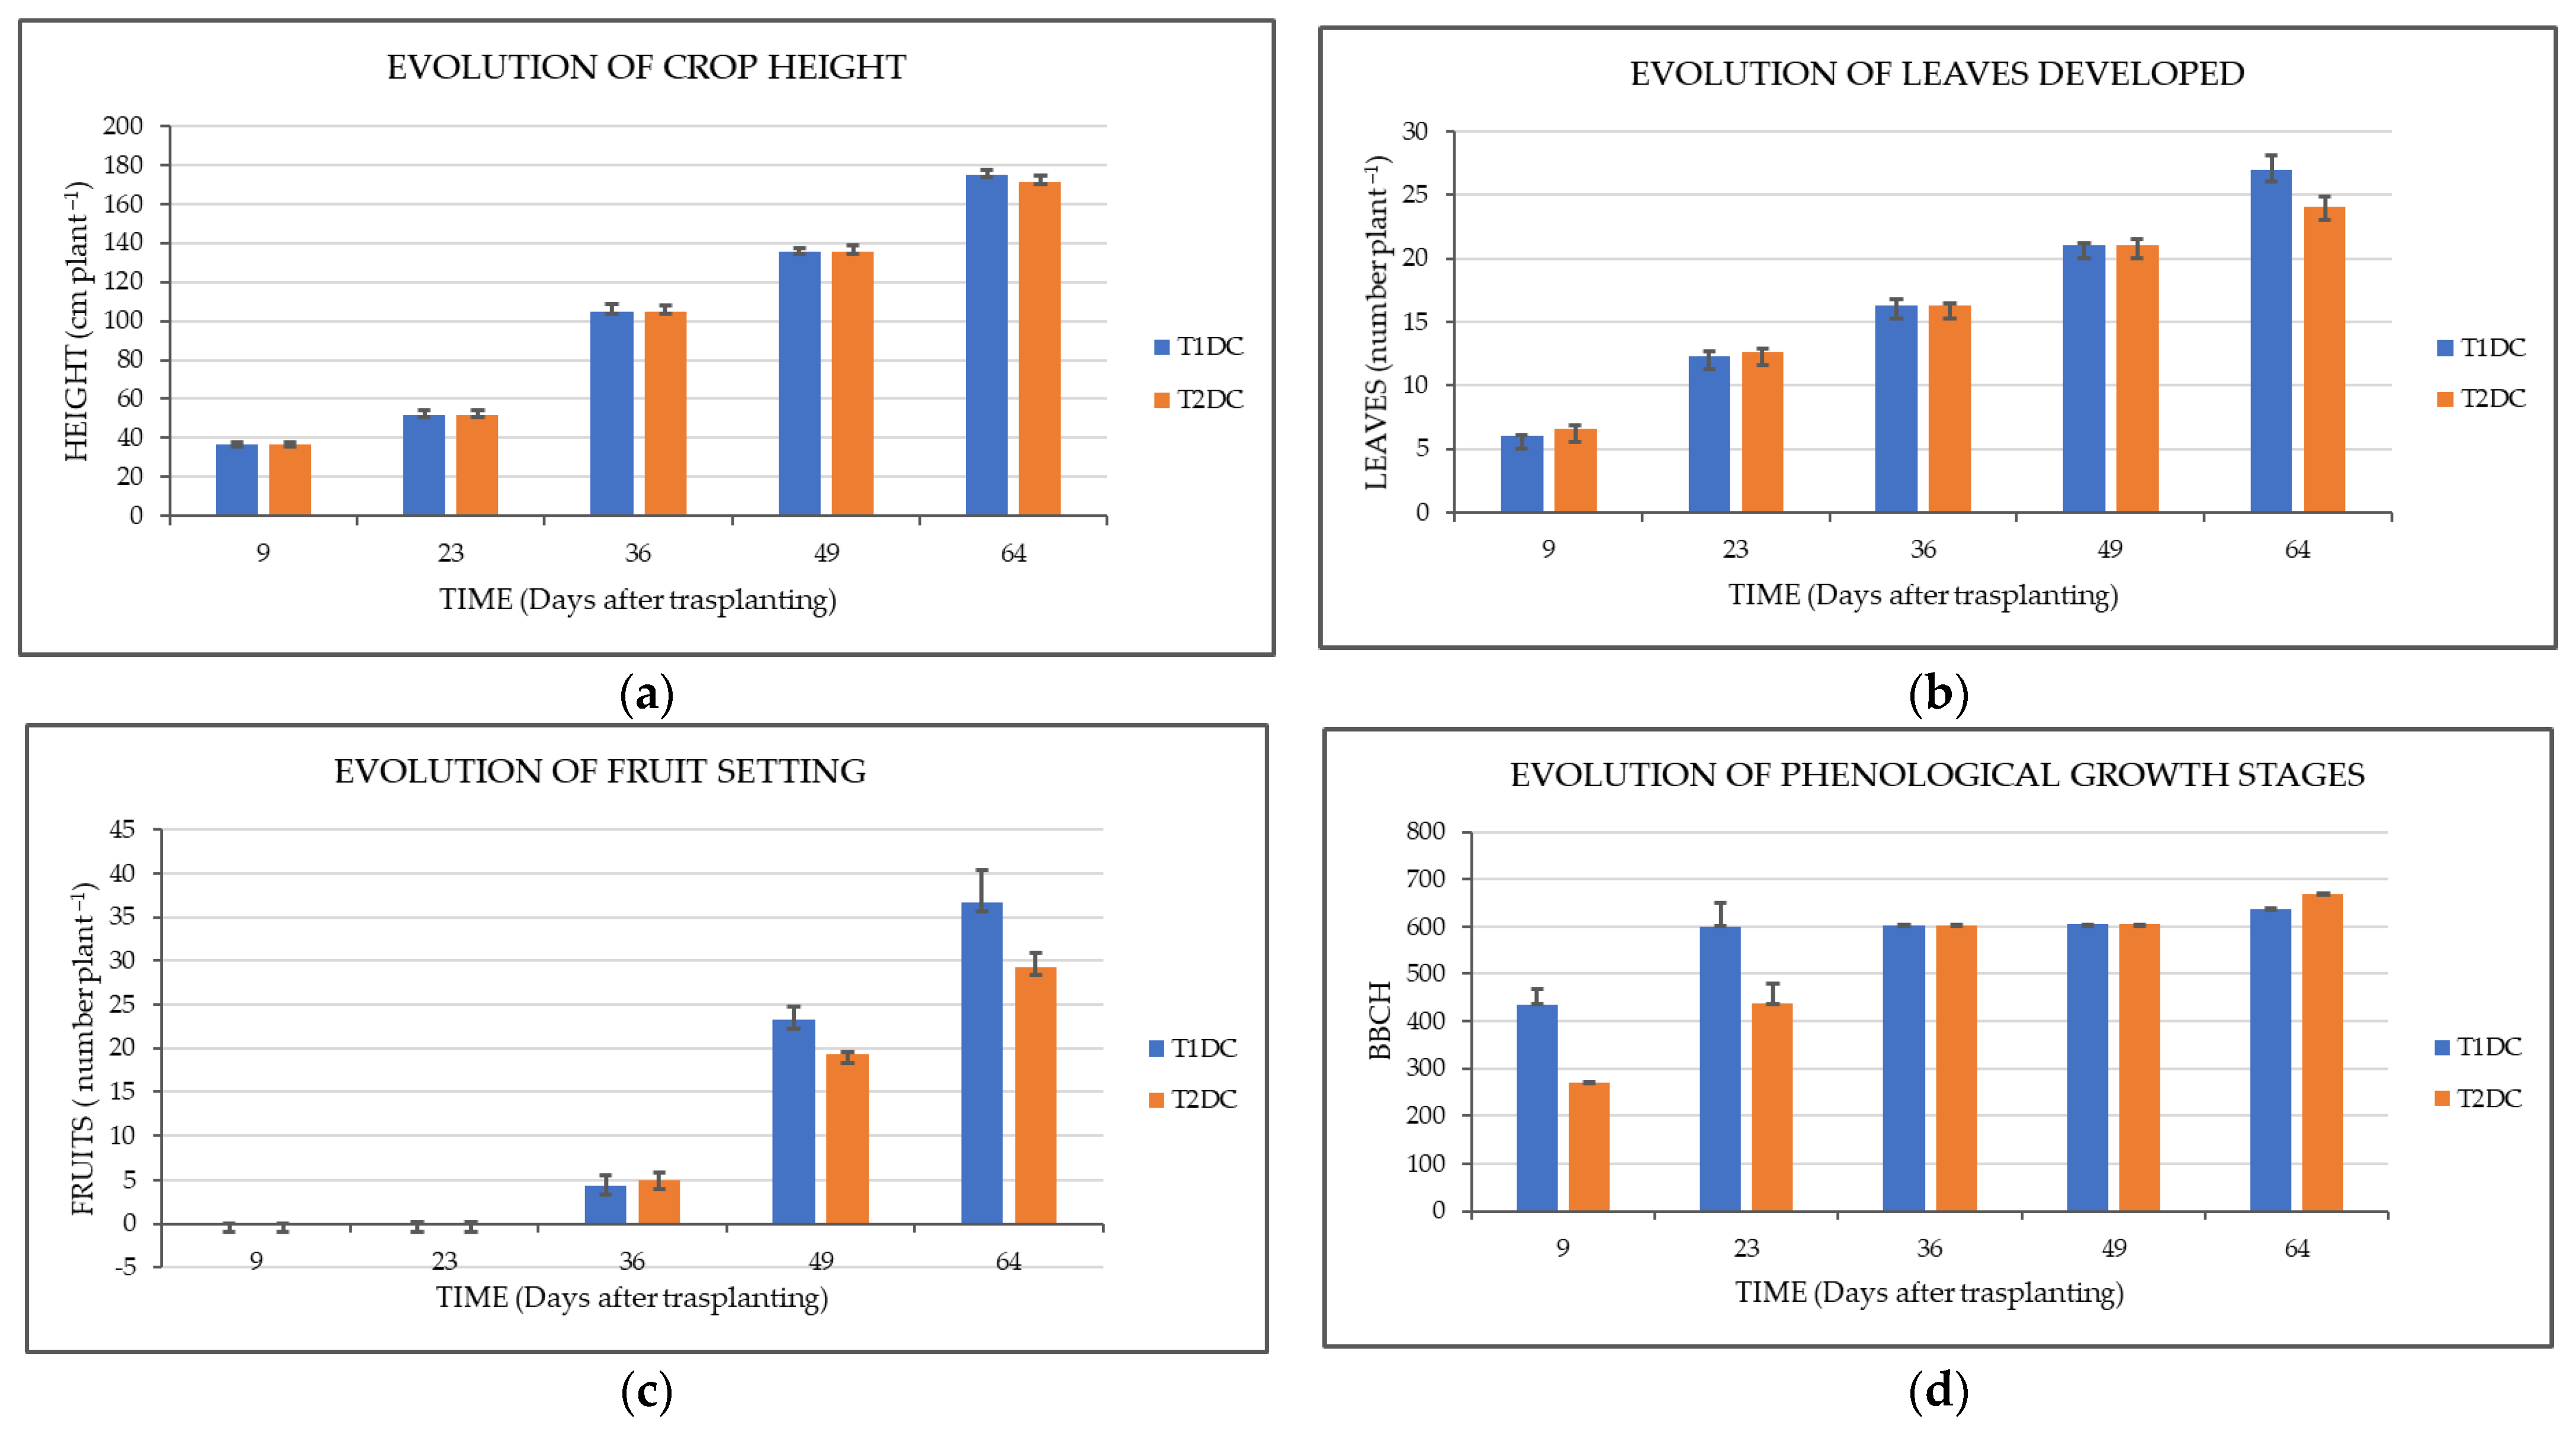
  • Growth parameters: From the transplant of the crops with a biweekly frequency, four characterizations of the following growth parameters of the crops were carried out: phenological index (BBCH index), crop height, number of expanded leaves developed per plant, and number of tomato fruits produced per plant. These characterizations were carried out on each of the plants of the treatments and at five different moments of the tomato crop cycle 9, 23, 36, 49, and 64 days after transplanting the crops in the greenhouse. The growth parameters were measured only up to the moment of 64 days during the vegetative growth phase.
  • Yield: The production of tomato fruits was characterized in every harvesting episode developed during the trial. A total of 19 harvesting episodes were developed during the field trial. The fresh weight and the number of harvested fruits were characterized as commercial and non-commercial fruits. The commercial tomato fruits were classified into commercial categories based on their diameter.
  • Qualitative characteristics: A composite sample consisting of six mature tomato fruits was taken from each of the experimental treatments. The six fruits of each composite sample were used to prepare a homogeneous sample in which the following quality parameters were characterized: fresh weight, diameter, hardness, and sugar content. The sugar content in fruits was measured by refractometry with the use of a portable refractometer (model PAL-1, Atago, Tokyo, Japan). The hardness was measured using a portable durometer (model 53215TP, Turoni, Forli, Italy). The color was measured using a portable colorimeter (model CR-400, Konica Minolta, Japan) to measure the three dimensions of the color space by means of the coordinates L*, a*, and b*.

2.6. Statistical Analysis

A statistical study of variance analysis was carried out to determine if there were statistically significant differences between the average values of the parameters characterized during this trial. A t-test was used to determine the difference between groups with and without VPD regulation. ANOVA was used to examine the difference between independent groups using different growing media. The results were evaluated with a confidence level of 95%. Statgraphics Centurion XV [27] was used to perform this statistical procedure.

3. Results and Discussion

3.1. Effect of VPD Regulation on Tomato Crops in Soil

To investigate the effect of VPD control on the growth and yield grown in soil, we measured the evolution of the fifteen different crops of this treatment. The values of the growth parameters are the average values of all crops, and the yields are the accumulated number of all crops.

3.1.1. Effect of VPD Regulation on Growth

Among the results for the experimental treatments T1 and T2 shown in Figure 3, Figure 3a shows the average values of the evolution of the tomato crop height characterized during the vegetative growth phase. The height of the tomato crops increased progressively during the vegetative growth phase in all the experimental treatments evaluated, without finding, in a general way, statistically significant differences between the experimental treatments T1 and T2 throughout the study period. Statistically significant differences were only found between treatments at two moments of the field trial: 23 and 49 days after transplanting the tomato crops.
Figure 4b shows the average values of the evolution of the number of leaves expanded per plant, characterized during the vegetative growth phase. The number of leaves expanded per plant increased progressively during the vegetative growth phase of the crops. In general, there were no statistically significant differences between the treatments in the number of leaves expanded per plant.
Figure 4c shows the average values of the evolution of the number of fruit settings per plant during the vegetative growth phase. The fruit setting increased continuously during the study period, without differences between treatments. Statistically significant differences were only found between treatments at one moment of the field trial: 64 days after transplanting the tomato crops, as the standard error bar of 64 days shows.
Finally, Figure 4d shows the average values of the evolution of the phenological growth stages per plant during the vegetative growth phase for each experimental treatment. The phenological growth increased continuously during the study period. In general, there were no statistically significant differences between the treatments in the phenological growth stages per plant.
Regarding H1 in this group, except for the phenological growth stages, the treatment results for the growth parameters had a normal distribution, and the p-values of the t-tests were greater than 0.05, so H1 for the growth parameters is not true.

3.1.2. Effect of VPD Regulation on Yield

Figure 5a shows the results of the yield evolution accumulated expressed as average values of the fresh weight of harvested fruits in each episode of fruit harvests and each evaluated experimental treatment of commercial and total fruit yield (commercial fruits + non-commercial fruits) harvested during the trial. In the same way, Figure 5b shows the results of the accumulated number of fruits produced (expressed as average values of the number of fruits harvested in each episode of multiple harvests of fruit and in each experimental treatment evaluated) from the commercial and total yields of fruits (commercial fruits + non-commercial fruits) obtained during the trial.
The accumulated total yield measured in treatment T2 was 13.4% higher on average than the accumulated total yield measured in treatment T1. The commercial yield measured in treatment T2 was 18.6% higher on average than the accumulated commercial yield measured in treatment T1. However, the number of total fruits measured in T1 was higher than that in T2. At the initial stage of harvest, the number of total fruits harvested in T1 was more than 100% higher than that in T2, but the gap between T1 and T2 decreased progressively from 89 days. This result agrees with the published observations of [28,29], who observed that a high humidity, which means a low VPD, produced smaller fruits and thereby a lower yield compared with a high VPD. Additionally, as the standard error bars in Figure 5a–c show, there were statistically significant differences. T2 was slightly better than T1 in the number of commercial fruits, but no significant difference was found.
The results measured for the four yield evolutions had a normal distribution, and the p-values of the t-tests were greater than 0.05, so there were no statistically significant differences between the two treatments. H1 for the yields is not true.

3.2. Effect of VPD Regulation on Tomato Crops in Soil above PVC Trays

To investigate the effect of VPD control when we developed crops in trays with soil, we performed the same measurements as in Section 3.1.

3.2.1. Effect of VPD Regulation on Growth

The results in Figure 6 show the effects of VPD regulation on crops developed in trays with soil, i.e., experimental treatments T1DS and T2DS. As depicted in Figure 6a, the crop height of T2DS increased progressively from 23 days after transplanting the crops, whereas the height of the crops of T1DS did not increase at the third moment of the crop cycle: 36 days after transplanting the crops. T1DS performed slightly better in crop height at the second moment of the crop cycle: 23 days after transplanting the crops.
In terms of the evolution of leaves developed, both treatments had similar patterns to the crop height observations, as described in Figure 6b. In two growth parameters, namely, crop height and leaves developed, observed 36 days after transplanting, the response to treatment T2DS was better than the response to treatment T1DS. As for the fruit setting of Figure 6c, T2DS showed better results than T1DS at all moments of the crop cycle.
Figure 6d shows that the phenological growth increased from 49 days after the transplant. There were no differences between treatments in the phenological growth stages between the two treatments, as the standard error bars show.
Regarding H1 in this group, the results measured for the four growth parameters had a normal distribution, and the p-values of the t-tests were greater than 0.05, so there were no statistically significant differences between the two treatments. H1 for the growth parameters in this group is not true.

3.2.2. Effect of VPD Regulation on Yield

As shown in Figure 7a,b,d, in this experiment, VPD regulation showed no significant differences in total yield, commercial yield, and the number of total commercial fruits. Considering the number of total fruits, T1DS improved plant performance from the first harvest to the end of the harvest, whereas the number of commercial fruits was similar in both treatments. However, the number of total fruits showed a better performance at all stages (see Figure 7c). The treatment with VPD regulation improved the number of total fruits by 51% on average.
The measurement results for the four yield evolutions of T1DS and T2DS had a normal distribution, and the p-values of the t-tests were greater than 0.05, so there were no statistically significant differences between the two treatments.

3.3. Effect of VPD Regulation on Tomato Crops in Coconut Fiber above PVC Trays

To investigate the effect of VPD control when we developed crops in coconut fiber located above one weight tray, we performed the same measurements as in Section 3.1.

3.3.1. Effect of VPD Regulation on Growth

As for the effect of VPD regulation on tomato crops grown in coconut fiber substrate, the treatment with VPD regulation was performed in the same way as the treatment without VPD regulation for all growth parameters. Figure 8 shows the results for the experimental treatments T1DC and T2DC in the four growth parameters. Compared with other treatments, VPD regulation in this treatment showed good performance in the evolution of crop height and the phenological growth stages. It showed rapid evolution at the early stage of the phenological growth stages but no significant differences at the late stage, as depicted in Figure 7d. Compared to crops grown in soil above a tray, the performance of fruit setting tended to be similar. However, as the standard error bars show, there were no statistically significant differences between the treatments.
As for H1 for this group, the results of the treatments measured for the four growth parameters had a normal distribution, and the p-values of the t-tests were greater than 0.05, so H1 is not true.

3.3.2. Effect of VPD Regulation on Yield

In this experiment, the yields and harvested fruits were improved, as shown in Figure 9. VPD regulation showed approximately 89% improvement in the total yield and 88% improvement in the total commercial yield. At 96, 139, 145, 152, 159, and 166 days after transplanting, the total yield of T1DC improved by more than 100%. The number of total fruits was also improved by 49% on average. The measurement results had a normal distribution, and the p-values of the t-tests for these three measurement results were less than 0.05, so the results are statistically significant. As for the number of total commercial fruits, the treatment without VPD regulation showed a better evolution until 89 days after transplanting, but the results were reversed from 103 days after transplanting. The treatment with VPD regulation improved the number of commercial fruits by 45% on average. However, the result was not statistically significant because the p-value of the t-test was greater than 0.05. H1 for the total yield, commercial yield, and total fruits is true, but false for commercial fruits.

3.4. Effect of Growing Media

We performed one-way ANOVA analysis for testing H2. For this test, we reorganized, merged, and rearranged the experiment results of T1, T1DS, and T1DC. We created new data tables by using collected values of growth parameters and yields from the three different growing media. The sample size of T1 was normalized to three crops by dividing all measured values by 5. An ANOVA test was performed to determine the influence of the three different growing media. As for the results, there were no statistically significant differences in the growth parameters. Thus, H2 for the growth parameters is not true. However, the analysis results for the yields (after 96 days) of the three groups show that the effects of growing media on yields were statistically significant because the p-values for the total yield, commercial yield, total fruits, and commercial fruits were less than 0.05. Thus, H2 is true only for the yield.

3.5. Qualitative Characteristics

On 18 December 2018, a composite sample consisting of six mature tomato fruits was taken from experimental treatments T1 and T2. The six fruits of each composite sample were measured to characterize the qualitative characteristics of fresh weight, diameter, hardness, and sugar content.
Figure 10 shows (a) the average values of the fresh weight, (b) the equatorial diameter, (c) the hardness, and (d) the sugar content of six commercial tomato fruits harvested by experimental treatments during the productive period (18 December 2018, 118 days after transplanting). The fresh weight of commercial fruits in T2 was higher, on average, by 24% than the fresh weight of commercial fruits in T1. As for the equatorial diameter of commercial fruits, fruits of T2 had a slightly higher diameter by 7% on average, while the hardness and sugar content of commercial fruits in T1 were slightly higher by 2% and 7%, respectively. The result for the equatorial diameter agrees with the observations of [28], but the results for the hardness and sugar contents of the fruits are the opposite of the results observed by [7,28].

4. Related Work

VPD affects five main aspects: (1) pore opening, (2) CO2 absorption, (3) transpiration, (4) nutrient intake at the roots, and (5) crop stress [4]. There is a complex trade-off between VPD and these factors. Plant transpiration is likely to be increased in high-VPD conditions [7]. Increasing the amount of CO2 absorbed by plants can reduce the amount of nutrients, and increasing the amount of nutrients can put more stress on plants. Therefore, to achieve the best results, it is necessary to find a suitable VPD point for the plant’s growth stage.
Research on the effect of a low or a high VPD has been performed [16,28]. The low VPD (from 0.15 to 0.65 kPa) with the high-humidity treatments produced smaller fruits and thereby a lower yield compared with the low-humidity treatments [28]. The high VPD (from 1.6 to 2.2 kPa) during the hottest periods with low humidity reduced the fruit yield and their uniformity [7].
Many studies have reported the results of coordination between these factors or the results of verifying theoretical hypotheses [5,20,21,22,23,24,25,26,27,28,29,30,31,32]. D. Zhang et al. [30] proposed a micro-fog system for regulating the VPD of a greenhouse. The system was installed during the summer season, and the experiments resulted in around a 12.3% increase in the marketable tomato yield per plant by regulating the VPD above 0.5 kPa. Since adjusting humidity can consume water, it is necessary to devise a water-saving plan to increase water productivity. D. Zhang et al. [5] investigated the effect of VPD regulation on water use efficiency. They reported that VPD regulation reduced the evaporative driving force for water movement and improved water use efficiency by reducing transpiration and improving photosynthesis. X.-C. Jiao et al. [31] explored the interaction of VPD and CO2 on plant water status, stomatal characteristics, and gas exchange parameters in summer greenhouses in a semi-arid area. They reported that reducing the VPD alleviated the water stress of the plant and increased the gas exchange area of the leaf, which was beneficial to the entry of CO2 into the leaf. The increase in CO2 resulted in promoting the photosynthetic rate and improving the water use efficiency and yield. J. López et al. [32] revealed the strong effects of an increased VPD on the traits and physiological variables affecting reproductive development and yield, which outline a potential mechanism for yield decreases.

5. Conclusions and Future Work

The four growth parameters evaluated in the three groups of treatments increased progressively and appropriately during the study period, without finding statistically significant differences between the treatments in the phenological stage, the height of the crops, the fruit setting, and the leaf development. However, the yield evolution and harvested fruits showed different results. As for crops developed in soil, the number of total harvested fruits in treatment T2 was 4.7% higher than the number of total harvested fruits in treatment T1. The number of commercial harvested fruits measured in treatment T2 was 13.5% higher than the number of commercial harvested fruits measured in treatment T1. Considering the results of VPD regulation on crops developed in trays with soil, both treatments, i.e., with and without VPD control, showed similar results in all observation aspects. Fruit setting in T1DS, a treatment developed in soil above a tray with VPD regulation, showed, on average, 51% better results than in T2DS, a treatment without VPD regulation. The results of VPD regulation on crops developed in coconut fiber substrate are quite interesting. Both the T1DC and T2DC treatments showed no significant differences in the four growth parameters, but the number of total yields, total commercial yields, and total fruits in treatment T1DC showed statistically significant differences. The analysis results for the yields of the three groups, i.e., T1, T1DC, and T1DS, show that the effects of growing media on yields are statistically significant. We cannot confirm that this result is due to VPD regulation because the experiments were carried out once. Thus, as our future work, we plan to conduct the experiment several times in order to assure the effects of VPD regulation on crops developed in trays with coconut fiber substrate.

Author Contributions

Conceptualization, methodology, software, validation, and investigation, H.N.; writing—original draft preparation, J.L.; writing—review and editing, H.N. All authors have read and agreed to the published version of the manuscript.

Funding

This research received no external funding.

Institutional Review Board Statement

Not applicable.

Informed Consent Statement

Not applicable.

Data Availability Statement

Not applicable.

Acknowledgments

The authors are grateful to the technical staff of the National Technological Centre of the Auxiliary Industry of Agriculture, TECNOVA Foundation.

Conflicts of Interest

The authors declare no conflict of interest.

References

  1. Iwaniak, A.; Janczukowicz, W.; Rodziewicz, J. New trends in environmental engineering, agriculture, food production, and analysis. Appl. Sci. 2021, 11, 2745. [Google Scholar] [CrossRef]
  2. Lawrence, M. The relationship between relative humidity and the dewpoint temperature in moist air: A simple conversion and applications. Bull. Am. Meteorol. Soc. 2005, 86, 225–234. [Google Scholar] [CrossRef]
  3. Richard, G.A.; Pereira, L.S.; Raes, D.; Smith, M. Crop Evapotranspiration—Guidelines for Computing Crop Water Requirements-FAO Irrigation and Drainage Paper 56; FAO: Rome, Italy, 1998. [Google Scholar]
  4. Bakker, J.C. Analysis of Humidity Effects on Growth and Production of Glasshouse Fruit Vegetables. Ph.D. Dissertation, Agricultural University, Wageningen, The Netherlands, 1991; p. 155. [Google Scholar]
  5. Zhang, D.; Du, Q.; Zhang, Z.; Jiao, X.; Song, X.; Li, J. Vapour pressure deficit control in relation to water transport and water productivity in greenhouse tomato production during summer. Sci. Rep. 2017, 7, 43461. [Google Scholar] [CrossRef] [PubMed]
  6. Wollaeger, H.; Runkle, E. Why Should Greenhouse Growers Pay Attention to Vapor Pressure Deficit and Not Relative Humidity? Michigan State. University and MSU Department of Horticulture. 2015. Available online: https://www.canr.msu.edu/news/why_should_greenhouse_growers_pay_attention_to_vapor_pressure_deficit_and_n (accessed on 23 December 2021).
  7. Leonardi, C.; Guichard, S.; Bertin, N. High vapour pressure deficit influences growth, transpiration and quality of tomato fruits. Sci. Hortic. 2000, 84, 285–296. [Google Scholar] [CrossRef]
  8. Leuschner, C. Air humidity as an ecological factor for woodland herbs: Leaf water status, nutrient uptake, leaf anatomy, and productivity of eight species grown at low or high vpd levels. Flora 2002, 197, 262–274. [Google Scholar] [CrossRef]
  9. Gholipoor, M.; Prasad, P.V.V.; Mutava, R.N.; Sinclair, T.R. Genetic variability of transpiration response to vapor pressure deficit among sorghum genotypes. Field Crops Res. 2010, 119, 85–90. [Google Scholar] [CrossRef]
  10. Sinclair, T.R.; Devi, J.; Shekoofa, A.; Choudhary, S.; Sadok, W.; Vadez, V. Limited-transpiration response to high vapor pressure deficit in crop species. Plant Sci. 2017, 260, 109–118. [Google Scholar] [CrossRef]
  11. Grossiord, C.; Buckley, T.N.; Cernusak, L.A.; Novick, K.A.; Poulter, B.; Siegwolf, R.T.W.; Sperry, J.S.; McDowell, N.G. Plant responses to rising vapor pressure deficit. New Phytol. 2020, 226, 1550–1566. [Google Scholar] [CrossRef] [Green Version]
  12. Oren, R.; Sperry, J.S.; Katul, G.G.; Pataki, D.E.; Ewers, B.E.; Phillips, N.; Schäfer, K.V.R. Survey and synthesis of intra- and interspecific variation in stomatal sensitivity to vapour pressure deficit. Plant Cell Environ. 1999, 22, 1515–1526. [Google Scholar] [CrossRef] [Green Version]
  13. Novick, K.A.; Ficklin, D.L.; Stoy, P.C.; Williams, C.A.; Bohrer, G.; Oishi, A.C.; Papuga, S.A.; Blanken, P.D.; Noormets, A.; Sulman, B.N.; et al. The increasing importance of atmospheric demand for ecosystem water and carbon fluxes. Nat. Clim. Chang. 2016, 6, 1023–1027. [Google Scholar] [CrossRef] [Green Version]
  14. Novick, K.A.; Konings, A.G.; Gentine, P. Beyond soil water potential: An expanded view on isohydricity including land–atmosphere interactions and phenology. Plant Cell Environ. 2019, 42, 1802–1815. [Google Scholar] [CrossRef] [PubMed]
  15. Harmanto, S.V.M.; Babel, M.S.; Tantau, H.J. Water requirement of drip irrigated tomatoes grown in greenhouse in tropical environment. Agric. Water Manag. 2005, 71, 225–242. [Google Scholar] [CrossRef]
  16. Lu, N.; Nukaya, T.; Kamimura, T.; Zhang, D.; Kurimoto, I.; Takagaki, M. Control of vapor pressure deficit (VPD) in greenhouse enhanced tomato growth and productivity during the winter season. Sci. Hortic. 2015, 197, 17–23. [Google Scholar] [CrossRef]
  17. Aljubury, I.M.A.; Ridha, H.D.A. Enhancement of evaporative cooling system in a greenhouse using geothermal energy. Renew. Energy 2017, 111, 321–331. [Google Scholar] [CrossRef]
  18. Zarnescu, A.; Ungurelu, R.; Varzaru, G. Controlling the temperature and humidity in a greenhouse. In Proceedings of the IEEE 25th International Symposium for Design and Technology in Electronic Packaging (SIITME), Cluj-Napoca, Romania, 23–26 October 2019. [Google Scholar]
  19. Inoue, T.; Sunaga, M.; Ito, M.; Yuchen, Q.; Matsushima, Y.; Sakoda, K.; Yamori, W. Minimizing VPD fluctuations maintains higher stomatal conductance and photosynthesis, resulting in improvement of plant growth in lettuce. Front. Plant Sci. 2021, 12, 458. [Google Scholar] [CrossRef]
  20. Mantovani, D.; Veste, M.; Freese, D. Effects of drought frequency on growth performance and transpiration of young black locust (Robinia pseudoacacia L.). Int. J. For. Res. 2014, 2014, 821891. [Google Scholar]
  21. Sivapalan, S. Effect of a polymer on growth and yield of soybeans (Glycine Max) grown in a coarse textured soil. In Proceedings of the Irrigation 2001 Regional Conference, Sivapalan, Siva, 11–12 July 2001; IAA: Toowoomba, Australia, 2001; pp. 93–99. [Google Scholar]
  22. Akhter, J.; Mahmood, K.; Malik, K.A.; Mardan, A.; Ahmad, M.; Iqbal, M.M. Effects of hydrogel amendment on water storage of sandy loam and loam soils and grainling growth of barley, wheat and chickpea. Plant Soil Environ. 2004, 50, 463–469. [Google Scholar] [CrossRef] [Green Version]
  23. El-Hady, O.A.; Wanas, S.A. Water and fertilizer use efficiency by cucumber grown under stress on sandy soil treated with acrylamide hydrogels. J. Appl. Sci. Res. 2006, 2, 1293–1297. [Google Scholar]
  24. Sarvas, M.; Pavlenda, P.; Takacova, E. Effect of hydrogel application on survival and growth of pine grainling in reclamations. J. For. Sci 2007, 53, 204–209. [Google Scholar]
  25. Almeria Temperature History. 2018. Available online: https://weatherspark.com/h/m/38216/2018/11/Historical-Weather-in-November-2018-in-Almer%C3%ADa-Spain#Figures-Temperature (accessed on 22 March 2022).
  26. SSL Smart Farm Platform. Available online: http://www.ezsmartfarm.com/ (accessed on 5 January 2022).
  27. Statgraphics Technologies Inc. Available online: https://www.statgraphics.com/ (accessed on 22 December 2021).
  28. Holder, R.; Cockshull, K.E. Effects of humidity on the growth and yield of glasshouse tomatoes. J. Hortic. Sci. 1990, 65, 31–39. [Google Scholar] [CrossRef]
  29. Guichard, S.; Gary, C.; Leonardi, C.; Bertin, N. Analysis of growth and water relations of tomato fruits in relation to air vapor pressure deficit and plant fruit load. J. Plant Growth Regul. 2005, 24, 201–213. [Google Scholar] [CrossRef]
  30. Zhang, D.; Zhang, Z.; Li, J.; Chang, Y.; Du, Q.; Pan, T. Regulation of vapor pressure deficit by greenhouse micro-fog systems improved growth and productivity of tomato via enhancing photosynthesis during summer season. PLoS ONE 2015, 10, e0133919. [Google Scholar] [CrossRef] [PubMed]
  31. Jiao, X.-C.; Song, X.-M.; Zhang, D.-L.; Du, Q.-J.; Li, J.-M. Coordination between vapor pressure deficit and CO2 on the regulation of photosynthesis and productivity in greenhouse tomato production. Sci. Rep. 2019, 9, 8700. [Google Scholar] [CrossRef] [PubMed]
  32. López, J.; Way, D.A.; Sadok, W. Systemic effects of rising atmospheric vapor pressure deficit on plant physiology and productivity. Glob. Change Biol. 2021, 27, 1704–1720. [Google Scholar] [CrossRef]
Figure 1. Experimental settings: (a) spatial distribution of treatments in the greenhouse; (b) plastic curtain separating each area; (c) western area of the greenhouse; (d) eastern area of the greenhouse; (e) paired rows of dripper lines.
Applsci 12 03667 g001
Figure 2. Amount of applied fertilizers: (a) total volume of the nutrient solution applied; (b) amount of macronutrients applied; (c) physical-chemical parameters of the irrigation water.
Applsci 12 03667 g002
Figure 3. Evolution of (a) the air temperature; (b) the air relative humidity; (c) the illumination; (d) the air CO2 concentration; (e) the air VPD condition inside the greenhouse during the field trial.
Applsci 12 03667 g003
Figure 4. Growth parameters of tomato crops grown in soil: (a) evolution of crop height; (b) evolution of leaves developed; (c) evolution of fruit setting; (d) evolution of phenological growth stages.
Applsci 12 03667 g004
Figure 5. Yield of tomato crops grown in soil: (a,b) evolution of fresh weight accumulated of total yield and commercial yield; (c,d) evolution of total and commercial number of fruits accumulated.
Applsci 12 03667 g005aApplsci 12 03667 g005b
Figure 6. Growth parameters of tomato crops grown in soil above PVC trays: (a) evolution of height; (b) evolution of leaves developed; (c) evolution of fruit setting; (d) evolution of phenological growth stages.
Applsci 12 03667 g006
Figure 7. Yield of tomato crops grown in soil above PVC trays: (a,b) evolution of fresh weight accumulated of total and commercial fruits; (c,d) evolution of the total and commercial accumulated number of fruits.
Applsci 12 03667 g007
Figure 8. Growth parameters of tomato crops grown in coconut fiber above PVC trays: (a) evolution of height; (b) evolution of leaves developed; (c) evolution of fruit setting; (d) evolution of phenological growth stages.
Applsci 12 03667 g008
Figure 9. Yield of tomato crops grown in coconut fiber above PVC trays: (a,b) evolution of fresh weight accumulated of total and commercial fruits; (c,d) evolution of the total and commercial accumulated number of fruits.
Applsci 12 03667 g009aApplsci 12 03667 g009b
Figure 10. Qualitative characteristics of tomato crops grown in soil: (a) fresh weight of commercial fruits; (b) equatorial diameter of commercial fruits; (c) hardness of commercial fruits; (d) sugar content of commercial fruits.
Applsci 12 03667 g010
Table 1. Treatments carried out in the cultivated area.
Treatment IDVPD ConditionGrowing Medium#Tomato Crops
T1With VPD regulationSoil15
T1DSSoil in tray3
T1DCCoconut fiber substrate in tray3
T2Without VPD regulationSoil15
T2DSSoil in tray3
T2DCCoconut fiber substrate in tray3
Table 2. Applied nutrient solution.
ParametersHCO3NH4+NO3H2PO4SO4K+Ca+2Mg+2CIpHCE(dS/m−1)
(mmol I−1)0.41.115.21.72.57.15.81.69.15.81.6
Publisher’s Note: MDPI stays neutral with regard to jurisdictional claims in published maps and institutional affiliations.

