1. Introduction
Generally, engine operating regimes are described through the variation diagrams between certain engine performances and some main engine parameters [
1,
2]. In terms of the free level of accessibility of aviation documentation, if reference is made to a wide range of engines, in general, the actual values of engine parameters or performances at different engine regimes are not presented. Most of the information about the values of certain engine main parameters are specified in the engine manual, a document that is acquired from the manufacturer, or in the engine data sheet (a document more accessible than an engine manual), and usually are shown data only for operating regimes as takeoff (d), maximum continuous (c), cruise (b), and idle (a). Even in the engine manual the actual values of variation of the idle regime (a) to the maximum regime (d) for a wide range of parameters are not presented. In some cases, particular charts are presented, and if the charts are clear or easy to read, then some approximate values can be extracted and used to calculate or determine other parameters.
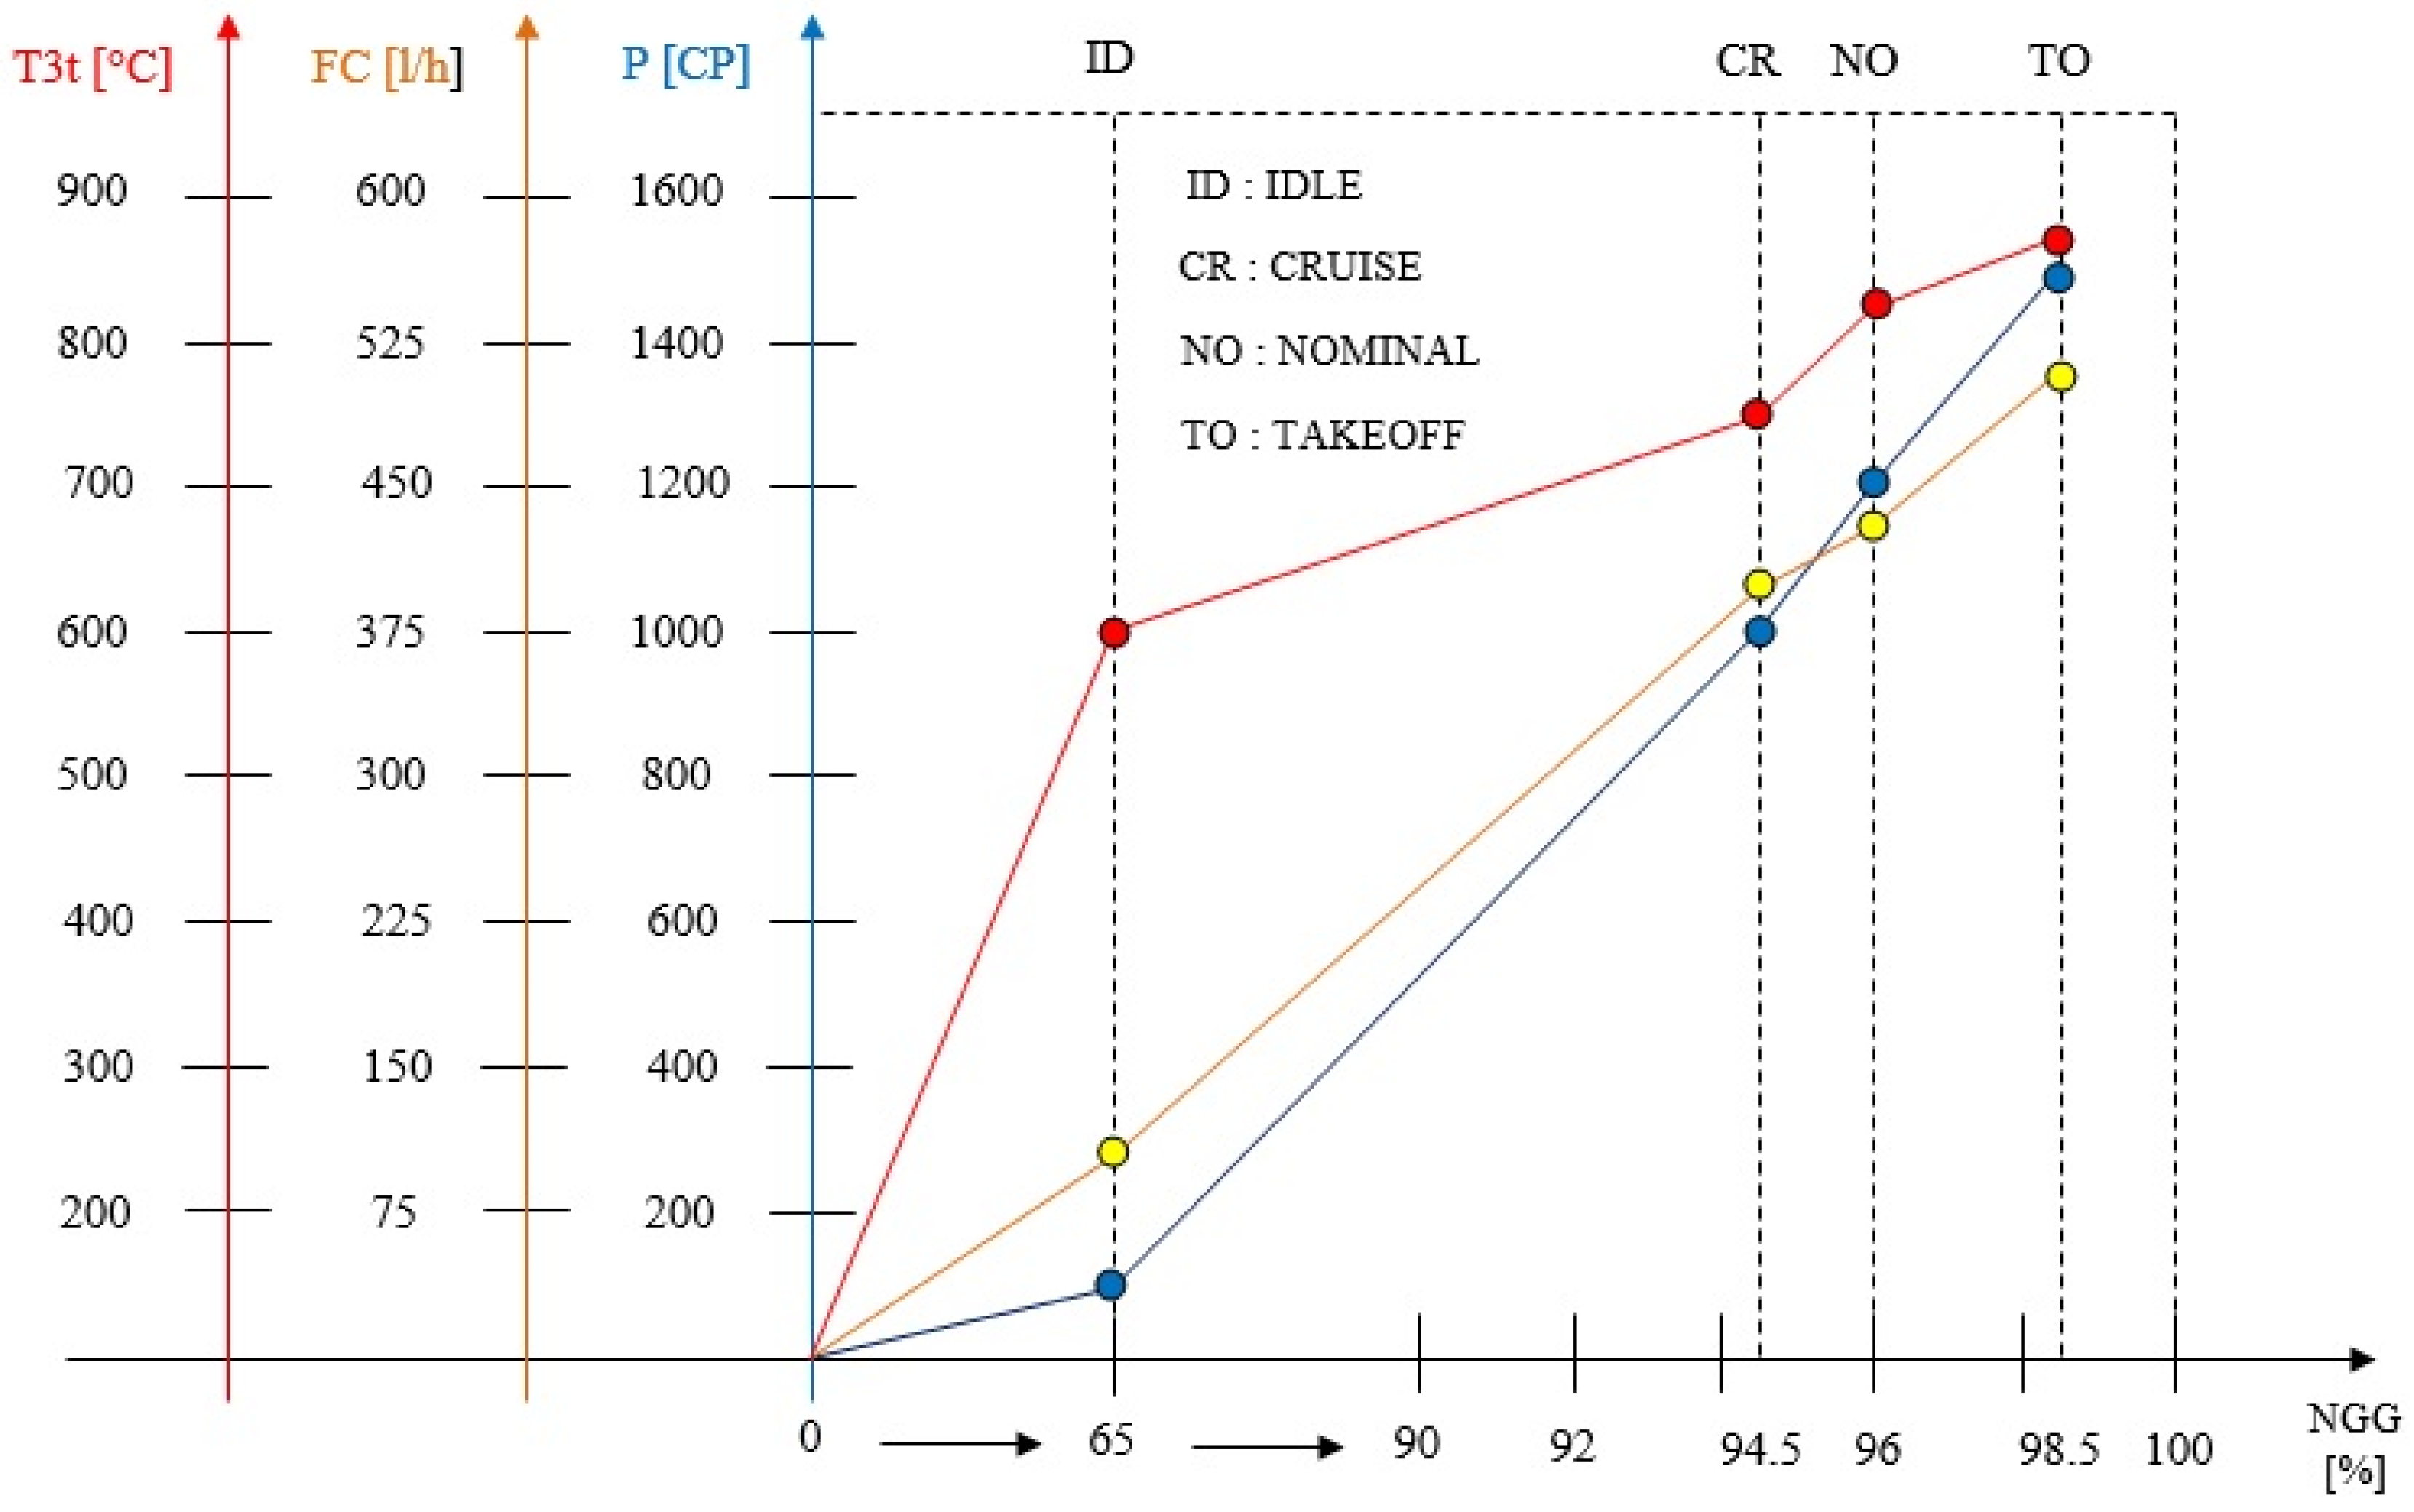
For example, similar to the current study,
Figure 1 presents a chart with the maximum values of some engine parameters at main engine working regimes [
3] for the TV2-117A (AG) turboshaft, according to the engine manual at sea level conditions, defined by variation of the effective power (
), effective fuel consumption (
) and inlet turbine gases temperature (
), reported to the gas generator speed (
.
Also, some specific research [
4,
5,
6] studies the performance of turboshaft engines by operating at different shaft speeds and present several curve variations diagrams of obtained engine parameters.
The aim of the paper was to study various working regimes for a specific experimental testing procedure by simulating diverse loads on a free power turbine [
7] by setting different torques from a hydraulic dynamometer. This particular testing procedure is different than the run tests described in the manufacturer’s manual and the tests for maintaining when in service or in operation. The engine was supplementarily instrumented because it was equipped with a standard instrumentation and instrumentation for engine regimes studies, which require additional parameters in order to determine other main engine parameters and performance measures which are evaluated and analyzed through the working engine regimes. These parameters were measured or determined using instrumentation methods that were applied and implemented for other experimental TV2-117A run tests [
8].
These run tests were executed for a technical study of a TV2-117A turboshaft implemented into a cogeneration power plant project [
9]. The acquisition of parameters was based on Digital Acquisition Control System (DACS) from Safran and has the capabilities to acquire more than 256 parameters for different types, such as, pressure, temperature, vibration, speed, flow meter, digital input, digital output, analogue output at an approximately 100 Hz acquiring rate for engines operations, service and maintenance and at an approximately 10 kHz for research projects where high measuring precision is required and some limitations can be applied [
10]. The instrumentation lines were calibrated and checked by the Metrological Laboratory of National Research and Development Institute for Gas Turbines COMOTI [
11].
2. Engine Application or Application Description
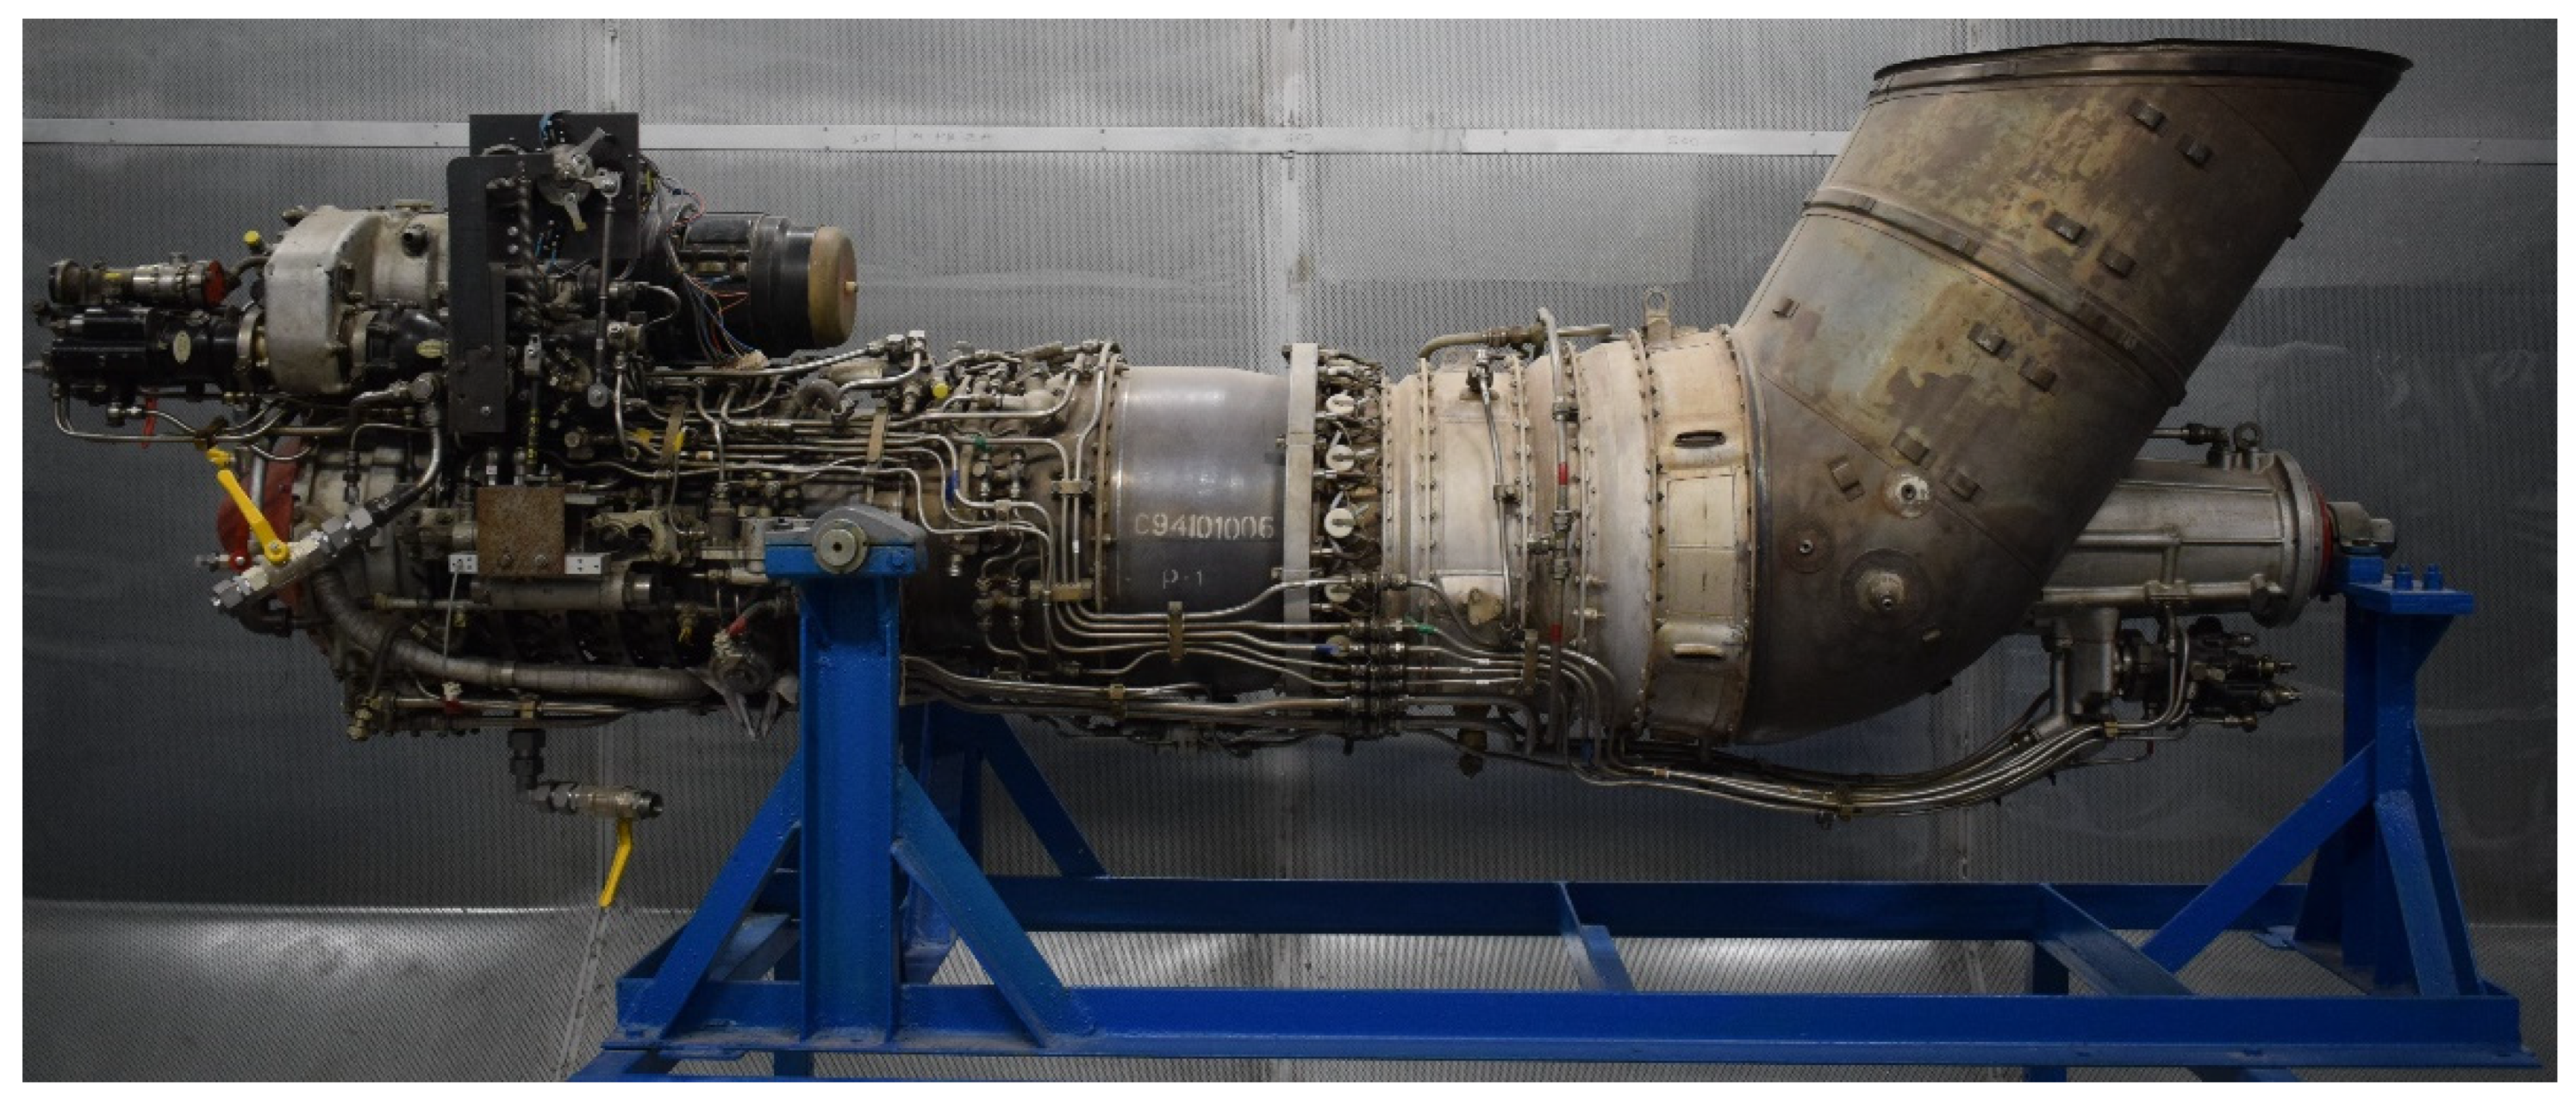
In the current paper, the study of the operation regimes was made for a TV2-117A engine, shown in
Figure 2. According to the manual [
3], the TV2-117A is a turboshaft engine manufactured by Klimov, and composed of a gas generator assembly and free power turbine assembly. The TV2-117 turboshaft is one of the most popular helicopter powerplant worldwide and has accumulated over 100 million hours in service [
12].
The gas generator assembly consists of nine stage axial compressors, of which four stator stages are with variable geometry, an annular combustion chamber and two stage axial turbines.
The power turbine assembly consists of two stage axial turbines and transmission module.
At working regimes above the idle (a) the TV2-117A engine is characterized by a free power turbine constant speed law; the power turbine is controlled by a speed regulator; and the speed regulator maintains a constant free power turbine speed, by controlling fuel in connection with the engine main fuel pump.
At takeoff (d) the engine performs an overall pressure ratio of and an air mass flow of . The gas generator speed at is , and at the free turbine speed is .
Table 1 presents the operating regimes, at sea level condition, defined by the values of some main engine parameters extracted from the engine manual [
3].
As mentioned above, the engine was installed into a test bench and connected to a hydraulic dynamometer. The way and the law of operating the dynamometer determined the engine working regimes. The engine was run on the test bench and, by dynamometer, speed and torque were measured and, by default, the power of free turbine shaft.
3. Engine Instrumentation
To assure a total monitoring of engine operation in maximum safety conditions, instrumentation lines and commands lines for measuring certain parameters of the engine were executed for controlling the engine, measure the parameters of the auxiliary installations and control the commands of the auxiliary installations.
Considering that the engine is equipped with a standard instrumentation [
3] consisting of gas generator shaft speed
, inlet gas turbine temperature
, fuel flow
, vibrations
, oil pressure
, oil temperature
, and, supplementarily, the free turbine shaft speed
, to realize the detailed study of the TV2-117A engine working regimes it was necessary to add additional instrumentation [
13], with some gasodynamic parameters in different engine stations, including the engine inlet, station 1, output of the compressor, station 2, and the output of the free turbine station 45, as presented in
Figure 3.
On the engine inlet, at station 1, the differential pressure was measured and used to calculate the engine air flow. On station 2 the outlet compressor total pressure and temperature were measured, and on station 45, the outlet free turbine total pressure was measured.
Regarding the engine control instrumentation, the main commands, through which the engine can be operated, are the starter, ignition IGN, starting fuel valves SFV, start lever SLV, throttle lever TLV, and external commands such as the fuel pump (FP) and a fuel shut-off valve (FSHV). To perform the engine experimentation, the engine was installed on the test bench and connected to all the instrumentation lines, as presented in
Figure 4.
4. Engine Operation and Testing Procedure
The engine was installed into the test bench, connected to a transmission box, and through the transmission box the free power turbine, two hydraulic dynamometers HS2600 were installed through which the engine was operated. A single dynamometer [
14], can perform a maximum power of
, with a maximum torque of
at a maximum speed of
, with a water consumption of
at optimum water pressure of
. The engine testing involved following an engine operation and testing procedure which described the stages of the engine experimentation, beginning with a start-up procedure and ending with an engine operation method to obtain different working regimes. The start-up procedure represented the sequence of the starting process by presenting the phases of the start-up sequence in the correct order, in order to control the engine by executing the starting process [
15].
Figure 5 presents, in diagram form, the scheme of the hot start-up procedure for the TV2-117A engine, which was equipped with an electrical starter-generator.
So, to execute an engine starting, the fuel pump FP must be turned on, the fuel shut-off valve FSHV must be opened and the start lever SLV must be put into the idle position and after that, the starter must be turned on. The starter increases the engine gas generator speed , and when speed reaches the ignition is turned on, and at the starting fuel valves FSV are opened to allow the mix of air and fuel to light-up. After the light-up, the engine accelerates and when the speed reaches , the ignition is turned off the ignition, as are the fuel starting valves and starter while the engine is still in acceleration. When the speed reaches the engine is on an idle (a) regime.
Until a certain regime, the engine was operated through the starting system, by the start-up fuel lever SLV, and through the engine fuel pump regulator EFPR, by the throttle lever
through which the fuel flow was metered to ensure the engine increase in high operating regimes. From this regime, the engine was operated only through the dynamometer by varying the load on the free power turbine. In
Figure 6, the mode of engine adjustment and the mode of loading the free turbine with various torque values [
13], to test the engine on the test bench are presented.
So, the engine is on idle (a) mode, with gas generator speed at and free turbine speed at . Because the engine is working with the free turbine constant speed, the throttle lever into is moved to reach the free turbine speed at , and in this way the functionality of free turbine speed regulator FTSP is checked and the engine is ready to be operated to higher regimes.
When a higher value of torque is set, the free turbine speed decreases, so the free turbine speed regulator in correlation with the engine fuel pump regulator EFPR adjusts to increase the fuel flow to the combustor chamber to maintain the free turbine speed at same working speed of
. To obtain different regimes from the dynamometer operator higher values of load are set, which corresponds to higher values of torque [
15].
Figure 7 presents the dynamometer operating system (Texcel VX100, software version 1.21, Froude Limited, Worcester, England) with user interface through which manages the dynamometer by torque demand to operate and control the engine [
16].
To test the engine according to the engine manual it is necessary to determine the working torque domain of the free power turbine by calculating the minimum and the maximum value of torque. To execute a normal starting point, and to obtain an idle (a) regime similar as is specified in
Table 1, at
free turbine speed and a maximum power of
, the starting torque or the minimum torque must be calculated, under which this value, the engine will be started.
To know the maximum load on which the engine is available to be run, the maximum operating torque must be calculated on the free turbine speed of
, with data from the takeoff (d) regime.
Figure 8 presents the general procedure after the TV2-117A engine was tested. First of all, the starting torque is established at
. To operate the engine for higher regimes the engine must be with the free turbine speed around
. and the engine throttle lever at the
position. In these conditions, the free turbine produces an effective torque.
From this effective torque and up to a maximum of , the free turbine is gradually loaded, by setting the torque with a step of , so each load will result in another engine regime.
For engine control and operation, a graphical user interface was used, as is in
Figure 9, to monitor the engine parameters in real time, confirmations and commands, which was viewed by the engine operator. The graphical user interface was executed through a programmable software of the test bench operating system which is a data acquisition control system DACS [
17].
5. Experimental Results and Calculated Data
In this chapter, experimental and calculated data are presented in
Table 2 and
Table 3, for different engine working regimes, following the engine test, according to the general testing procedure from
Figure 8. The measured experimental data are used into a calculation model to determine some main engine parameters and some performances of engine components.
The calculation model [
8] is based on the equality conditions of the isentropic evolutions, and the typical gasodynamic relations from the compressor and turbine thermodynamic processes, according with the TV2-117A engine enthalpy-entropy cycle diagram, from
Figure 10.
To achieve close realistic results, the calculation model used for air and gases enthalpy and entropy defined by polynomials, as a function on working temperature, with specific coefficients for air and gases with different values for enthalpy and entropy.
The air enthalpy and entropy are presented as:
In the case of enthalpy and entropy of the flow gases, the polynomials are presented for ideal combustion, where
:
In the case of a real combustion scenario, the enthalpy and entropy polynomials involve mass participations, and are presented as:
So, by using the model calculation [
8], the next engine main parameters and performances of engine components are calculated, as are the pressures (
) and temperatures (
) in the main engine stations, the mass air flow (
), the overall pressure ratio (
), the turbine total pressure ratio (
), the gases flow (
), the compressor and turbine total adiabatic efficiency (
) and the thermal efficiency (
), defined by the next mathematical relations, presented below.
The mass air flow relation is:
The overall pressure ratio and turbine total pressure ratio relations are:
The compressor and turbine total adiabatic efficiency relations are:
The gases flow relation is:
The thermal efficiency, depends on the fuel lower heating value (
), with the next form:
Because the engine was tested with Jet A-1 fuel the value of is .
In
Table 4 and
Table 5, are presented the calculated values of engine parameters in the main stations and some performances of engine components.
In order to achieve a better view of the engine parameter variation the percentage variation was calculated by reporting all the parameters values of each engine regime (R) at parameter value from the maximum regime (d), in this case from the
engine speed regime, as is shown in the equation (14). So, in that mode it is obtained an easier method of perception about the parameters (
) and performances variation.
In the first case the percentage variation of the engine regimes from engine manual was studied as, presented in
Table 6.
Table 7, the calculated percentage values of engine main engine parameters and certain performances of engine components are presented.
From the percentage values of engine main parameters, it is observed that not all the parameters have the same values variations or vary in the same way. In case of the idle (a) regime all the parameters have different percentage values.
As can be seen above, at the idle mode the fuel flow is , the mass air flow is , the overall pressure ratio starts with and the inlet turbine temperature starts from . In the case of the compressor and turbine total adiabatic efficiency it was observed that the percentage values are very high, and very close, around to . The engine power has the lowest value of and the thermal efficiency starts from close to fuel flow. So, in this way the parameter values at the idle mode reported to the maximum mode are defined.
To have a better view about the parameter variations, the following figures present the percentage variation of main engine parameters and certain performances of engine components reported to the engine speed.
Figure 11 presents the fuel flow (
) and mass air flow (
) percentage variation with engine speed.
From the chart it can be observed that the fuel flow and mass air flow increase with engine speed and have almost the same curves variation but with different values until 95% speed regime.
Figure 12 presents the overall pressure ratio (
) and inlet turbine total temperature (
) percentage variation with engine speed.
From the chart it can be observed that the overall pressure ratio and inlet turbine total temperature increase with engine speed and the curves variation are not so different, only that more accentuated for overall pressure ratio. Also, the curves are defined by different values until 95% speed regime.
In
Figure 13 it is presented the compressor and turbine total adiabatic efficiency (
) percentage variation with engine speed.
From the chart it can be observed that the compressor and turbine total adiabatic efficiency is almost constant with the engine speed and has approximately the same curves variations with close values.
Figure 14 presents the engine power and the thermal efficiency percentage variation with the engine speed.
In the case of engine power and thermal efficiency, from the chart it can be observed that the curves variation is smoother for thermal efficiency and more increased engine power. For the same regimes the curves are defined by different values until 98% speed regime.
6. Discussion
Following the calculation of main engine percentage values, it can be seen that the parameters have different variation values, do not vary in the same way and start from different values of variation. One way to prove that the acquisition and operation of engine were correctly executed, the experimental data values with the data manual values must be compared at the same engine regime. So, because the experimental data are not provided at standard atmospheric temperature and pressure, in this case it is required to correct the data with the standard sea level conditions (, ).
Table 8 presents certain main engine parameters and performances that are determined based on the data from engine manual [
6], at different operating regimes.
Table 9 presents the corrected values of experimental data of the same main engine parameters and performances, at approximately the same operating regimes, similar to engine manual.
Therefore, to compare the experimental data with data manual, the percentage differences were determined by the following mathematical relations:
Table 10 presents the values of percentage differences between some main engine parameters and performances from the experimental and manual data.
In the case of the idle (a) regime, the differences are a maximum of because the data from the manual are for the maximum values of each parameter and the engine starts under different torque values. In the case of other regimes, the differences are a maximum of , because there are some small differences in gas generator speed, and these differences at higher regimes affect the values of the parameters. Because the engine regimes depend on the demanded torque from the dynamometer, engine adjustments are required to test the engine under the same gas generator and speed values as is specified in the engine manual, so in this way the values will decrease to under .
7. Conclusions
The paper presents a particular gas turbine engine research work, performed on the TV2-117A free turbine turboshaft engine experimentation, on the test bench, to achieve a specific study analysis about the variation of several engine main parameters and engine performances. Following the engine testing, by adhering to a specific testing procedure, a series of different engine working regimes was obtained using a hydraulic dynamometer by varying the load on the free power turbine and measuring the shaft power and torque, and through a digital acquisition and controller system, a series of engine parameters were measured. The measured data are used in a calculation model, based on an engine cycle enthalpy-entropy diagram, to determine main engine parameters and certain performances of engine components, of each working regime. The paper indicates a typical method of parameters and performance variation analysis, by reporting all workings regime to the maximum regime (d). The results are presented in two different ways, on actual values and on percentage values, providing a better understanding and accessibility about how the engine parameters vary from one regime to another or from the idle (a) regime to the maximum regime (d), shown in tables and exposed on the curves variations charts.
The experimental test depends on an application project that used the turboshaft engine and that involved a specific instrumentation and a specific testing procedure in order to achieve the objective of that application. For a further study of evaluating turboshaft working regimes, the gases and noise emissions will be studied using the proper resources of Comoti that are in the process of being installed in the test bench [
10].
The most important finding is that the evaluation of working regimes is performed through more main parameters and performances than the standard documentation shows. Also, the measuring data and other calculated engine parameters validate the experimental main working regimes similar to the engine manual [
3] and other similar research [
18] described by the low differences percentage variation values, and this involved the validation of the instrumentation methods applied and the acquisition process that was used.


