Article

Quenching Efficiency of Quantum Dots Conjugated to Lipid Bilayers on Graphene Oxide Evaluated by Fluorescence Single Particle Tracking

Department of Applied Chemistry and Life Science, Toyohashi University of Technology, Toyohashi 441-8580, Japan
*
Author to whom correspondence should be addressed.
Appl. Sci. 2022, 12(8), 3733; https://doi.org/10.3390/app12083733
Submission received: 20 March 2022 / Revised: 4 April 2022 / Accepted: 5 April 2022 / Published: 7 April 2022
(This article belongs to the Special Issue Single-Molecule Sensing for Biomedical Applications)

Abstract

:
A single particle observation of quantum dots (QDs) was performed on lipid bilayers formed on graphene oxide (GO). The long-range fluorescence quenching of GO has been applied to biosensing for various biomolecules. We demonstrated the single particle observation of a QD on supported lipid bilayers in this study, aiming to detect the quenching efficiency of lipid and protein molecules in a lipid bilayer by fluorescence single particle tacking (SPT). A single lipid bilayer or double lipid bilayers were formed on GO flakes deposited on a thermally oxidized silicon substrate by the vesicle fusion method. The QDs were conjugated on the lipid bilayers, and single particle images of the QDs were obtained under the quenching effect of GO. The quenching efficiency of a single QD was evaluated from the fluorescence intensities on the regions with and without GO. The quenching efficiency reflecting the layer numbers of the lipid bilayers was obtained.

1. Introduction

Lipid bilayers are the fundamental structure of plasma membranes and play important roles as a reaction field for various membrane reactions such as the transport of material, energy, and information into and out of cells [1,2,3]. Artificial lipid bilayer membranes such as the black membrane, vesicle, and supported lipid bilayer (SLB) have been used as cell membrane model systems to understand the behaviors of lipids, peptides, and proteins in and on lipid bilayers [4,5,6,7,8]. The artificial lipid bilayer system at the interface between a solid substrate and an aqueous solution is the SLB. The lipid bilayer exists in the vicinity of approximately 1 nm to the substrate, and thus, has a high technical affinity with functionalized surfaces and sensors [9,10,11,12]. SLBs on functional materials are valuable as a platform for investigating the function of membrane proteins because the lateral and vertical distribution, and assembly of lipids and proteins, significantly affect the efficiency of the transportation reaction though cell membranes [2,3].
Graphene oxide (GO) is a chemical derivative of graphene, which is a two-dimensional atomic sheet of sp2-carbon. GO is a single-atomic sheet comprising aromatic carbons modified with oxygen functional groups such as hydroxy, epoxy, and carboxy groups [13,14]. Because of these functional groups, GO becomes hydrophilic and is available in aqueous systems, whereas pristine graphene is hydrophobic. Recently, various biological applications of GO, utilizing its unique properties, were reported [14,15,16,17,18,19,20,21,22]. GO possesses a unique fluorescence quenching ability that works independently of the wavelength of a donor fluorescence probe and presents a longer effective range than that of general molecular accepters [23]. The quenching function of GO has been applied to biosensing based on fluorescence resonance energy transfer (FRET) for DNA hybridization and protein binding [15,16,24,25]. In the theoretical calculation based on the Förster mechanism, the efficiency of fluorescence quenching by the two-dimensional graphene-based materials has the dependence to the minus forth power of the distance between the donor molecule and GO [26,27], while dye molecules assumed as a point dipole have that to the minus sixth power of the distance. The former shows a longer effective range compared to the latter (Figure 1). The fluorescence lifetime measurement for fluorescence-tagged DNA molecules at the different positions demonstrated that the quenching efficiency of GO was expressed as Equation (1) [28]:
E = 1 1 + d d 0 4
where d is the distance between GO and a fluorescent probe, and d0 is the Förster distance, at which the quenching efficiency becomes 0.5. The estimated d0 of GO is 7.5 nm [28]. It is larger than the d0 of typical dye molecules, approximately 5 nm at maximum.
We aim to apply the fluorescence quenching of GO to detect lipids and protein molecules in and on lipid bilayers. A typical thickness of a lipid bilayer is approximately 5 nm. Therefore, the quenching effect of GO reaches to the other side of the lipid bilayer that is formed on GO (Figure 1). We have reported that a single lipid bilayer or double bilayers form on GO flakes after the SLB formation by the vesicle fusion method [29,30]. However, fluorescence single particle tracking (SPT) showed that dye molecules labeled to lipids are quenched too effectively to be detected in the SLB on GO [30]. As a first step for detecting the quenching efficiency of a single molecule by the SPT, we demonstrated the single particle observation of the quantum dot (QD) in this study. We expected that the fluorescence intensity of a QD is sufficiently high for the SPT even under the quenching effect of GO.

2. Materials and Methods

The graphene oxide was prepared through the chemical exfoliation of graphite following the modified Hummer’s method [31,32]. Briefly, graphite particles (Ito Graphite Co., Ltd., Kuwana, Japan) were oxidized in two steps with peroxydisulfuric acid and potassium permanganate in sulfuric acid, and the oxidized graphite was dispersed into pure water to prepare an aqueous suspension of single-layered GO flakes that were exfoliated from the graphite particles. Residual oxidized graphite particles and multi-layered GO flakes were removed by centrifugation. The GO suspension was deposited by drop-casting on a piranha-cleaned thermally oxidized silicon (SiO2/Si) substrate. The details of the preparation of the GO suspension and the SiO2/Si substrate are described elsewhere [33].
1,2-dioleoyl-sn-glycero-3-phosphocholine (DOPC), 1,2-dipalmitoyl-sn-glycero-3-phosphothioethanol (DPPTE), and 1,2-distearoyl-sn-glycero-3-phosphoethanolamine-N-[amino(polyethylene glycol)-2000] (PEG-DSPE) were purchased from Avanti Polar Lipids, Inc. (Alabaster, AL, USA) and used without further purification. Chloroform solutions of DOPC, PEG-DSPE, and DPPTE were mixed in a glass vial at a molar ratio of 95:5:5 × 10⁻⁷ for SPT or (100−CPEG):CPEG:0 (CPEG represents PEG-DSPE concentration, CPEG = 5.0 or 7.5 mol%) for AFM. The PEG-DSPE was added to suppress the non-specific adsorption of the QD [30]. The mixed lipid solution was dried in a nitrogen stream followed by vacuum-drying for at least 6 h. The dried lipid film was suspended in a buffer solution (100 mM KCl, 25 mM HEPES, pH 7.4/NaOH) to obtain multilamellar vesicles. The suspension was extruded through 800 nm and 100 nm polycarbonate filters to prepare the unilamellar vesicles. We prepared the SLBs on the SiO2/Si substrates with and without GO by the vesicle fusion method [12,34], following the protocols in the previous study [30]. The substrates were incubated in the suspension of the unilamellar vesicle at 45 °C for 1 h. Excess vesicles were removed by exchanging the suspension with the buffer solution.
A carboxyl-coated QD (Qdot® 655 ITK™, Life Technologies, Carlsbad, CA, USA) was modified with a maleimide-hydrazide hetero-cross-linker (Quanta BioDesign Ltd., Plain City, OH, USA) and 2-(2-aminoethoxy) ethanol (AEE) using 1-ethyl-3-(3-dimethylaminopropyl) carbodiimide (EDC), and then added to the SLB containing DPPTE [35]. AEE was co-adsorbed with the cross-linker to control the number of efficient maleimide groups on the QD surface for the covalent bond formation with DPPTE in the SLB, and to reduce multivalent conjugation of the QD with the DPPTE [30].
Single particle tracking was performed with an inverted fluorescence microscope (IX-71, Olympus, Inc., Tokyo, Japan) and a 532 nm DPSS laser. The GO/SiO2/Si substrate after SLB formation was sealed in a cell made of cover glass slips with a silicone resin spacer. We adopted the diagonal illumination setup [36], which enables single molecule imaging on an opaque silicon wafer [37,38]. The single particle images of the QDs were recorded at a time resolution of 30 ms (33 frames per second) using an EM-CCD camera (iXon DU-897, Andor Technology, Ltd., Belfast, UK)). The pixel size of the SPT recording was 140.84 nm. We obtained the trajectory coordinates and fluorescence intensity of each QD from the movies using an ImageJ (NIH, http://imagej.nih.gov/ij/, (accessed on 19 March 2022)) and the Particle Tracker plug-in on the basis of the theory and protocol developed by Sbalzarini and Koumoutsakos [39].
Atomic force microscopy (AFM) topographies were obtained with a PicoPlus 5500 (Keysight Technologies, Inc., Santa Rosa, CA, USA, formerly Molecular Imaging, Corp.) using a magnetically coated cantilever (Agilent Type I MAC Lever, spring constant 0.6 N/m) in the magnetic AC mode in the buffer solution at ~25 °C.

3. Results and Discussion

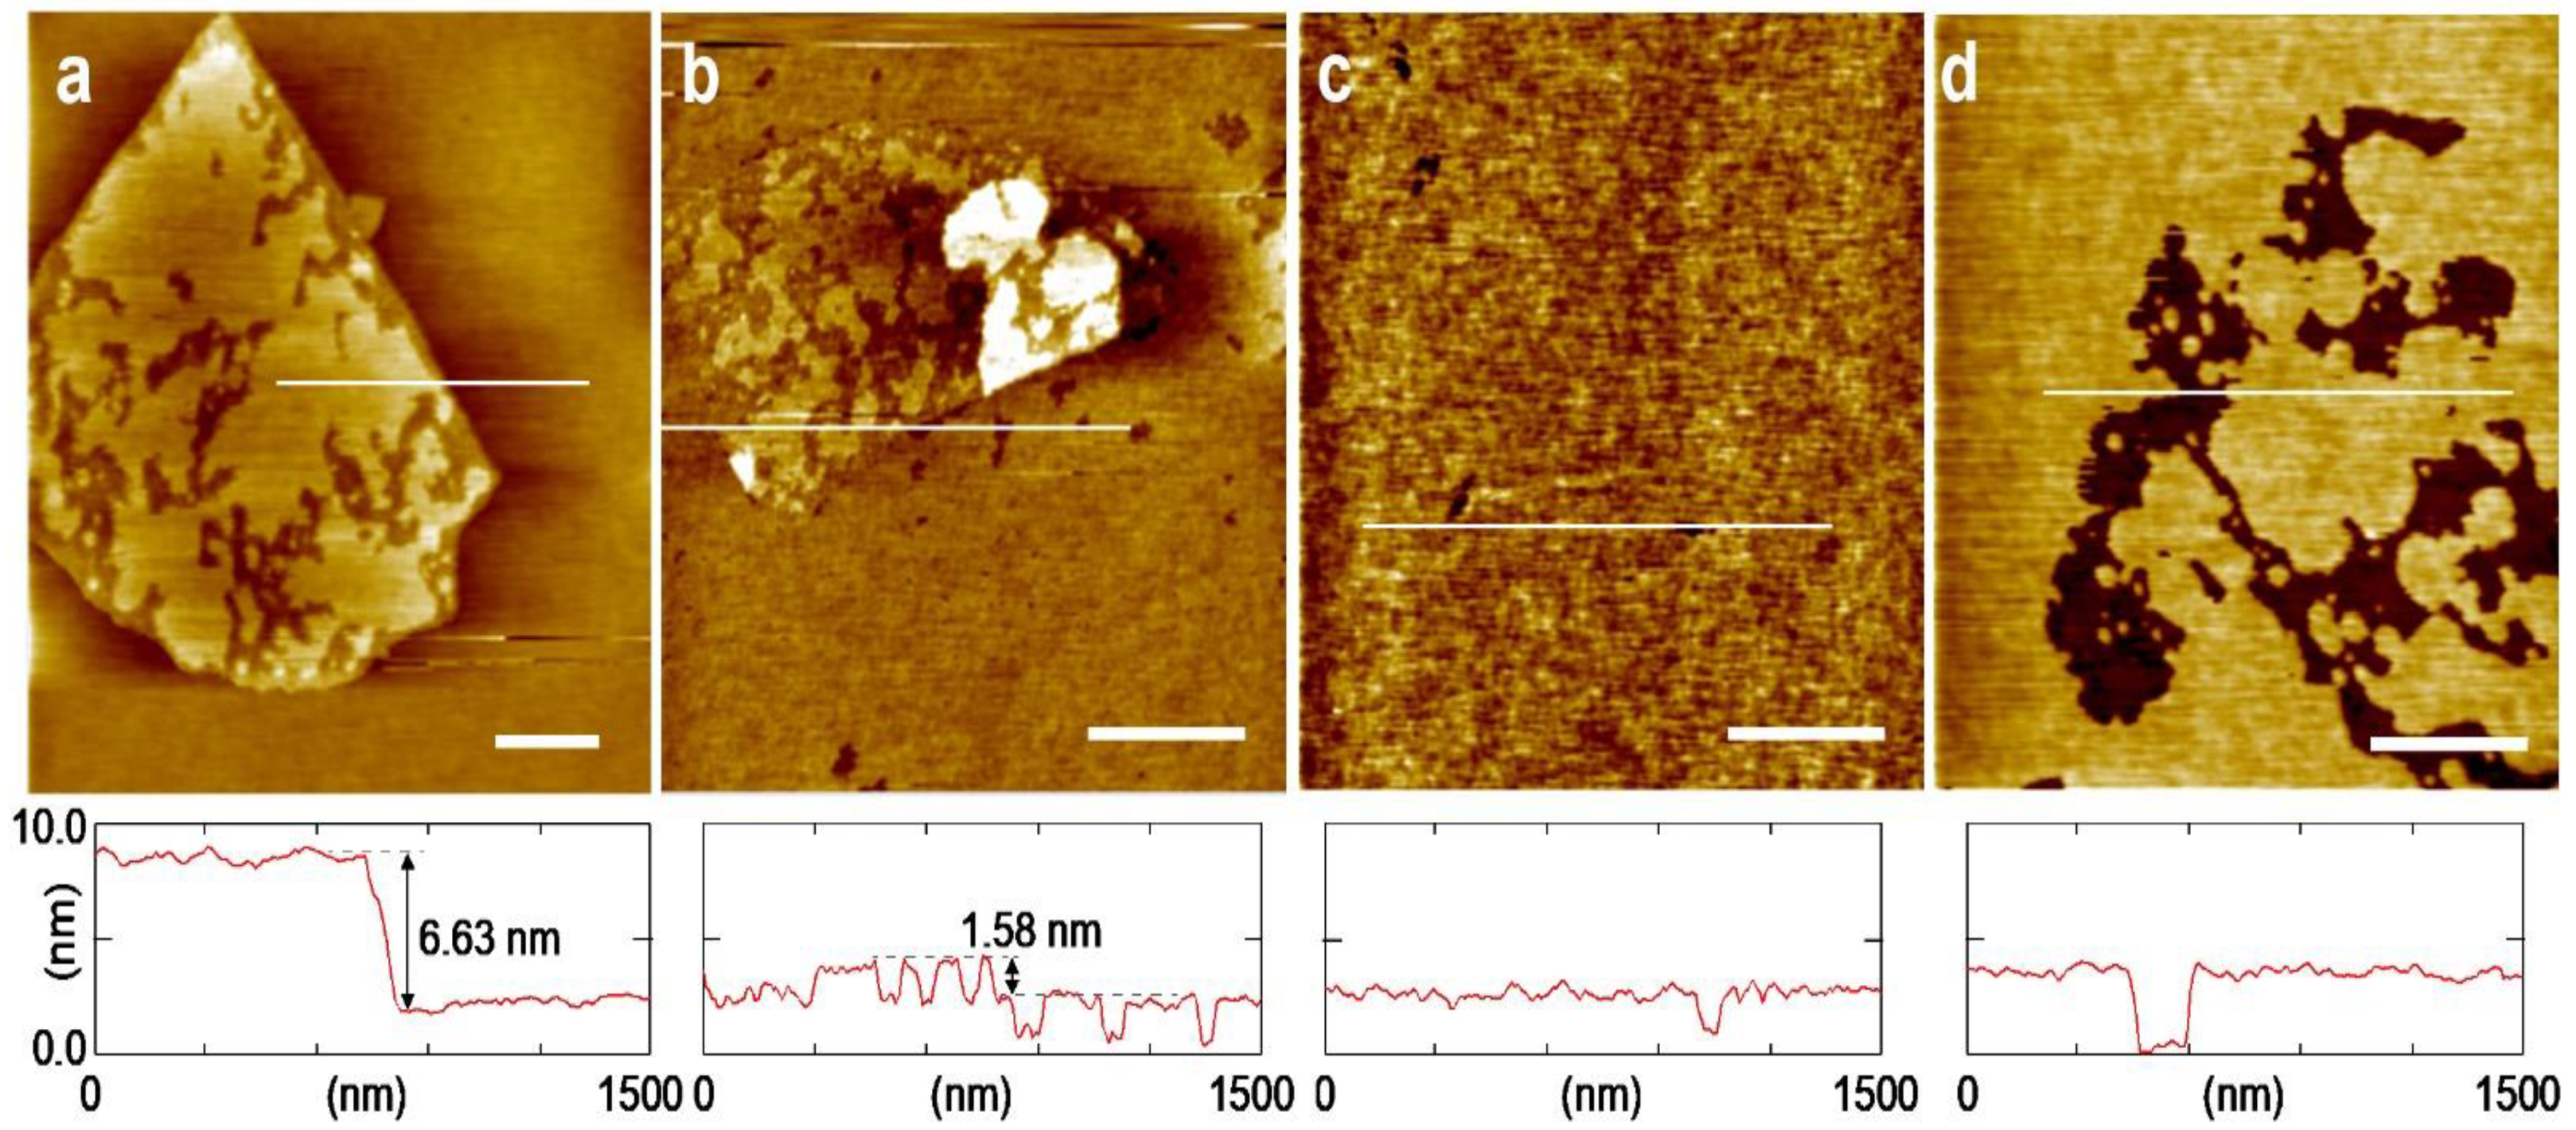
After the SLB formation on the GO/SiO2/Si substrate, the position of the GO flakes was recognized in the AFM topographies as shown in Figure 2a,b. The regions with GO flakes were higher than the surrounding SiO2 region by ~6.5 nm or ~1.5 nm. They are assigned to double layers and a single layer of the SLB as with the previous study [29]. The typical height of a GO flake on a SiO2/Si solid substrate in the AFM topographies is approximately 1.5 nm, which includes the thicknesses of GO and a water layer confined between the GO flake and the substrate [29]. Since the SiO2/Si substrate is covered with a single layer of SLB, the height difference of 1.5 nm indicates a single layer of SLB existing on the GO flake, and that of 6.5 nm indicates another SLB layer, whose typical thickness is approximately 5 nm [12,29,40], stacking on the first SLB on GO. The domains of the PEG-DSPE appeared as depressed regions in Figure 2a,b as reported in the previous study [41]. The DOPC-SLB with CPEG = 5.0 mol% and 7.0 mol% on the SiO2/Si substrate without GO are shown in Figure 2c,d, respectively, for comparison. The depressed region increased with CPEG. The apparent AFM topography of the PEG-DSPE domains is highly force-dependent: in the force range of the conventional intermittent contact mode, they appear lower than the surrounding SLB region where diffusing PEG-DSPE molecules exist [41,42]. It is interesting that the PEG-DSPE domains were localized on the GO flakes (Figure 2a,b) probably due to the difference in the substrate-SLB interaction between GO and SiO2. Hydration repulsion on a SiO2 surface, which is due to the hydrogen-bonded water layer to the surface hydroxy groups, reduces with the decrease in the surface hydrophilicity [43]. The surface of GO is partially hydrophobic because of the pristine graphene patches [13,14]; therefore, it induces less hydration repulsion compared to the SiO2 surface. Hydrophilic polymers, including PEG, cause thermal fluctuation repulsions [41,42,44]; therefore, we surmise that the PEG-DSPE preferred the less repulsive GO region than the SiO2 region.
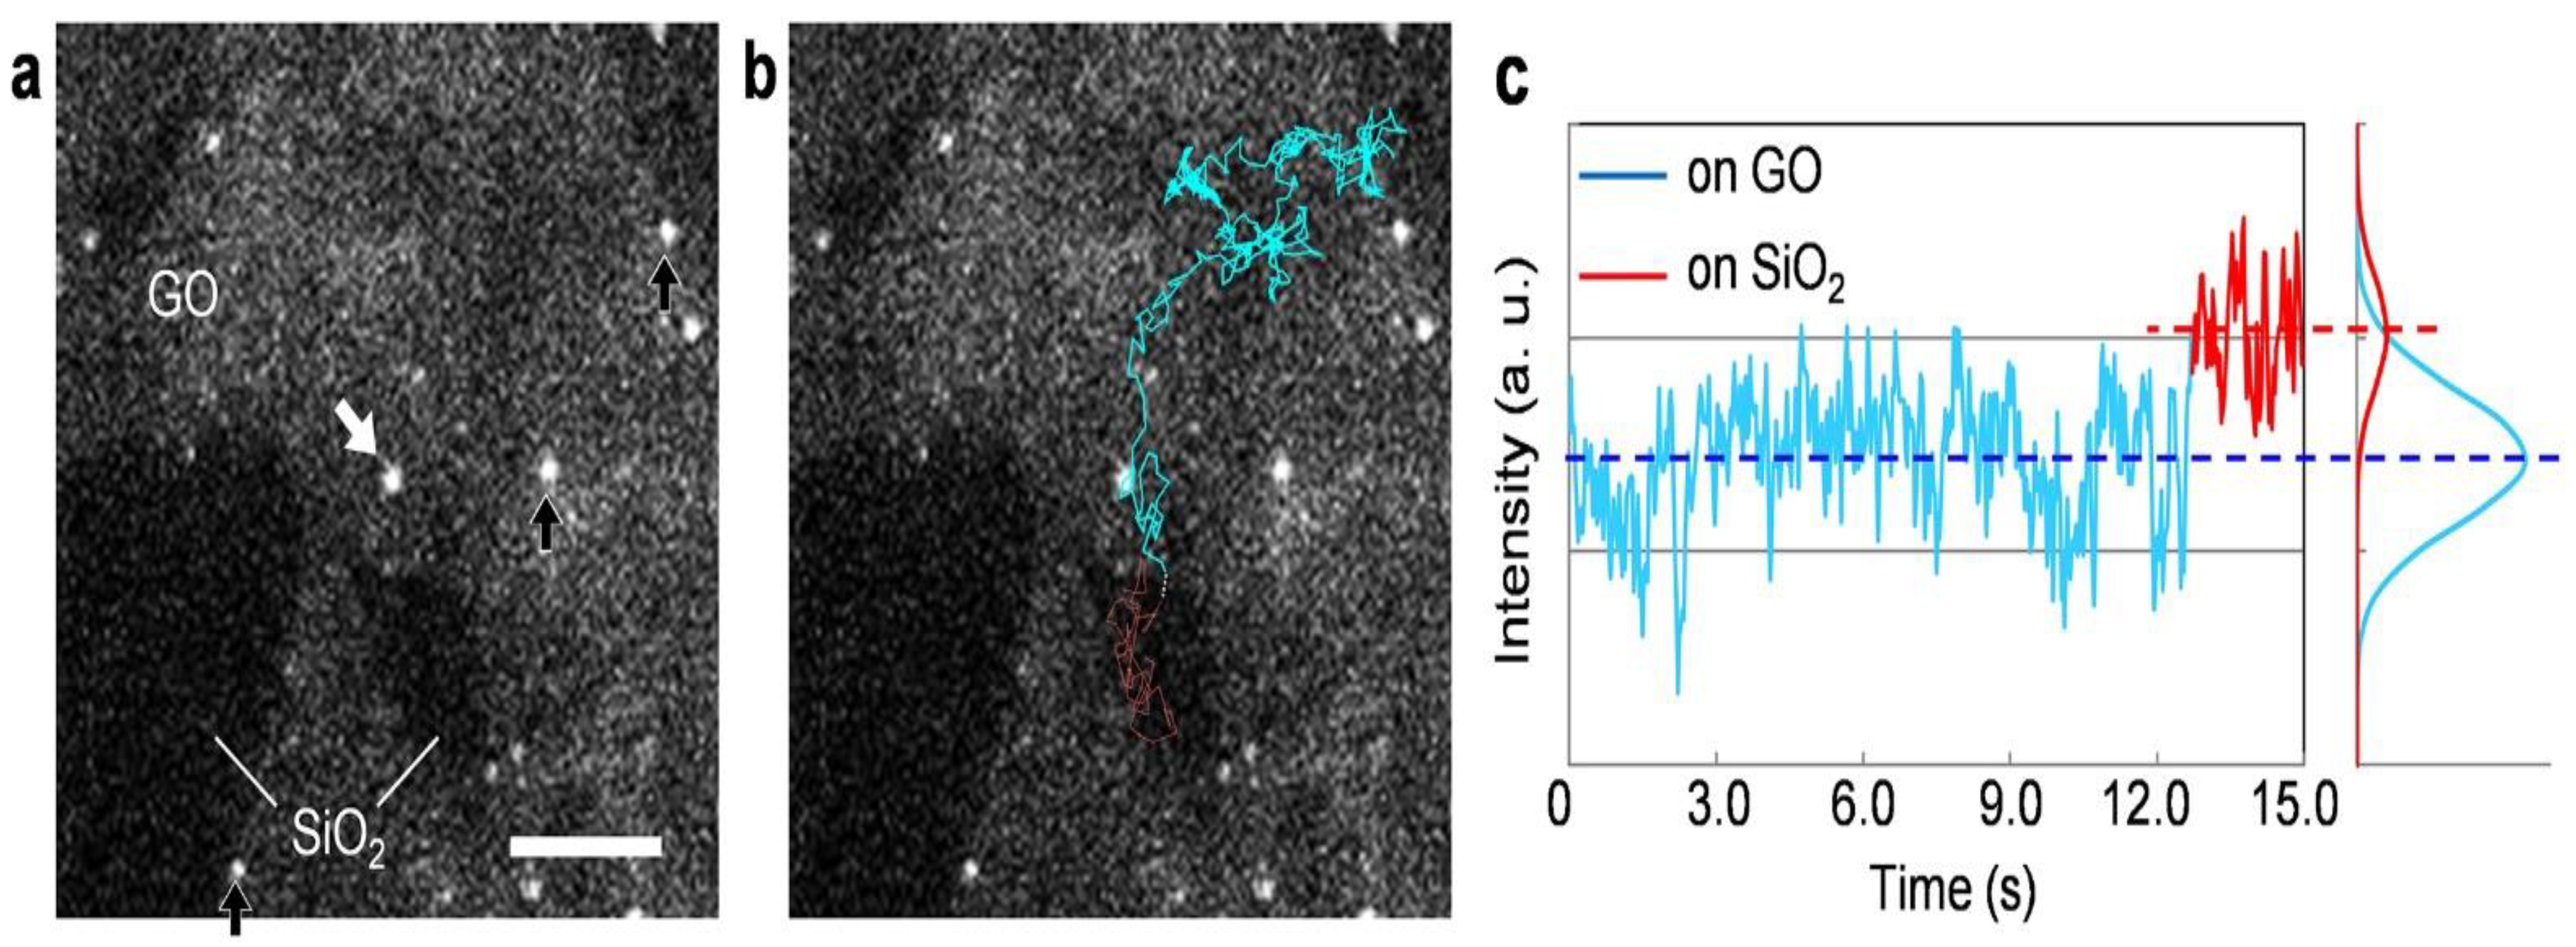
The QD was conjugated to the SLB with CPEG = 5.0 mol% on the GO/SiO2/Si substrate, to perform the SPT. Each QD appeared as bright spots in the SPT movie, as shown in Video S1 of the Supplementary Materials and its snapshot in Figure 3a. Mobile bright spots (Figure 3a, indicated by a white arrow) were QDs conjugated with one or a few DPPTE molecules in the SLB, while immobile ones (Figure 3b, indicated by black arrows) were QDs with an excessively multivalent conjugation or those nonspecifically adsorbed on the SLB. The shape of the GO flakes was recognized because of the fluorescence from GO, but its intensity was sufficiently lower than that from QDs. QDs conjugated on the SLB surface were visible in the GO region even under the effect of the fluorescence quenching by GO. The fluorescence intensity of the QDs was not homogeneous as seen in Figure 3a. It may be because of the heterogeneous conjugation states of the QDs that possibly affect the fluorescence intensity by itself and also the effects of dissolved oxygen in the buffer solution. Oxygen induces various effects on the fluorescence of QDs including quenching, brightening, and blinking [45].
Figure 3b shows the trajectory of a mobile QD that diffused from the GO region (depicted in blue in Figure 3b) to the SiO2 region without GO (depicted in red in Figure 3b). The fluorescence intensity of this QD during the diffusion in Figure 3b was obtained from the SPT movie (Video S1) and plotted as the time trace in Figure 3c. The fluoresce from the QD was attenuated in the GO region (depicted in blue in Figure 3c) compared to the SiO2 region (depicted in red in Figure 3c).
We evaluated the fluorescence quenching efficiency (E) from the fluorescence intensities of the QD at the GO and SiO2 regions, where the QD was under and free from the quenching effect of GO, respectively, by Equation (2):
E = 1 I GO I SiO 2
where IGO and ISiO2 are the fluorescence intensity at the GO and SiO2 regions, respectively. Using the average fluorescence intensities in Figure 3c for IGO and ISiO2, we obtained E = 0.29 for the QD in Figure 3. Note that IGO and ISiO2 of a single QD are needed to calculate E because each QD has different brightness as mentioned above. We calculated E of five other QDs at different positions from their fluorescence intensities at the GO and SiO2 regions (Figure S1 in the Supplementary Material). The values of IGO, ISiO2, and E of six QDs in total are summarized in Table 1. QDs #1 (Figure 3c) and #2–#4 (Figure S1a–c) showed E in the range between 0.1–0.3, whereas E of QDs #5 and #6 (Figure S1d,e) were nearly zero. A negative E value was numerically obtained for QD #6 because the variation in the fluorescence intensity was larger than the difference between IGO and ISiO2.
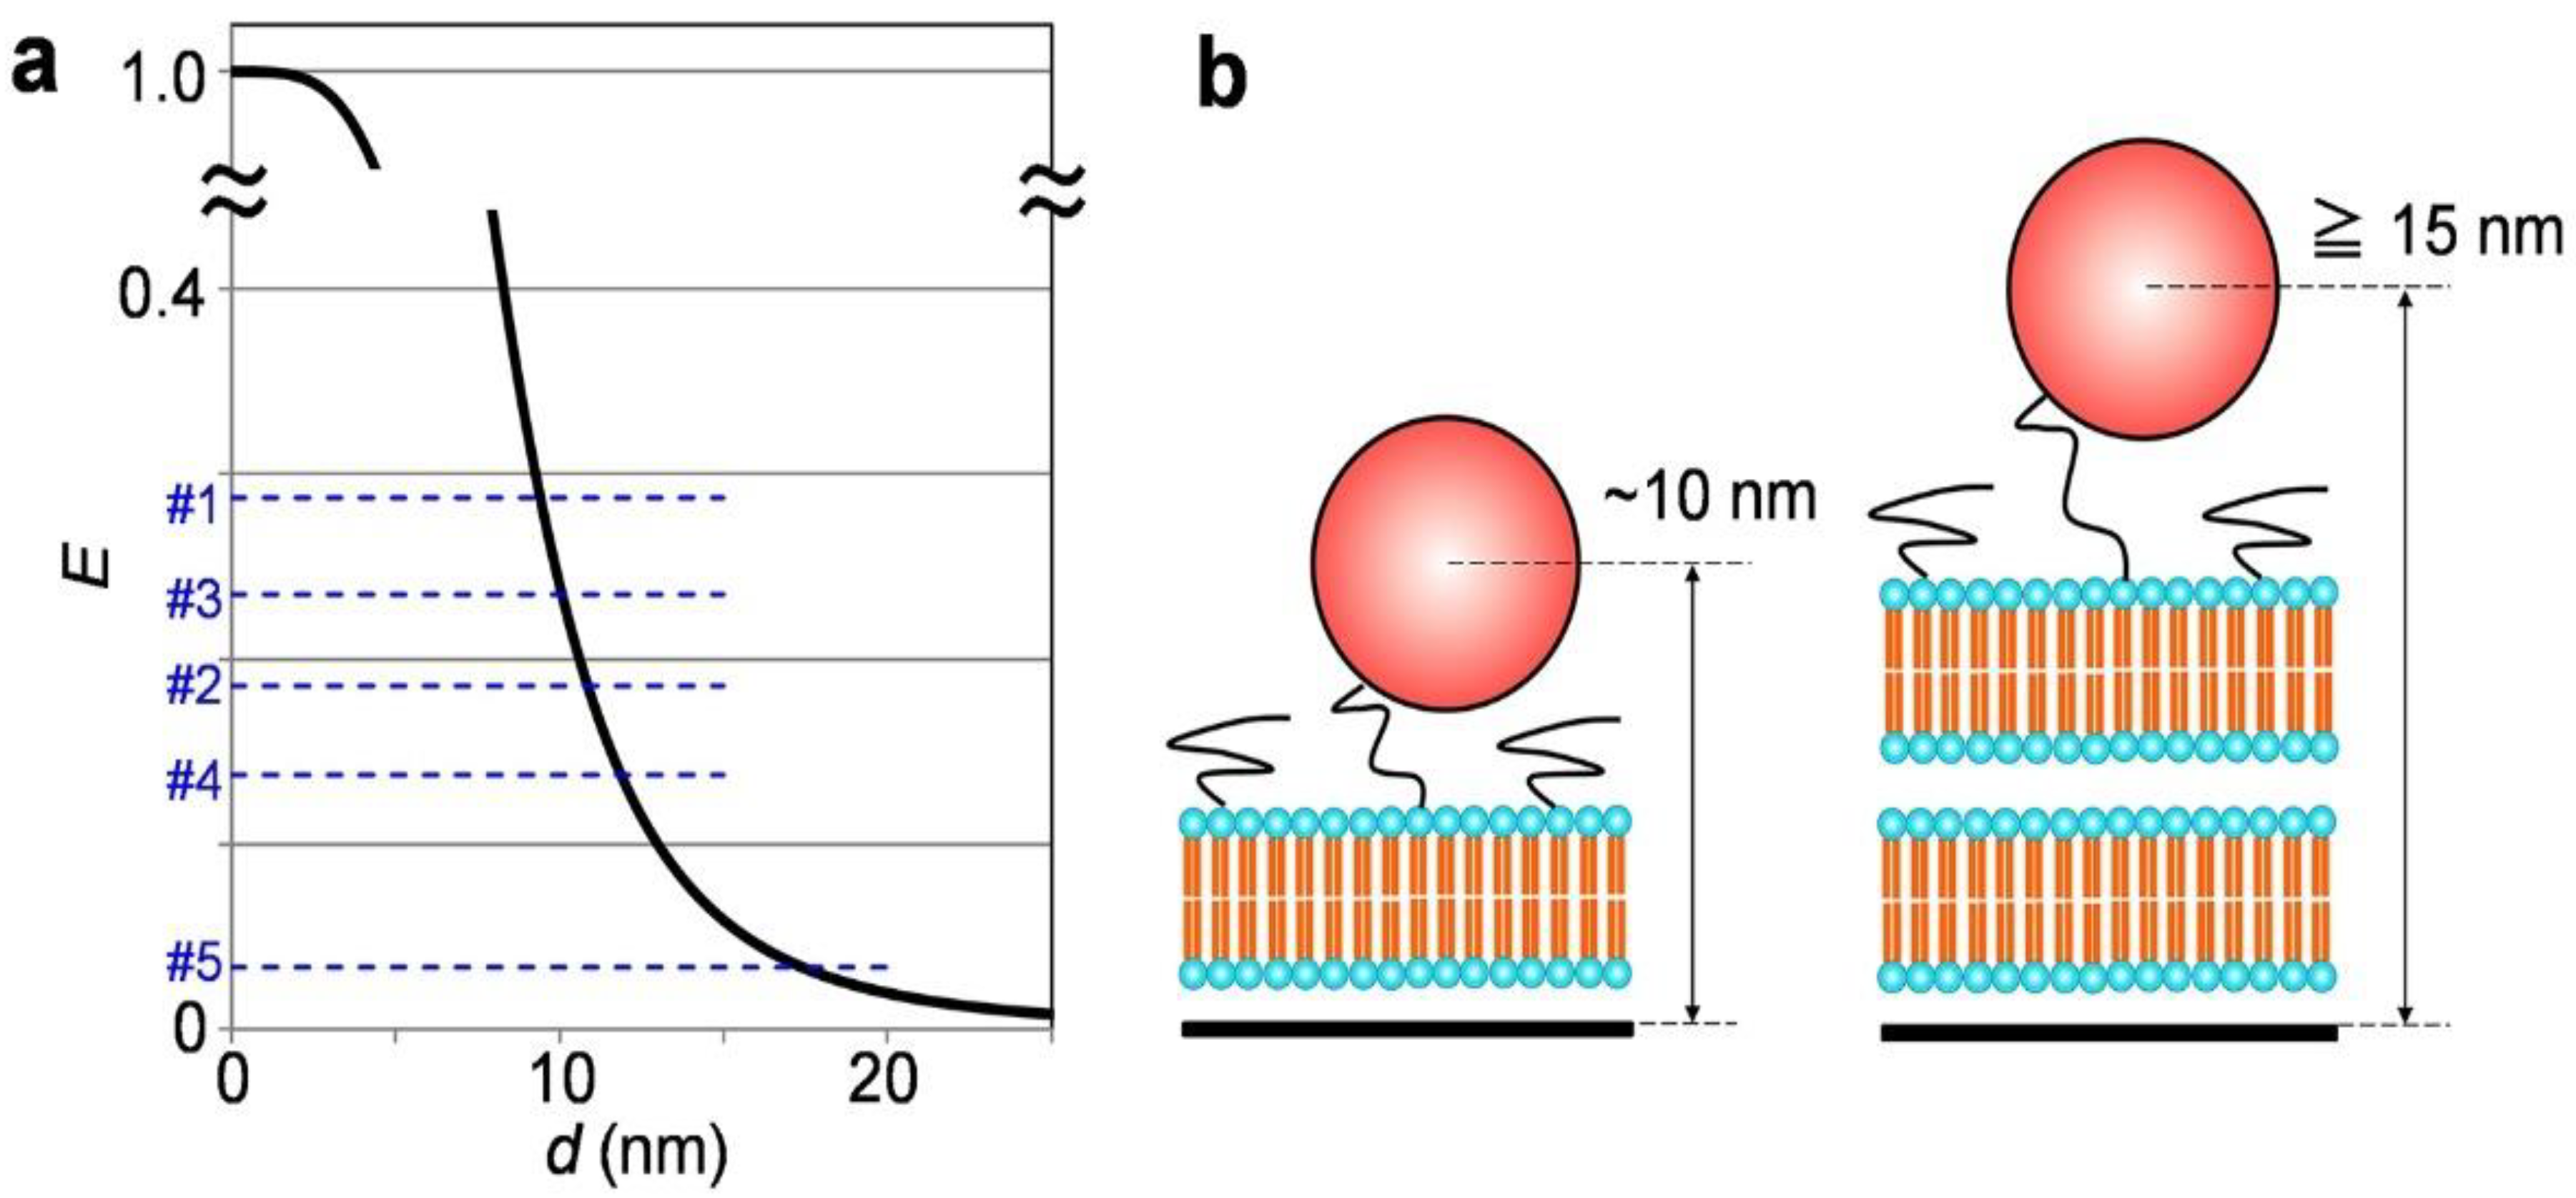
The difference in E among the QDs is attributed to the difference in the distance between the GO flake and the QD. The relationship between E and the distance from GO (d) based on Equation (1) is plotted in Figure 4a, and the values of E of QDs #1–#5 (Table 1) are indicated. The estimated d of QDs #1–4 were 9.4, 10.9, 10.1, and 11.9 nm, respectively, and d = 17.4 nm was obtained for QD #5. These values are included in Table 1. We did not calculate d for QD #6 that had a negative value of E.
The QDs used in this study have a cylindrical shape, with a longer axis of 10 nm and a diameter of 5 nm, approximately [46]. Considering the size of the QD and the thickness of a single lipid bilayer (~5 nm), d = ~10 nm obtained for QDs #1–#4 is reasonable as a distance from the GO to the center of a QD existing on a single lipid bilayer (Figure 4b, the left image). As shown in the AFM topographies in Figure 2a, double lipid bilayers also stacked on GO. The center of the QD on the double SLB positions at d = ~15 nm (Figure 4b, the right image), where the QD is rarely affected by quenching of GO as shown in Figure 4a. QDs #5 and #6, whose E was nearly zero, existed on the double lipid bilayers on GO. The difference in the quenching efficiency was attributed to the layer numbers of the lipid bilayers.
QDs are used as donor fluorophores for various FRET-based biosensing [47,48,49,50]. In the FRET theory, the energy of a molecule in the excited state is transferred by the dipole–dipole interaction from a donor to an acceptor. Despite QDs being semi-conductor particles, the energy of excited QDs also transfers to the acceptor molecule. The efficiency of the energy transfer depends on the minus six power of the distance between the QD center and the acceptor, similarly to the case of a dye molecule as a donor [51,52]. The distance dependence of Equation (1) is derived for the FRET between a dye molecule and GO [28,53], but is also valid for the FRET between a QD and GO [54,55].

4. Conclusions

Single particle observation of a QD was performed on SLBs that were formed on GO flakes on a SiO2/Si substrate. A single bilayer membrane or double bilayer membranes existed on the GO flakes. SPT measurement of the QD was achieved under the effect of GO quenching, and the fluorescence intensity of the single QD was obtained during the lateral diffusion in the regions with and without GO to evaluate the quenching efficiency. The distance between the QD and GO that was estimated from the quenching efficiency distributed ~5 nm and ~15 nm, reflecting the layer numbers of the lipid bilayers on the GO flakes. The results of this study demonstrated the evaluation of the vertical positions of a single molecule in lipid bilayers via SPT by applying the fluorescence quenching of GO.

Supplementary Materials

The following supporting information can be downloaded at: https://www.mdpi.com/article/10.3390/app12083733/s1, Figure S1: Time course of the fluorescence intensity of quantum dots; Video S1: Single particle tracking movie.

Author Contributions

Conceptualization, Y.O., S.I. and R.T.; methodology, Y.O. and R.T.; validation, Y.O., S.I. and R.T.; investigation, Y.O.; formal analysis, Y.O.; writing—original draft preparation, Y.O.; writing—review and editing, S.I. and R.T.; visualization, Y.O.; supervision, S.I. and R.T.; project administration, R.T.; funding acquisition, R.T. All authors have read and agreed to the published version of the manuscript.

Funding

This research was funded by JSPS KAKENHI Grant Nos. JP20H02690 and JP20K21125, and the Nagai Foundation for Science and Technology, Japan.

Institutional Review Board Statement

Not applicable.

Informed Consent Statement

Not applicable.

Data Availability Statement

Not applicable.

Acknowledgments

We acknowledge support from the Cooperation Research Project of the Research Institute of Electrical Communication (RIEC), Tohoku University, and the Electronics-Inspired Interdisciplinary Research Institute (EIIRIS) Project of Toyohashi University of Technology.

Conflicts of Interest

The authors declare no conflict of interest.

References

  1. Rothman, J.E. The Principle of Membrane Fusion in the Cell (Nobel Lecture). Angew. Chem. Int. Ed. 2014, 53, 12676–12694. [Google Scholar] [CrossRef] [PubMed]
  2. Tillman, T.S.; Cascio, M. Effects of membrane lipids on ion channel structure and function. Cell Biochem. Biophys. 2003, 38, 161–190. [Google Scholar] [CrossRef]
  3. Lingwood, D.; Simons, K. Lipid rafts as a membrane-organizing principle. Science 2010, 327, 46–50. [Google Scholar] [CrossRef] [PubMed] [Green Version]
  4. Moghal, M.M.R.; Hossain, F.; Yamazaki, M. Action of antimicrobial peptides and cell-penetrating peptides on membrane potential revealed by the single GUV method. Biophys. Rev. 2020, 12, 339–348. [Google Scholar] [CrossRef]
  5. Komiya, M.; Kato, M.; Tadaki, D.; Ma, T.; Yamamoto, H.; Tero, R.; Tozawa, Y.; Niwano, M.; Hirano-Iwata, A. Advances in Artificial Cell Membrane Systems as a Platform for Reconstituting Ion Channels. Chem. Rec. 2020, 20, 730–742. [Google Scholar] [CrossRef]
  6. Morigaki, K.; Tanimoto, Y. Evolution and development of model membranes for physicochemical and functional studies of the membrane lateral heterogeneity. Biochim. Biophys. Acta Biomembr. 2018, 1860, 2012–2017. [Google Scholar] [CrossRef]
  7. Khorshid, M.; Losada-Pérez, P.; Wackers, G.; Yongabi, D.; Renner, F.U.; Thoelen, R.; Wagner, P. Real-time monitoring of interactions between Ebola fusion peptide and solid-supported phospholipid membranes: Effect of peptide concentration and layer geometry. Phys. Med. 2017, 4, 1–7. [Google Scholar] [CrossRef]
  8. Uchihashi, T.; Scheuring, S. Applications of high-speed atomic force microscopy to real-time visualization of dynamic biomolecular processes. Biochim. Biophys. Acta Gen. Subj. 2018, 1862, 229–240. [Google Scholar] [CrossRef]
  9. Castellana, E.T.; Cremer, P.S. Solid supported lipid bilayers: From biophysical studies to sensor design. Surf. Sci. Rep. 2006, 61, 429–444. [Google Scholar] [CrossRef]
  10. Tanaka, M.; Sackmann, E. Polymer-supported membranes as models of the cell surface. Nature 2005, 437, 656–663. [Google Scholar] [CrossRef]
  11. Jackman, J.; Knoll, W.; Cho, N.-J. Biotechnology Applications of Tethered Lipid Bilayer Membranes. Materials 2012, 5, 2637–2657. [Google Scholar] [CrossRef] [Green Version]
  12. Tero, R. Substrate Effects on the Formation Process, Structure and Physicochemical Properties of Supported Lipid Bilayers. Materials 2012, 5, 2658–2680. [Google Scholar] [CrossRef]
  13. Cote, L.J.; Kim, J.; Tung, V.C.; Luo, J.; Kim, F.; Huang, J. Graphene oxide as surfactant sheets. Pure Appl. Chem. 2011, 83, 95–110. [Google Scholar] [CrossRef]
  14. Chen, D.; Feng, H.; Li, J. Graphene Oxide: Preparation, Functionalization, and Electrochemical Applications. Chem. Rev. 2012, 112, 6027–6053. [Google Scholar] [CrossRef]
  15. Lu, C.-H.; Yang, H.-H.; Zhu, C.-L.; Chen, X.; Chen, G.-N. A graphene platform for sensing biomolecules. Angew. Chem. Int. Ed. Engl. 2009, 48, 4785–4787. [Google Scholar] [CrossRef]
  16. Ueno, Y.; Furukawa, K.; Matsuo, K.; Inoue, S.; Hayashi, K.; Hibino, H. Molecular design for enhanced sensitivity of a FRET aptasensor built on the graphene oxide surface. Chem. Commun. 2013, 49, 10346–10348. [Google Scholar] [CrossRef] [Green Version]
  17. Loh, K.P.; Bao, Q.; Eda, G.; Chhowalla, M. Graphene oxide as a chemically tunable platform for optical applications. Nat. Chem. 2010, 2, 1015–1024. [Google Scholar] [CrossRef]
  18. Bonanni, A.; Loo, A.H.; Pumera, M. Graphene for impedimetric biosensing. TrAC Trends Anal. Chem. 2012, 37, 12–21. [Google Scholar] [CrossRef]
  19. Li, J.-L.; Bao, H.-C.; Hou, X.-L.; Sun, L.; Wang, X.-G.; Gu, M. Graphene Oxide Nanoparticles as a Nonbleaching Optical Probe for Two-Photon Luminescence Imaging and Cell Therapy. Angew. Chemie Int. Ed. 2012, 51, 1830–1834. [Google Scholar] [CrossRef]
  20. Goto, Y.; Yoshida, N.; Umeyama, Y.; Yamada, T.; Tero, R.; Hiraishi, A. Enhancement of Electricity Production by Graphene Oxide in Soil Microbial Fuel Cells and Plant Microbial Fuel Cells. Front. Bioeng. Biotechnol. 2015, 3, 42. [Google Scholar] [CrossRef] [Green Version]
  21. Ganguly, S.; Das, P.; Maity, P.P.; Mondal, S.; Ghosh, S.; Dhara, S.; Das, N.C. Green Reduced Graphene Oxide Toughened Semi-IPN Monolith Hydrogel as Dual Responsive Drug Release System: Rheological, Physicomechanical, and Electrical Evaluations. J. Phys. Chem. B 2018, 122, 7201–7218. [Google Scholar] [CrossRef]
  22. Ghosh, S.; Ganguly, S.; Das, P.; Das, T.K.; Bose, M.; Singha, N.K.; Das, A.K.; Das, N.C. Fabrication of Reduced Graphene Oxide/Silver Nanoparticles Decorated Conductive Cotton Fabric for High Performing Electromagnetic Interference Shielding and Antibacterial Application. Fibers Polym. 2019, 20, 1161–1171. [Google Scholar] [CrossRef]
  23. Kim, J.; Kim, F.; Huang, J. Seeing graphene-based sheets. Mater. Today 2010, 13, 28–38. [Google Scholar] [CrossRef]
  24. Lu, C.; Li, J.; Zhang, X.; Zheng, A.; Yang, H.; Chen, X.; Chen, G.-N. General approach for monitoring peptide-protein interactions based on graphene-peptide complex. Anal. Chem. 2011, 83, 7276–7282. [Google Scholar] [CrossRef]
  25. Huang, A.; Li, W.; Shi, S.; Yao, T. Quantitative Fluorescence Quenching on Antibody-conjugated Graphene Oxide as a Platform for Protein Sensing. Sci. Rep. 2017, 7, 40772. [Google Scholar] [CrossRef] [Green Version]
  26. Swathi, R.S.; Sebastian, K.L. Resonance energy transfer from a dye molecule to graphene. J. Chem. Phys. 2008, 129, 054703. [Google Scholar] [CrossRef]
  27. Swathi, R.S.; Sebastian, K.L. Long range resonance energy transfer from a dye molecule to graphene has (distance)(-4) dependence. J. Chem. Phys. 2009, 130, 086101. [Google Scholar] [CrossRef]
  28. Huang, P.-J.J.; Liu, J. DNA-Length-Dependent Fluorescence Signaling on Graphene Oxide Surface. Small 2012, 8, 977–983. [Google Scholar] [CrossRef] [Green Version]
  29. Okamoto, Y.; Tsuzuki, K.; Iwasa, S.; Ishikawa, R.; Sandhu, A.; Tero, R. Fabrication of Supported Lipid Bilayer on Graphene Oxide. J. Phys. Conf. Ser. 2012, 352, 012017. [Google Scholar] [CrossRef]
  30. Okamoto, Y.; Motegi, T.; Iwasa, S.; Sandhu, A.; Tero, R. Fluidity evaluation of cell membrane model formed on graphene oxide with single particle tracking using quantum dot. Jpn. J. Appl. Phys. 2015, 54, 04DL09. [Google Scholar] [CrossRef]
  31. Hummers, W.S., Jr.; Offeman, R.E. Preparation of graphitic oxide. J. Am. Chem. Soc. 1958, 80, 1339. [Google Scholar] [CrossRef]
  32. Tung, V.C.; Allen, M.J.; Yang, Y.; Kaner, R.B. High-throughput solution processing of large-scale graphene. Nat. Nanotechnol. 2009, 4, 25–29. [Google Scholar] [CrossRef] [PubMed]
  33. Tsuzuki, K.; Okamoto, Y.; Iwasa, S.; Ishikawa, R.; Sandhu, A.; Tero, R. Reduced Graphene Oxide as the Support for Lipid Bilayer Membrane. J. Phys. Conf. Ser. 2012, 352, 012016. [Google Scholar] [CrossRef] [Green Version]
  34. Richter, R.P.; Bérat, R.; Brisson, A.R. Formation of solid-supported lipid bilayers: An integrated view. Langmuir 2006, 22, 3497–3505. [Google Scholar] [CrossRef]
  35. Murcia, M.J.; Minner, D.E.; Mustata, G.-M.; Ritchie, K.; Naumann, C.A. Design of quantum dot-conjugated lipids for long-term, high-speed tracking experiments on cell surfaces. J. Am. Chem. Soc. 2008, 130, 15054–15062. [Google Scholar] [CrossRef] [Green Version]
  36. Tero, R.; Sazaki, G.; Ujihara, T.; Urisu, T. Anomalous Diffusion in Supported Lipid Bilayers Induced by Oxide Surface Nanostructures. Langmuir 2011, 27, 9662–9665. [Google Scholar] [CrossRef]
  37. Okamoto, Y.; Motegi, T.; Morita, K.; Takagi, T.; Amii, H.; Kanamori, T.; Sonoyama, M.; Tero, R. Lateral Diffusion and Molecular Interaction in a Bilayer Membrane Consisting of Partially Fluorinated Phospholipids. Langmuir 2016, 32, 10712–10718. [Google Scholar] [CrossRef]
  38. Motegi, T.; Yamazaki, K.; Ogino, T.; Tero, R. Substrate-Induced Structure and Molecular Dynamics in a Lipid Bilayer Membrane. Langmuir 2017, 33, 14748–14755. [Google Scholar] [CrossRef]
  39. Sbalzarini, I.F.; Koumoutsakos, P. Feature point tracking and trajectory analysis for video imaging in cell biology. J. Struct. Biol. 2005, 151, 182–195. [Google Scholar] [CrossRef]
  40. Maekawa, T.; Chin, H.; Nyu, T.; Sut, T.N.; Ferhan, A.R.; Hayashi, T.; Cho, N.J. Molecular diffusion and nano-mechanical properties of multi-phase supported lipid bilayers. Phys. Chem. Chem. Phys. 2019, 21, 16686–16693. [Google Scholar] [CrossRef]
  41. Kakimoto, Y.; Tachihara, Y.; Okamoto, Y.; Miyazawa, K.; Fukuma, T.; Tero, R. Morphology and Physical Properties of Hydrophilic-Polymer-Modified Lipids in Supported Lipid Bilayers. Langmuir 2018, 34, 7201–7209. [Google Scholar] [CrossRef]
  42. Kaufmann, S.; Borisov, O.; Textor, M.; Reimhult, E. Mechanical properties of mushroom and brush poly(ethylene glycol)-phospholipid membranes. Soft Matter 2011, 7, 9267–9275. [Google Scholar] [CrossRef]
  43. Tero, R.; Watanabe, H.; Urisu, T. Supported phospholipid bilayer formation on hydrophilicity-controlled silicon dioxide surfaces. Phys. Chem. Chem. Phys. 2006, 8, 3885–3894. [Google Scholar] [CrossRef]
  44. Hayashi, T.; Tanaka, Y.; Koide, Y.; Tanaka, M.; Hara, M. Mechanism underlying bioinertness of self-assembled monolayers of oligo(ethyleneglycol)-terminated alkanethiols on gold: Protein adsorption, platelet adhesion, and surface forces. Phys. Chem. Chem. Phys. 2012, 14, 10196–10206. [Google Scholar] [CrossRef]
  45. Hu, Z.; Liu, S.; Qin, H.; Zhou, J.; Peng, X. Oxygen Stabilizes Photoluminescence of CdSe/CdS Core/Shell Quantum Dots via Deionization. J. Am. Chem. Soc. 2020, 142, 4254–4264. [Google Scholar] [CrossRef]
  46. Watson, A.; Wu, X.; Bruchez, M. Lighting Up Cells with Quantum Dots. Biotechniques 2003, 34, 296–303. [Google Scholar] [CrossRef]
  47. Sapsford, K.E.; Berti, L.; Medintz, I.L. Materials for Fluorescence Resonance Energy Transfer Analysis: Beyond Traditional Donor–Acceptor Combinations. Angew. Chemie Int. Ed. 2006, 45, 4562–4589. [Google Scholar] [CrossRef]
  48. Resch-Genger, U.; Grabolle, M.; Cavaliere-Jaricot, S.; Nitschke, R.; Nann, T. Quantum dots versus organic dyes as fluorescent labels. Nat. Methods 2008, 5, 763–775. [Google Scholar] [CrossRef]
  49. Medintz, I.L.; Mattoussi, H. Quantum dot-based resonance energy transfer and its growing application in biology. Phys. Chem. Chem. Phys. 2009, 11, 17–45. [Google Scholar] [CrossRef]
  50. Wegner, K.D.; Hildebrandt, N. Quantum dots: Bright and versatile in vitro and in vivo fluorescence imaging biosensors. Chem. Soc. Rev. 2015, 44, 4792–4834. [Google Scholar] [CrossRef] [Green Version]
  51. Clapp, A.R.; Medintz, I.L.; Mattoussi, H. Förster resonance energy transfer investigations using quantum-dot fluorophores. Chemphyschem 2006, 7, 47–57. [Google Scholar] [CrossRef]
  52. Medintz, I.L.; Clapp, A.R.; Mattoussi, H.; Goldman, E.R.; Fisher, B.; Mauro, J.M. Self-assembled nanoscale biosensors based on quantum dot FRET donors. Nat. Mater. 2003, 2, 630–638. [Google Scholar] [CrossRef]
  53. Gaudreau, L.; Tielrooij, K.J.; Prawiroatmodjo, G.E.D.K.; Osmond, J.; de Abajo, F.J.G.; Koppens, F.H.L. Universal Distance-Scaling of Nonradiative Energy Transfer to Graphene. Nano Lett. 2013, 13, 2030–2035. [Google Scholar] [CrossRef] [Green Version]
  54. Morales-Narváez, E.; Pérez-López, B.; Pires, L.B.; Merkoçi, A. Simple Förster resonance energy transfer evidence for the ultrahigh quantum dot quenching efficiency by graphene oxide compared to other carbon structures. Carbon N. Y. 2012, 50, 2987–2993. [Google Scholar] [CrossRef]
  55. Morales-Narváez, E.; Merkoçi, A. Graphene Oxide as an Optical Biosensing Platform: A Progress Report. Adv. Mater. 2019, 31, 1805043. [Google Scholar] [CrossRef] [Green Version]
Figure 1. Schematic comparing the distance dependence of the FRET efficiency between a dye molecule and GO. The abscissa and ordinate axes represent the FRET efficiency (E) and the distance (d), respectively. The effective range of the FRET to GO, whose rate of energy transfer (Reg) depends on d−4, reaches longer than that to dye molecules, whose Reg depends on d−6. The typical thickness of a single lipid bilayer membrane is indicated.
Applsci 12 03733 g001
Figure 2. AFM topographies of DOPC-SLB containing PEG-DSPE on the SiO2/Si substrates (a,b) with and (c,d) without GO, and their cross-section profiles at the white lines. CPEG = (a,c) 5.0%, and (b,d) 7.5%. Scale bar = 500 nm.
Applsci 12 03733 g002
Figure 3. (a) A single particle image of QDs conjugated on DOPC-SLB including DPPTE (5 × 10⁻⁷ mol%) and PEG-DSPE (CPEG = 5.0 mol%) on the GO/SiO2/Si substrate. Representative mobile and immobile QDs are indicated with the white arrow and black arrows, respectively. Scale bar = 5 μm. (b) The diffusion trajectory of the QD indicated by the white arrow in (a). Blue and red parts depict the trajectory in the GO region, and the SiO2 region without GO, respectively. (c) Time trace of the fluorescence intensity of the QD during the diffusion in (b). The intensities obtained in the GO region and the SiO2 region without GO are depicted in blue and red, respectively. The histogram of the fluorescence intensity in each region is illustrated on the right. The average intensity of each region is indicated with the dotted line.
Applsci 12 03733 g003
Figure 4. (a) Relationship between the quenching efficiency (E) and the distance from GO (d) based on Equation (1). The values of E of QDs #1–#5 (Table 1) are indicated with dotted lines. (b) Schematics representing d of a QD on a single lipid bilayer (left) and on double lipid bilayers (right).
Applsci 12 03733 g004
Table 1. Quenching efficiency (E) and distance from GO (d) of QDs.
NumberIGO (a.u.)ISiO2 (a.u.)Ed (nm)
1 a14.420.20.299.4
2 b14.517.80.1910.9
3 b22.529.40.2310.1
4 b15.117.50.1311.9
5 b20.220.90.0317.4
6 b13.312.9−0.03-
a Figure 3c. b Figure S1a–e, respectively.
Publisher’s Note: MDPI stays neutral with regard to jurisdictional claims in published maps and institutional affiliations.