Article

Thermophysical Characterization of a Thermoregulating Interior Coating Containing a Bio-Sourced Phase Change Material

1
Univ. Artois, IMT Nord Europe, Junia, Univ. Lille, ULR 4515, Laboratoire de Génie Civil et Géo-Environnement (LGCgE), F-62400 Béthune, France
2
Winco Technologies, Technopôle Saint-Brieuc Armor, 5 rue Sophie Germain, 22440 Ploufragan, France
*
Author to whom correspondence should be addressed.
Appl. Sci. 2022, 12(8), 3827; https://doi.org/10.3390/app12083827
Submission received: 1 March 2022 / Revised: 5 April 2022 / Accepted: 7 April 2022 / Published: 10 April 2022
(This article belongs to the Special Issue The Application of Phase Change Materials in Heat Storage)

Abstract

:
This paper presents the work carried out as part of a study of a proactive interior coating based on both plaster and a phase change material (PCM), intended to improve the energy efficiency of buildings. This bio-based PCM is composed of a mixture of vegetable oils, methyl stearate, and methyl palmitate micro-encapsulated into polymer capsules. These components with distinct thermal properties constitute a mixture that displays supercooling and proves difficult to characterize using methods known in the literature. This article focuses on the thermophysical characterization (i.e., thermal conductivities, thermal capacities, latent heat, melting temperatures) and numerical modeling of a sample of this coating tested in the laboratory. This characterization is derived from experimental measurements carried out on a fluxmeter bench and by inverse methods. A new model of PCM composite characterization is presented and simulated using Python; the output shows a high degree of accuracy in describing the thermal behavior of the coating, regardless of the thermal stress applied, even making it possible to represent the phenomenon of supercooling or partial melting/solidification.

1. Introduction

The building sector is critical in the effort to move towards carbon neutrality in France. In 2019, it was responsible for 20% of greenhouse gas emissions and accounted for 46% of all energy consumption. This consumption level grew continuously between 1990 and 2001, the year when it reached its peak. In 2018, 82% of CO2 emissions in the residential sector were generated by the heating of buildings [1]. In the current context of energy transition and the fight against global warming, the building sector is indeed a priority with great potential for improvement. Major renovations are necessary to reduce the energy and environmental impact of built structures and comply with the requirements for an energy transition. It has thus become necessary to design tools and materials to enhance not only energy performance but also the building environment and life cycle, while preserving the health and well-being of its occupants. This study is focused on the energy storage in a coating, by using phase change materials (PCMs) to reduce energy consumption in buildings. These PCMs are materials that can transition between solid and liquid phases, reversibly, and exchange energy with their environment. They melt when reaching the corresponding melting temperature, in absorbing heat and releasing it later once the temperature has dropped and then solidifying. These materials have a high latent energy per unit volume. If this amount of energy is high, the heat storage/release properties will be more attractive. PCM stores more energy than a conventional building material, such as brick, with an equal mass. Thus, latent heat and sensible heat together constitute the total amount of energy the PCM can store.
Several types of PCM exist, including hydrated salts, paraffin, fatty acids, and eutectics of organic and non-organic compounds. A. Abhat [2] established a classification (Figure 1) of a large number of PCMs potentially used for energy storage, grouped into four families: paraffin, organic, inorganic, and eutectic. This author also detailed the main selection criteria for these materials (Table 1). However, PCMs must satisfy several technical requirements, such as chemical stability and toxicity [3,4], to ensure safe use.
As detailed in Figure 1, the range of PCMs is quite wide, featuring various thermophysical properties and paving the way for many possible uses. Hence, energy storage technologies, thanks to the use of phase change materials (PCMs), are used in many fields. M.M. Farid et al. [5] described the primary uses for these types of materials. Nasa [6] introduced certain paraffin-based PCMs (dodecane, hexadecane) in energy storage modules that served to control the temperature of the rover batteries used on Mars, by means of damping extreme temperature variations. A. Hasan et al. [7] also dealt with the application of PCMs (paraffin, salt, milk fat) for thermal control, but especially for cooling electronic packaging to keep the temperature below a safety limit (60 °C). J.D. Renteria et al. [8] used a PCM combined with graphene to reduce overheating in electric batteries; in this case, adding graphene improved the thermal conductivity of the PCM in order to enhance the thermal exchanges. Other authors, e.g., F. Frusteri et al. [9], used an inorganic salt-based PCM and combined it with a conventional material, namely carbon fiber, to increase thermal conductivity and evaluate the thermal storage properties. It is also possible to produce solar energy storage with PCMs, which constitutes one of the main advantages of this type of material. In the literature, X. Xiao et al. [10] studied mixtures with nitrates/expanded graphite and PCMs to obtain a composite material for solar energy storage; they showed that certain additives improve the thermal conductivity of the PCM and thus upgrade its storage efficiency.
For the past few decades, several research approaches have been pursued on using PCMs in the building field, primarily to improve thermal comfort and/or reduce energy consumption. M.M. Farid et al. [5] and A.M. Khudhair et al. [11] analyzed the various types of PCM used in the civil engineering sector. Their work discussed the integration of PCMs into walls, floor heating systems, and ceilings. I.O. Salyer et al. [12] even used PCMs to fireproof building materials and delay the outbreak of fire.
This study combines PCM with a plaster-based interior coating in order to store energy. The proactive coating (ETMV 8) presented here incorporates a micro-encapsulated vegetable oil-based phase change material (named Inertek 23), which is mainly methyl palmitate as well as methyl stearate (naturally present in many plant species). Similar studies were conducted in Florida by M. Shapiro [13], who demonstrated that methyl palmitate and methyl stearate mixtures are perfectly suitable for use in gypsum boards given their thermal storage and high latent heat. Other authors have employed mixtures based on methyl palmitate and stearate in combination with other construction materials such as concrete. The research conducted by L.C. Liston [14] showed that using such a fatty acid mixture as a PCM can improve the thermal performance of concrete. For their part, R. Nikolić et al. [15] performed a very detailed analysis of these two fatty acids and concluded that combining the two yields the most promising PCM for energy storage in the construction industry.
The phase change material used in this study (Intertek 23) offers the advantage of being compatible with other conventional building materials. Combined with a coating intended for an interior overlay application, it could be useful in reducing temperature fluctuations and smoothing out heat spikes by absorbing excess during summer or, if it proves to be efficient, the off-season as well.
This type of material is also attractive during winter, thanks to the storage and return of free energy obtained from solar radiation. This feature could have the effect of delaying the start of the heating system while reducing the sensation of a cold wall, which constitutes a source of discomfort in the building. To evaluate the efficiency and usefulness of such a product, it is essential to characterize and test it in situ. Generally speaking, the main thermal characteristics of PCMs, namely latent heat, phase-change temperatures, and enthalpy, are obtained by means of differential scanning calorimetry (DSC), which is one of the most widely used techniques to study reactions related to the transformation of a material subjected to temperature constraints. The underlying principle is to measure the temperature difference between an analyzed sample and an inert material, which does not undergo a phase change and serves as a reference [16]. When the sample is subjected to temperature stress, it will absorb or release heat, which is then quantified by measuring the change in heat flux. This method has some limitations [17] due, among other things, to the fact that only a very small quantity (a few milligrams) of material can be tested. Indeed, small mass samples are not representative of the thermal behavior of a material on a large scale [18,19]. In addition, the heating rate affects DSC results and can induce errors in the determination of thermal properties [20]. Non-DSC methods rely on enthalpy evolution to study the thermodynamic behavior of PCMs. According to M. Thonon et al. [21], most of these other methods, which generally consider the PCM as a binary solution, have limitations and do not always correctly represent the PCM thermal behavior. Moreover, the fatty acid mixture studied here is not a binary solution. Indeed, the two components of Inertek 23, i.e., methyl palmitate and methyl stearate, display completely different thermal properties (Figure 1b). Let’s also note that the transitions between solid/liquid phases during the state changes of the two materials do not occur over the same temperature range. The supercooling phenomena that may occur in mixtures are difficult to analyze with the classical methods reported in the literature. Supercooling reflects the ability of the PCM to lower its temperature below the crystallization point while remaining in liquid form. This supercooling effect can be a drawback if the degree of supercooling is too high by virtue of preventing energy discharge of the PCM [22]. Under these conditions, the stored heat is released at a temperature below the PCM melting temperature.
This article presents the thermophysical characterization of a coating (ETMV 8) sample tested in the laboratory. The sample’s properties are determined through experimental measurements (conducted in LGCgE laboratory on a fluxmeter bench) combined with identification techniques using inverse methods, by relying on a new numerical model. This numerical model is necessary to reliably represent the thermal behavior of the coating during solid/liquid phase transitions. This numerical model is also intended to integrate a thermal simulation software at the building scale.
The thermophysical characterization is performed during the melting and solidification phases of the PCM. The particularities of this PCM are that it is encapsulated and issued from a mixture of two PCM. This produces a specific thermal behavior of the material which is little dealt with in the literature. The melting of the PCM mixture shows a progressive melting of the two PCM in a simultaneous way. On the other hand, on cooling the material exposes the phenomenon of supercooling and shows a dissociated solidification of the two mixed PCM. To establish the numerical model of the composite material (gypsum + microencapsulated PCM), temperature ramps of varying lengths were imposed on the material, corresponding to the thermal dynamics observed in buildings, which is the aimed application for this material. The very different heating and cooling behavior of the PCM associated with the supercooling phenomenon is an issue for the choice of the analytical model. Many researchers [23] consider the assumption of a hysteresis, which implies different enthalpy curves for melting and solidification of the material. Other researchers believe that this is not thermodynamically correct, that the enthalpy curve is unique in both heating and cooling [24], and this is what we found in previous studies [25] of another micro-encapsulated MCP (BASF Micronal 5001DX) mixed with cement mortar. In the present state of our research, we have not found any other solution than to consider this hysteresis. Having two enthalpy curves for the same material introduces a problem during incomplete melting or solidification since it is necessary to “switch” from one curve to the other when the heating or cooling process is reversed. This “switch” is not to be underestimated because it can be frequently encountered when the energy gains in the building are not sufficient to completely melt the PCM in the thickness of the coating or when the night temperatures in the building are not low enough to allow the release of all the energy stored during the day by the coating. The fact of “jumping” from one curve to another has consequences from a numerical point of view by introducing either errors in the energy balance or temperature steps in the PCM. Methods (hysteresis models “curve track”, “curve switch” and “curve scale”) to deal with this problem have been provided by different authors [26,27,28]. We will specify which method we have chosen. One point that should be highlighted for this paper is the introduction of Gumbel’s law to deal with phase transitions. Long temperature ramps in cooling show supercooling of PCM and two distinct peaks of energy release at different temperatures. Gumbel’s law has the advantage of being an asymmetric law which allows by its form to model the progressive melting process and the more abrupt release of energy at the time of solidification of the PCM. This law has been associated with a binary solution formulation in order to model the thermal behavior of the two mixed PCMs.
The identification of thermophysical properties and the development of a reliable model are essential to model the thermal behavior of the coating at the building scale.

2. Thermal Characterization

2.1. ETMV 8 Sample

Let’s note that the ETMV 8 is a composite plaster-based material that incorporates a bio-based phase change material, called Inertek 23. The feasibility of such an environmentally friendly mixture has been demonstrated by many authors [29,30,31]. This PCM is a mixture of two vegetable oils encapsulated in polymer microcapsules. The sealed microcapsules, with a diameter ranging from 5 to 25 µm, are produced by polymerization. The encapsulation process allows the mixing of PCM with other building materials [32,33] and moreover provides optimal protection for PCM, thus ensuring a thermal storage capacity of 180 kJ/kg (Figure 2), as measured by the manufacturer [34].
ISO 9001-certified, Inertek 23 has a long lifespan and maintains stable thermal properties over time even after several hundred heating-cooling cycles [34]. According to its manufacturer, this PCM is perfectly resistant to temperature constraints ranging from 6° to 33 °C without affecting its performance. The melting range lies between 23° and 27 °C (Figure 2) with a peak at 25 °C, which turns out to be an attractive property for the specific objectives of saving energy and improving building comfort. On the other hand, solidification starts at 23 °C and ends below 19 °C. The ETMV 8 composition is given in Table 2.
The ETMV 8 coating (plaster + PCM (Table 2)) was poured to a thickness of 1.05 cm between two gypsum boards of dimensions 25 × 25 × 1.25 cm3 each. This coating was supplied by the manufacturer ready for use. The complete sample obtained (Figure 3), weighing 1.68 kg (dry weight, at 60 days) and sized 25 × 25 × 3.55 cm3, was dried at room temperature (approx. 20 °C, relative humidity around 50%).
The gypsum board has a density of 814 kg·m−3, while the ETMV 8 density equals 610 kg·m−3. It was decided to place the plaster between 2 gypsum boards in order to obtain homogeneous plaster compactness and constant thickness over the entire sample. The thermophysical properties of the gypsum board were determined based on heat flux and temperature measurements performed on a fluxmeter bench coupled with an inverse method, as in previous works [25].

2.2. Experimental Measurement Method

The LGCgE fluxmeter measurement bench is schematically presented in Figure 4; its various uses are detailed in [21,25,35,36,37].
The underlying principle consists of placing the sample between two exchange plates in order to impose a homogeneous surface temperature on both sides [25]. To limit lateral heat loss and ensure a 1D transfer through the coating and gypsum boards, a guard ring made of insulating material was positioned on the lateral faces of the sample. Each exchanger plate was connected to a thermostatic bath to control the temperature stresses applied to both sides of the material. The heat flux and temperature on each side of the sample were measured throughout the test using tangential gradient fluxmeters [38] integrating a thermocouple at the center.
For our case study, the temperature loadings varied between 10° and 30 °C in order to force the PCM to undergo melting and solidification cycles. From measurements carried out on the sample surface and through the use of the inverse method, the thermophysical properties of the coating, such as thermal conductivity, latent heat, specific heat capacity, and melting temperature, can be identified [37]. The temperatures imposed and measured on the sample faces constitute the input data (boundary conditions) for the numerical model, while the experimental heat fluxes serve for optimization by minimizing the difference between the numerically calculated and experimental heat fluxes. The objective is to identify, by means of inverse methods [39,40], the parameters of the numerical model that minimize an objective function. This function represents the quadratic difference between the numerically simulated heat fluxes and the experimentally measured fluxes, to the left and right of the sample; it is calculated as the difference between the experimental and theoretical heat fluxes on both sides of the sample according to the following formula:
f o b j =   ( ϕ l e f t   e x p ϕ l e f t   c a l ) 2 + ( ϕ r i g h t   e x p     ϕ r i g h t   c a l ) 2
As such, during the first step of the characterization process, this method determines the thermophysical properties of the gypsum boards alone. At the present time, the thermal properties of gypsum boards are considered to be known (Table 3).
In a second step, the system (sample) under consideration is the sandwich composed of coating surrounded by gypsum boards.

3. Numerical Modeling on Python

3.1. Binary Solution Model and Its Limitations

To analyze the coating presented in this study, it was first necessary to identify an existing model from the literature capable of describing the thermal behavior of the Inertek 23 PCM-based composite on two bio-based PCMs. Figure 5 below shows the evolution of the heat flux measured experimentally on the sandwich (gypsum board/ETMV 8 coating/gypsum board). The progressive melting, as well as the sudden flux peak during cooling, seems to be similar to the thermal behavior of a known binary solution studied previously [35] (composite material containing encapsulated-PCM).
At the beginning of melting ( Applsci 12 03827 i001
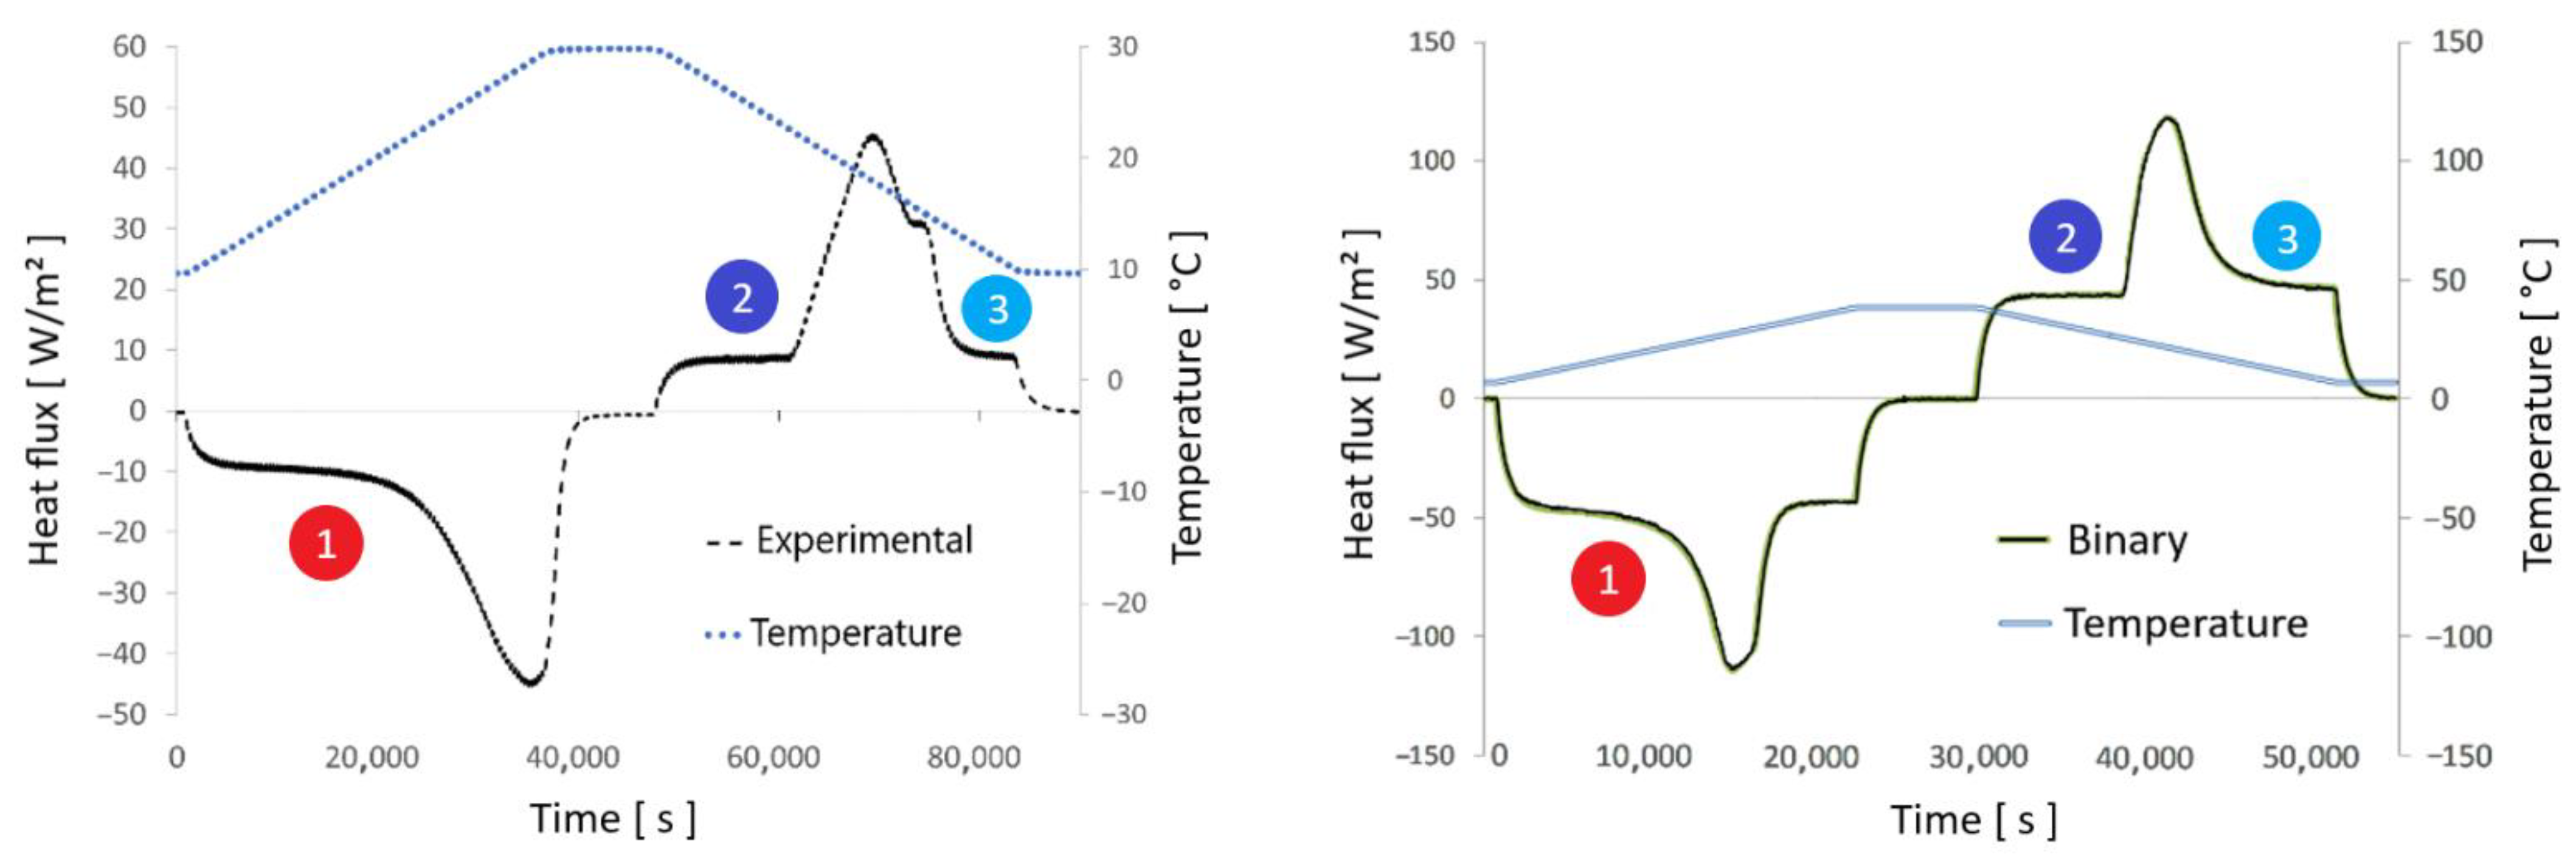
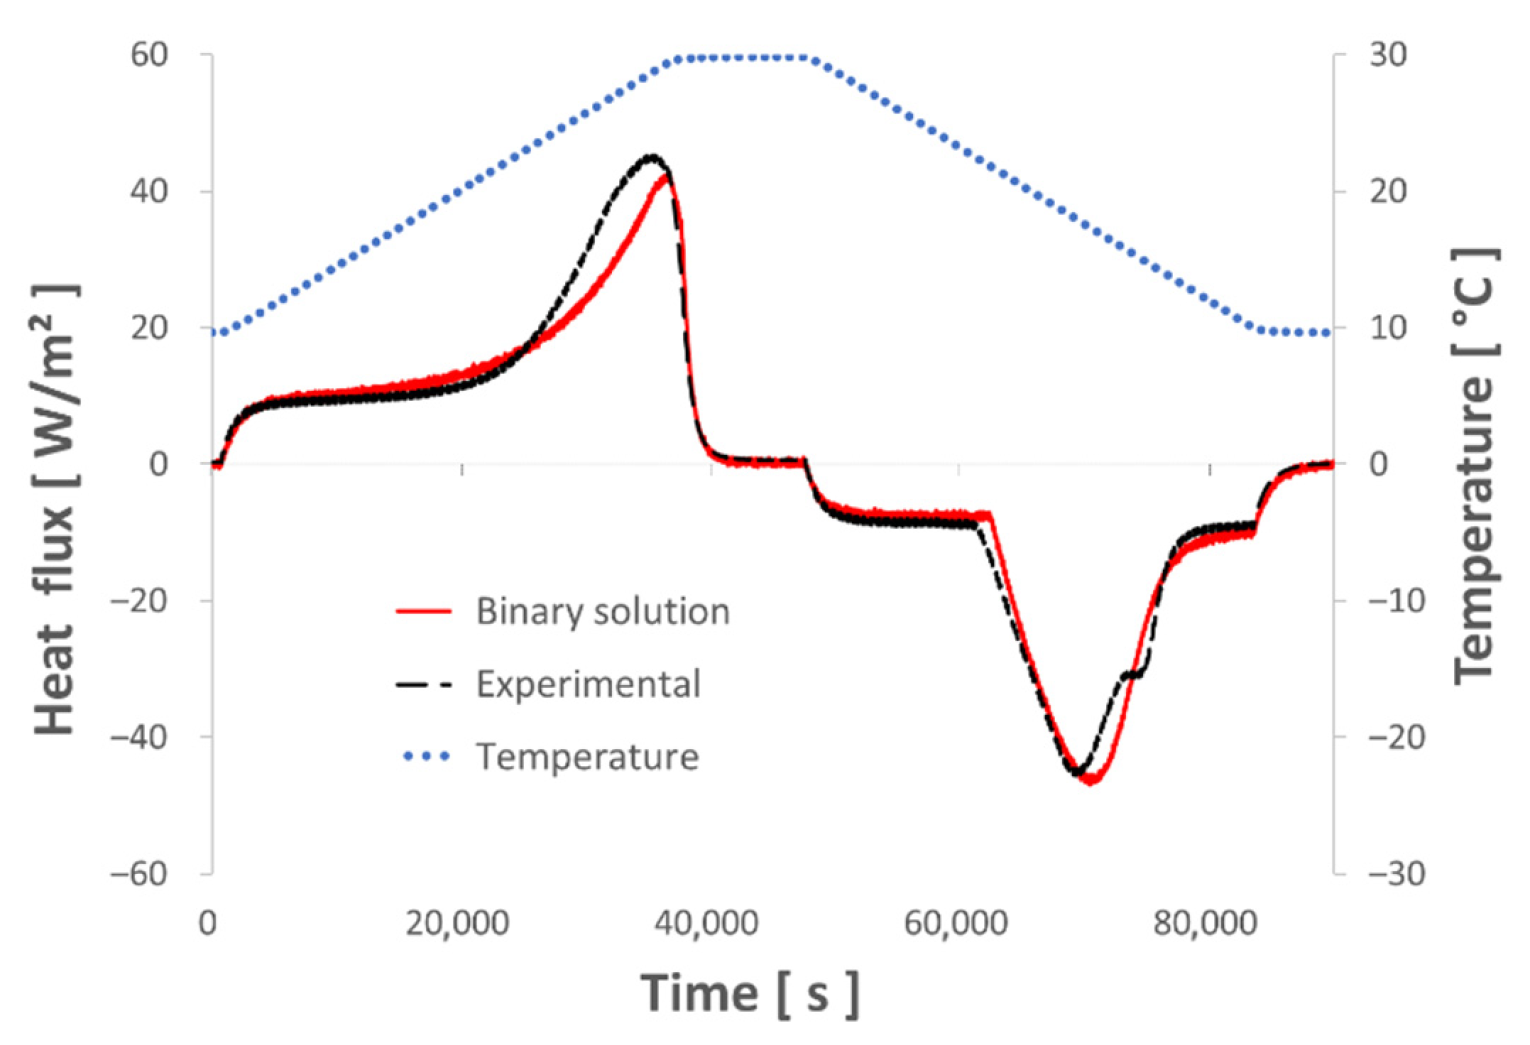
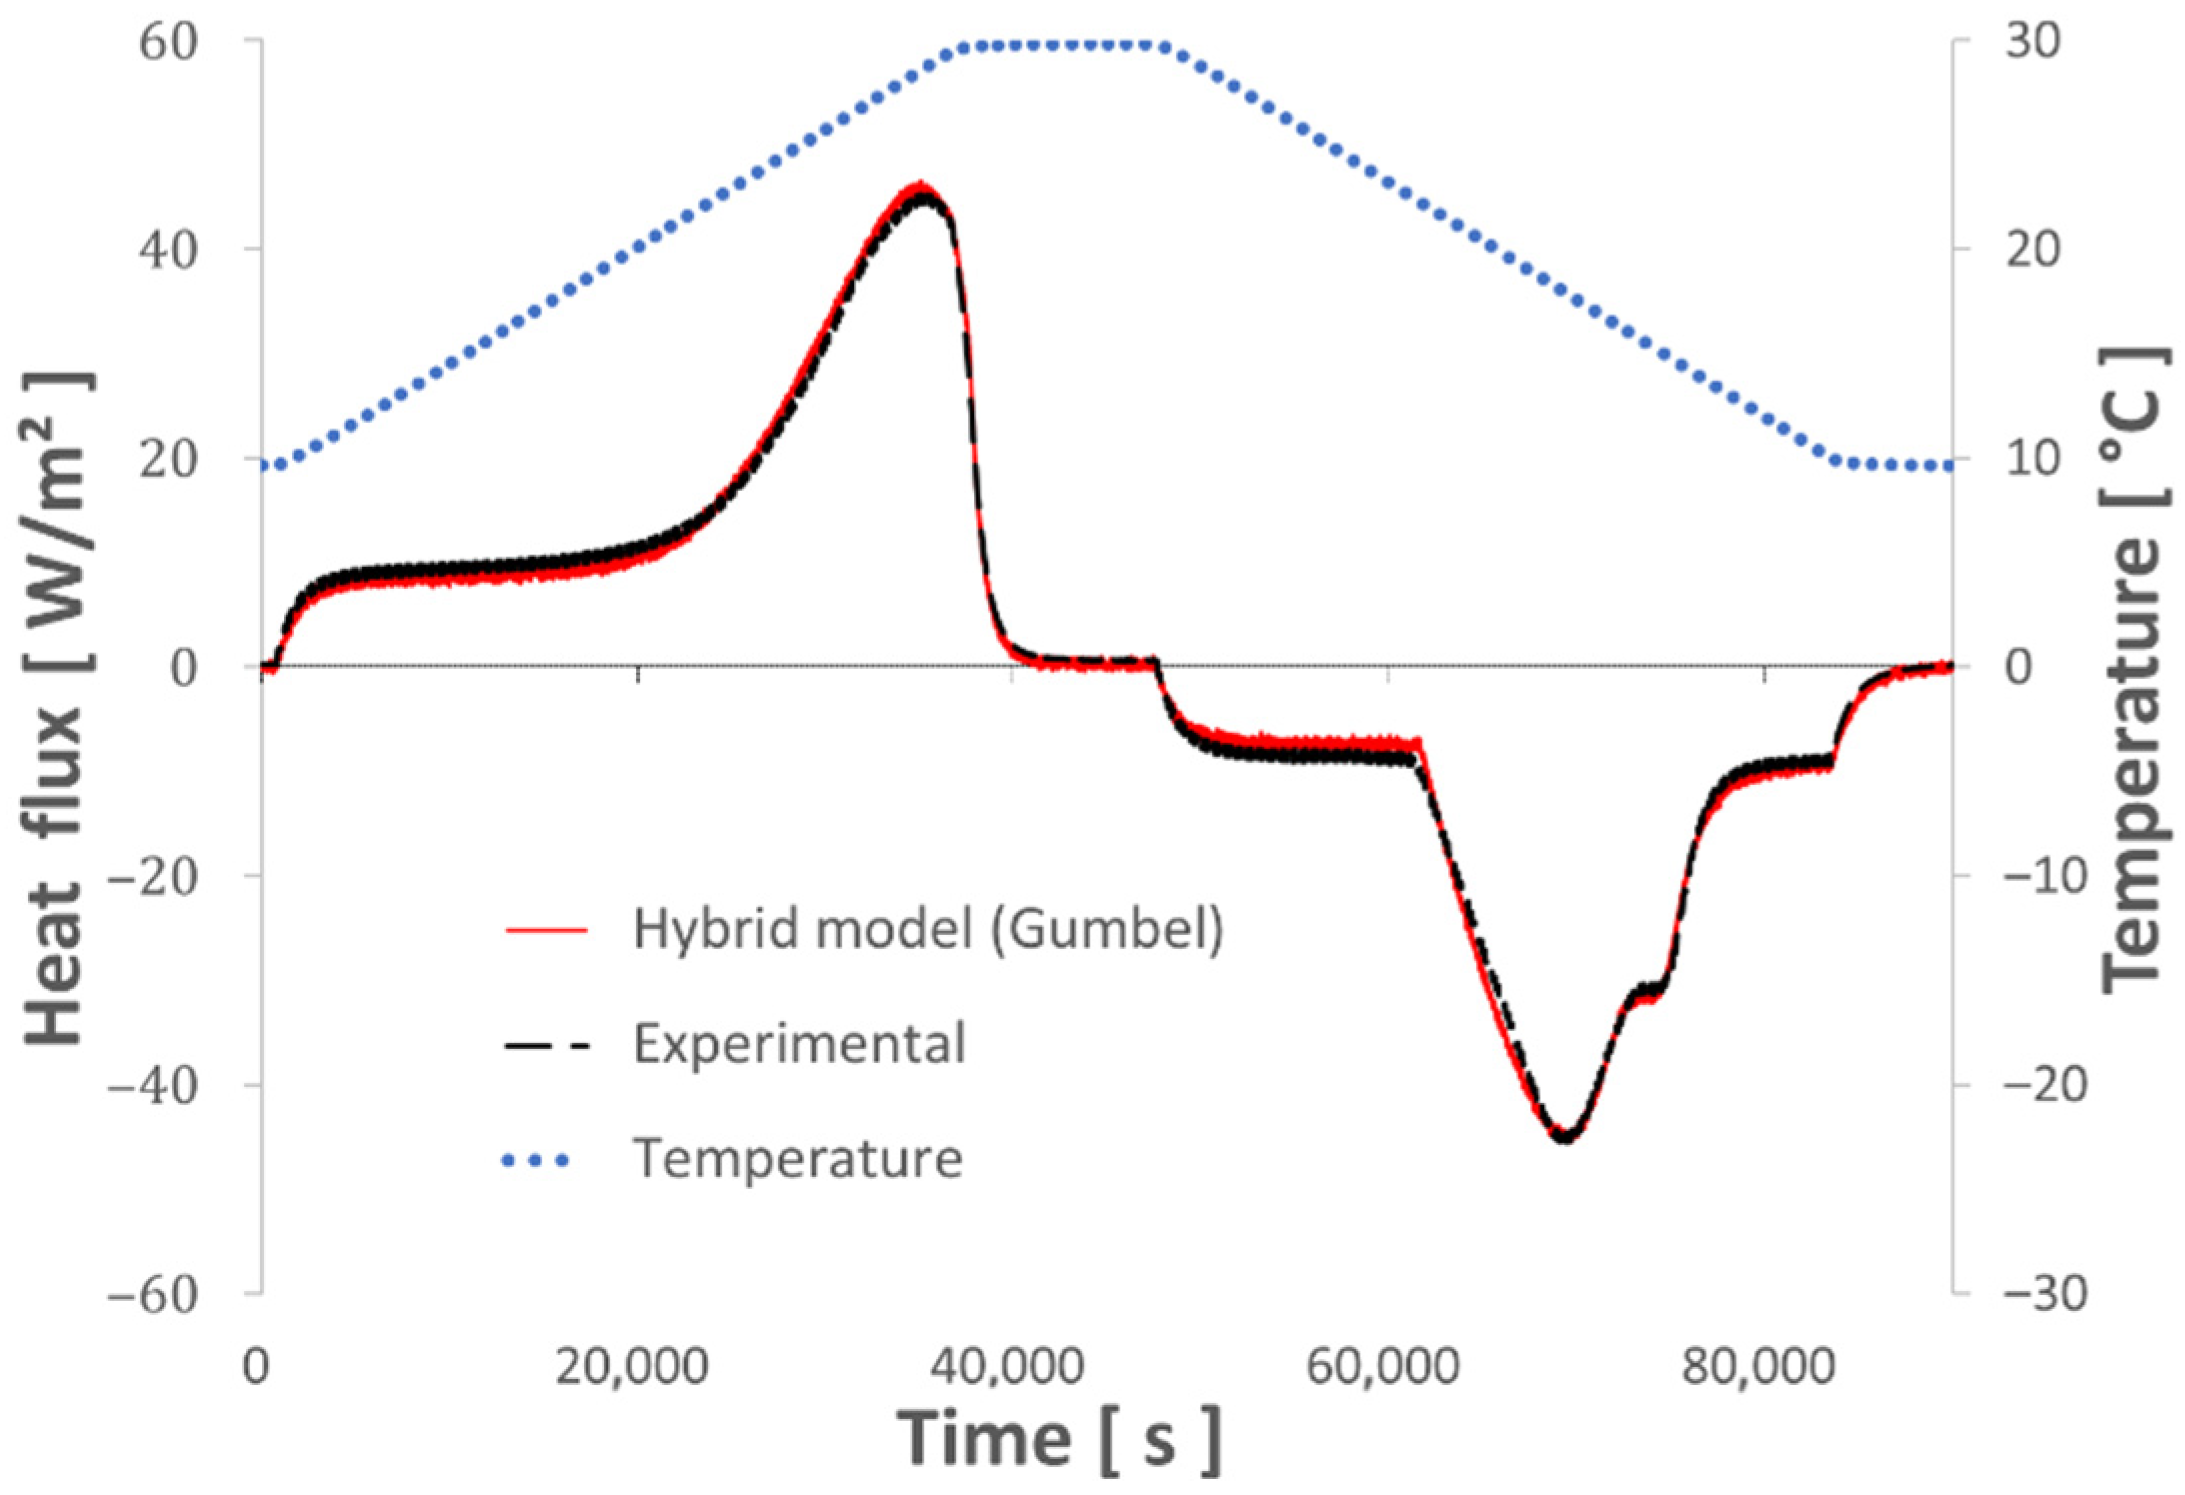
), a nearly identical curve of thermal flux measured on both the ETMV 8 sample and the binary solution can be observed. Concerning the solidification phase, two common points between the two bodies essentially stand out, namely the levels at the beginning ( Applsci 12 03827 i002) and end of solidification ( Applsci 12 03827 i003). It should also be noted that during the solidification phase, except for the second peak of thermal flux identified for the ETMV 8 coating, the curves are on the whole similar. All these elements serve to reinforce the choice of a binary solution model to analyze the coating behavior.
One of the most accurate existing models to describe the thermal behavior of PCMs with a binary solution behavior is detailed in [35,36,37,41]. In particular, this model has been used to accurately characterize a composite material consisting of cement mortar and paraffin-based PCM. P. Tittelein et al. [35] compared this model with the other main existing models, in deducing that it is the most precise to represent the thermal behavior of binary PCMs.
In general, the thermal behavior of PCMs can be described by expressing the evolution of enthalpy (h) as a function of temperature [21]. According to the first principle of thermodynamics, the heat equation associated with a phase change problem can be described in terms of the derivative of enthalpy (Equation (2)). For a binary solution, this derivative can be expressed by Equation (3), and the liquid fraction fliq_bin (T) used to model the change of state is given by Equation (4) [42].
ρ . h T . T t = λ . 2 T x 2
h T = d f l i q _ b i n ( T ) d T . L A + C S . ( 1 f l i q _ b i n ( T ) ) + C L . f l i q _ b i n ( T )
where   f l i q _ b i n · ( T ) = { ( T A T M ) ( T A T )                                             T T M       1                                                                   T > T M  
Other existing models describe the thermal behavior of binary PCMs, although numerous authors [21,43,44,45,46] have shown that many of them do not satisfactorily model the behavior of a PCM composed of several materials with distinct thermal behavior. Some models fail to simulate a continuous evolution of the heat capacity over the entire temperature range, while others consider the heat capacity to be identical in the solid and liquid states or simply do not allow for asymmetric PCM behavior. However, the main problem with the model presented above (Equation (2) through to Equation (4)), which considers the PCM as a binary solution, is its inability to describe the phenomena caused by the presence of two oils in the PCM, resulting in the appearance of several heat flux peaks during solidification.
The use of this binary solution model, even if a different equation is considered for solidification and melting (Figure 6), is not satisfactory to accurately reproduce the thermal behavior of the ETMV 8 coating. Figure 7 shows the comparison between the experimental heat flux and the heat flux obtained numerically by the given model, for a thermal load varying between 10 °C and 30 °C over 10 h. Notable differences are visible between the two heat fluxes, such as the asymmetry between the melting/solidification phases and a 2nd flux peak during solidification. This observation is quite consistent since the PCM applied in the coating studied here is not a binary solution due to its composition (i.e., a mixture of two fatty acids). The methyl palmitate and methyl stearate included in the PCM display distinct thermal properties, e.g., melting temperatures, latent heat, and capacities.

3.2. New Hybrid Model

Since the binary model is not satisfactory to model this material, which presents a very distinct behavior in melting and solidification. The hybrid model considers that the equations characterizing the thermal behavior of PCM differ in melting and in solidification. In melting, for instance in solidification, the heat equation of a binary solution (Equation (3)) without eutectic [46] is used while being coupled to Gumbel’s law [47] in order to reproduce the effects related to dissymmetry and supercooling, as generated by the presence of several materials in the PCM. Natural convection in PCM microcapsules is neglected due to their small diameter, varying from 5 to 25 µm. The boundary conditions are of the DIRICHLET type, the imposed temperatures are TLP on the left and TRP on the right. The numerical model depends mainly on CS, CL, λS, λL, LA, TA, TM, Rc-right, and Rc-left. Rc-right and Rc-left are the thermal contact resistances between the heat fluxmeter and the sample. Other easily measurable parameters, such as density and thickness, are also needed to complete the input dataset. The operation of the model implemented (simplified to a cell), i.e., homogeneous, tri-layer unidirectional conduction (2 gypsum boards, 1 ETMV 8), is presented in Figure 8, where the depiction has been simplified yet each layer features several meshes, each containing two thermal resistances and one thermal capacity.
Thus, the equations derived from this model are as follows:
m = ρ . e n . S n :   number   of   meshes ,   and   S :   surface   area   ( m 2 )
Q = m . C . d T d t d T = T i T i 1 ,   with   d t   the   interval   of   the   calculation   time   step   ( s )
ϕ i ,       i 1   = 1 R . ( T i T i 1 ) where   R = ( e / n ) λ
Contact resistances are integrated into the heat flux calculation at the material boundaries (left and right):
ϕ l e f t = 1 R + R c l e f t . ( T L P T i )
ϕ r i g h t = 1 R + R c r i g h t . ( T i T R P )
The derivative of enthalpy is calculated by integrating the Gumbel distribution (FG) and is represented in Figure 9. This distribution is a continuous probability function generally used to fit extreme data. It can be found in several fields, e.g., finance, hydrology, geology, and meteorology [48]. In this paper, we use the Gumbel probability density function (fG), defined as the derivative of the Gumbel function:
  F G ( x , a , b ) = exp ( exp ( x a b ) )
Its derivative is given by:
f G ( x , a , b ) = 1 b · exp ( exp ( x a b ) ) · exp ( x a b )
with x ϵ ℝ, a ∈ ℝ is a position parameter, and b > 0 is a spread parameter.
The advantage of this Gumbel derivative lies in its ability to easily obtain an asymmetric and adjustable form thanks to its position and spread parameters. Thus, the derivative of enthalpy is calculated according to the following equations.
During solidification (s):
d h S d T = { c S · ( 1 T A s T M s T A s T ) + c L . ( T A s T M s T A s T ) + ( T A s T M s T A s T ) . ( ψ s . L A T A s T )   + f G s T T M s c L T T M s
                        f G s ( T ) = ( 1 b s · exp ( exp ( T a s b s ) ) · exp ( T a s b s ) ) . ( 1 ψ s ) · L A
During melting (m):
d h S d T = { c S · ( 1 T A m T M m T A m T ) +   c L . ( T A m T M m T A m T ) +   ( T A m T M m T A m T ) . ( ψ m . L A T A m T )     +   f G m T T M m c L T T M m
                        f G m ( T ) = ( 1 b m · exp ( exp ( T a m b m ) ) · exp ( T a m b m ) ) · ( 1 ψ m ) L A
ψ s   e t   ψ m denote the latent heat distribution coefficients between the binary and Gumbel functions during the solidification and melting phase of PCM, respectively.
Figure 9 and Figure 10 present the evolution of the full enthalpy derivative, the enthalpy derivative without the addition of the Gumbel function, as well as with the Gumbel function. Let’s observe that the Gumbel function plays a more significant role during the melting phase in reproducing the effects of progressive melting of the material. During the solidification phase, the Gumbel function is mainly used to reproduce the effects related to supercooling, which occurs at approx. 17 °C.
This undercooling stems from the fact that the PCM used in this study is a mixture of two fatty acid-based PCMs [49], each with distinct thermal behavior. A difference of about 4% exists between the liquid fraction variation at the beginning of heating and at the end of cooling (Figure 11), as observed by K. Merlin [49] on several PCMs as well. The author assumed that this phenomenon was due to either incomplete melting of the material or measurement errors. An error analysis related to experimental uncertainties is carried out and detailed in Section 5.2.
Moreover, the choice of using an inverse Gumbel function in the melting phase is justified by the fact that this function reflects a slow and progressive increase, followed by an abrupt decrease. It presented the best results in comparison with other mathematical laws, e.g., Gauss’s law. The opposite behavior was observed during the solidification phase, thus explaining the applicability of the Gumbel function, which shows a rapid rise with a steep slope followed by a gradual decrease.
To optimize the parameters of this model and reduce the objective function to characterize the ETMV 8 sample, a differential evolution algorithm [50] available in the optimization module of Python, called Scipy, has been used. Due to its stochastic nature (i.e., the gradient method is not employed), this algorithm can search within a large candidate space area for the minimum of the objective function; its operation is detailed in [51].
To reduce the number of parameters to be optimized, the thermal conductivities and capacities, as well as the contact resistances, are determined beforehand during experiments where the PCM is in either the solid or liquid state. Yet despite this, the optimization step still requires the identification of 11 parameters (LA, T A   m , T M m , T A s , T M s , ψ s ,     ψ m , a m , bm, as and b s ).

4. Results and Discussion

4.1. Optimization of the Numerical Model Parameters

The experimental set-up described above (Figure 4) has been used to characterize the ETMV 8 coating. The sample was stressed by temperature ramps ranging from 3 h to 10 h. The fluxes measured for each case are shown in Figure 12; it can be observed that the measured flux has a shape that varies greatly with the duration of the adopted temperature ramp. Similar behavior has already been observed and detailed by M. Thonon et al. [21]. The melting of the PCM is progressive during the heating ramps, the material stores sensible and latent heat. The maximum flux density is reached at the end of the temperature ramp and then returns to a zero value until the material returns to an isothermal thermal state. Let us notice in particular that the use of a temperature ramp of short duration during cooling, e.g., 3 h, does not expose the second flux peak, which is caused by the presence of several materials in the PCM. This second peak is only visible from the 5-h temperature ramp because for the faster ramp (3-h), the temperatures vary too quickly, and the two energy release peaks occur at very close times. However, when installed in a building, the material rises in temperature over periods that can be on the order of one day. It is therefore important to take these longer periods into account.
It is therefore essential to use a large temperature ramp to more accurately determine the thermal characteristics of the coating. In this study, the thermal characterization of the sample was performed with the experimental measurements of the test performed with the T-10H thermal loading ramp.
From these heat flux and temperature measurements, inverse methods allow for determining: thermal conductivity, heat capacity in the solid and liquid states, thermal contact resistances between the plates and the sample, and latent heat. This latent heat (126 kJ/kg) is most consistent since it closely corresponds to 70% of the latent heat of PCM (180 kJ/kg), as obtained by the DSC method [52,53]. The melting temperatures TA (melting temperature of the pure solvent) and TM (temperature of the liquidus) are also evaluated. The resulting parameters are as follows (Table 4 and Table 5):
These parameters serve to numerically simulate the thermal behavior of the coating. Figure 13 shows a comparison between the thermal flux measured experimentally and that calculated with the numerical model and optimized parameters. This figure reveals that the model presented herein, i.e., the derivative of enthalpy coupled with a Gumbel function, yields strong results (as opposed to the model of a simple binary solution) and moreover accurately reproduces the behavior of the ETMV 8 coating, whether during melting or solidification; in particular, it allows reproducing the effect of supercooling during the solidification phase.
It has been demonstrated that the dynamics of the melting and solidification processes are well represented by the numerical model developed above. It remains to be verified that this model is efficient for various loadings and in the case of partial melting or solidification since these cases are difficult to model and can lead to errors in the calculation of energy balances.

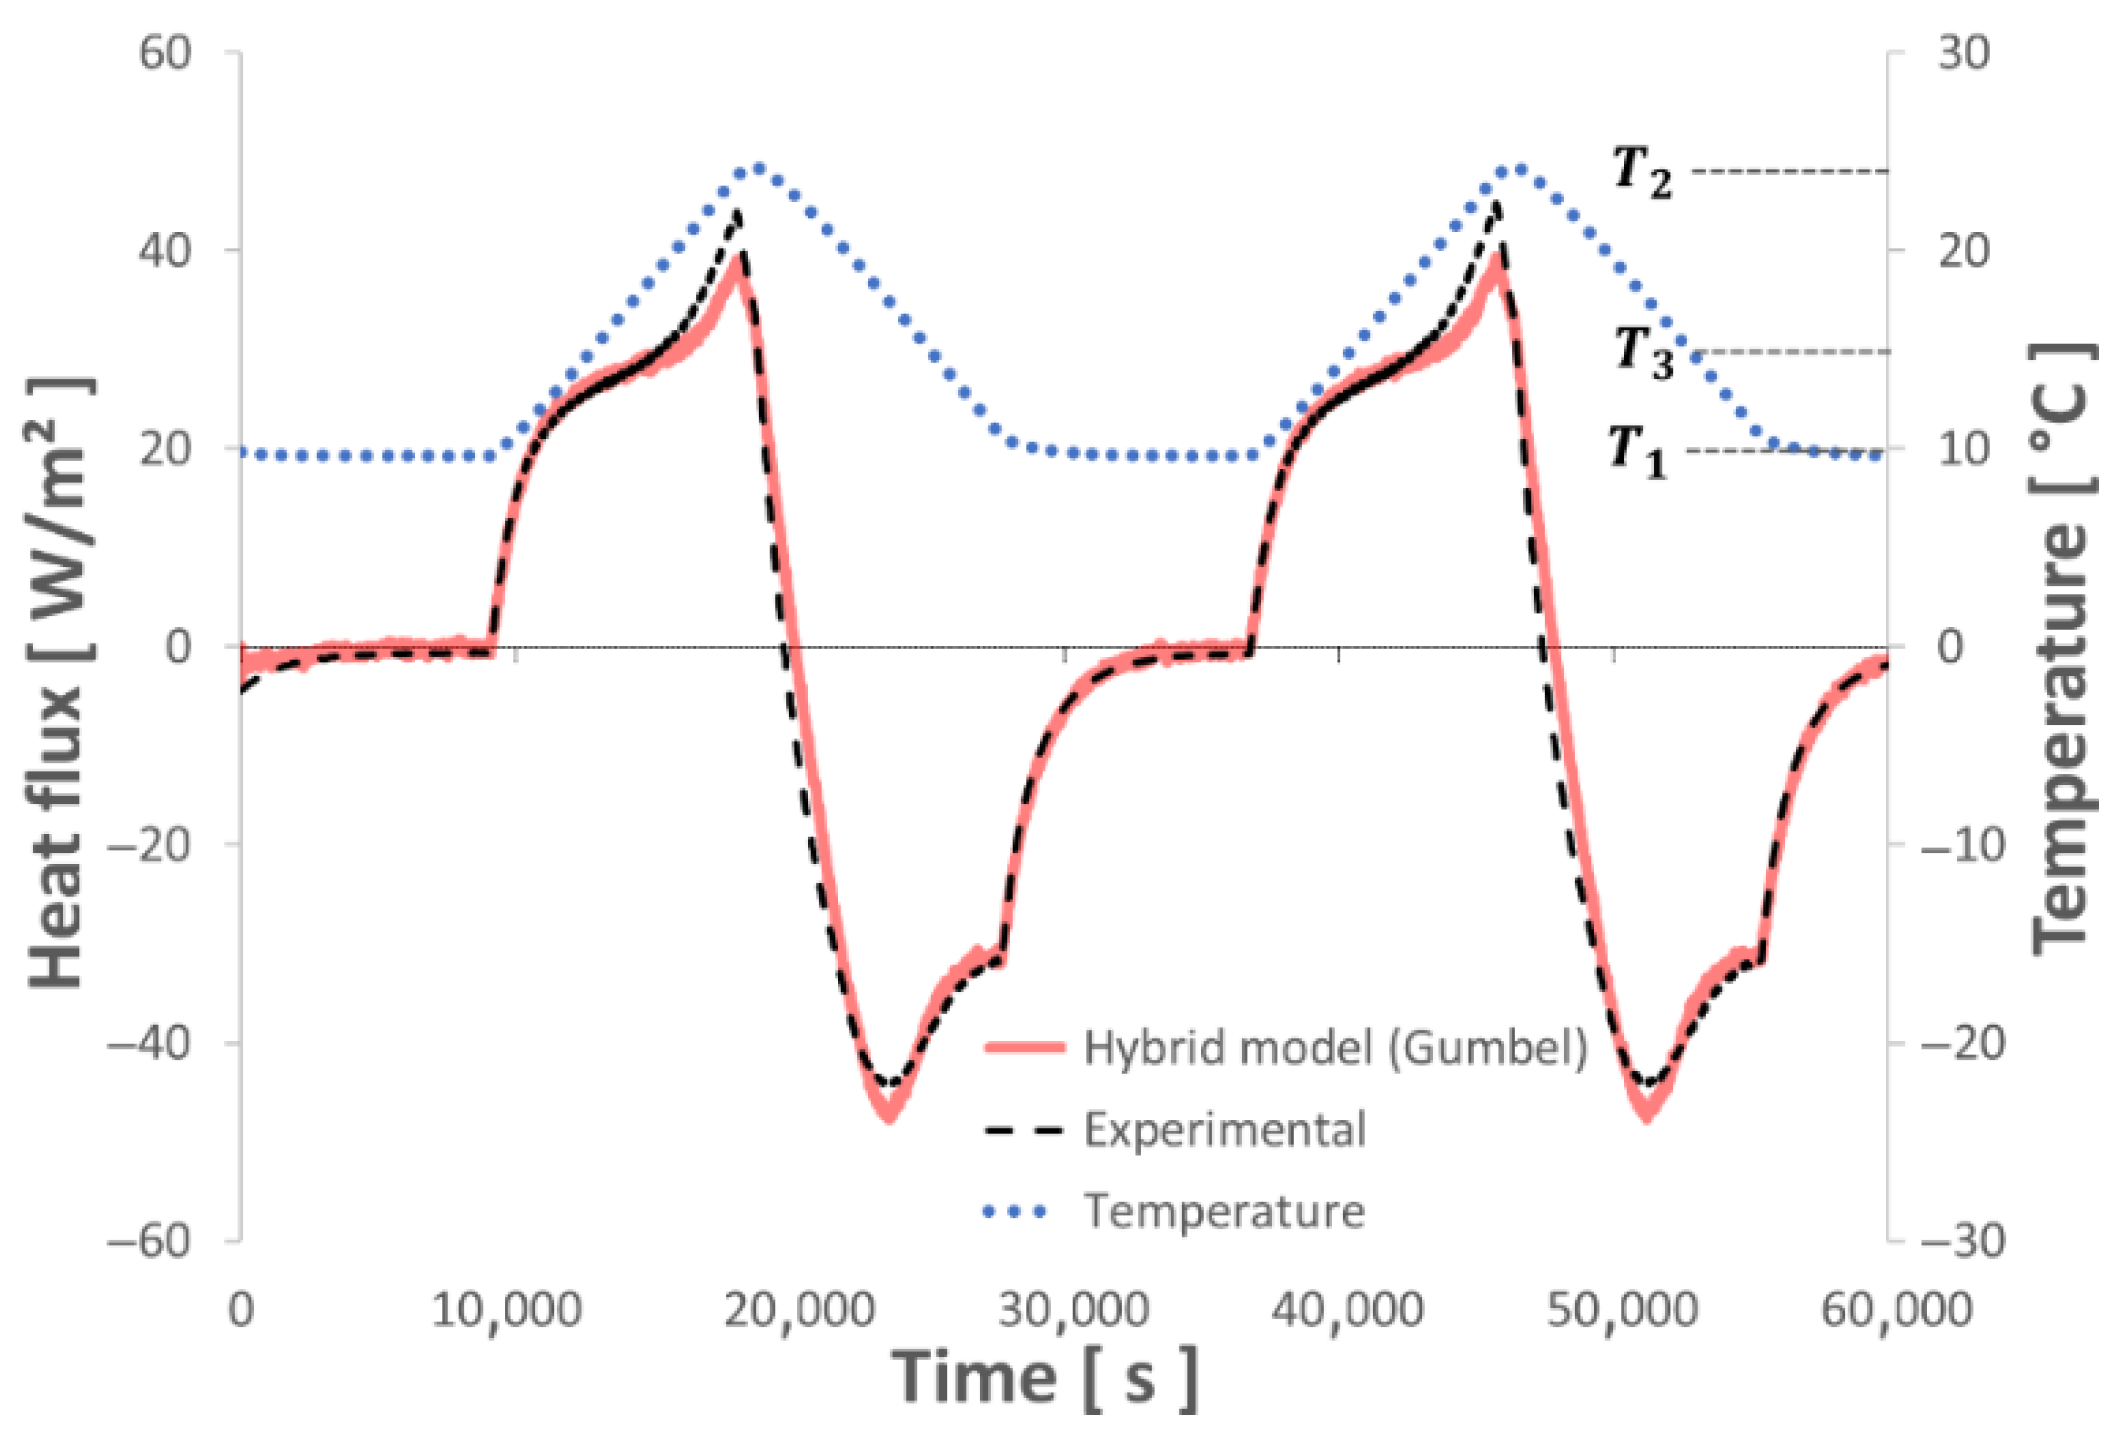
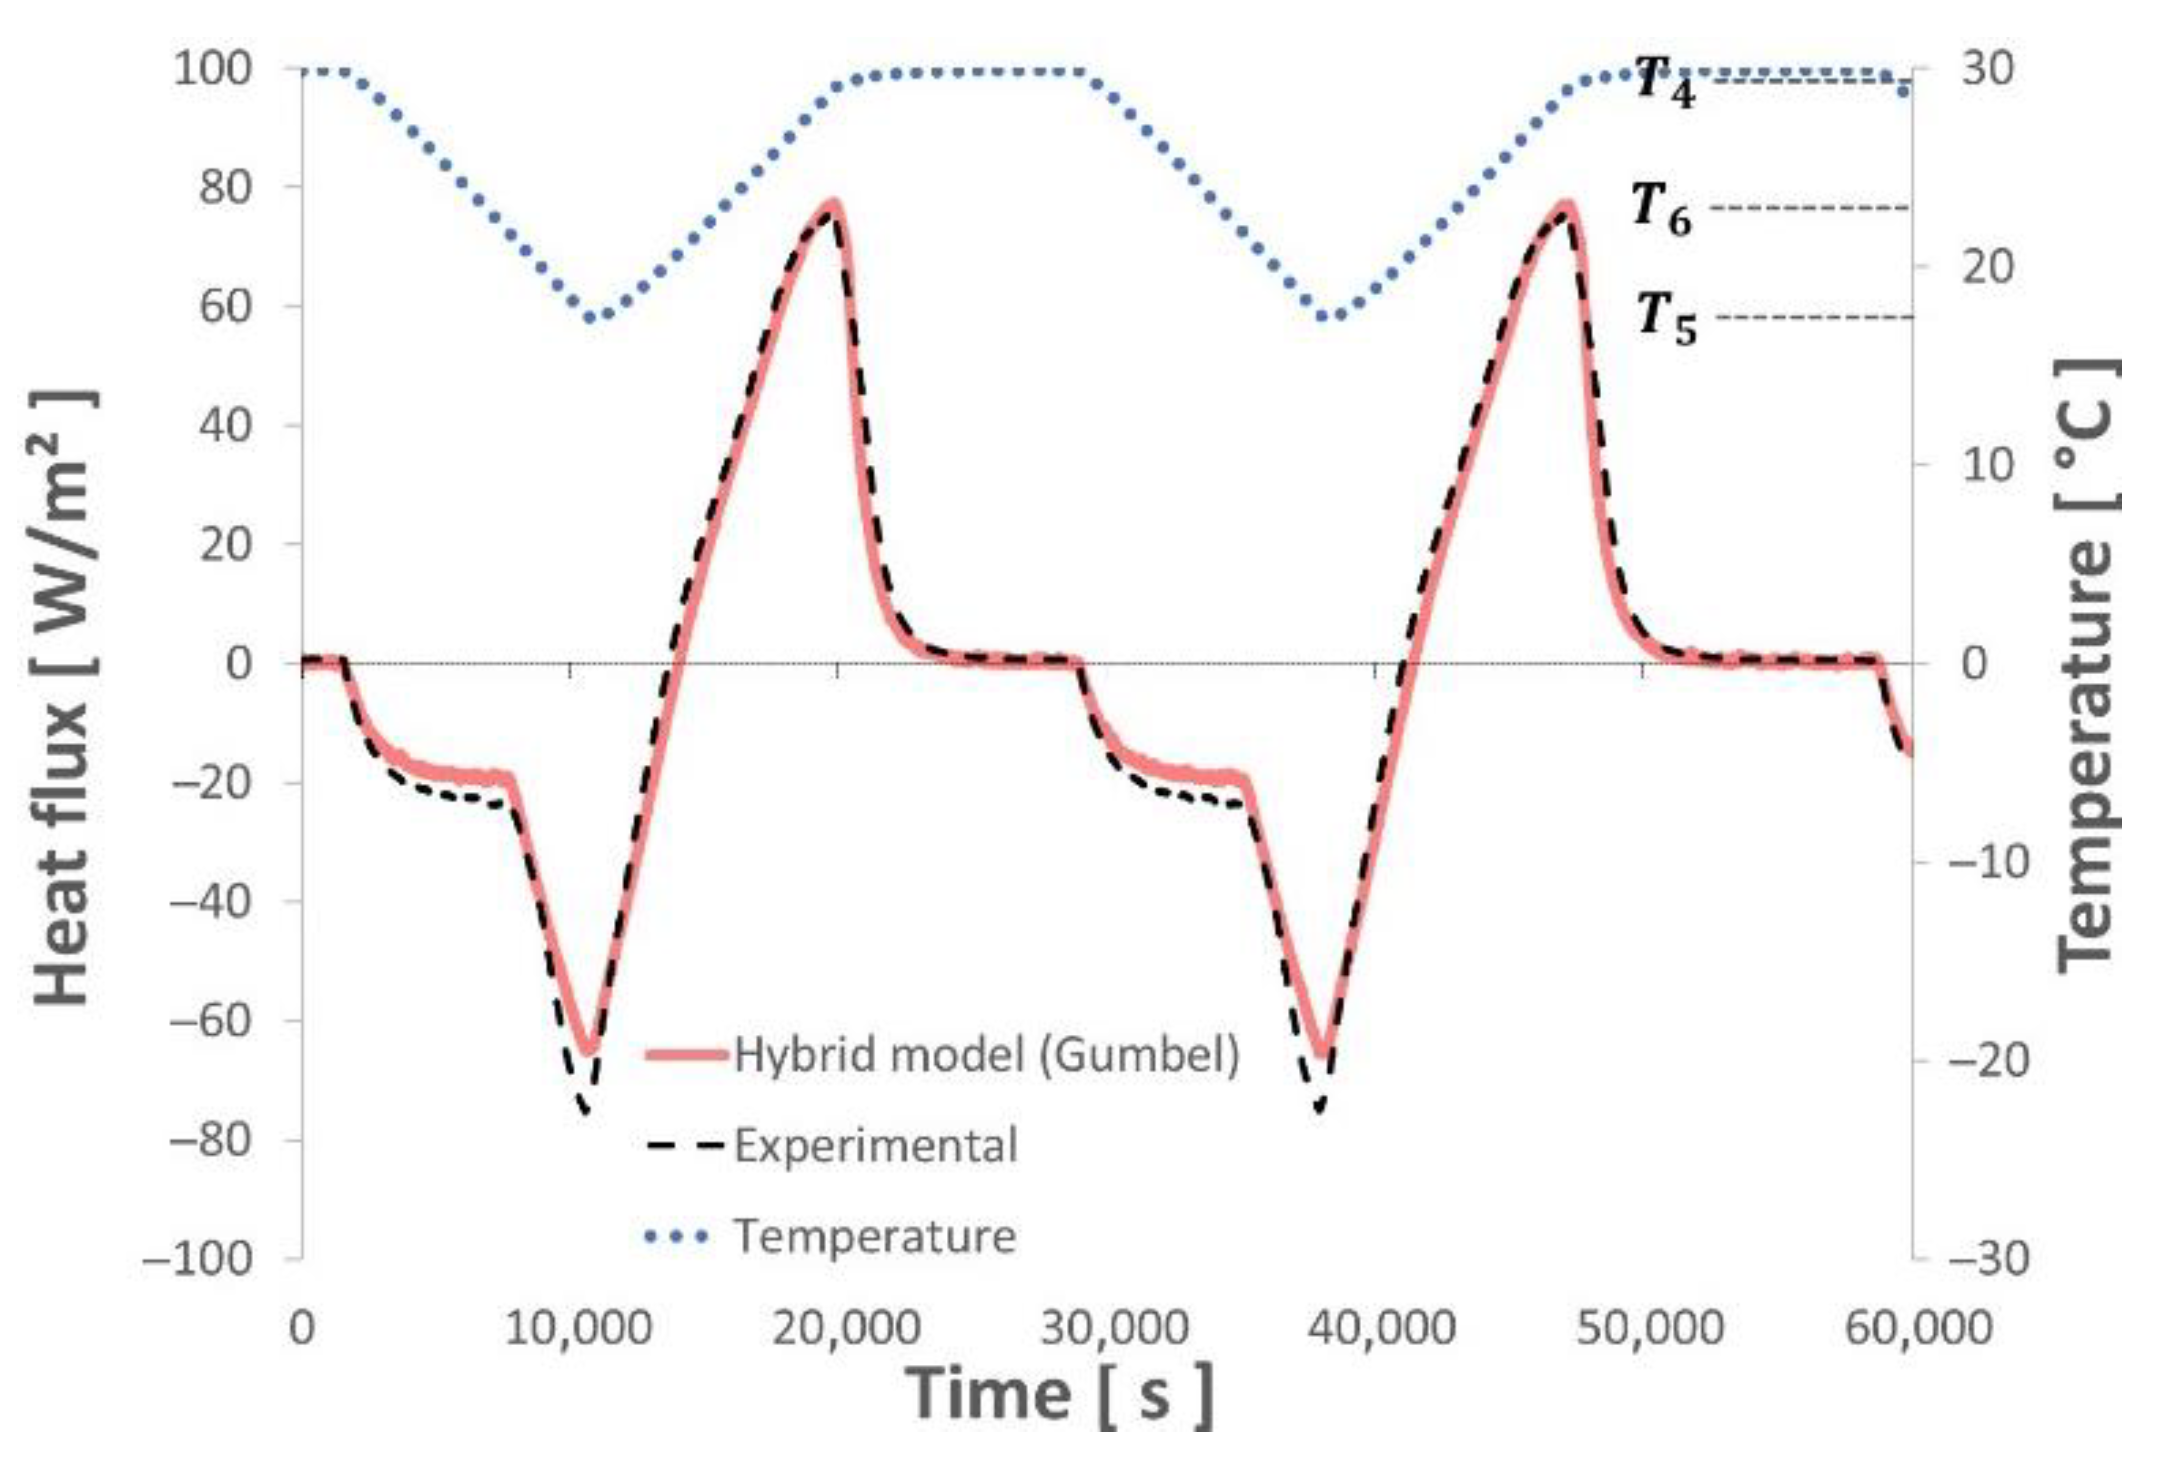
4.2. Test of the Numerical Model with Various Thermal Sollicitations

To verify the effectiveness of the model just built, the same sample was loaded in several different ways.
Figure 14 and Figure 15 show the results obtained for the case of temperature stress in the form of a 3-h and 6-h ramp. Figure 16 displays a comparison between the experimental fluxes and those obtained numerically, for the case of an asymmetric loading. Various temperatures were imposed on the left and right sides of the sample at different heating/cooling rates. A good level of agreement is always found between the experimental results and numerical model results, regardless of the heating/cooling rate.
It was also necessary to test the model under constraints leading to partial state changes of the PCM. The problem arising with partial phase changes is mainly caused by the transition between the melting and solidification processes. In the literature, two methods are basically employed to model these types of PCM state changes. Several authors, including R. Chandrasekharan et al. [54], have suggested an absence of hysteresis until the PCM is completely melted or solidified. This assumption implies no difference between the state changes of the material as it alternates between melting and solidification. The approach proposed by R. Chandrasekharan et al. [54] thus maintains the same liquid fraction curve as a function of the PCM state (Figure 17a). When inducing changes in the partial melting states, only the liquid fraction curve is therefore used in the melting phase. On the other hand, when carrying out a partial solidification, only the liquid fraction curve in the solidification phase gets used, along the opposite direction of the curve when the temperature variation is reversed. Another method that takes PCM hysteresis into account also exists, leading J. Bony et al. [55] and E. Moreles et al. [56] to propose alternating between the melting and solidification liquid fraction curves, depending on the temperature stresses imposed on the material (Figure 17b). R. Chandrasekharan et al. [54] compared the accuracy of these two methods and found relative similarity.
Other authors, namely [57,58], have come up with different opinions; they have shown, through studies on walls containing PCM, that the hysteresis of the PCM plays an important role and has a significant impact on both the energy balance and thermal performance of the material. The studies in [26,58] compared the two methods and issued a divided opinion on the subject. They concluded that the efficiency of both methods depended on the PCM phase.
Notably, B. Delcroix et al. [26] observed that although the method taking PCM hysteresis into account is more accurate, it nonetheless does not allow for a satisfactory representation of the partial melting. The hybrid model proposed in this paper, incorporating supercooling, was developed with the first method, which does not take hysteresis into account when analyzing melting and partial solidification. Further studies will draw a comparison of these two methods. In our model, the liquid fraction (Figure 17) during solidification and melting, both complete and partial, is calculated based on Equations (12) and (14), yielding the enthalpy variations Δhm and Δhs (Figure 18) by means of integrating the derivative of enthalpy during melting dhm/dT and solidification dhs/dT.
We have:
Δ h m ( T ) = T i T   d h m   ( T ) d T   d T C L ( T T i )
where Ti denotes the initial temperature at which the PCM is assumed to be completely liquid. It is also assumed that the liquid fraction of the hybrid model, during either the melting or partial melting phase, is as follows:
f l i q _ m ( T ) = Δ h m ( T ) Δ h m ( T M   m )
Similarly, as for the solidification phase, we can determine:
Δ h s ( T ) = T i T   d h s   ( T ) d T   dT C L ( T T i )
The liquid fraction of the hybrid model, during solidification or partial solidification, is then:
f l i q _ s ( T ) = Δ h s ( T ) Δ h s ( T M   s )
In Equations (16) and (18), it was assumed that only CL is used given its proximity to Cs.
The partial melting tests (Figure 19) were performed over a temperature range extending from T1 (10 °C) to T2 (24 °C) through an intermediate temperature T3 (15 °C). The sample was also subjected to temperature variations ranging from T4 (30 °C) to T5 (18 °C) through T6 (23 °C), causing partial solidification of the PCM (Figure 20). The evolution of the liquid fraction during these partial state changes is obtained from Equations (17) and (19). Figure 19 and Figure 20 present the results obtained in the case of temperature stress leading to partial melting and solidification, respectively. It can be noted that the melting temperatures obtained for the coating containing the Inertek 23 PCM (Figure 18) are very close to those obtained by DSC on PCM (Figure 2).
A good level of agreement could be observed between the experimental flux and the numerical flux obtained with the hybrid model integrating a Gumbel function. These experiments confirm that the model developed herein can correctly simulate the behavior of the ETMV 8 coating even in the presence of various thermal loadings, which generate partial changes to the state of the PCM contained in the mixture.

5. Energy Balance and Error Analysis

5.1. Energy Balance

To complete the model verification step, it was necessary to determine the amount of energy involved during the PCM melting and solidification phases, for various loadings, in order to ensure energy conversation during these storage and retrieval cycles. This determination entailed integrating the heat flux (both experimental and numerical) with respect to time.
These results indicate a very slight difference (less than 1%) between the energy calculated from the experimental flux measurements during the melting phases and that obtained during the solidification phases, for each ramp (Table 6). This difference is probably due either to measurement errors during the tests or to the supercooling, which stochastically influences the energy storage/release, especially during the solidification phase. Several studies have reported that such supercooling appears unpredictably and depends on various factors. According to J. C. Delabrouille et al. [59], supercooling essentially depends on the purity of the PCM. Indeed, impurities in the material will act as primers to accelerate the crystallization phenomenon. In addition, other authors, including J.-P. Dumas [60] and J.-P. Bedecarrats [61], have shown that all heating/cooling cycles imposed on the material during its lifetime (nature, repetitions) constitute the thermal history of the PCM, which in turn has a direct influence on the degree of supercooling. All these key factors act on the PCM supercooling and thus cause differences between the energy balances in melting and solidification for each thermal stress cycle.
Let’s also note a difference of roughly 2.4% when performing the energy balance from the heat fluxes calculated numerically by the hybrid binary-Gumbel model (Table 7). This difference is likely due to inaccuracies related to the optimization of the numerical model parameters. Indeed, errors in experimental measurements of heat flux or temperature lead to inaccuracies when characterizing the thermophysical parameters of the PCM. Therefore, an error analysis is performed in order to evaluate the impact of these measurement errors.

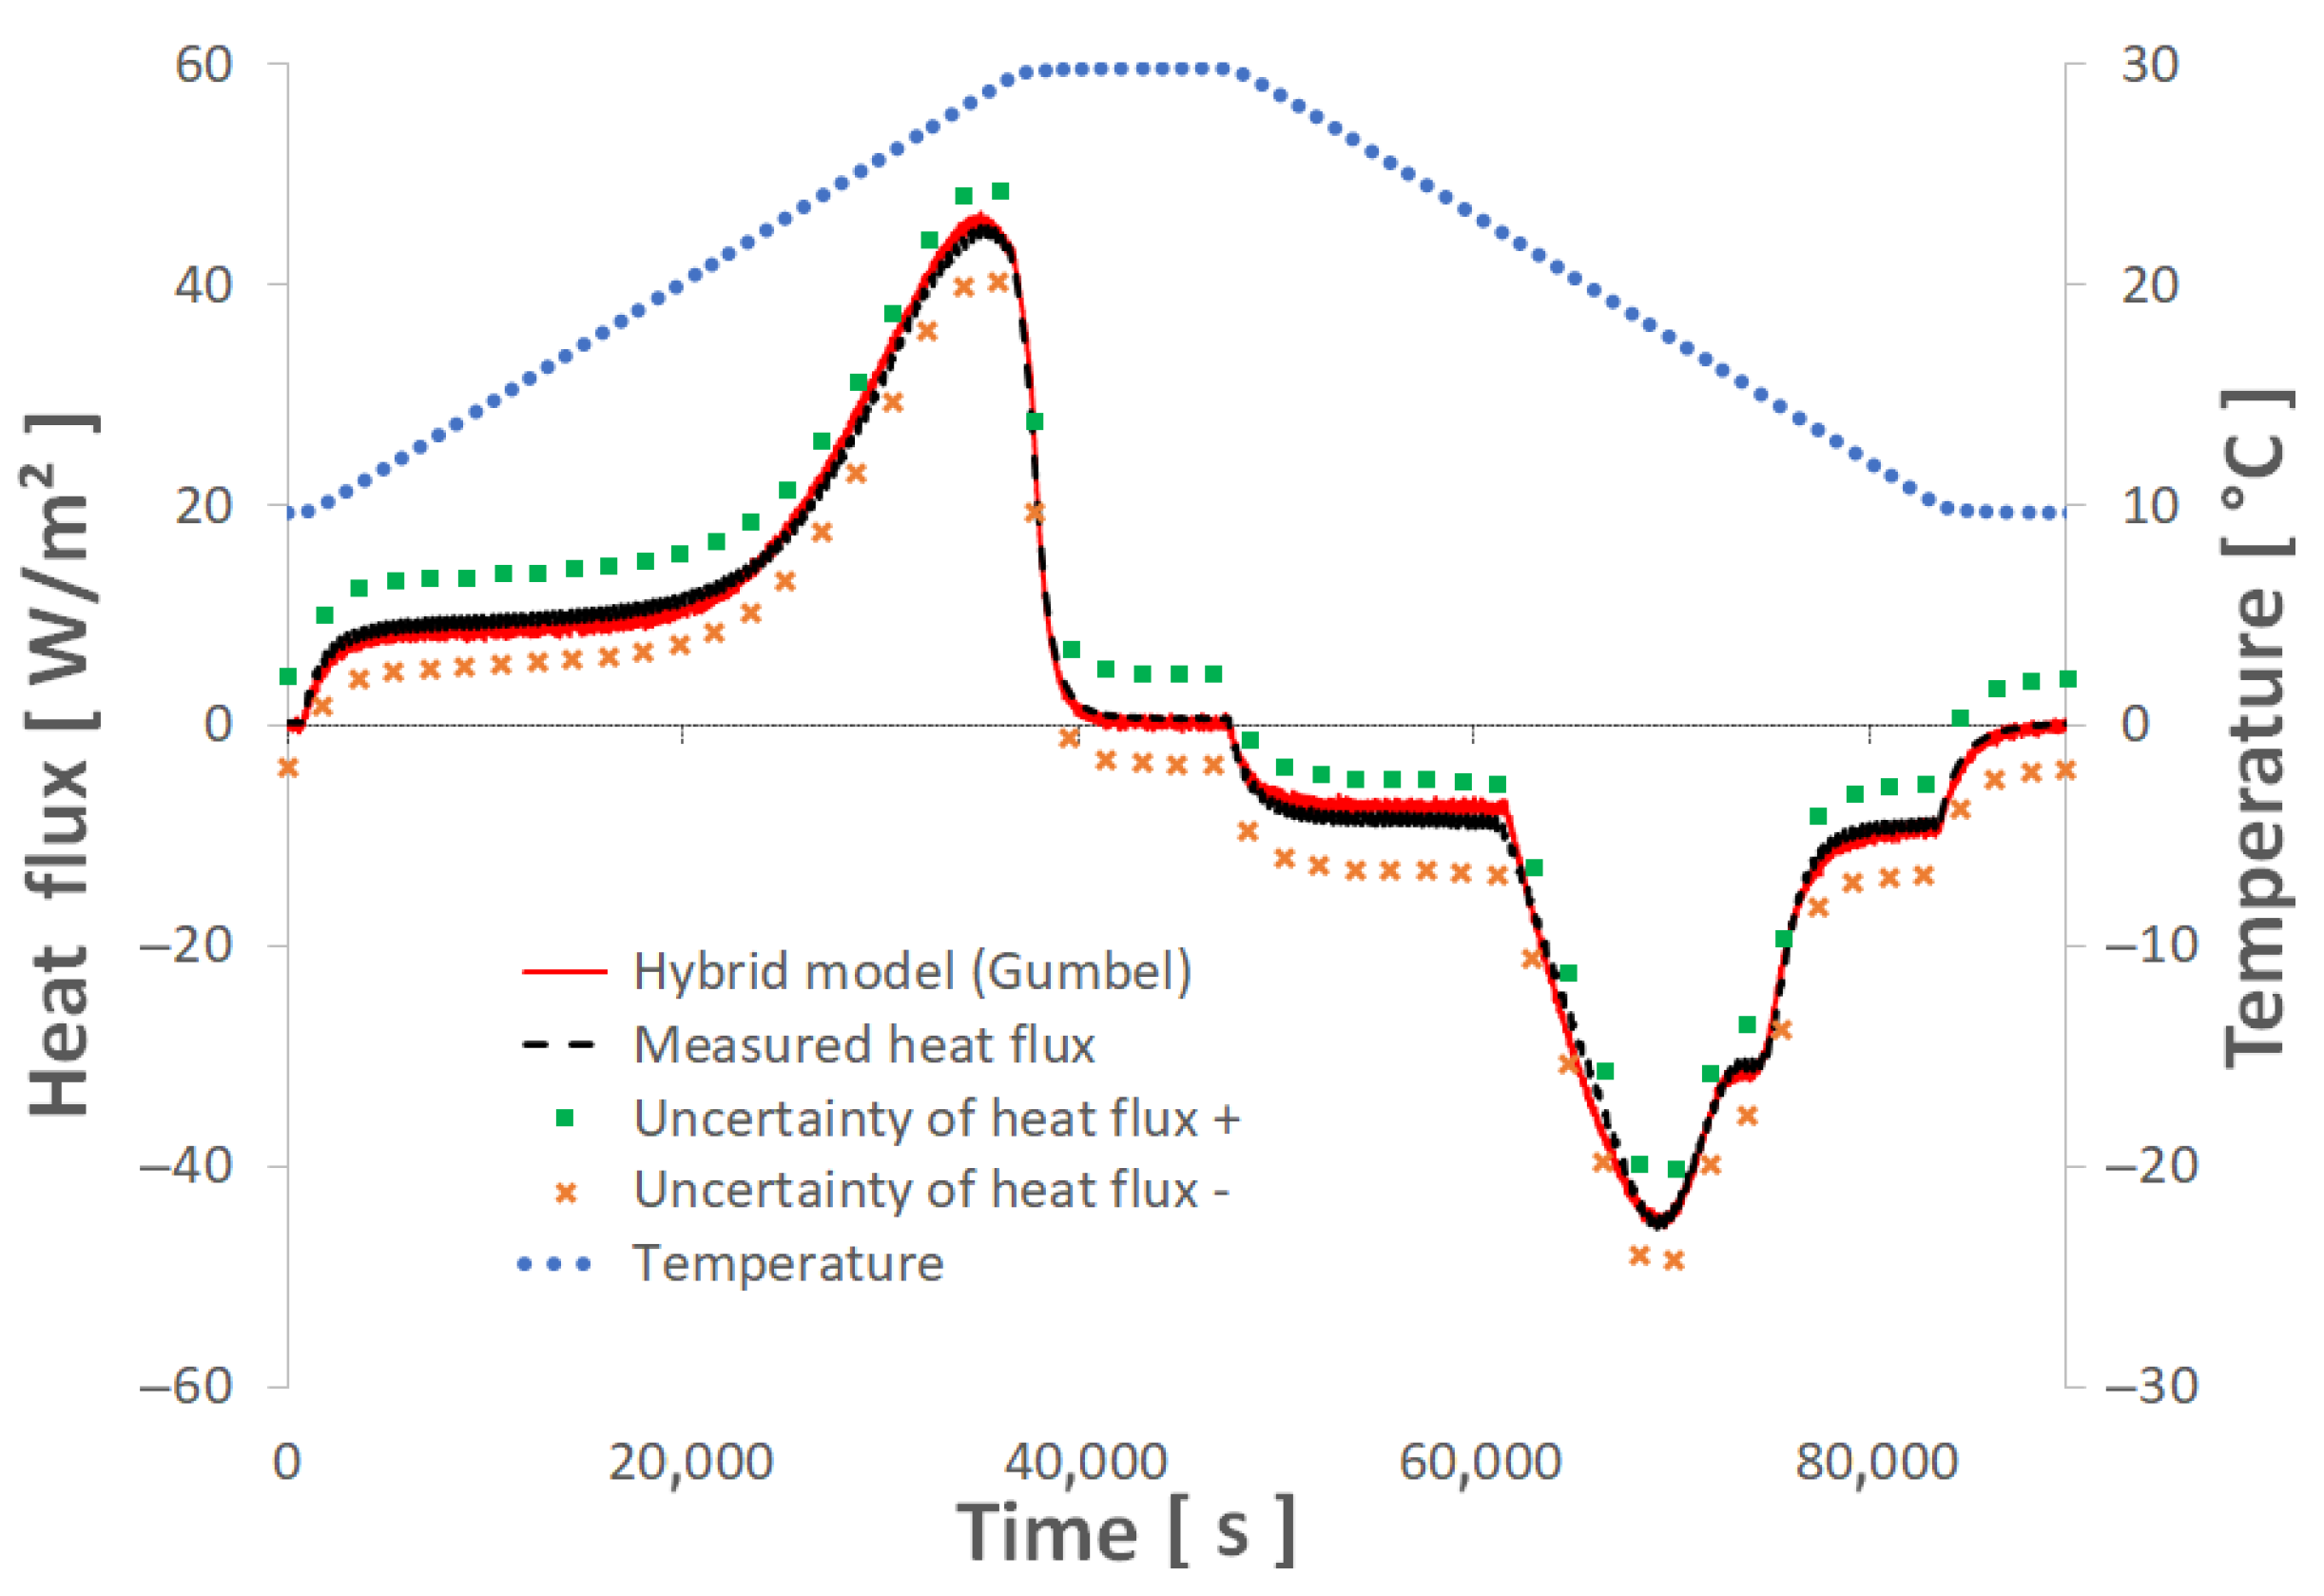
5.2. Evaluation of Errors Related to Uncertainties

In the context of this study, uncertainties may arise in the measurement of heat flux and temperature of the sample during testing, as previously mentioned. These error sources can lead to misinterpretation of the results and thus reduce the accuracy of the characterization of thermophysical properties of the material. According to the law of propagation of uncertainties, the compound uncertainty (Uc) includes several components [62]. In the present case, it is essential to take into account errors related to the T-type thermocouples (UT), the tangential gradient fluxmeters FGT (Uφ), and the data acquisition unit (Umod). For heat flux measurements, this compound uncertainty is given by the following equation:
U c , ϕ = [ U ϕ 2 + U b , ϕ 2 ] 1 2
Similarly, the compound uncertainty related to temperature measurements is expressed as:
U c ,   T = [ U T 2 + U b , T 2 ] 1 2
The error on fluxmeter sensitivity (114 µV·W−1·m−2) has been estimated at 2% [63], with the uncertainty values being calculated for a heat flux of approx. 100 W·m−2 (Table 8). The standard uncertainty of the acquisition unit is provided by the manufacturer. Thus, the compound uncertainty for the heat flux measurement is evaluated here at 2.04 W·m−2. The temperature measurement errors are mainly correlated with both the accuracy of thermocouples provided by the manufacturer and the accuracy of the central acquisition unit. Temperature is therefore measured with a precision of plus or minus 0.5 °C. The error range related to uncertainties of heat flux measurements during tests conducted to characterize the ETMV 8 coating is shown in Figure 21.
The actual heat flux through the coating may fall within the range of uncertainty shown in Figure 21. The accumulation of these uncertainties in heat flux and temperature measurements can affect the thermophysical characterization of the coating using inverse methods since such a characterization depends mainly on experimentally collected data. This aspect can also have an impact on the calculated energy balance during the melting and solidification phases of the material, as discussed in Section 5.1. However, these errors, equal to around 2% on the heat flux, as well as the inaccuracy of the temperature measurement (±0.5 °C), which generated about 4% error on the determination of the PCM liquid fraction, do remain quite acceptable, which allows validating the results proposed in this article.

6. Conclusions

This paper has presented a new numerical model to analyze the thermal behavior of a composite material integrating a bio-based micro-encapsulated PCM. This model has been developed by using the heat flux and temperature from measurements performed with the LGCgE experimental fluxmeter bench. Coupled with an inverse method, these data have allowed characterizing the parameters of the proposed numerical model.
Through this model, the thermodynamic analysis of the PCM is based on the enthalpy equations of a binary solution, associated with the equations of Gumbel’s Law. The latter serves to numerically describe the complex phenomena generated not only by supercooling during the material’s solidification phase but also by the presence of several components with distinct thermal behavior within the same PCM. The hybrid model developed during this work was coupled to inverse methods in order to characterize the thermophysical properties of a bio-sourced gypsum plaster incorporating a vegetable oil-based PCM, intended to improve the energy efficiency of buildings. An experimental error analysis was performed to evaluate the accuracy of this characterization, and verifications were carried out on model reliability according to various thermal dynamics and in the case of partial melting or solidification. Given the results obtained, the following conclusions could be drawn:
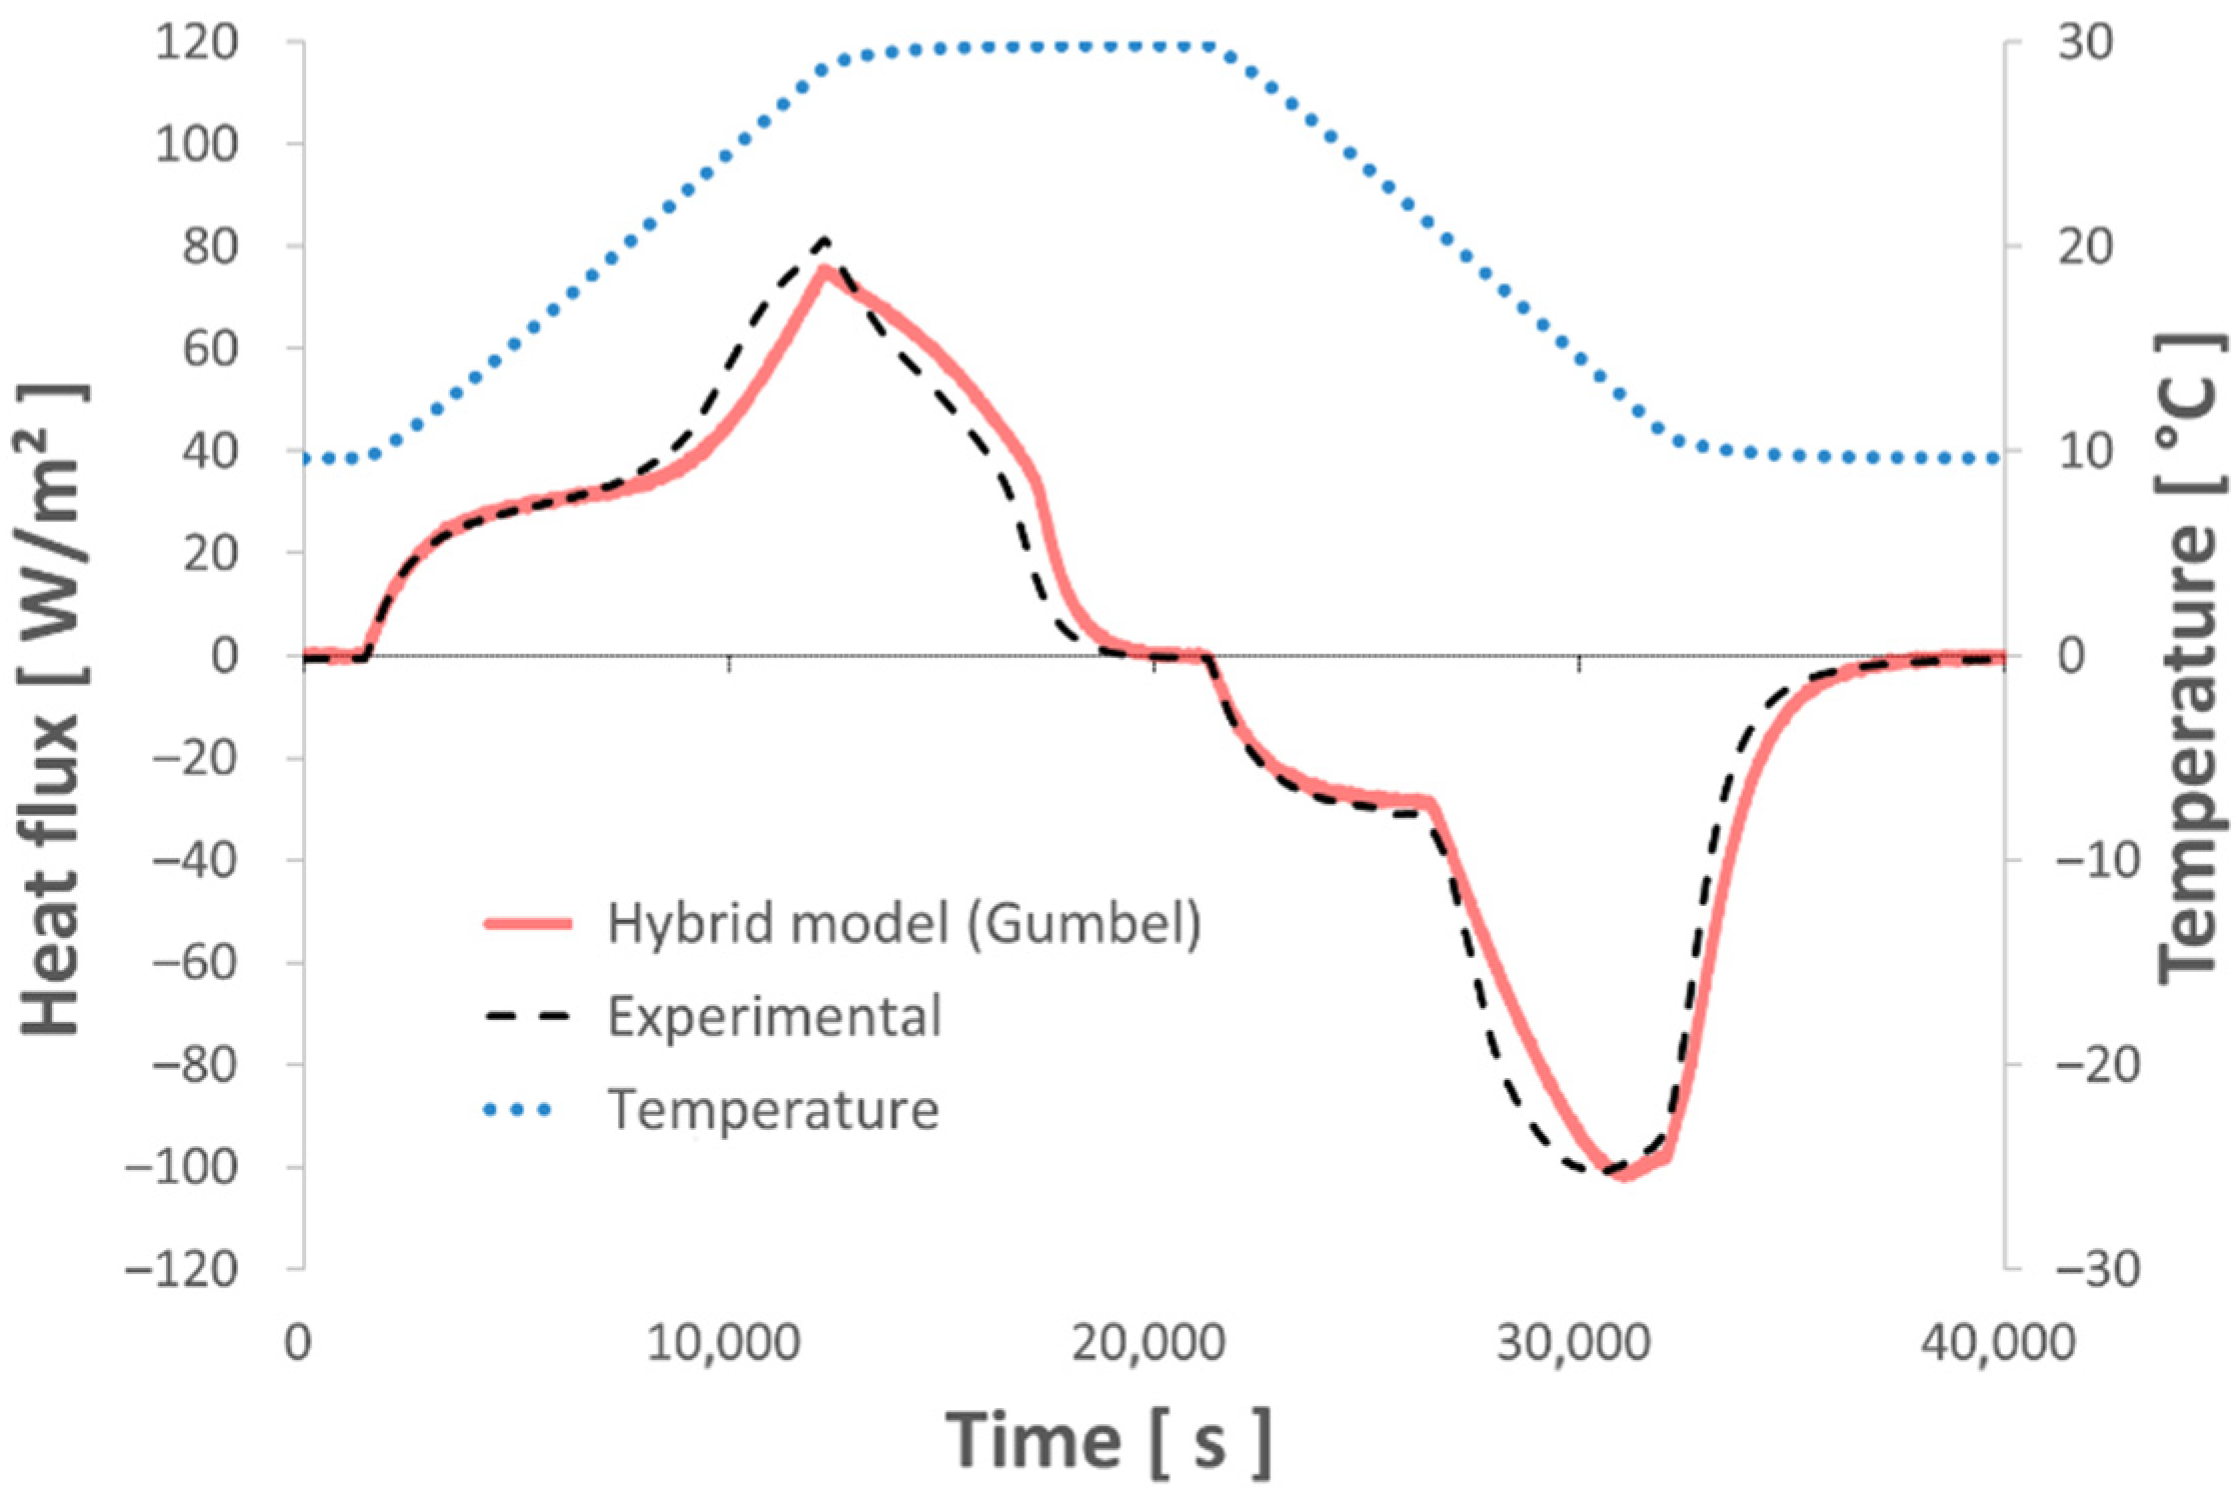
  • This new hybrid model, associating the enthalpy of a binary solution with Gumbel’s Law equations, succeeds in describing the thermal behavior of the studied composite material (gypsum board + micro-encapsulated PCM) with high accuracy even when subjected to undercooling.
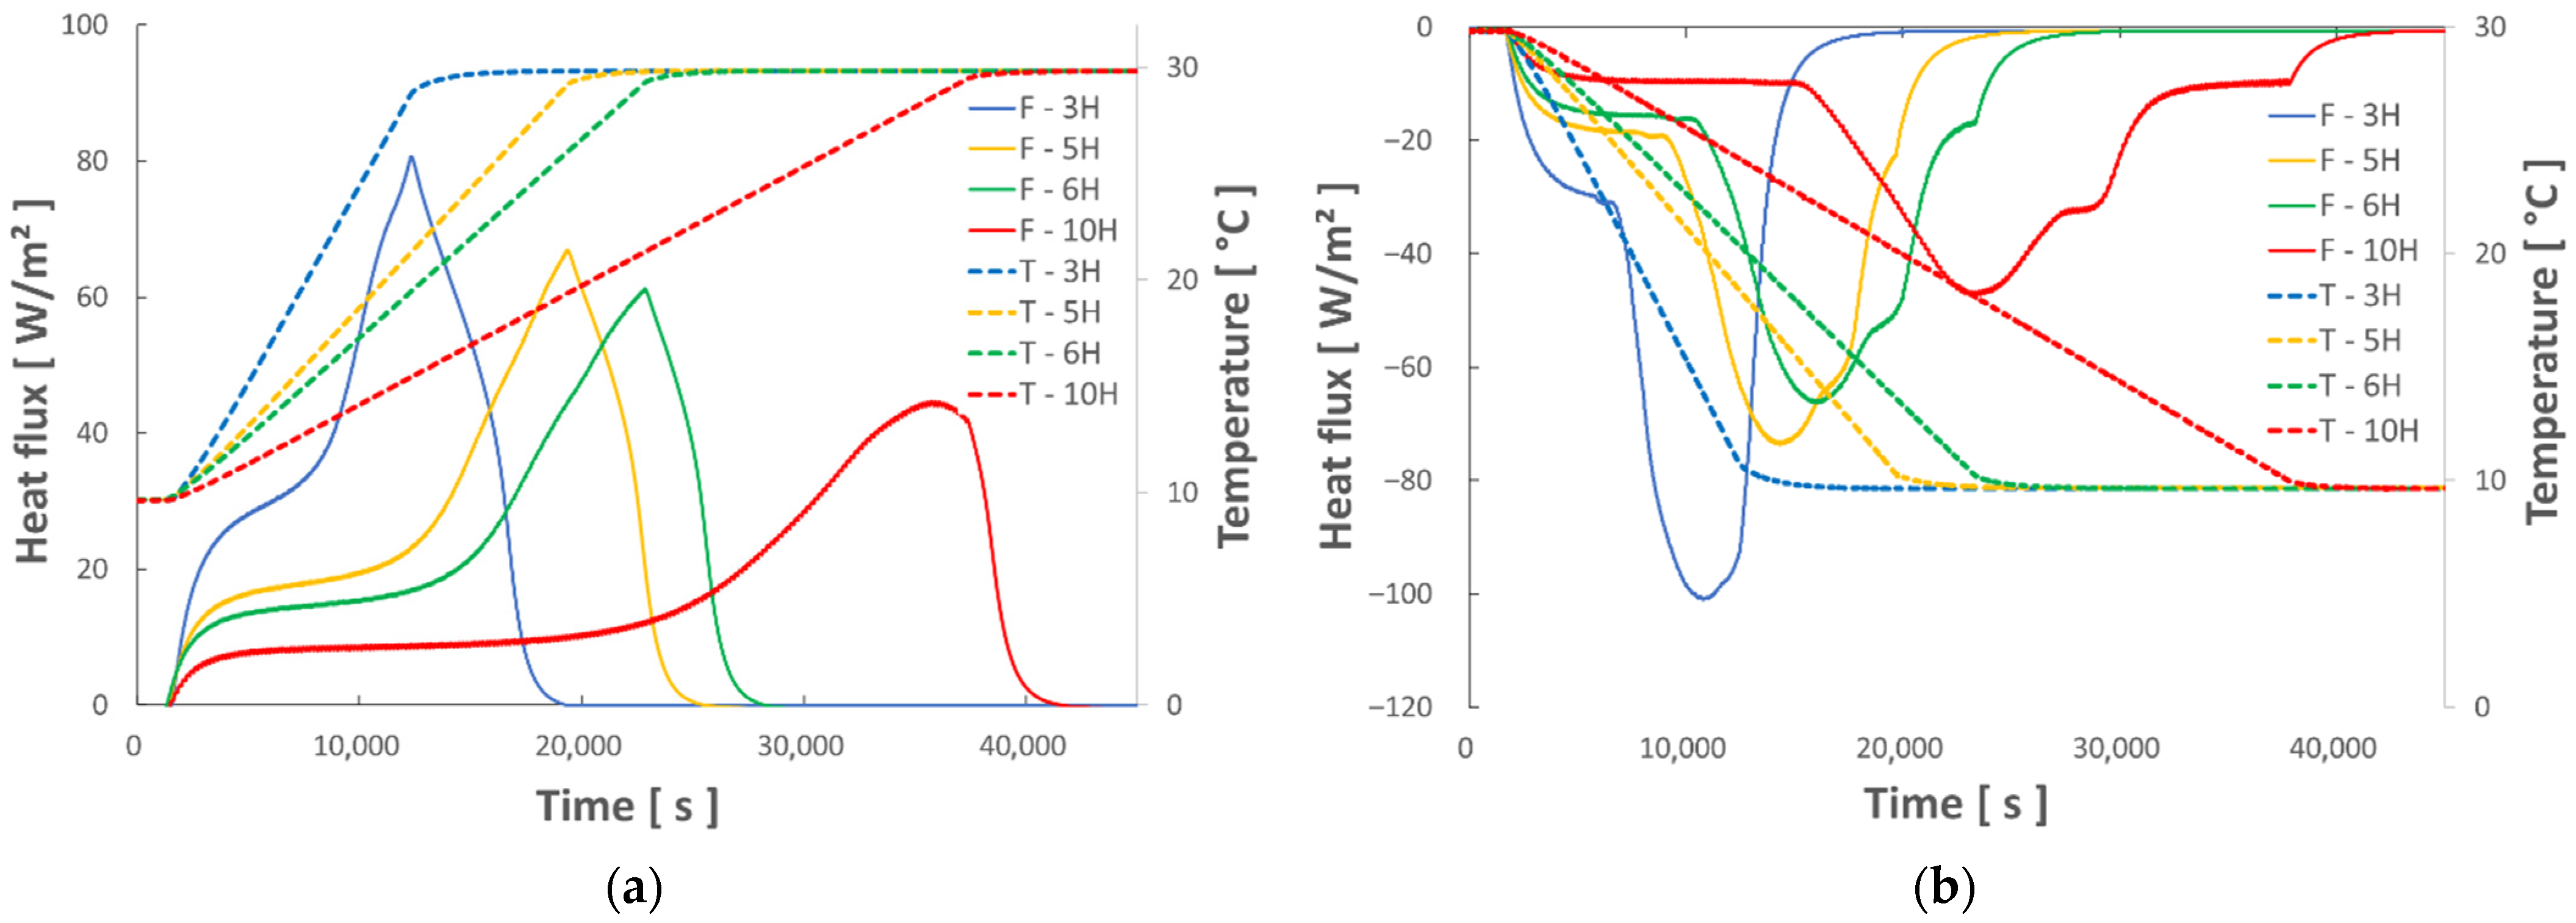
  • The various dynamic thermal loads (ramps) between 10° and 30 °C depict the different thermal behaviors well represented by the hybrid model. The energy balances performed between these two temperature levels show a good level of repeatability and measurement accuracy.
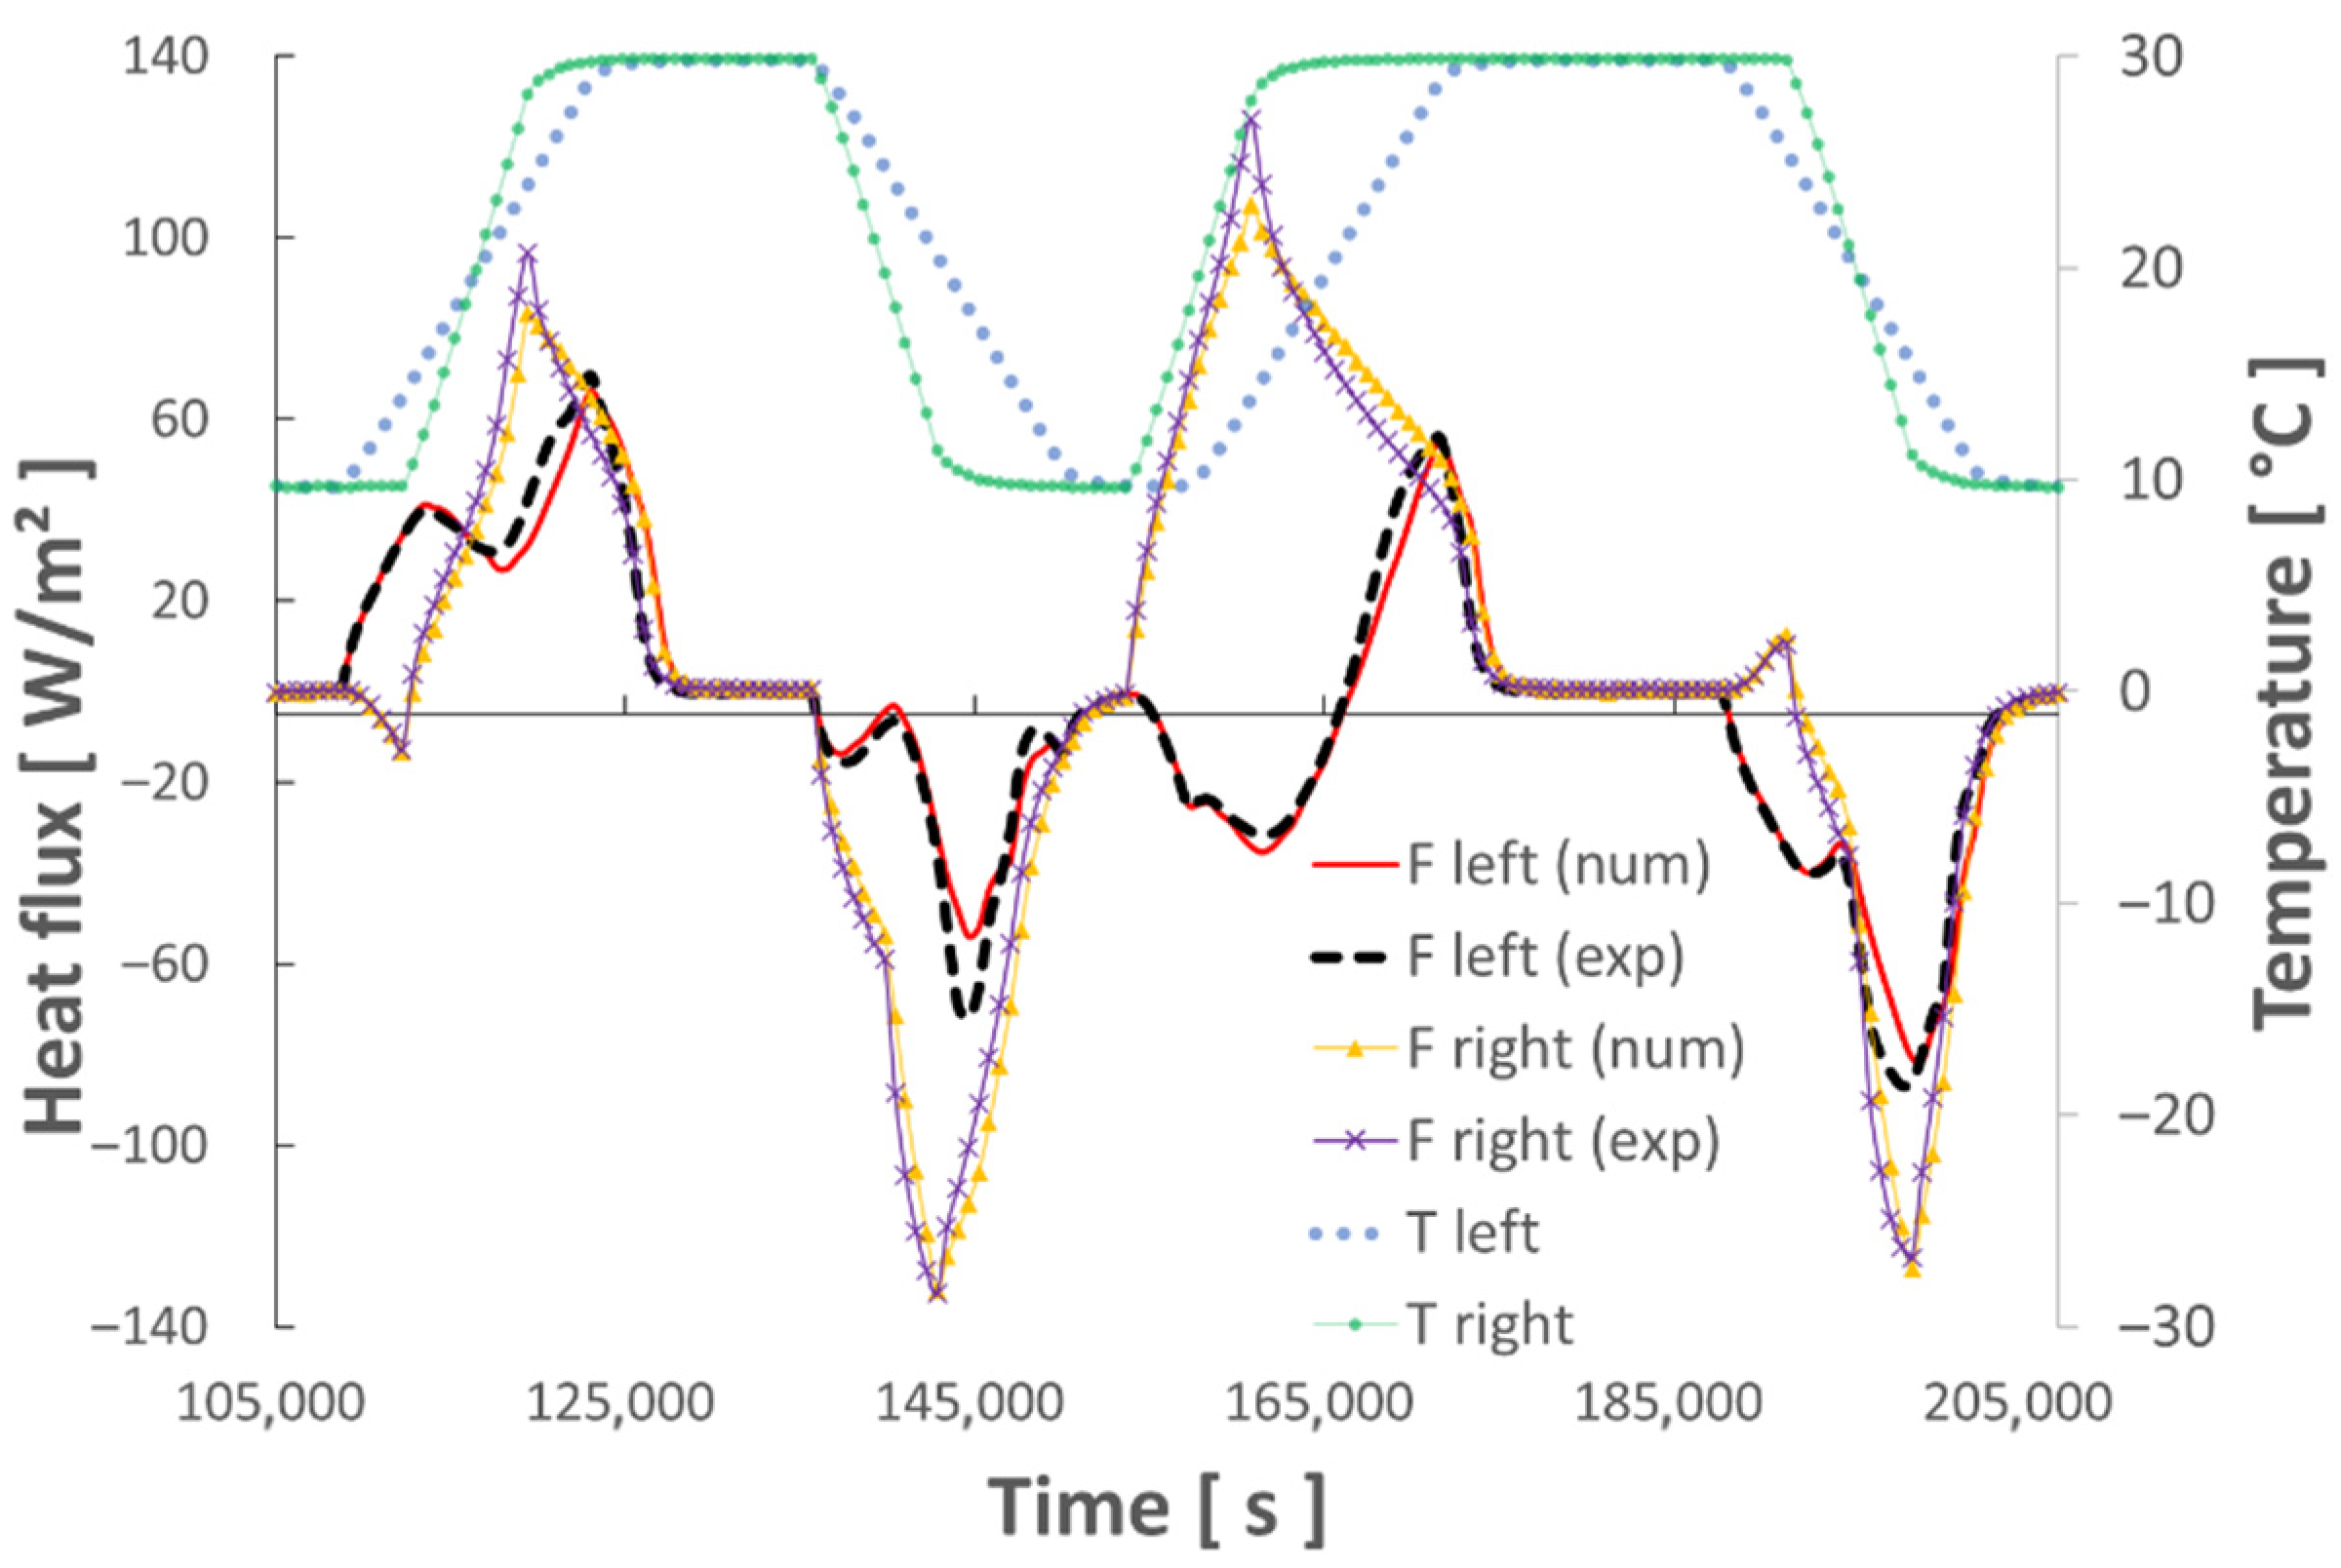
  • This model also takes into account the partial melting/solidification of the PCM, which can occur during its use in a building subjected to meteorological constraints.
  • The model has successfully characterized the thermophysical properties of the coating incorporating PCM and, in particular, the latent heat contained in the material. By knowing that the coating is loaded with 70% PCM and in comparison, with the DSC measurements conducted by the manufacturer, the latent heat identified by characterization could be verified.
  • An error calculation was used to determine uncertainties of around 4%, which appears acceptable for our application.
A subsequent work program would call for integrating this new hybrid model into a building simulation model in order to predict the energy performance of this type of coating.

Author Contributions

Conceptualization, H.T., P.T., L.Z., Y.C., H.L.; methodology P.T., L.Z., H.T., Y.C., H.L.; investigation, H.T., P.T., L.Z., Y.C., H.L.; data curation, H.T., P.T., L.Z.; writing-editing, H.T., P.T., L.Z., H.L; funding acquisition L.Z, H.L. All authors have read and agreed to the published version of the manuscript.

Funding

This research was funded by the University of Artois and MCI Technology company.

Conflicts of Interest

The authors declare that they have no known competing financial interests or personal relationships that could have appeared to influence the work reported in this paper.

Nomenclature

Symbols
aparameter for the Gumbel function axis (°C)
bparameter for the form of the Gumbel function (°C)
Cheat capacity (J·K−1)
cSspecific heat capacity when PCM is in the solid state (J·kg−1·K−1)
c L specific heat capacity when PCM is in the liquid state (J·kg−1·K−1)
ethickness (m)
f l i q liquid fraction of the hybrid model
f l i q _ b i n liquid fraction of the binary model
f G Gumbel function
f o b j objective function
Rc-Thermal contact resistance
hspecific enthalpy (J·kg−1)
LAlatent heat (J·kg−1)
mmass (kg)
nmesh number
Qenergy transferred (J)
Rresistance (m2·K·W−1)
Ssurface area (m2)
Ttemperature (°C)
ttime (s)
Uuncertainty
Greek symbols
ρdensity (kg.m-3)
ɸheat flux (W)
ψlatent heat distribution coefficients between the binary function and the Gumbel function
λthermal conductivity
Subscripts
Amelting of pure substance
calcalculation
expexperimentation
leftleft side of the sample
LPleft plate
Mend of melting
mduring the melting phase
modacquisition module
rightright side of the sample
RPright plate
sduring the solidification phase

References

  1. Ministry of Ecological Transition (France). Data and Statistical Studies for Climate Change, Energy, Environment, Housing, and Transport. Available online: https://www.statistiques.developpement-durable.gouv.fr/ (accessed on 2 February 2022).
  2. Abhat, A. Low temperature latent heat thermal energy storage: Heat storage materials. Sol. Energy 1983, 30, 313–332. [Google Scholar] [CrossRef]
  3. Hasnain, S.M. Review on sustainable thermal energy storage technologies, Part I: Heat storage materials and techniques. Energy Convers. Manag. 1998, 39, 1127–1138. [Google Scholar] [CrossRef]
  4. Ibrahim, D.; Marc, A.R. Thermal Energy Storage; Wiley: New York, NY, USA, 2002. [Google Scholar]
  5. Farid, M.M.; Khudhair, A.M.; Razack, S.A.K.; Al-Hallaj, S. A review on phase change energy storage: Materials and applications. Energy Convers. Manag. 2004, 45, 1597–1615. [Google Scholar] [CrossRef]
  6. Swanson, T.D.; Birur, G.C. NASA thermal control technologies for robotic spacecraft. Appl. Therm. Eng. 2003, 23, 1055–1065. [Google Scholar] [CrossRef] [Green Version]
  7. Hasan, A.; Hejase, H.; Abdelbaqi, S.; Assi, A.; Hamdan, M.O. Comparative Effectiveness of Different Phase Change Materials to Improve Cooling Performance of Heat Sinks for Electronic Devices. Appl. Sci. 2016, 6, 226. [Google Scholar] [CrossRef] [Green Version]
  8. Renteria, J.D.; Nika, D.L.; Balandin, A.A. Graphene Thermal Properties: Applications in Thermal Management and Energy Storage. Appl. Sci. 2014, 4, 525–547. [Google Scholar] [CrossRef] [Green Version]
  9. Frusteri, F.; Restuccia, G.; Vasta, S.; Leonardi, V. Thermal conductivity measurement of a PCM based storage system containing carbon fibers. Appl. Therm. Eng. 2005, 25, 1623–1633. [Google Scholar] [CrossRef]
  10. Xiao, X.; Zhang, P.; Li, M. Thermal characterization of nitrates and nitrates/expanded graphite mixture phase change materials for solar energy storage. Energy Convers. Manag. 2013, 73, 86–94. [Google Scholar] [CrossRef]
  11. Khudhair, A.M.; Farid, M.M. A review on energy conservation in building applications with thermal storage by latent heat using phase change materials. Energy Convers. Manag. 2004, 45, 263–275. [Google Scholar] [CrossRef]
  12. Salyer, I.O.; Sircar, A.K. Phase change materials for heating and cooling of residential buildings and other applications. In Proceedings of the 25th Intersociety Energy Conversion Engineering Conference, Reno, NV, USA, 12–17 August 1990. [Google Scholar]
  13. Shapiro, M.; Shapiro, M. Development of the Enthalpy Storage Materials, Mixture of Methyl Stearate and Methyl Palmitate; Subcontract Report to Florida Solar Energy Center; NREL: Golden, CO, USA, 1989. [Google Scholar]
  14. Liston, L.C. Using Mixtures of Fatty Acid Methyl Esters as Phase Change Materials for Concrete; Purdue University: West Lafayette, IN, USA, 2015; p. 199. [Google Scholar]
  15. Nikolić, R.; Marinović-Cincović, M.; Gadžurić, S.; Zsigrai, I.J. New materials for solar thermal storage—Solid/liquid transitions in fatty acid esters. Sol. Energy Mater. Sol. Cells 2003, 79, 285–292. [Google Scholar] [CrossRef]
  16. Li, L.; Yu, H.; Wang, X.; Zheng, S. Thermal analysis of melting and freezing processes of phase change materials (PCMs) based on dynamic DSC test. Energy Build. 2016, 130, 388–396. [Google Scholar] [CrossRef]
  17. Höhne, G.; Hemminger, W.; Flammersheim, H.-J. Differential Scanning Calorimetry; Springer: Berlin/Heidelberg, Germany, 1996. [Google Scholar]
  18. Richardson, M.J. Quantitative aspects of differential scanning calorimetry. Thermochim. Acta 1997, 300, 15–28. [Google Scholar] [CrossRef]
  19. Zhang, Y.; Jiang, Y. A simple method, the T-history method, of determining the heat of fusion, specific heat and thermal conductivity of phase-change materials. Meas. Sci. Technol. 1999, 10, 201. [Google Scholar]
  20. Feng, G.; Huang, K.; Xie, H.; Li, H.; Liu, X.; Liu, S.; Cao, C. DSC test error of phase change material (PCM) and its influence on the simulation of the PCM floor. Renew. Energy 2016, 87, 1148–1153. [Google Scholar] [CrossRef]
  21. Thonon, M.; Fraisse, G.; Zalewski, L.; Pailha, M. Towards a better analytical modelling of the thermodynamic behaviour of phase change materials. J. Energy Storage 2020, 32, 101826. [Google Scholar] [CrossRef]
  22. Sharma, A.; Tyagi, V.V.; Chen, C.R.; Buddhi, D. Review on thermal energy storage with phase change materials and applications. Renew. Sustain. Energy Rev. 2009, 13, 318–345. [Google Scholar] [CrossRef]
  23. Que, L.; Zhang, X.; Ji, J.; Gao, L.; Xie, W.; Liu, L.; Ding, X. Numerical Simulation and Experimental Research Progress of Phase Change Hysteresis: A Review. Energy Build. 2021, 253, 111402. [Google Scholar] [CrossRef]
  24. Gibout, S.; Franquet, E.; Haillot, D.; Bédécarrats, J.P.; Dumas, J.P. Challenges of the Usual Graphical Methods Used to Characterize Phase Change Materials by Differential Scanning Calorimetry. Appl. Sci. 2018, 8, 66. [Google Scholar] [CrossRef] [Green Version]
  25. Zalewski, L.; Franquet, E.; Gibout, S.; Tittelein, P.; Defer, D. Efficient Characterization of Macroscopic Composite Cement Mortars with Various Contents of Phase Change Material. Appl. Sci. 2019, 9, 1104. [Google Scholar] [CrossRef] [Green Version]
  26. Delcroix, B.; Kummert, M.; Daoud, A. Thermal Behavior Mapping of a Phase Change Material Between the Heating and Cooling Enthalpy-temperature Curves. Energy Procedia 2015, 78, 225–230. [Google Scholar] [CrossRef] [Green Version]
  27. Thonon, M.; Fraisse, G.; Zalewski, L.; Pailha, M. Analytical Modelling of PCM Supercooling Including Recalescence for Complete and Partial Heating/Cooling Cycles. Appl. Therm. Eng. 2021, 190, 116751. [Google Scholar] [CrossRef]
  28. Barz, T.; Emhofer, J.; Marx, K.; Zsembinszki, G.; Cabeza, L.F. Phenomenological Modelling of Phase Transitions with Hysteresis in Solid/Liquid PCM. J. Build. Perform. Simul. 2019, 12, 770–788. [Google Scholar] [CrossRef] [Green Version]
  29. Sam, M.N.; Caggiano, A.; Mankel, C.; Koenders, E. A Comparative Study on the Thermal Energy Storage Performance of Bio-Based and Paraffin-Based PCMs Using DSC Procedures. Materials 2020, 13, 1705. [Google Scholar]
  30. Fabiani, C.; Pisello, A.L.; Barbanera, M.; Cabeza, L.F.; Cotana, F. Assessing the Potentiality of Animal Fat Based-Bio Phase Change Materials (PCM) for Building Applications: An Innovative Multipurpose Thermal Investigation. Energies 2019, 12, 1111. [Google Scholar] [CrossRef] [Green Version]
  31. Yu, S.; Jeong, S.G.; Chung, O.; Kim, S. Bio-based PCM/carbon nanomaterials composites with enhanced thermal conductivity. Sol. Energy Mater. Sol. Cells 2014, 120, 549–554. [Google Scholar] [CrossRef]
  32. Castellón, C.; Medrano, M.; Roca, J.; Cabeza, L.F.; Navarro, M.E.; Fernández, A.I.; Lázaro, A.; Zalba, B. Effect of microencapsulated phase change material in sandwich panels. Renew. Energy 2010, 35, 2370–2374. [Google Scholar] [CrossRef]
  33. Toppi, T.; Mazzarella, L. Gypsum based composite materials with micro-encapsulated PCM: Experimental correlations for thermal properties estimation on the basis of the composition. Energy Build. 2013, 57, 227–236. [Google Scholar] [CrossRef]
  34. Winco Technologies Technopôle Saint-Brieuc, Inertek. Winco Technol. 2020, 10. Available online: https://www.winco-tech.com/fr/accueil/ (accessed on 10 February 2020).Winco Technologies Technopôle Saint-Brieuc, Inertek. Winco Technol. 2020, 10.
  35. Tittelein, P.; Gibout, S.; Franquet, E.; Johannes, K.; Zalewski, L.; Kuznik, F.; Dumas, J.-P.; Lassue, S.; Bédécarrats, J.-P.; David, D. Simulation of the thermal and energy behaviour of a composite material containing encapsulated—PCM: Influence of the thermodynamical modelling. Appl. Energy 2015, 140, 269–274. [Google Scholar] [CrossRef]
  36. Younsi, Z.; Zalewski, L.; Lassue, S.; Rousse, D.R.; Joulin, A. A Novel Technique for Experimental Thermophysical Characterization of Phase—Change Materials. Int. J. Thermophys. 2011, 32, 674–692. [Google Scholar] [CrossRef]
  37. Joulin, A.; Younsi, Z.; Zalewski, L.; Lassue, S.; Rousse, D.R.; Cavrot, J.-P. Experimental and numerical investigation of a phase change material: Thermal-energy storage and release. Appl. Energy 2011, 88, 2454–2462. [Google Scholar] [CrossRef]
  38. Mussatti, E.; Merlini, C.; Barra, G.; Guths, S.; Oliveira, A.; Siligardi, C. Evaluation of the Properties of Iron Oxide-Filled Castor Oil Polyurethane. Mater. Res. 2013, 16, 65–70. [Google Scholar] [CrossRef] [Green Version]
  39. Alifanov, O.M. Iterative Regularization of Inverse Problems. In Inverse Heat Transfer Problems; Alifanov, O.M., Ed.; Springer: Berlin/Heidelberg, Germany, 1994; pp. 227–328. [Google Scholar]
  40. Karkri, M.; Jarny, Y.; Mousseau, P. Inverse heat transfer analysis in a polymer melt flow within an extrusion die. Inverse Probl. Sci. Eng. 2005, 13, 355–375. [Google Scholar] [CrossRef]
  41. Franquet, E.; Gibout, S.; Tittelein, P.; Zalewski, L.; Dumas, J.-P. Experimental and theoretical analysis of a cement mortar containing microencapsulated PCM. Appl. Therm. Eng. 2014, 73, 30–38. [Google Scholar] [CrossRef]
  42. Bastani, A.; Haghighat, F.; Kozinski, J. Designing building envelope with PCM wallboards: Design tool development. Renew. Sustain. Energy Rev. 2014, 31, 554–562. [Google Scholar] [CrossRef]
  43. Hu, H.; Argyropoulos, S.A. Mathematical modelling of solidification and melting: A review. Modelling Simul. Mater. Sci. Eng. 1996, 4, 371–396. [Google Scholar]
  44. Nabavitabatabayi, M.; Haghighat, F.; Moreau, A.; Sra, P. Numerical analysis of a thermally enhanced domestic hot water tank. Appl. Energy 2014, 129, 253–260. [Google Scholar] [CrossRef]
  45. Liu, M.; Sun, Y.; Bruno, F. A review of numerical modelling of high-temperature phase change material composites for solar thermal energy storage. J. Energy Storage 2020, 29, 101378. [Google Scholar] [CrossRef]
  46. Maréchal, W. Utilisation de Méthodes Inverses Pour la Caractérisation de Matériaux à Changement de Phase (MCP). Ph.D. Thesis, University of Pau, Pau, France, 2014. [Google Scholar]
  47. Weisstein, E.W.; Gumbel Distribution. Wolfram MathWorld. Available online: https://mathworld.wolfram.com/GumbelDistribution.html (accessed on 2 February 2022).
  48. Gómez, Y.M.; Bolfarine, H.; Gómez, H.W. Gumbel distribution with heavy tails and applications to environmental data. Math. Comput. Simul. 2019, 157, 115–129. [Google Scholar] [CrossRef]
  49. Merlin, K. Caractérisation Thermique d’un Matériau à Changement de Phase Dans une Structure Conductrice. Ph.D. Thesis, University of Nantes, Nantes, France, 2016. [Google Scholar]
  50. Ahmad, M.F.; Isa, N.A.M.; Lim, W.H.; Ang, K.M. Differential evolution: A recent review based on state-of-the-art works. Alex. Eng. J. 2022, 61, 3831–3872. [Google Scholar] [CrossRef]
  51. Krömer, P.; Platos, J.; Snasel, V. Differential evolution for the optimization of low-discrepancy generalized Halton sequences. Swarm Evol. Comput. 2020, 54, 100649. [Google Scholar] [CrossRef]
  52. Jin, X.; Xu, X.; Zhang, X.; Yin, Y. Determination of the PCM melting temperature range using DSC. Thermochim. Acta 2014, 595, 17–21. [Google Scholar] [CrossRef]
  53. Gschwander, S.; Haussmann, T.; Hagelstein, G.; Solé, A.; Cabeza, L.F.; Diarce, G.; Hohenauer, W.; Lager, D.; Ristic, A.; Rathgeber, C.; et al. Standardization of PCM Characterization via DSC. In Proceedings of the 13th International Conference on Energy Storage, Beijing, China, 19–21 May 2015. [Google Scholar]
  54. Chandrasekharan, R.; Lee, E.S.; Fisher, D.E.; Deokar, P.S. An Enhanced Simulation Model for Building Envelopes with Phase Change Materials—ProQuest. ASHRAE Trans. 2013, 119, 1–10. [Google Scholar]
  55. Bony, J.; Citherlet, S. Numerical model and experimental validation of heat storage with phase change materials. Energy Build. 2007, 39, 1065–1072. [Google Scholar] [CrossRef]
  56. Moreles, E.; Huelsz, G. Comparison of two hysteresis models of phase change materials (PCMs) for application in building envelopes. In Proceedings of the Conference on first UG-ASME-SOMIM Symposium of Energies and Thermal Sciences, Guanajuato, Mexico, 9–10 February 2016. [Google Scholar]
  57. Biswas, K.; Shukla, Y.; Desjarlais, A.; Rawal, R. Thermal characterization of full-scale PCM products and numerical simulations, including hysteresis, to evaluate energy impacts in an envelope application. Appl. Therm. Eng. 2018, 138, 501–512. [Google Scholar] [CrossRef]
  58. Hu, Y.; Guo, R.; Heiselberg, P.; Johra, H. Modeling PCM Phase Change Temperature and Hysteresis in Ventilation Cooling and Heating Applications. Energies 2020, 13, 6455. [Google Scholar] [CrossRef]
  59. Delabrouille, J.C.; Rinck, E. Surfusion de l’étain, influence la pureté du métal. In Weekly Reports of the Sessions of the Academy of Sciences; CRAS: Paris, France, 1965; Volume 2, pp. 131–141. [Google Scholar]
  60. Dumas, J.-P.; Babin, L. Etude de la Rupture de Métastabilitsme et du Polymorphisme de Corps Organiques. Ph.D. Thesis, Université de Pau et des Pays de l’Adour, Pau, France, 1976. [Google Scholar]
  61. Bedecarrats, J.-P. Etude des Transformations des Matériaux à Changements de Phase Encapsulés Destinés au Stockage du Froid. Ph.D. Thesis, Université de Pau et des Pays de l’Adour, Pau, France, 1993. [Google Scholar]
  62. Meyn, L. An uncertainty propagation methodology that simplifies uncertainty analyses. In Proceedings of the 38th Aerospace Sciences Meeting and Exhibit, Reno, NV, USA, 10–13 January 2000. [Google Scholar]
  63. Wang, Y.; Dai, J.; Xiao, P. Research on Measurement Technology of Thermophysical Properties for Full-Scale Phase Change Material Product in a Container. Appl. Sci. 2019, 9, 2422. [Google Scholar] [CrossRef] [Green Version]
  64. Keithley. Model 2700 Multimeter/Data Acquisition System (User’s Manual); Keithley Instruments: Cleveland, OH, USA, 2015. [Google Scholar]
  65. TC SA. Thermocouple and Resistance Thermometry, Version 6.0; Institut International du Froid: Paris, France, 1999. [Google Scholar]
Figure 1. (a) Thermal properties of paraffin PCM; (b) thermal properties of organic PCM; (c) thermal properties of eutectic mixture; (d) thermal properties of inorganic PCM [2].
Applsci 12 03827 g001aApplsci 12 03827 g001b
Figure 2. Enthalpy distribution (3 °C/h) of Inertek 23 (DSC, measurement by MCI Technologies).
Applsci 12 03827 g002
Figure 3. View of the ETMV8 Sample-gypsum board used for experimental tests.
Applsci 12 03827 g003
Figure 4. Experimental apparatus.
Applsci 12 03827 g004
Figure 5. Comparison of the experimental heat flux of the ETMV 8 coating with a binary solution.
Applsci 12 03827 g005
Figure 6. Evolution of the derivate of enthalpy as a function of time.
Applsci 12 03827 g006
Figure 7. Evolution of the heat flux exchanged between the plate and the sample: binary solution and experimental.
Applsci 12 03827 g007
Figure 8. Simplified model of the gypsum board (Gb) and ETMV8 (E8) complex.
Applsci 12 03827 g008
Figure 9. Evolution of the enthalpy derivative vs. temperature (hybrid model).
Applsci 12 03827 g009
Figure 10. Evolution of the enthalpy derivate of the binary and Gumbel’s functions used to create the hybrid model.
Applsci 12 03827 g010
Figure 11. Evolution of the liquid fraction vs. temperature.
Applsci 12 03827 g011
Figure 12. Evolution of the heat flux (F–xH) exchanged between the plate and the sample, for various temperature ramps (T–xH): melting phase (a), and solidification phase (b).
Applsci 12 03827 g012
Figure 13. Evolution of the flux exchanged between the plate and the sample (10-h ramp).
Applsci 12 03827 g013
Figure 14. Evolution of the flux exchanged between the plate and the sample (3-h ramp).
Applsci 12 03827 g014
Figure 15. Evolution of the flux exchanged between the plate and the sample (6-h ramp).
Applsci 12 03827 g015
Figure 16. Evolution of the flux exchanged between the plate and the sample (asymmetric ramp).
Applsci 12 03827 g016
Figure 17. Evolution of the liquid fraction during partial melting/solidification, as used in our model.
Applsci 12 03827 g017
Figure 18. Calculation of the liquid fraction from enthalpy.
Applsci 12 03827 g018
Figure 19. Evolution of the flux exchanged between the plate and the sample (partial melting).
Applsci 12 03827 g019
Figure 20. Evolution of the flux exchanged between the plate and the sample (partial solidification).
Applsci 12 03827 g020
Figure 21. Uncertainties of heat flux measurement on the ETMV 8 coating.
Applsci 12 03827 g021
Table 1. PCM selection criteria [2].
ChemicalThermodynamicEconomic
Chemically stableMelting pointInexpensive
Non-flammable
Non-explosive
Non-corrosive
High latent heat of melting
High conductivity and density
Limited supercooling
Volume variation during phase transition
Easy to produce
Available in large quantities
Durability
Table 2. Composition of the ETMV 8 coating.
MaterialComposition [%]Density [kg·m−3]
Coating
Inertek 23
ETMV 8
30
70
100
650
350
610
Table 3. Properties of gypsum boards.
λ S = 0.30 W·m−1·°C−1 c s   = 1071 J·kg−1·°C−1ρ = 815 kg·m−3
Table 4. Thermal characteristics of ETMV 8.
T A   m = 29.02 T A   s = 23.94 λ S = 0.135 c s   = 1213LA = 126,300
T M m   = 26.89 T M s = 22.71 λ L = 0.128CL = 1124
Table 5. Parameters of the Gumbel function.
Parameters   of   the   function   f G u m b e l   melting
( 1 ψ m ) . L A = 81,942am = 24.18bm = 0.98
Parameters   of   the   function   f G u m b e l   s o l i d i f i c a t i o n
( 1 ψ s ) . L A = 12,300as = 17.74bs = 0.4
Table 6. Energy balance, based on the experimental heat flux.
Experimental
LoadingMelting [J]Solidification [J]Difference [%]
3-h ramp136,233135,7270.37
6-h ramp134,579135,8500.94
10-h ramp135,770135,9370.12
Max difference [%]1.20.2
Table 7. Energy balance, from the numerical heat flux.
Numerical
LoadingMelting [J]Solidification [J]Difference [%]
3-h ramp137,232133,9682.38
6-h ramp137,235133,9782.37
10-h ramp137,225133,9222.41
Difference [%]1.0 10−24.0 10−2
Table 8. Uncertainties related to the heat flux and temperature measurements.
Heat fluxComponentDesignationUncertainty [W/m2]Comment
Captec fluxmeterUɸ2.04For 100 W·m−2
Data acquisition systemUmod,ɸ0.0009[64]
Compound uncertaintyUc,ɸ2.04(Equation (20))
TemperatureComponentDesignationUncertainty [°C]Comment
T-type thermocoupleUT0.5[65]
Data acquisition systemUmod, T0.001[64]
Compound uncertaintyUc,T0.5(Equation (21))
Publisher’s Note: MDPI stays neutral with regard to jurisdictional claims in published maps and institutional affiliations.

