Article

Theoretical Feasibility Analysis of Fast Back-Projection Algorithm for Moon-Based SAR in Time Domain

1
Key Laboratory of Digital Earth Science, Aerospace Information Research Institute, Chinese Academy of Sciences, Beijing 100094, China
2
College of Marine Technology, Ocean University of China, Qingdao 266100, China
*
Author to whom correspondence should be addressed.
Appl. Sci. 2022, 12(8), 3850; https://doi.org/10.3390/app12083850
Submission received: 24 December 2021 / Revised: 14 March 2022 / Accepted: 8 April 2022 / Published: 11 April 2022

Abstract

:
Nowadays, the Earth observation based on the Moon has attracted attention from many researchers and relevant departments. There also exists a considerable amount of interest in monitoring large-scale and long-term geoscience phenomena using the Moon-based SAR (MBS). However, the Earth’s observation from MBS has long transmission time, and the relative motion of MBS with its Earth ground target (EGT) is much different to the space-borne SAR, the above reasons indicate that the traditional stop-and-go model is no longer suitable for MBS in frequency domain imaging. Here a dual-path separate calculation method for single pulse is presented in this paper for a better match of a real scenario, and then the slant range is fitted to a high-order polynomial series. The MBS’s location, the synthetic aperture time and other factors have effects on length of the dual- path and fit bias. Without thoroughly investigated phase de-correlation processing in frequency domain, and to avoid computational costs in traditional back-projection (BP) algorithm, the paper first proposes a fast back-projection (FBP) algorithm in time domain for MBS, a platform that has long transmission time and long synthetic aperture time. In the FBP algorithm, the original method, that projected echo on all pixels in the imaging area, is changed to projected echo on a centerline instead. A suitable interpolation for points on the centerline is adopted to reduce the projected error; the synthetic aperture length and imaging area are also divided into subsections to reduce computation cost. The formula indicates that the range error could be control once the product of sub-imaging area’s length and sub-aperture’s length stay constant. Through the theoretical analysis, the detailed range difference mainly at apogee, perigee, ascending, and descending nodes indicate the necessity to separately calculate the dual-path for MBS’s single pulse transmission in Earth-Moon motion, with real ephemeris been adopted; then, the high-order polynomial fitting will better describe the motion trajectory. Lastly, the FBP algorithm proposed is simulated in a specific scenario under acceptable resolution, and the result shows its feasibility for image compression.

Graphical Abstract

1. Introduction

In recent years, using the Moon as a platform for remote sensing monitoring, (e.g., the global energy balance, the ocean vortex, the earth’s surface tide, etc.) has attract increasing attention across different research fields [1,2]. As the only natural satellite of Earth, the Moon’s unique rotation and revolution laws make it as a stable platform for the Earth observation with long-term and large-scale characteristics [3,4], which has an advantage over the space-born SAR platform [5,6,7]. Accordingly, the MBS would be a reliable supplement to the existing remote sensing system [8,9,10].
However, the MBS has several unique features different from space-borne SAR plat-form. First, the perigee, apogee, and the average distance in a sidereal month between the Earth and Moon centroids are approximately 3.6 × 10⁵, 4.0 × 10⁵, and 3.8 × 10⁵ km, respectively. Such a long distance brings about longer echo delay time and longer synthetic aperture time, which makes the traditional stop-and-go model, in which the position of the EGT and the platform (e.g., aircraft) are considered the same when echo is transmitted and received, no longer suitable for MBS. Among Earth-Moon periodic motion, the dual-path delay time of the echo can exceed 2.3 s, thus the distance between echo transmitted and received of MBS changes about 2 km as Moon’s rotation speed fluctuates between about 960 km/s to about 1100 km/s, so to continue to reckon the transmission path of MBS using the stop-and-go model is inconsistent with reality. In the analysis of MBS scenario, the slant history in dual path are separately calculated. Second, although the ratio of average distance between Earth and Moon to the average Moon radius is only a trivial value of 0.0046, for a more accurate description of slant range and phase shift between MBS and EGT, the MBS should not simply be considered to coincide with the Moon centroid, because any locations of MBS in the near side will bring varying isorange distribution, and thus bring varying visibility of EGT caused by signal reflective properties or terrain occlusion. Third, since the echo of MBS will pass through the entire ionosphere and atmosphere, the two spheres will undoubtedly have adverse effects not only on calculation of slant history and phase history especially in frequency domain, but also on signal power attenuation. In contrast to the limits on load weight, volume, and size for a satellite, i.e., the TerraSAR-X, ALOS-PALSAR, GF-3 and so on, the same limitations on MBS are able to overcome owing to unlimited deployment on Moon’s surface. It is believed that in the near future, MBS can be designed using the same aperture size and power supply as on those used on Earth. Moreover, the ground-based imaging radar technology and actual observation experiments, i.e., on the Moon, obtain valuable experience and data, which in turn helps the research of MBS [11,12]. Fourth, in contrast to a low orbit platform, the small elliptic orbit and long distance during Earth-Moon motion makes the zero-Doppler plane and valid pulse repeat frequency (PRF) no longer stable, but changes along with MBS’s revolution. In existing research, the track speed of MBS in the near side is almost perpendicular to the line from MBS to Earth centroid, this is to say, there exist intersections of zero-Doppler plane on the Earth’s surface for any MBS located in the near side, and Doppler centroid of MBS can be compensated for after at least two-dimensional attitude steering. According to zebra map of a valid PRF interval, the PRF can be set higher when incident angle is small, but reversely when incident angle becomes bigger [13].
Currently, the MBS is still at a theoretical analysis stage, lacking actual data for pro-cessing, but longing for extensive observation of Earth’s phenomena requires this theoretical analysis in advance. Moreover, the development of ground-based imaging radar technology on Moon would also prove feasibility of MBS. During the processing of a SAR image, incorrect slant range and Doppler centroid estimates will result in high coupling feature of the azimuth and range signal, thus increasing the complexity of signal processing and sacrificing the quality of imaging formulation in frequency domain [14,15], all of which are unfavorable for MBS.
To avoid the disadvantages in decoupled range and azimuth signals in frequency domain, this paper utilizes a method in time domain, namely the BP algorithm for MBS imaging. As showed in Figure 1, a MBS can continuously monitor various Earth targets (e.g., the red solid dot of imaging area) during its synthetic aperture time in large scale. Moreover, to further reduce the computational complexity, the BP algorithm will be converted to a FBP algorithm, as will be explained later in this paper.
The feasibility of ground-based imaging radar technology on Moon might indicate the mission is reasonable. The size, power, etc. of MBS can use the same scale as that used on Earth. With a primary focus on the renewed algorithm for MBS, the influence of attenuation in signal transmission, the light aberration, and also MBS’s and EGT’s digital elevation mode (DEM) on imaging are not considered. The remainder of this paper will prove the effectiveness of MBS from two aspects, i.e., the spatial relationship and the establishment of the algorithm model; the framework is organized as below. In Section 2, a description of the FBP algorithm, mainly regarding the division of aperture and imaging areas for MBS, is presented based on real motion between MBS and EGT. The real motion, including the range history, is calculated separately for uplink and downlink, based on ephemeris. In Section 3, a theoretical analysis of the image is provided, and the target responses are simulated for confirming the superiority of FBP. Finally, Section 4 offers a brief conclusion for the simulation.

2. Algorithm for MBS

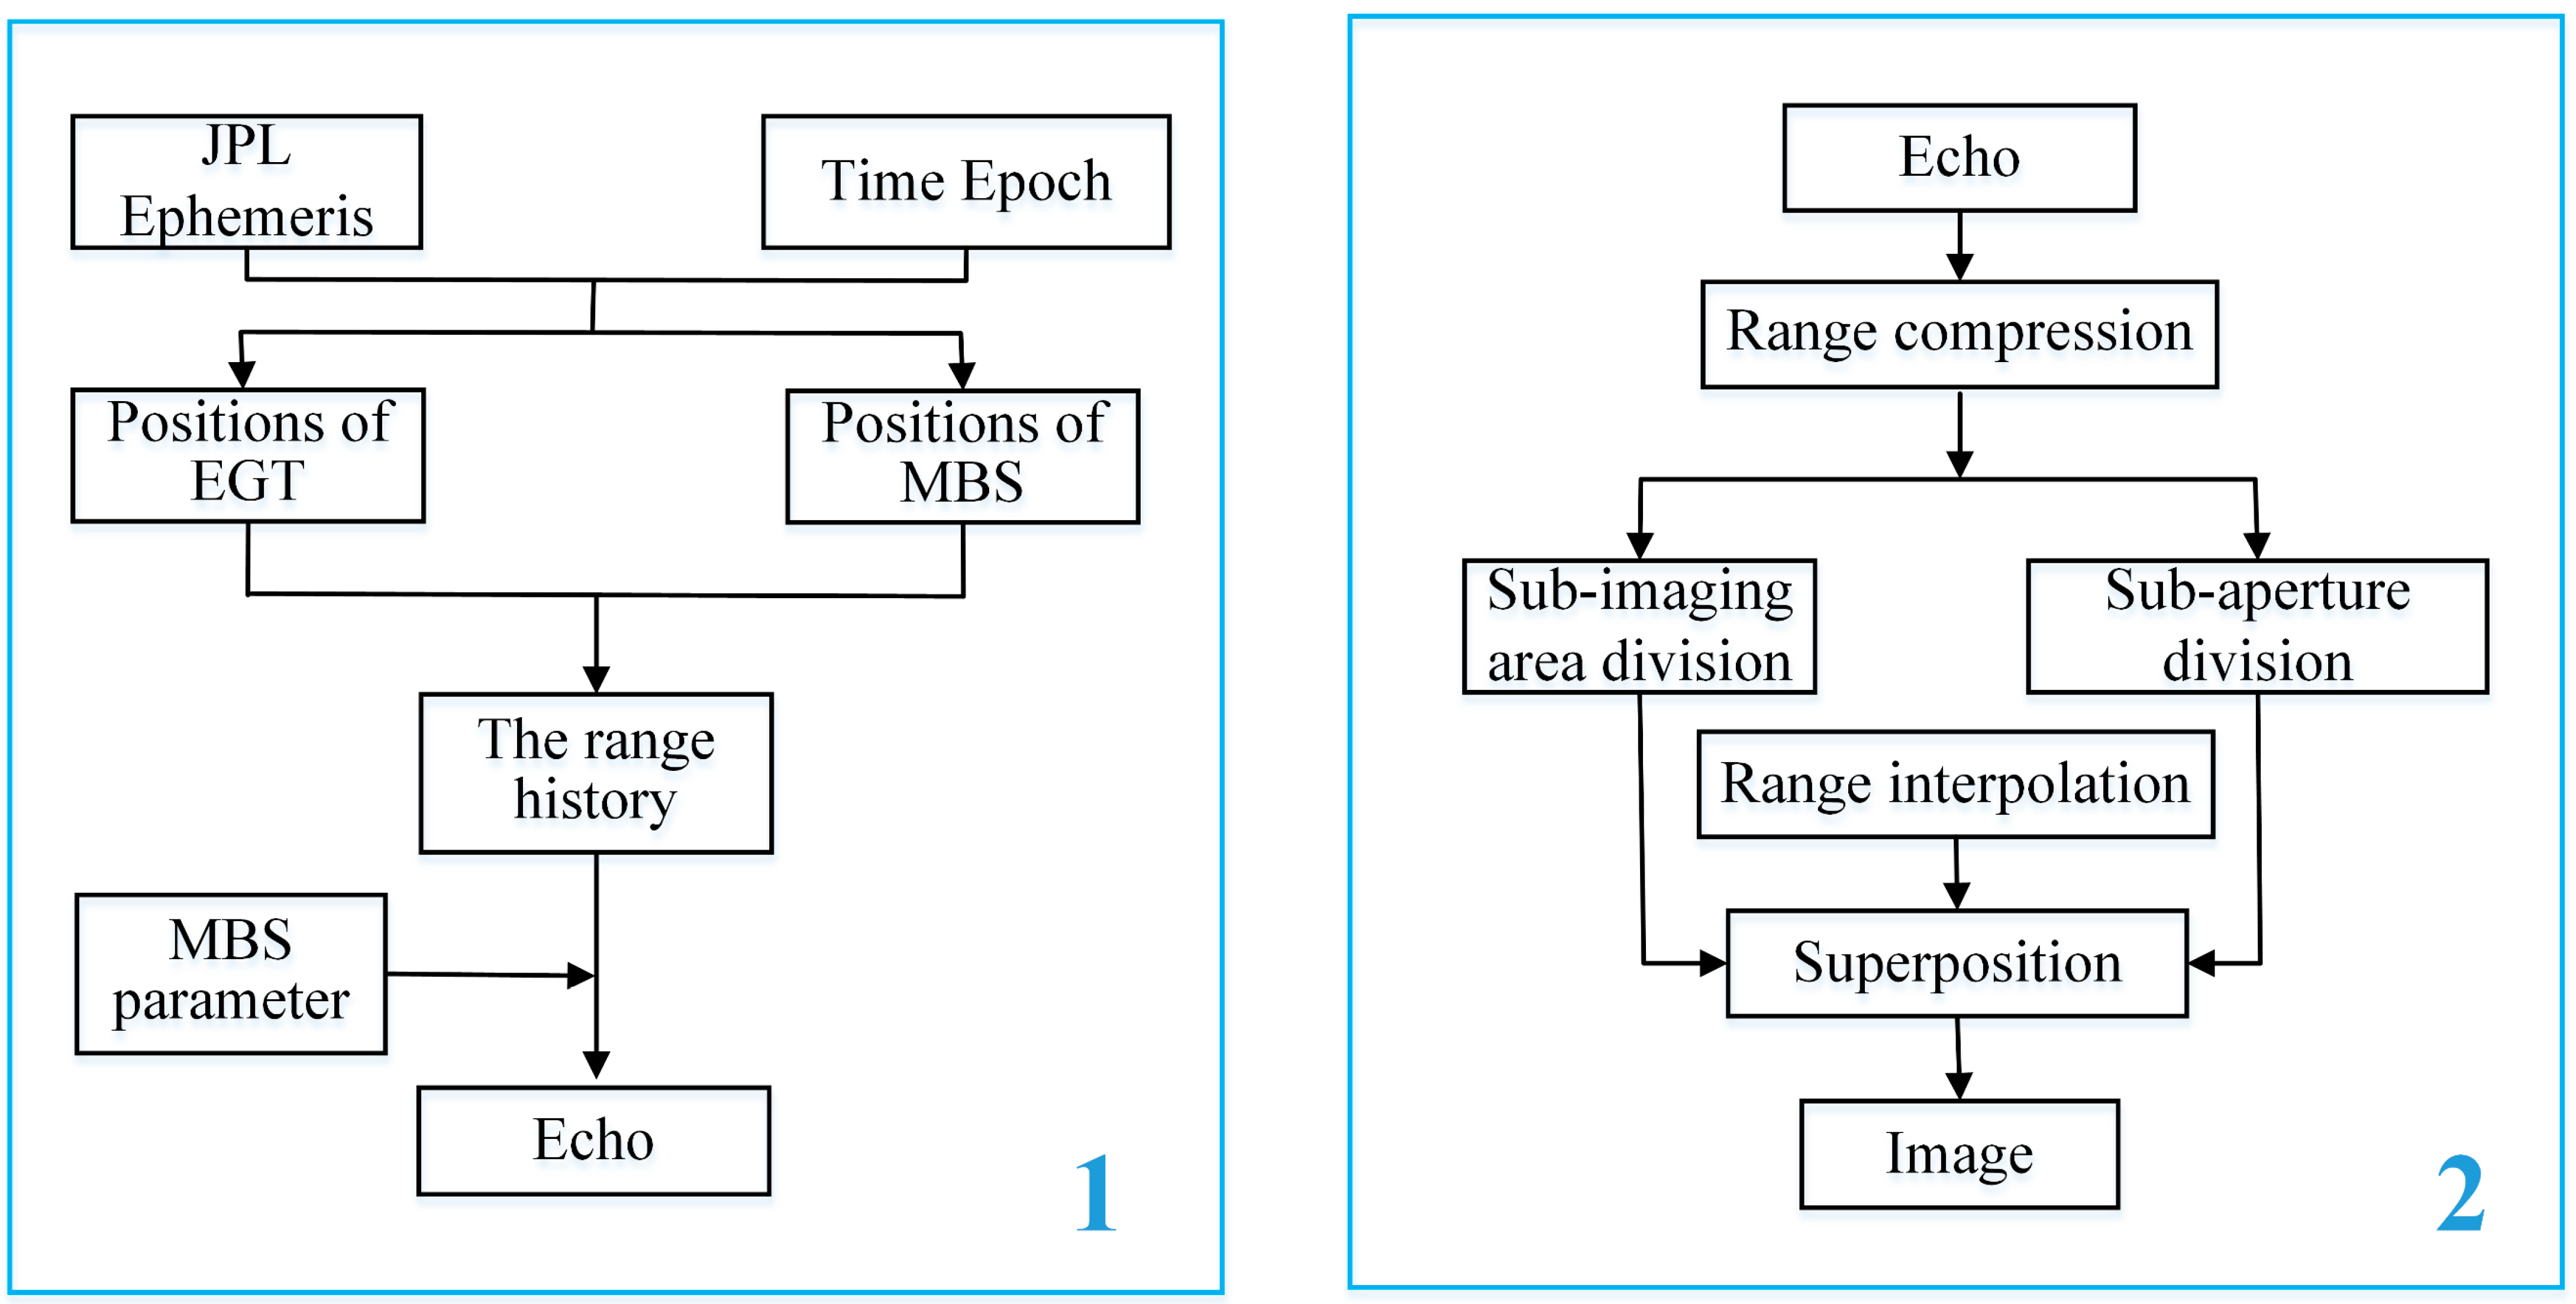
Unlike the space-born SAR, the imaging of MBS is much different because of the complex Earth-Moon motion relationship, as well as atmospheric and ionosphere disturbances. The FBP algorithm in this paper mainly focus on the spatial relationship and the establishment of the algorithm model, as seen in the detailed flow chart displayed in Figure 2.
Box 1 shows the processing of echo generated from the range history between MBS and EGT; since the Moon revolves around Earth with Earth’s rotation, the ex-poser time for MBS’ achievable EGT changes significantly. Here, the range history is calculated based on a real scenario, e.g., the JPL ephemeris and EOP at different time epochs, and other MBS parameters, such as carrier frequency, bandwidth, and look angle (here, an angle between a vector, i.e., from MBS to EGT, and another vector, i.e., from MBS to Earth centroid, is calculated as the look angle) mainly contribute to the beam shape on Earth, which is related to the MBS’s resolution. The detailed introduction of how to calculate the range history is displayed in Section 2.2. Box 2 shows the progression of the final image generated from the echo in Box 1. The sub-aperture division and sub-imaging area are the keys to the FBP algorithm. In the traditional BP algorithm, the sampling echo is projected on all pixels of the image area; this coherent method incurs huge computational time costs, especially when sampling points are very large. Therefore, for reducing time consumption without a loss of generality, the echo projection method used in FBP is changed to a centerline based on the sub-aperture and sub-imaging area division within acceptable error; the range interpolation on the projected centerline contributes to a reduction of range error; the final image will be generated after the superposition processing. The detailed introduction of the core processing will be displayed in Section 2.1.

2.1. Division Mode in FBP

According to the imaging process of BP algorithm, the dual-delay time from SAR platform to each point in imaging area is calculated; then compensation phase is added to the echo corresponding to each point in time domain regarding the range compressing process, and the final imaging is received by coherently accumulating the projection data consistent with different azimuth moments [16,17]. After the range matching and filtering, the echo of EGT is expressed in Equation (1), as shown below:
s ( η , τ ) = A · e x p ( j · 4 π · R ( η ) λ ) · s i n c ( τ 2 · R ( η ) c )
where λ is the wavelength of SAR platform; c is light speed in vacuum; τ is the fast time at range direction; R(η) is the slant range between MBS and its corresponding EGT in slow time η at azimuth direction; and A is the signal amplitude, which indicates the reflective properties of EGT and is often deemed as a constant of one for simplicity. Unlike the slant range calculated in a low orbit platform, its trajectory can be replaced with second-order hyperbola under a constant speed with little change, the curve motion and the locations’ arbitrariness of MBS no longer defines trajectory and speed as platforms in a low orbit; a detail description will be provided in Section 2.2.
After the echo has been received, each point in imaging area is projected to the echo domain, forming the migration trajectory of EGT; then, the complex data of EGT is obtained after the echo been superimposed. The complex data of each pixel (i,k) in the imaging area can be expressed as shown below:
f ( i , k ) = 0.5 t 0.5 t s i k ( η , τ ( η ) ) · e x p ( j · 4 π · R ( η ) λ ) d t
where τ ( η ) = 2 · R ( η ) c indicates the dual-delay time at the azimuth time η, t is the synthetic aperture time of MBS.
Since each point in image area has been projected on echo domain in the BP algorithm, if the sampling numbers in azimuth direction is N a , the pixel numbers along azimuth and range directions in imaging areas are M × N , the computational cost of the projection calculation in imaging area is N a × M × N ; the cost of phase compensation is also N a × M × N , and the cost of coherent superposition is ( N a 1 ) × M × N . Therefore, the total computational cost is the sum of above three computational costs, i.e., ( 3 N a 1 ) × M × N . Once the number of sampling points becomes large enough, the computational cost will exhibit undesired exponential growth. However, for MBS located in the near side of Moon, its synthetic aperture time can be hundreds of seconds longer than that on the space-born platform; moreover, the imaging area around the Earth’s surface can be larger, e.g., exceeding millions of square kilometers, under a small gaze angle. Therefore, the computational cost of the BP algorithm in the MBS scenario might be intolerable large. Therefore, to bring down the cost, the traditional BP algorithm is modified into the FBP algorithm, shown as follows, based on sub-aperture and sub-imaging area division.
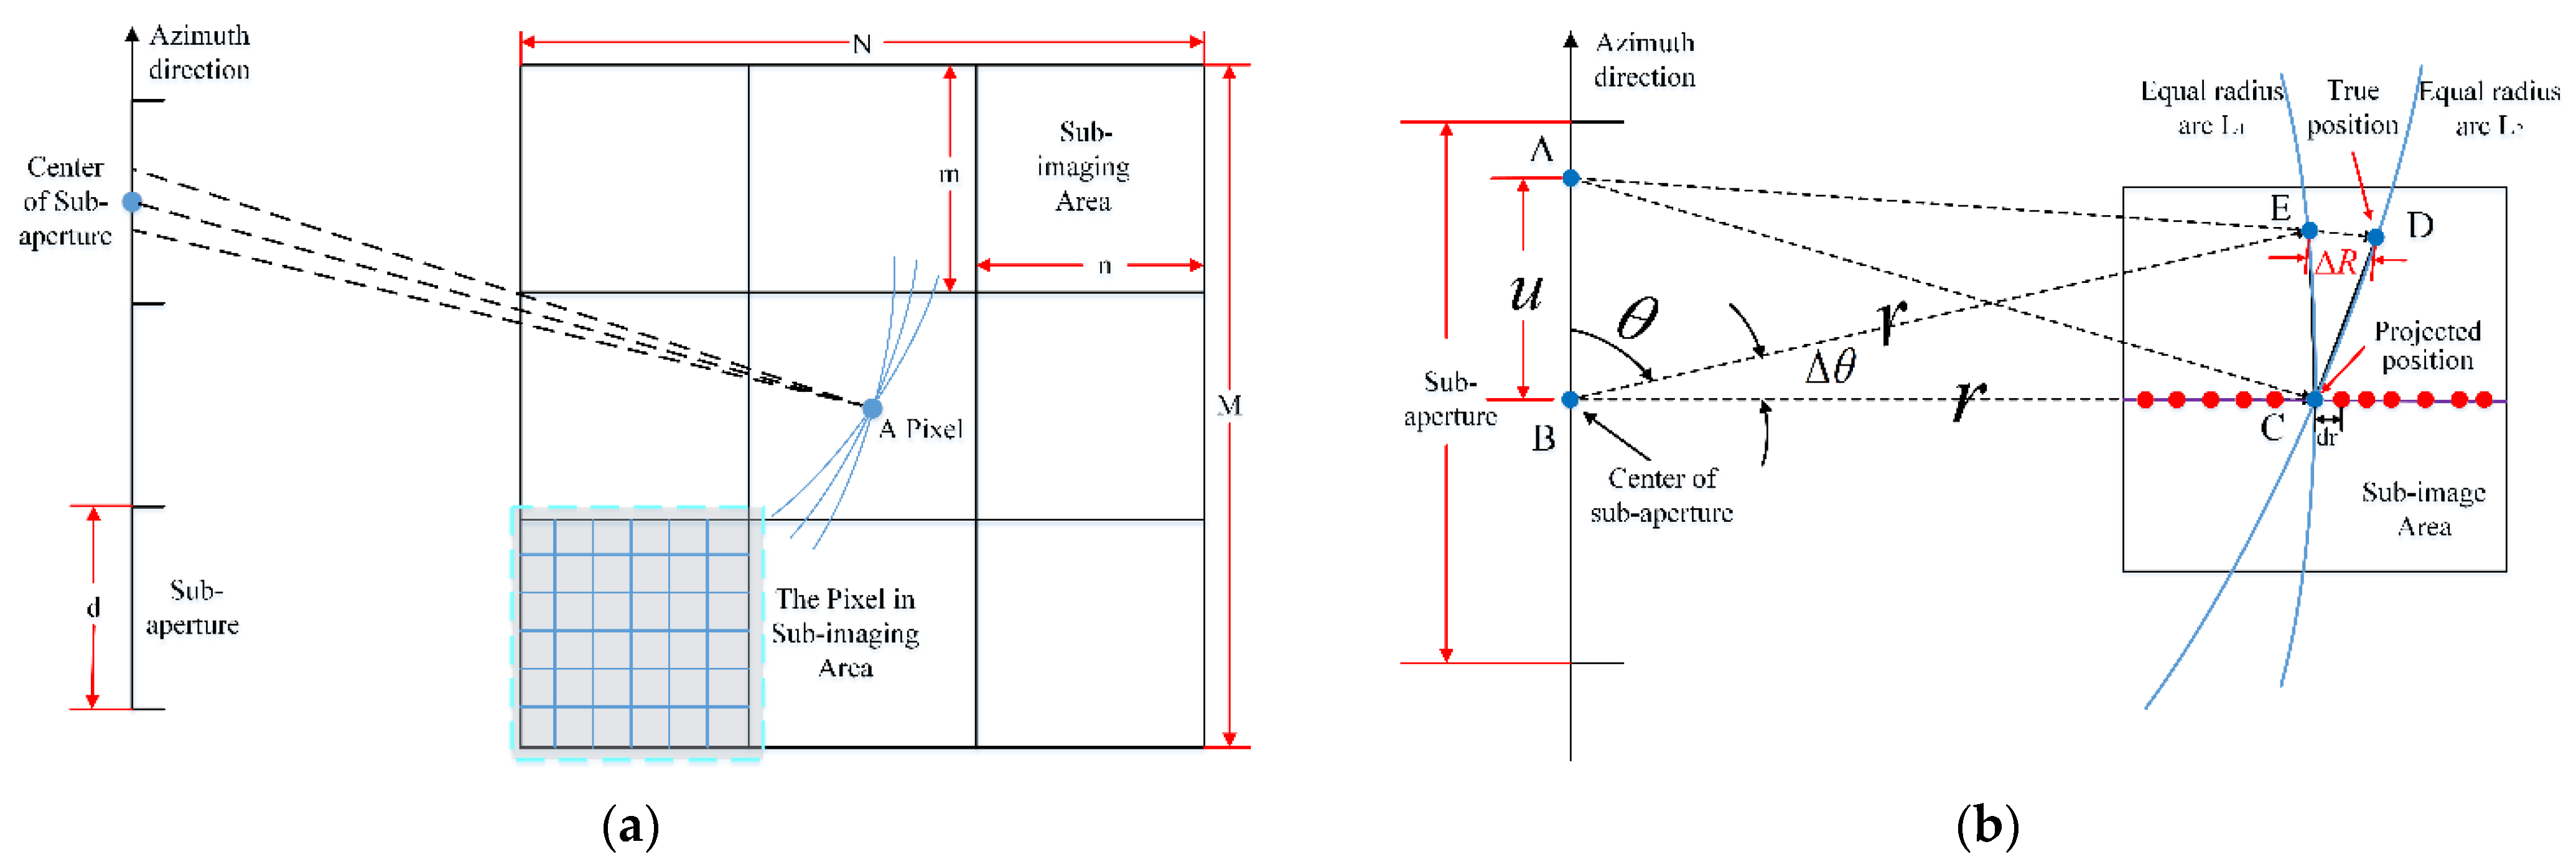
In the proposed FBP algorithm, the synthetic aperture length and corresponding imaging area for MBS will be divided into sub-apertures and sub-imaging areas, as shown in Figure 3a. Here, the lengths in Figure 3a are not shown in the same ratio as the actual scenario, in order to create a clear display. The synthetic aperture length L s is divided into α 1 small non-overlapping sub-apertures; therefore, the actual length of every sub-aperture is d = L s α 1 . The size of the original imaging area, i.e., M × N ( N is pixels along the range direction and M is the pixels along the azimuth direction), will be divided into α 2 × α 3 small sub-areas; the size of every sub-area is m × n , where m = M α 2 , m = N α 3 . Here, the dark area in Figure 3a represents the corresponding pixels in the sub-imaging area.
After the sub-aperture and sub-imaging area been divided, the subsequent task is to handle the complex data in each sub-object. As shown in Figure 3b, a group of concentric circles centered on sub-aperture’s point can be obtained for lines from every sub-aperture to pixels in the sub-image area. Different circles form their respective sector areas and indicate unequal echo; other back-projection data of points on an identical circle are exactly the same. Thus, within an acceptable range error, it is not necessary to project echo data to all pixels in the imaging area, as the centerline represents all pixels distributed in the sub-image area. For two adjacent sub-apertures, the distance to pixels in the sub-image area can be almost the same. For the α ( 1 α α 1 ) aperture and its adjacent apertures, it can be considered that they exhibit approximately the same concentric circles. Here, the echo data in the sector areas can be considered to be consistent with the data of the line from the sub-aperture’s center to the sub-image’s area center. Therefore, a centerline can be used as an approximation for the sector areas within an allowable range of error, thus reducing the computational cost required by the FBP algorithm.
For the scenario of MBS, the scale change in slant range undulate insignificantly along with the gaze angle. Figure 3b shows the calculation of range error; the lines in this figure do not have the same scale as the actual scenario, in order to create a clear display. The lengths of line segments BC and BE are equal, centered on point B, and form an equal radius arc L1; line segments AC and AD are equal, centered on point A, and form another equal radius arc L2; point D is the true position of the pixel in the sub-image area; point C is the corresponding projected position; and point E is the intersection between segment AD and equal radius arc L1. According to the approximation principle, the points near the centerline use points on the centerline instead, although the approximate processing will thus produce some errors and affect the imaging quality. In this paper, the centerline is generally selected, without loss of generality, from the center of the sub-aperture to the center of the sub-imaging area, but only segments of the centerline are used. On one hand, if the segment is too short, all the pixels in the sub-imaging areas cannot be effectively projected on the line, undoubtedly increasing the range error before and after projection. On the other hand, if the segment is too long, much redundant data will be generated, in opposition to the requirement of less intermediate data. In this paper, the segment equal to the diagonal of the sub-image area is selected to ensure that each pixel in the sub-image area can be projected without generating too much redundant data. After the pixels in the sub-image area have been replaced by points on the centerline, e.g., points in Figure 3b, the range error between the real range AD and the replaced BC on the centerline can be expressed as follows:
Δ R = R ( θ + Δ θ ) R ( θ )
where θ is angle between the azimuth direction and point E; Δ θ is the angle between the centerline and point E; R is the true slant range (i.e., the length of AC), and Δ R is the slant range error between length of AC and BC (i.e., the error between the true range and the projected range).
Because the range error Δ R ( θ ) is far less than any range from MBS, to achieve EGT, the range error Δ R can be approximately quantified by the equation shown below:
Δ R ( θ ) = [ R ( θ + Δ θ ) + R ( θ ) ] · [ R ( θ + Δ θ ) R ( θ ) ] R ( θ + Δ θ ) + R ( θ ) R ( θ + Δ θ ) 2 R ( θ ) 2 2 · R ( θ )
According to the cosines law of triangles, the slant range R can be re-expressed as follows:
R ( θ ) = r 2 + u 2 2 r · u · c o s θ ,   u 0.5 d
where u is the length from position of the beam to its initial position, in this paper, the initial position is reckoned as the center of sub-aperture, r is the length of centerline, and d is the length of sub-aperture. Therefore, Equation (4) can be reverted as follow.
Δ R ( θ ) = c o s θ c o s ( θ + Δ θ ) 1 2 u r · c o s θ + ( u r ) 2 · u
In actual scenario, u is much smaller than r . Therefore, considering the extreme situation, the maximum value of the range error in Equation (6) can be expressed as shown below:
| Δ R | m a x = d · Δ θ 2 d · D 4 r ,   d < 2 r
where D is the length of sub-image area in azimuth direction. Equation (7) indicates that the range error will fall within a limit, so long as the product, namely the sub-aperture’s length and the sub-image area’s length in azimuth direction, remains unchanged.
It is generally assumed that the phase error caused by the range error should not be greater than π 4 ; this is to say, the maximum value of the range error should be subject to Equation (8).
4 π λ | Δ R | m a x π 4
The maximum range error in Equation (8) will often be less than λ 16 , and the denominator constant can be substituted with a control factor δ . With a combination of Equations (7) and (8), the sub-image area’s length can be expressed as shown below:
d · D 4 r λ δ
In Equation (9), the product of the sub-image area’s length and sub-aperture’s length has a negative correlation with the control factor δ . Once δ becomes too large, the sub-aperture’s length will be closer to a pulse, and thus cannot achieve the effect of aperture division and computational cost reduction, so a suitable δ should make d equal to the length of the exponential power of 2, i.e., the sub-aperture’s length contains 16, 32, or even 64 pulses.
With suitable parameters before being set, the true position showed in Figure 3b still might not project on an existing sampling point of the centerline, shown as a solid red dot; this situation will cause an error expressed as d r . In order to reduce such an error, a step of different multiples interpolation, shown in Box 2 of Figure 2, will be conducted during the imaging process. Theoretically, d r can be reduced by increasing the interpolation multiple; the higher the interpolation multiple, the smaller the error. However, d r will accumulate with the superposition of sub-apertures; the more sub-apertures, the greater the error accumulated, which may affect the imaging quality.
After the FBP algorithm has been introduced, the next step is to derive the range or phase history of the echo; both are influenced by Earth-Moon motion and the actual location of MBS. For a better description of the processing of echo, the subsequent section introduces a detailed method of range history estimation. In this method, the locations of the MBS during periodic Earth-Moon motion are all taken into consideration.

2.2. Range History Calculation

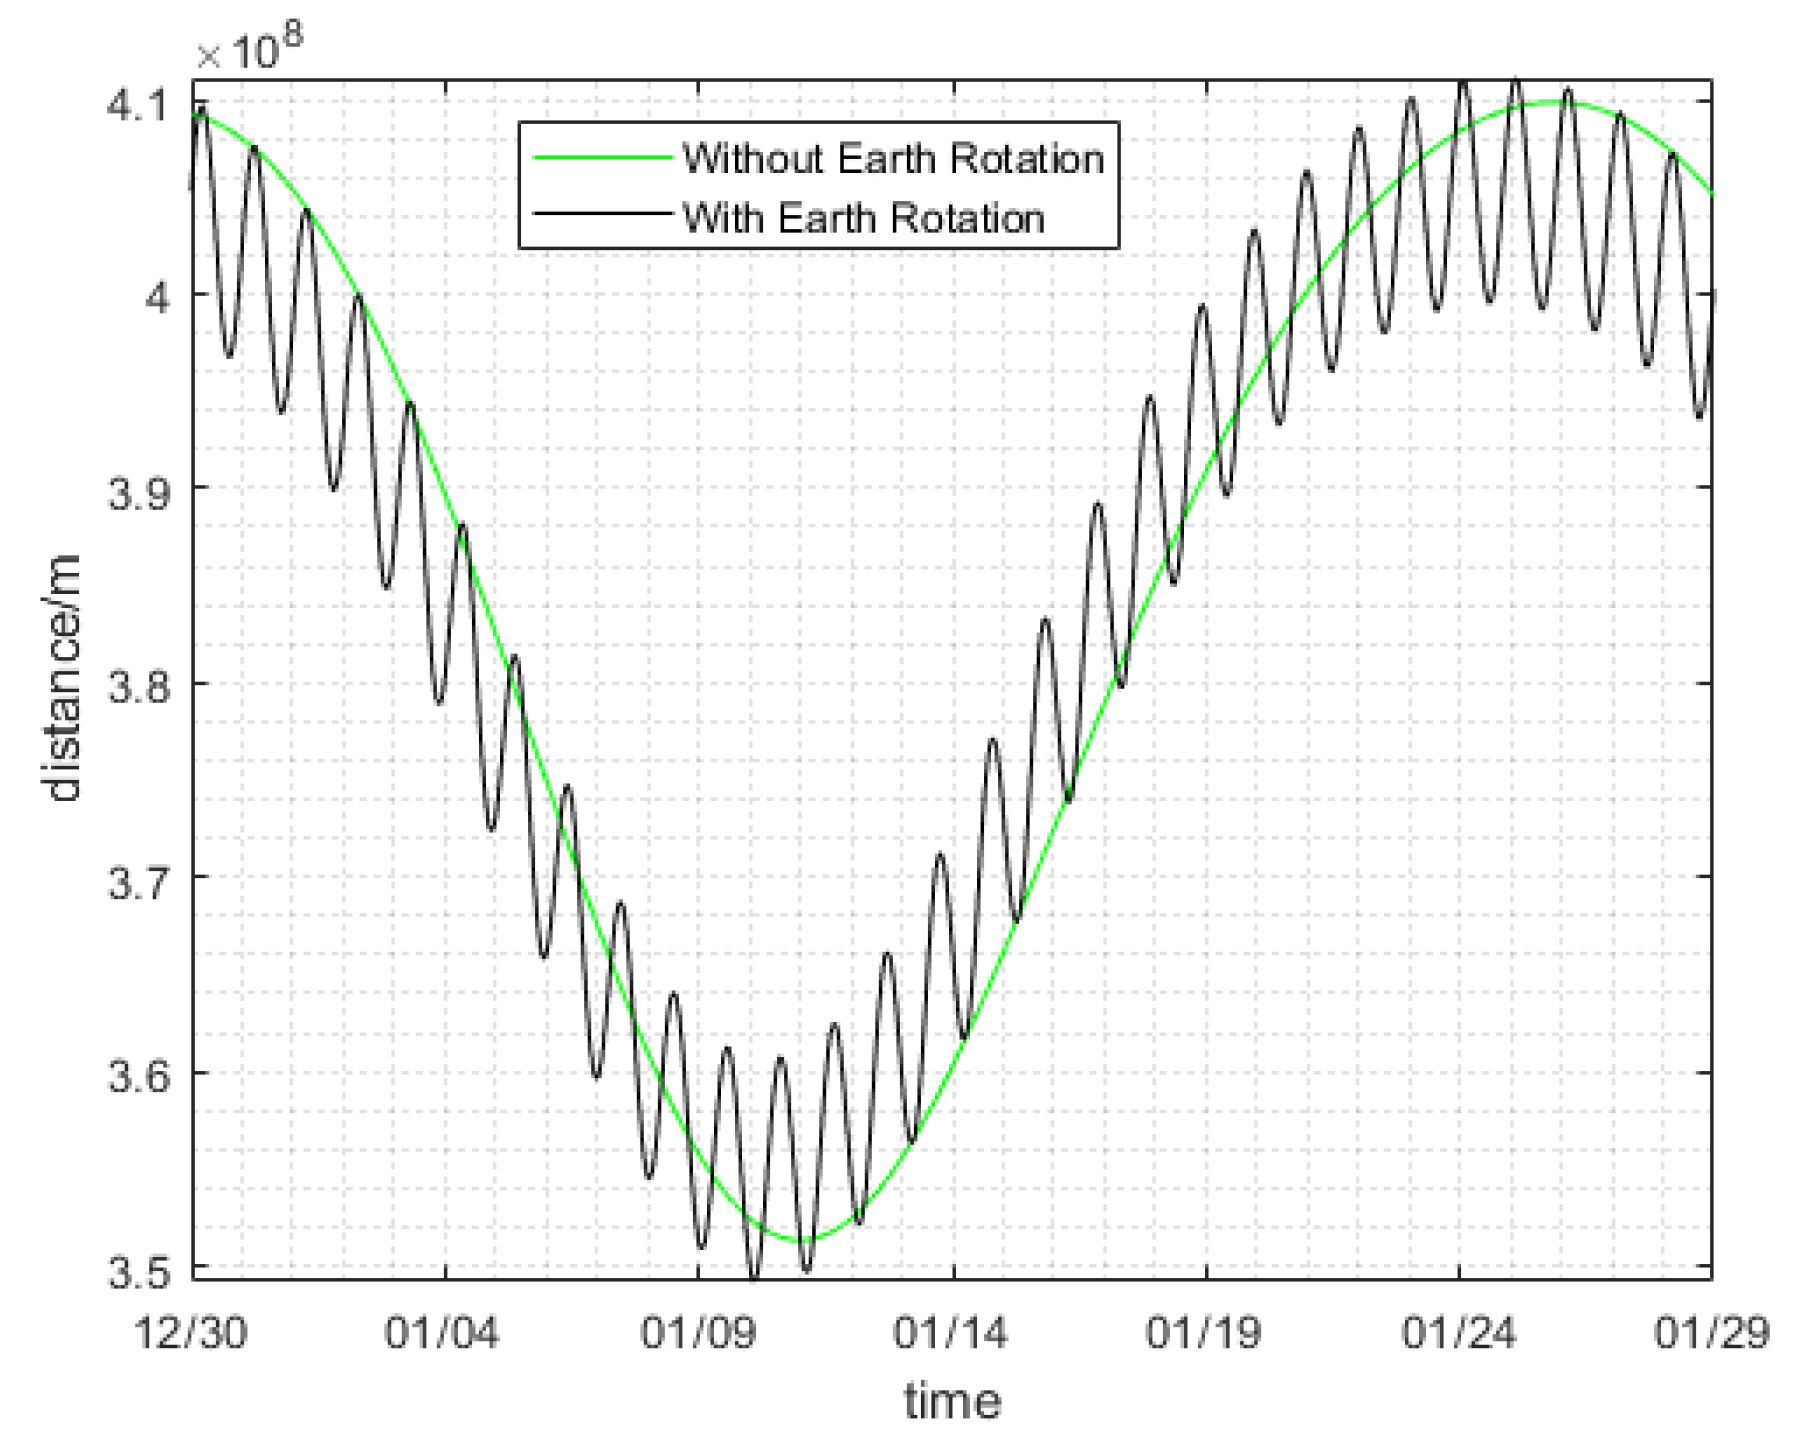
Since the dual-delay time of MBS can exceed 2.3 s, the transmitted and received positions of MBS are not the same; the stop-and-go model applied to a low orbit platform will no longer be applicable for MBS distributed around the near side of Moon. In an actual scenario, the long average distance from MBS to its achievable EGT, the rotation of Earth, the rotation of Moon, and the revolution of Moon, together with DEM of MBS and EGT will have different effects on their slant range. The near side of Moon is distributed with uneven craters, hills, uplifts, and potholes that have unequal DEM, and so does the EGT; the differences in locations of MBS and EGT bring diversity to the ground range and slant range, which have been considered in imaging processing; because of earth tide lock, the revolution and rotation of the Moon’s near side periodically faces the Earth. The Earth’s unequal rotation in latitude direction makes the exposure time, related to synthetic time and length, of EGT change unevenly. Without loss of generality and to simplify the analysis process, the diverse DEM of MBS and its corresponding EGT are omitted, and the two planets, i.e., the Earth and the Moon, are considered as follows: the Earth is considered to be a standard ellipsoid body, with an equator radius of about 6377 km, and a polar radius of about 6356 km, and the Moon is considered to be a standard sphere, with average radius of about 1737 km, respectively [18]. Then, consider the relative motion between MBS, e.g., its location is about 0°, 0° on the Moon’s surface, and its corresponding look angle is about 0.1°, as shown in Figure 4. The distance from MBS to EGT with Earth’s rotation (an oscillating smooth curve displayed in the black solid line) shows much different when compared to the results without Earth’s rotation (a sine smooth curve displayed in the green solid line). The curve occlusion of the sphere is also ignored to provide a simplified description. Although their overall trends are similar, the actual distance shows that oscillation changes daily, so the Earth’s rotation cannot be ignored for actual Earth-Moon SAR imaging, especially when determining MBS and accessible EGT. For a more realistic scenario, the ephemeris are adopted among calculations in this paper.
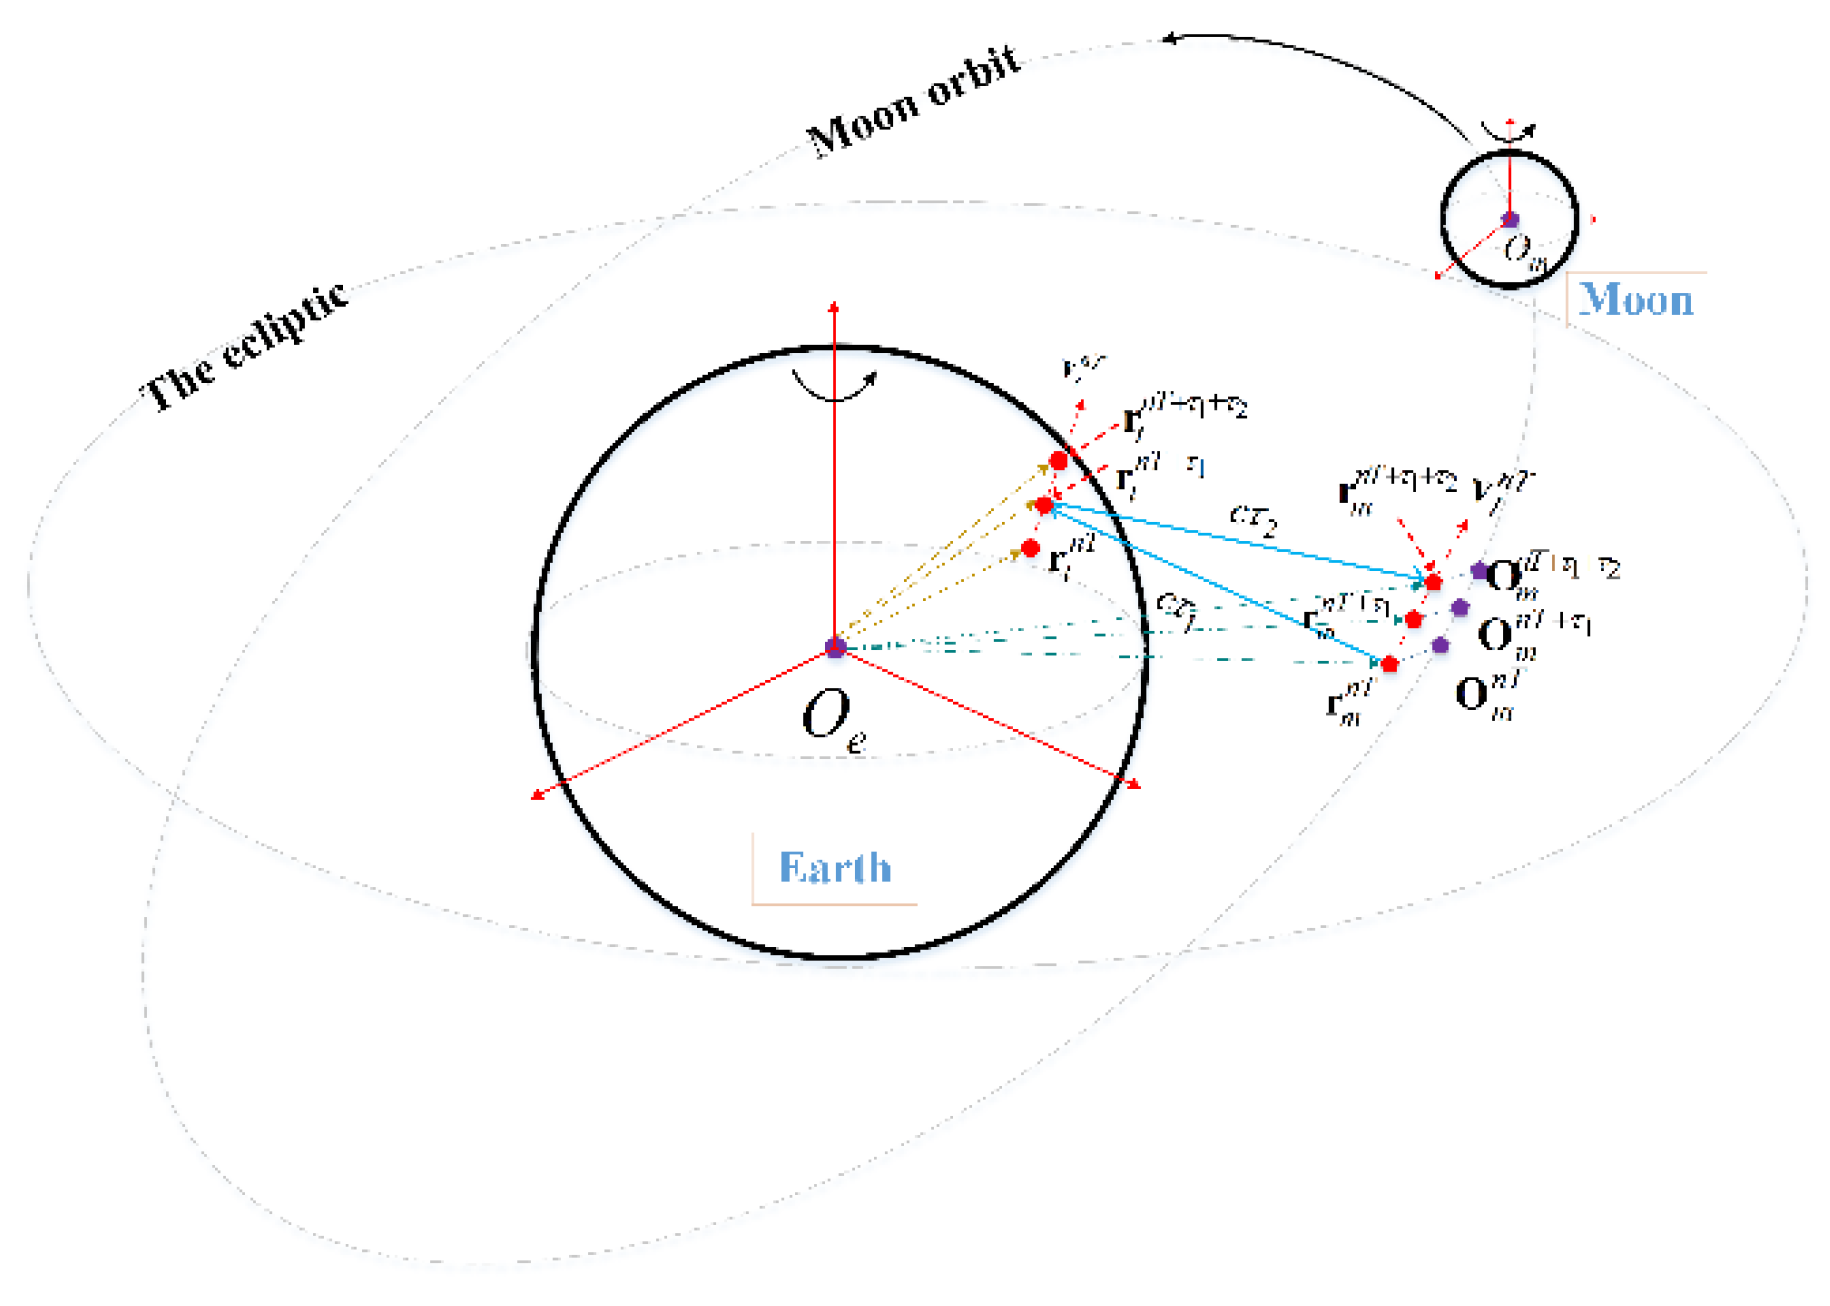
While adopting JPL DE430, or other ephemerides at specific moments for researching, the dual-path method is used, i.e., uplink and downlink components, are calculated separately, with Earth’s rotation been considered in every pulse [19,20]. Here, its antenna bore-sight lies in the corresponding zero-Doppler plane after using at least the two-dimensional attitude steering method, and the plane is assumed to remain unchanged during synthetic aperture time. The dual-path method from MBS to achievable EGT at the n pulse is shown as Figure 5, where τ 1 is delay time of the downlink path from MBS to EGT; τ 2 is delay time of the uplink from EGT to MBS; T is pulse repeat time (PRT) of MBS; n is number of pulses; n T , n T + τ 1 , n T + τ 1 + τ 2 are three adjacent discrete time variables, indicating the wave propagation of a single pulse; r t n T , r t n T + τ 1 , r t n T + τ 1 + τ 2 are the corresponding position vectors of EGT; O m n T , O m n T + τ 1 , O m n T + τ 1 + τ 2 are the corresponding position vectors of the Moon’s centroid; r m n T , r m n T + τ 1 , r m n T + τ 1 + τ 2 are the corresponding position vectors of MBS; v t n T is the velocity vector of EGT at n T pulse as related to the Earth’s rotation; and v l n T is the velocity vector of MBS at the n T pulse as related torotation and revolution of Moon.
Figure 5 indicates that when MBS transmits radar wave at time n T , the EGT is in r t n T ; after a period of time τ 1 , the EGT receives the wave in r t n T + τ 1 and reflects it immediately, and the MBS has moved in r m n T + τ 1 . Again, after a period of time τ 2 , the MBS gets the echo signal in r m n T + τ 1 + τ 2 , and the EGT has moved in r t n T + τ 1 + τ 2 ; this process can be called an entire delay cycle for a single pulse; here the two velocities v t n T and v l n T are deemed to be unchanged in an entire delay cycle. The coordinate system for the calculation of the dual path involved with the Earth’s central rotational coordinate system (ECR), the Earth’s central inertial coordinate system (ECI), the Moon’s central Moon fixed coordinate system (MCMF), etc. In this study, the position and velocity of MBS and EGT should be represented in the same coordinate system, for example, in the ECR.
From the cosine theorem of trigonometric functions, we can obtain the equations for the signal transmission path of downlink in Equation (10) and uplink in Equation (11), respectively:
r m n T r t n T ,   r m n T r t n T + v t n T , ( v t n T ) T r · τ 1 2 + 2 · r m n T r t n T , v t n T · τ 1 ( c · τ 1 ) 2 = 0
r m n T + τ 1 r t n T + τ 1 ,   r m n T + τ 1 r t n T + τ 1 + v l n T + τ 1 , ( v l n T + τ 1 ) T r · τ 2 2 + 2 · r m n T + τ 1 r t n T + τ 1 , v l n T + τ 1 · τ 2 ( c · τ 2 ) 2 = 0
where the top right subscript “ T r ” means matrix transpose, and the symbol “< , >” signifies inner product operator.
From Equations (11) and (12), the two delay time variables can be expressed in Equations (12) and (13) as shown below:
τ 1 = r m n T r t n T , v t n T 2 + ( c 2 v t n T , ( v t n T ) T r ) · r m n T r t n T , r m n T r t n T c 2 v t n T , ( v t n T ) T r r m n T r t n T , v t n T c 2 v t n T , ( v t n T ) T r
τ 2 = r m n T + τ 1 r t n T + τ 1 , v l n T + τ 1 c 2 v t n T , ( v t n T ) T r + ( c 2 v t n T , ( v t n T ) T r ) · r m n T + τ 1 r t n T + τ 1 ,   r m n T + τ 1 r t n T + τ 1 c 2 v t n T , ( v t n T ) T r r m n T + τ 1   r t n T + τ 1 , v l n T c 2 v t n T , ( v t n T ) T r
Then consequently, the total range history at pulse n T that consists of both downlink propagation and uplink propagation, can be expressed as below:
R n T = R d o w n n T + R u p n T = c · τ 1 + c · τ 2
If we convert the pulse time n T into azimuth slow time η , then Equation (14) can be transformed to a high-order polynomial series, as shown in Equation (15), to fit the range history and coherent superposition for imaging.
R ( η ) = σ 0 + σ 1 η + σ 2 η 2 + σ 3 η 3 + · · · + σ k η k + o ( η k )
where k is the exponential powers corresponding to coefficient σ , and o ( η k ) is the higher order infinitesimal.

3. Theoretical Analysis

After the FBP and the real range calculation modes have been established, specific MBS on the Moon’s surface will be selected for research using the application of FBP. Inspired by feasible ground-based imaging radar technology used on the Moon, and the requirement of computation cost reduction for the traditional BP algorithm, the proposed FBP algorithm aimed to ameliorate the cost. So in the first of this section, different locations of MBS are chosen for research on range history characteristic, and second, images of one specific MBS will be figured to show the performance status at four key moments, i.e., apogee, perigee, ascending node, and descending node, during one specific period.

3.1. Range Characteristic between MBS and EGT

Because the revolution speed of Moon’s centroid (ranging from about 960 m/s to 1100 m/s) is much faster than its maximum rotation speed (about 4.6 m/s) in the equatorial region, the Moon’s revolution plays a major role in slant range compared with its rotation. Because the maximum rotation speed (about 465 m/s) of Earth in its equatorial region is not identical to Moon’s revolution, and the rotation orientation of Earth as well as the Moon’s revolution orientation are all from west to east, as observed from the north celestial pole, the delay time from MBS to corresponding EGT will not be equal to delay time from the corresponding EGT to MBS. Take January 2001 as an example: the moon will pass the descending node, perigee, ascending node, and apogee in sequence, and the sub-point of different MBS, as well as the location of the EGT with different look angles, may vary during periodic motion, as shown in Table 1.
In this study, three sample MBS’s locations, (30° W, 30° S), (0°, 0°), and (30° E, 30° N), appear to exhibit a centrosymmetric distribution because the Moon is locked by Earth tide, and the zero-longitude line of the Moon is almost facing the Earth. Here, the EGTs are assumed to be the intersection points of the MBS’s antenna bore-sight on the Earth’s surface. The antenna has been steered into the zero-Doppler plane, and the look angle is left-looking. As displayed in Table 1, the EGTs’ latitude changes are greater than the corresponding longitude changes when the Moon reaches apogee and perigee, indicating that the intersection line of the zero-Doppler plane on Earth’s surface is almost parallel to the longitude line when the Moon is at apogee and perigee. However, an angle exists because of the angle between the Moon’s rotation axis and revolution orbit when the Moon is at either the ascending node or the descending node.
The influence of MBS’s location on the sub-point, and the influence of the look angle on the intersection points suggest that the MBS cannot be deemed to be consistent with the Moon’s centroid, although the Moon’s radius is far smaller than the two planets’ average distance, if a more realistic scenario had been presented.
The diversity of MBS’s location and look angle have different numerical effects on the dual-delay of transmission and the maximum difference; therefore, because of the discrepancy caused by the delay time between uplink and downlink, using MBS and EGT, the results will no longer be constant with the changing of the synthetic aperture time and the look angle, as shown in Table 2 and Table 3, suggesting that it is necessary to calculate the two delay time separately for the improvement of accuracy, the discrepancy when synthetic aperture time is 150 s is larger than when the time is 80 s if other parameters are the same, mainly because with an increase in the synthetic aperture time, the fringe angle, i.e., the angle from sampling points at fringe to the zero-Doppler plane, also increases, thereby generating unequal dual-delay time, which is more obvious once MBS is at the ascending node or the descending node.
If the load shown in this paper were deployed in a space-born platform, the discrepancy of dual-delay time would be much smaller, mainly because of the shorter distance from the platform and the EGT, as well as the available stop-and-go mode. MBS has many advantages (long-term, large-scale, unique, etc.) over the space-born platform when conducting Earth observations. Compared with the geostationary (GEO) SAR, the average distance of MBS is about 9.5 times longer; the field of the whole disc of the Earth at such a long distance is just a small angle, around 1.8°, which makes it possible for nearly 50% of the Earth to be observed at a gaze look, when echo reflection characteristics, which can be expressed by incident angle, are ignored. Once incident angle is considered, the field of view (FOV) of MBS is also larger than that of the space-borne platform. Moreover, the synthetic aperture length of MBS is also longer than GEO-SAR’s, thus increasing the EGT’s exposure time. The Moon is locked by Earth’s tides, and almost only one side faces the earth, which leads to a basically fixed line of sight for the Earth’s observation. Therefore, it is necessary and beneficial to develop the MBS for Earth observation, although range discrepancy does exist.
Finally, we will describe the necessity of using separate calculations for dual-delay time. Another processing is the fitting of actual trajectories deduced from ephemeris, such as those related to precession, nutation, apsidal motion, etc., in a specific scenario for better imaging. Through Equation (15), the fitting speed of MBS and maximum error in slant range (MESR), i.e., the absolute value of difference between fitting range and the range calculated in Section 3.1, around apogee, perigee, ascending, and descending nodes are displayed in Table 4 and Table 5. Generally speaking, the fitting speed is close to the speed of the platform, but the actual fitting speed is significantly different from the speed of the MBS or EGT. Along with an increase in synthetic aperture time and look angle, the MESR will also increase slightly. The reason might be related to MBS’s motion status, which can also be shown by the speed components of MBS’s sub-point on Earth’s East-North-Up (ENU) orientation. The ENU changes continuously when Moon is at four different orbit points shown in Table 6; notably, the North-Up speeds at the ascending node and descending node are faster than the speeds at the apogee and perigee, the MESRs in ascending node and descending node are also larger than those in apogee and perigee. In addition, the limit wavelengths in the ascending node and descending node are longer than those in the apogee and perigee, according to Equation (8). When the Moon is in apogee and perigee, the speed components are more closely related to the orientation of EGT’s speeds, i.e., the east orientation, thus decreasing the MESRs under the same parameters.
For the process of imaging simulation in time domain, the smaller the MESR is, the better the imaging representing the actual scenario. Equation (8) indicates that the higher the carrier frequency f is, the smaller | Δ R | m a x will be. However, Table 4 and Table 5 indicates that | Δ R | m a x cannot be too small, because MSER should not exceed | Δ R | m a x in different synthetic aperture time periods and look angles. Therefore, to integrate the experience operation of the space-borne platform and ground-based imaging radar technology, the proposed FBP algorithm will be adopted on MBS in the Earth-Moon motion scenario, as shown in the next section.

3.2. Imaging Characteristic between MBS and EGT

Section 3.1 analyzes the range characteristic of MBS at four moments during a specific period. After the real trajectory has been fitted under suitable parameters, the FBP algorithm can be used for final image. Because the load on TerraSAR-X, ground-based imaging radar at Kashi, China, etc., are all X-band continuous waves, high-frequency bands have higher transmission power, and are capable of reaching kilowatts that can compensate for power loss during transmission; a band of high frequency will be less affected by the ionosphere than will the low-frequency P-band [21]. Along With increasing synthetic aperture time, the background ionosphere changes in temporal and spatial domains will also cause more serious azimuth shift and image defocusing for low-frequency bands. Here, the antenna aperture in the range or azimuth direction is up to tens of meters, for a better view in the long Earth-Moon distance; as shown in Table 7, the range width angle with only 0.028° still shows about a 416 km swath in range when MBS is at apogee. Among periods of the Moon’s revolution, slightly considering the influence of the incidence angle and the sub-point on echo, the look angle is selected as a middle number, i.e., 0.3°. Since the EGT’s image of MBS does not require high resolution when considering a large coverage, the range bandwidth can be set to a relatively low value.
The basic system parameters of MBS are shown in Table 7, and the processed nine points image of MBS’s echo at four moments corresponding to the apogee, perigee, ascending, and descending nodes are expressed in Figure 6. While the final compressed image shows little difference at these four moments, the target echo is still validly compressed using the proposed FBP algorithm. Among the simulation results, the Peak Side Lobe Ratio (PSLR), in row slice and column slice, both exceed −13 dB when MBS is at apogee and perigee, but are shown as somewhat smaller when the MBS is at the ascending node and the descending node, indicating that the images at apogee and perigee are slightly better than those for other two moments.
Moreover, the FBP’s computational cost of projection calculation in the imaging area on the compressed data is N a × M × N , the computational cost of phase interpolation is also N a × M × N , and the cost of coherent superposition is M × N . Therefore, the total computational cost is the sum of the above three computational costs, i.e., ( N a + N a + 1 ) · M × N , and it is much smaller than the traditional computational cost of BP. Through the analysis of MBS, this FBP algorithm in the time domain based on the division of aperture and image area can be applied to avoid the coupling analysis in the frequency domain and to reduce the large computational cost of the BP algorithm.

4. Conclusions

The Earth’s observation from MBS has a long transmission time; its dual-way path in atmosphere and ionosphere, also appears different when viewed from a space-borne platform; its complex environment undoubtedly increases the complexity in frequency domain. In addition, the stop-and-go mode is no longer suitable for MBS; since positions change during a single pulse, the motion status of MBS and corresponding EGT cannot completely be represented by orbit mode used in satellite, but a method including ephemeris that comprehensively considers the revolution or rotation of Earth-Moon motion, has been used instead. Here, the uplink and downlink components of the pulse transmission path are separately calculated for a better match with reality at four main moments, i.e., the apogee, perigee, ascending and descending nodes, during periodic motion with JPL DE430. Ephemeris has been adopted, and the calculated path method shown in this paper fully represents a real scenario for specific MBS distributed around the near side of Moon. Although the average radius of Moon is much smaller than the average distance between Earth and Moon, this paper no longer considered a point on Moon’s surface to be same as the Moon centroid, as adopted by other studies. The results indicate that the longer the synthetic aperture time is, the greater the difference between uplink and downlink will be; therefore, synthetic aperture time is not the longer better for MBS. Meanwhile, the look angle, which determine the position of EGT, also affects the maximum difference, so the dual-path transmission should be calculated separately and then transformed to a high-order polynomial series as a fitting formula. In Earth-Moon motion, the fitting velocity is not close to the real velocity calculated in a specific coordinate system, which is not identical to an air-borne or space-borne platform. For MESR, its value will increase along with the increase in synthetic aperture time and look angle; the smaller its value, the better fitting it will represent.
After system parameters and MESR have been set or calculated, the division mode described in Section 2.1 can be used, and the FBP algorithm can be adopted. In contrast to the traditional BP algorithm, the renewed FBP algorithm will no longer project echo to the imaging area, but instead, a centerline will fully represent the imaging area; meanwhile, the synthetic aperture length and image area are divided into sub-parts for fast calculation. Although the FBP algorithm proposed might have a detrimental effect of reduced resolution, its meter-level resolution still meets the demand of MBS with a small width angle. A large amount of data will be generated along the long synthetic aperture time of MBS at the same sampling rate adopted in other platform; lower PRF is not suitable for the MBS to reduce the data received because of the possible azimuth ambiguity. The range interpolation before superposition indicated in this paper will further decrease the error of true position projected on the assumed sub-image area’s diagonal, i.e., a segment of the centerline. The compressed results shown in Section 3.2 indicate that imaging processing is efficient in the FBP algorithm, and the results, when MBS is at apogee and perigee, are slightly better than the results at the ascending node and descending node.
In summary, the paper explains the necessity of calculating a dual path for MBS’s single pulse transmission in Earth-Moon motion, with real ephemeris being adopted; meanwhile, a simplified formula for the dual path of a single pulse is derived. Then, a detailed range difference, mainly at apogee, perigee, ascending, and descending nodes is analyzed, also indicating the necessity of high-order polynomial fitting after the dual path of a single pulse been calculated. Finally, the simulation of MBS under acceptable resolution indicates the applicability of the algorithm and the reduction of computational cost. The content described in the paper might help people better understand MBS in an actual scenario, encouraging practical applications for future research.

Author Contributions

Conceptualization and summary, Y.D., H.G. and C.H.; Language modification, D.L., H.J. and Y.D.; Writing—original draft, G.C.; software, D.L. and G.C.; Review and editing, K.Z. and H.J. All authors have read and agreed to the published version of the manuscript.

Funding

This research was funded by the Key Project of Frontier Science Research of Chinese Academy of Sciences (QYZDY-SSW-DQC026) and the National Natural Science Foundation of China (grant numbers 41590853, 41501403).

Institutional Review Board Statement

Not applicable.

Informed Consent Statement

Not applicable.

Acknowledgments

We used the IAU SOFA Collection, which are provided by the International Astronomical Union Standards of Fundamental Astronomy (http://www.iausofa.org, accessed on 27 August 2021). We also thank the JPL for free access to the DE430 data (https://ssd.jpl.nasa.gov/ephem.html, accessed on 7 April 2022) and the IERS for free access to the EOP data (https://www.iers.org/IERS/EN/DataProducts/data.html, accessed on 7 April 2022).

Conflicts of Interest

The authors declare no conflict of interest.

References

  1. Liu, H.Y.; Guo, H.D.; Liu, G.; Ding, Y.X. An exploratory study on moon-based observation coverage of sea ice from the geometry. Int. J. Remote Sens. 2020, 41, 6089–6098. [Google Scholar] [CrossRef]
  2. Wu, K.; Ji, C.; Luo, L.; Wang, X.Y. Simulation Study of Moon-Based In-SAR Observation for Solid Earth Tides. Remote Sens. 2020, 12, 123. [Google Scholar] [CrossRef] [Green Version]
  3. Sui, Y.; Guo, H.D.; Liu, G.; Ren, Y.Z. Analysis of Long-Term Moon-Based Observation Characteristics for Arctic and Antarctic. Remote Sens. 2019, 11, 2805. [Google Scholar] [CrossRef] [Green Version]
  4. Shen, G.Z.; Guo, H.D.; Liu, G.; Zhang, L.; Huang, J. Geometry Numerical Simulation and Analysis for Moon-Based Earth Observation. IEEE J. Sel. Top. Appl. Earth Obs. Remote Sens. 2020, 13, 3381–3393. [Google Scholar] [CrossRef]
  5. Li, T.; Guo, H.D.; Zhang, L.; Nie, C.W.; Liu, G. Simulation of Moon-based Earth observation optical image processing methods for global change study. Front. Earth Sci. 2020, 14, 15. [Google Scholar] [CrossRef]
  6. Shang, H.L.; Ding, Y.X.; Guo, H.D.; Liu, G.; Liu, X.; Wu, J.; Liang, L.; Jiang, H.; Chen, G.C. Simulation of Earth’s Outward Radiative Flux and Its Radiance in Moon-Based View. Remote Sens. 2021, 13, 2535. [Google Scholar] [CrossRef]
  7. Guo, H.D.; Ding, Y.X.; Liu, G.; Zhang, D.W.; Fu, W.X.; Zhang, L. Conceptual study of lunar-based SAR for global change monitoring. Sci. China (Earth Sci.) 2014, 57, 1771–1779. [Google Scholar] [CrossRef]
  8. Xu, Z.; Chen, K.S. On Signal Modeling of Moon-Based Synthetic Aperture Radar (SAR) Imaging of Earth. Remote Sens. 2018, 10, 486. [Google Scholar] [CrossRef] [Green Version]
  9. Ding, Y.X.; Guo, H.D.; Liu, G.; Han, C.M.; Shang, H.L.; Ruan, Z.X.; Lv, M.Y. Constructing a High-Accuracy Geometric Model for Moon-Based Earth Observation. Remote Sens. 2019, 11, 2611. [Google Scholar] [CrossRef] [Green Version]
  10. Liang, D.; Zhang, H.; Fang, T.; Fan, H. Processing of Very High Resolution GF-3 SAR Spotlight Data with Non-Start-Stop Model and Correction of Curved Orbit. IEEE J. Sel. Top. Appl. Earth Obs. Remote Sens. 2020, 13, 2112–2122. [Google Scholar] [CrossRef]
  11. Ding, Z.G.; Zhang, G.W.; Liu, S.Y.; Li, G.; Wang, Y.; Zeng, T.; Long, T. Earth-Based Radar Mapping Technology of the Moon Based on Parametric Motion Compensation. J. Signal Processing 2021, 37, 167–176. [Google Scholar] [CrossRef]
  12. Sun, J.; Yang, S.; Zhou, F.; Ding, Z.H.; Liu, L.; Cao, J.F.; Han, S.T.; Ping, J.S. The Status of Earth-based Radar Astronomical Observations of the Moon in China. Astron. Res. Technol. 2022, 19, 29–40. [Google Scholar] [CrossRef]
  13. Ding, Y.X. Moonborne Earth Observation Synthetic Aperture Radar and Its Application in Global Change; University of Chinese Academy of Sciences: Beijing, China, 2014. (In Chinese) [Google Scholar]
  14. Lan, G.C.; Frank, H.W. Digital Processing of Synthetic Aperture Radar Data: Algorithms and Implementation; Publishing House of Electronics Industry: Beijing, China, 2012. (In Chinese) [Google Scholar]
  15. Li, Z.; Li, C.S.; Yu, Z.Y.; Zhou, J.; Chen, J. Back projection algorithm for high resolution GEO-SAR image formation. In Proceedings of the International Geoscience and Remote Sensing Symposium, IGARSS 2011, Vancouver, BC, Canada, 24–29 July 2011. [Google Scholar]
  16. Ding, Y.; Munson, D.C. A fast back-projection algorithm for bistatic SAR imaging. In Proceedings of the International Conference on Image Processing, Rochester, NY, USA, 22–25 September 2002. [Google Scholar]
  17. Petit, G.; Luzum, B. IERS Conventions (2010) . Available online: https://www.iers.org/IERS/EN/DataProducts/Conventions/conventions.html (accessed on 7 April 2022).
  18. Rambaux, N.; Williams, J.G. The Moon’s physical librations and determination of their free modes. Celest. Mech. Dyn. Astron. 2011, 109, 85–100. [Google Scholar] [CrossRef] [Green Version]
  19. Chen, G.Q.; Guo, H.D.; Ding, Y.X.; Shang, H.L.; Lv, M.Y.; Zhang, K. Influence of Topography on the Site Selection of a Moon-Based Earth Observation Station. Sensors 2021, 21, 7198. [Google Scholar] [CrossRef] [PubMed]
  20. Xu, Z.; Chen, K.S. Numerical Study of the Spatiotemporally-Varying Background Ionospheric Effects on P-Band Satellite SAR Imaging. IEEE Access 2020, 8, 123182–123199. [Google Scholar] [CrossRef]
  21. Xu, Z.; Chen, K.S. Temporal-Spatial Varying Background Ionospheric Effects on the Moon-Based Synthetic Aperture Radar Imaging: A Theoretical Analysis. IEEE Access 2018, 6, 66767–66786. [Google Scholar] [CrossRef]
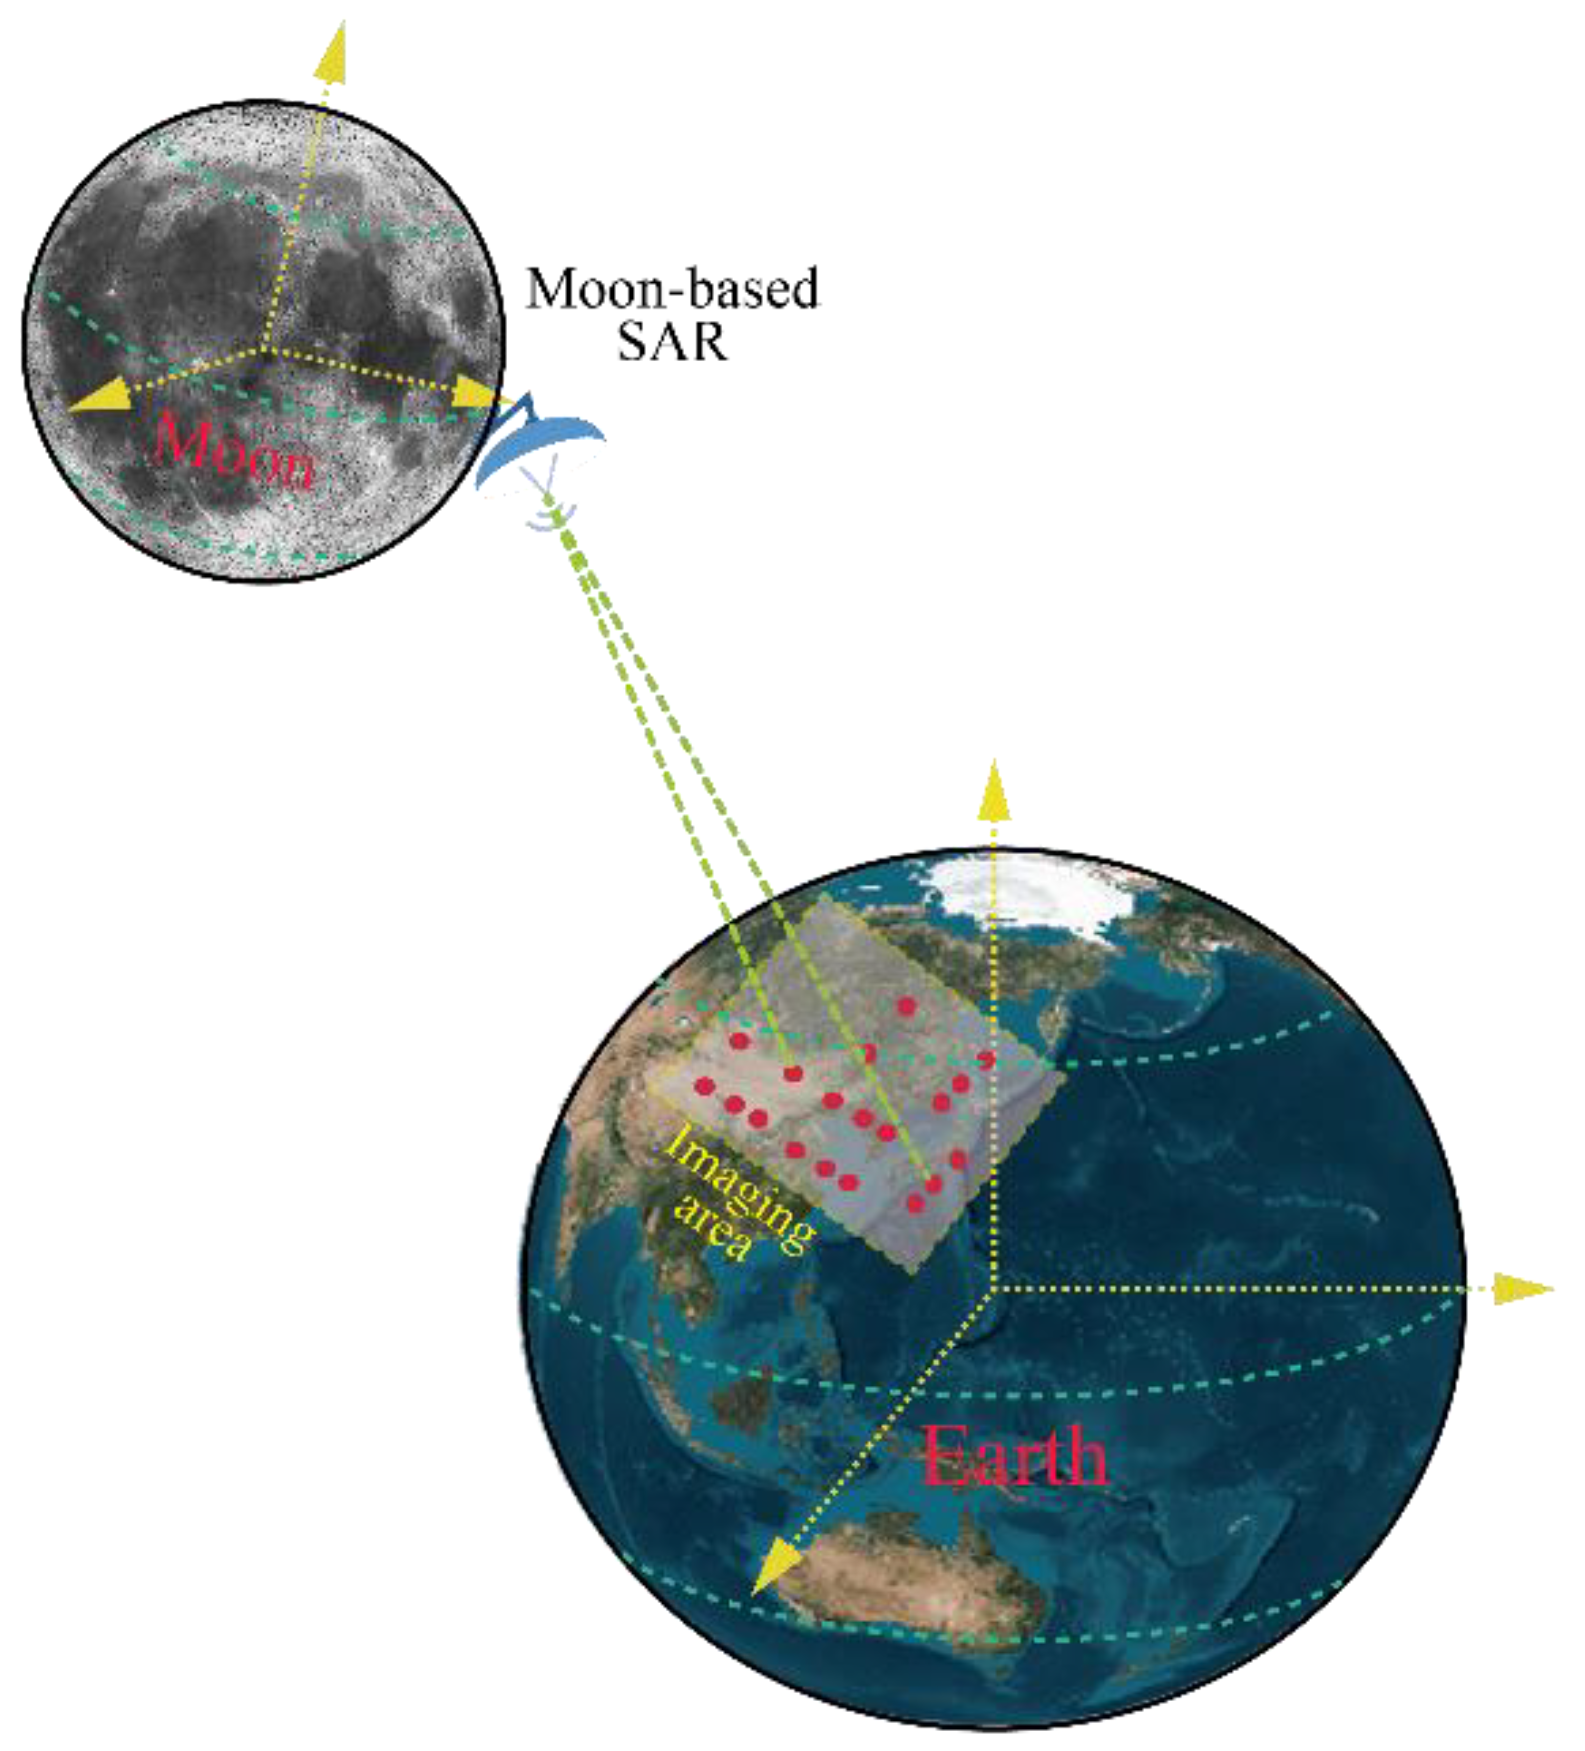
Figure 1. A back-projection imaging processing of MBS (the figure was created using the Adobe Illustrator, a vector graphics software).
Applsci 12 03850 g001
Figure 2. The flow chart of FBP algorithm.
Applsci 12 03850 g002
Figure 3. The schematic diagram of FBP in the division of aperture and imaging area (a), and in the range error calculation (b).
Applsci 12 03850 g003
Figure 4. The approximate distance between MBS and its corresponding EGT with Earth rotation (the black solid line) and without Earth rotation (the green solid line) as recorded in January, 2001. The curve occlusion of the spheres between MBS and EGT are not considered.
Applsci 12 03850 g004
Figure 5. The signal transmission path between MBS and EGT at n .
Applsci 12 03850 g005
Figure 6. The images generated by using the FBP algorithm when the MBS is at apogee (a), perigee (b), ascending node (c), and descending node (d), and their respective time is consistent with the time in Table 2 and Table 3.
Applsci 12 03850 g006
Table 1. The MBS’s sub-point and its bore-sight intersection on the Earth’s surface at one approximate apogee (i.e., 19:01:01 24 January 2001), one approximate perigee (i.e., 09:01:01 10 January 2001), one approximate ascending node (i.e., 11:01:01 15 January 2001), and one approximate descending node (i.e., 22:01:01 2 January 2001). The look angles here are all left-looking.
ApogeePerigeeAscending
Node
Descending
Node
MBS’s sub-point
(MBS locates 30° W, 30° S)
20.3974° S, 98.8077° W21.5687° N, 125.1552° W0.0741° S, 86.9358° W0.1052° S, 59.3042° W
EGT’s location in 0.1° look angle (MBS locates 30° W, 30° S)14.0429° S, 98.5044° W37.2064° N, 125.7875° W5.6218° N, 96.2608° W5.8745° N, 51.8339° W
EGT’s location in 0.3° look angle (MBS locates 30° W, 30° S)1.0986° S, 98.4419° W38.4506° N, 125.9474° W17.5481° N, 96.8640° W18.3314° N, 51.2914° W
MBS’s sub-point
(MBS locates 0°, 0°)
20.3126° S, 98.9532° W21.7340° N
125.2483° W
0.0972° N, 86.9779° W0.0398° S, 59.4593° W
EGT’s location in 0.1° look angle (MBS locates 0°, 0°)14.1379° S, 98.9118° W27.3699° N, 125.2809° W5.7921° N, 95.8230° W5.9248° N, 51.4363° W
EGT’s location in 0.3° look angle (MBS locates 0°, 0°)1.2075° S, 98.8328° W38.6006° N, 125.3594° W17.7037° N, 96.4098° W18.3666° N, 50.8652° W
MBS’s sub-point
(MBS locates 30° E, 30° N)
20.2221° S, 99.0994° W21.8957° N,
125.3419° W
0.2606° N, 87.0416° W0.0454° N, 59.6056° W
EGT’s location in 0.1° look angle (MBS locates 30° E, 30° N)14.2114° S, 99.3207° W27.5414° N,
124.7727° W
5.9705° N, 95.3266° W6.0110° N, 51.1512° W
EGT’s location in 0.3° look angle (MBS locates 30° E, 30° N)1.2649° S, 99.2249° W38.7875° N,
124.7680° W
17.8967° N, 95.8939° W18.4669° N, 50.5550° W
Table 2. The maximum difference in the delay range (m) (i.e., the maximum value between the downlink path and the uplink path) for various MBSs at one approximate apogee (i.e., 19:01:01 24 January 2001) and one approximate perigee (i.e., 09:01:01 10 January 2001), with the synthetic aperture time being about 80 s and 150, respectively.
Location of MBSLook AngleDifference at Apogee in 80 sDifference at Perigee in 80 sDifference at Apogee in 150 sDifference at Perigee in 150 s
(30° W, 30° S)0.1°8.34816.974910.77248.8154
(0°, 0°)0.1°3.15712.50855.48014.3417
(30° E, 30° N)0.1°8.44906.826410.67608.6574
(30° W, 30° S)0.3°8.53746.698110.85428.3221
(0°, 0°)0.3°3.32992.23065.63453.8477
(30° E, 30° N)0.3°8.45566.531510.85428.1447
Table 3. The maximum difference in the delay range (m) (i.e., the maximum value between the downlink path and the uplink path) for various MBS at one approximate ascending node (i.e., 11:01:01 15 January 2001) and one approximate descending node (i.e., 22:01:01 2 January 2001), with the synthetic aperture times being about 80 s and 150, respectively.
Location of MBSLook AngleDifference at Ascending Node in 80 sDifference at Descending Node in 80 sDifference at Ascending Node in 150 sDifference at Descending Node in 150 s
(30° W, 30° S)0.1°24.029822.164240.637142.2243
(0°, 0°)0.1°19.699616.547344.309047.1823
(30° E, 30° N)0.1°14.278215.422049.015452.7617
(30° W, 30° S)0.3°23.628821.103139.504139.4661
(0°, 0°)0.3°19.119116.009942.900246.0779
(30° E, 30° N)0.3°13.889014.486248.234949.3998
Table 4. The fitting parameters for MBS (0°, 0°) with a look angle (left looking) about 0.1°, with the synthetic aperture time being about 80 s (contents outside brackets) and 150 s (contents inside brackets). The time of apogee, perigee, ascending, and descending nodes are consistent with the time in Table 2 and Table 3.
ApogeePerigeeAscending NodeDescending Node
Fitting speed2.4093 × 103 m/s
(2.4093 × 10³ m/s)
2.1404 × 10³ m/s
(2.1404 × 10³ m/s)
2.4133 × 10³ m/s
(2.4133 × 10³ m/s)
2.4680 × 10³ m/s
(2.4680 × 10³ m/s)
Fitting smallest
slant range
3.9849 × 10⁸ m
(3.9849 × 10⁸ m)
3.4905 × 10⁸ m
(3.4905 × 10⁸ m)
3.6872 × 10⁸ m
(3.6872 × 10⁸ m)
3.8429 × 10⁸ m
(3.8429 × 10⁸ m)
MESR
(second order)
3.8981 × 10⁵ m
(2.2900 × 10⁻⁴ m)
4.1425 × 10⁵ m
(2.2197 × 10⁻⁴ m)
0.0015 m
(0.0057 m)
0.0013 m
(0.0052 m)
MESR
(third order)
1.6570 × 10⁵ m
(4.7207 × 10⁻⁵ m)
1.5199 × 10⁵ m
(4.3035 × 10⁻⁵ m)
7.2718 × 10⁴ m
(7.6067 × 10⁻⁴ m)
6.5845 × 10⁴ m
(6.8873 × 10⁻⁴ m)
MESR
(fourth order)
1.4007 × 10⁵ m
(2.5570 × 10⁻⁵ m)
1.4067 × 10⁵ m
(2.3305 × 10⁻⁵ m)
7.2616 × 10⁴ m
(7.3516 × 10⁻⁴ m)
6.5655 × 10⁴ m
(6.6817 × 10⁻⁴ m)
Table 5. The fitting parameters for MBS (0°, 0°) with a look angle (left looking) about 0.3°, with the synthetic aperture time being about 80 s (contents outside brackets) and 150 s (contents inside brackets). The time of apogee, perigee, ascending, and descending nodes are consistent with the time in Table 2 and Table 3.
ApogeePerigeeAscending NodeDescending Node
Fitting speed2.4462 × 103 m/s
(2.4461 × 10³ m/s)
2.0101 × 10³ m/s
(2.0101 × 10³ m/s)
2.3599 × 10³ m/s
(2.3599 × 10³ m/s)
2.4091 × 10³ m/s
(2.4091 × 10³ m/s)
Fitting smallest
slant range
3.9881 × 10⁸ m
(3.9881 × 10⁸ m)
3.4930 × 10⁸ m
(3.4930 × 10⁸ m)
3.6900 × 10⁸ m
(3.6900 × 10⁸ m)
3.8459 × 10⁸ m
(3.8459 × 10⁸ m)
MESR
(second order)
2.9206 × 10⁻⁵ m
(1.8942 × 10⁻⁴ m)
4.6849 × 10⁻⁵ m
(2.2930 × 10⁻⁴ m)
0.0015
(0.0058 m)
0.0013
(0.0053)
MESR
(third order)
2.2769 × 10⁻⁵ m
(5.4061 × 10⁻⁵)
1.8835 × 10⁻⁵ m
(4.2498 × 10⁻⁵ m)
7.4297 × 10⁻⁴ m
(7.7474 × 10⁻⁴ m)
6.7282 × 10⁻⁴ m
(7.0661 × 10⁻⁴ m)
MESR
(fourth order)
2.0802 × 10⁻⁵ m
(3.2067 × 10⁻⁵ m)
1.7405 × 10⁻⁵ m
(2.5272 × 10⁻⁵ m)
7.3999 × 10⁻⁴ m
(7.5090 × 10⁻⁴ m)
6.7180 × 10⁻⁴ m
(6.8456 × 10⁻⁴ m)
Table 6. The speed of MBS in ECR, the distance of Moon-Earth centroid, and the speed of corresponding sub-point in ENU orientation. The line parallel to latitude and direct to east is called “E” orientation; the line parallel to longitude and direct to north is called “N” orientation; and the other line that satisfies the right-hand rule with the “E” and “N” is called “U” orientation. The time of apogee, perigee, ascending, and descending nodes are consistent with the time in Table 2 and Table 3.
ApogeePerigeeAscending NodeDescending Node
MBS’s speed (m/s)971.7 1102.21039.8997.2
East’s speed (m/s)−420.865−412.103−448.733−450.012
North’s speed (m/s)2.704−2.184−6.8036.265
Up’s speed (m/s)−0.017−0.0021.168−1.027
Distance of moon-earth centroid (km)4.0656 × 10⁸ m3.5713 × 108 m3.7670 × 108 m3.9715 × 108 m
Table 7. Basic system parameters of MBS.
ParameterValue
Carrier frequency9 GHz
Pulse width100 us
Range bandwidth3 MHz
Azimuth oversampling1.2
Range oversampling1.2
Azimuth width angle0.014°
Range width angle0.028°
Look angle0.3°
Publisher’s Note: MDPI stays neutral with regard to jurisdictional claims in published maps and institutional affiliations.