
Geochemical Analysis of a Multi-Layer Hydrocarbon Reservoir in the Wuerhe Area, Junggar Basin


Abstract
:1. Introduction
2. Geological Setting and Petroleum Background
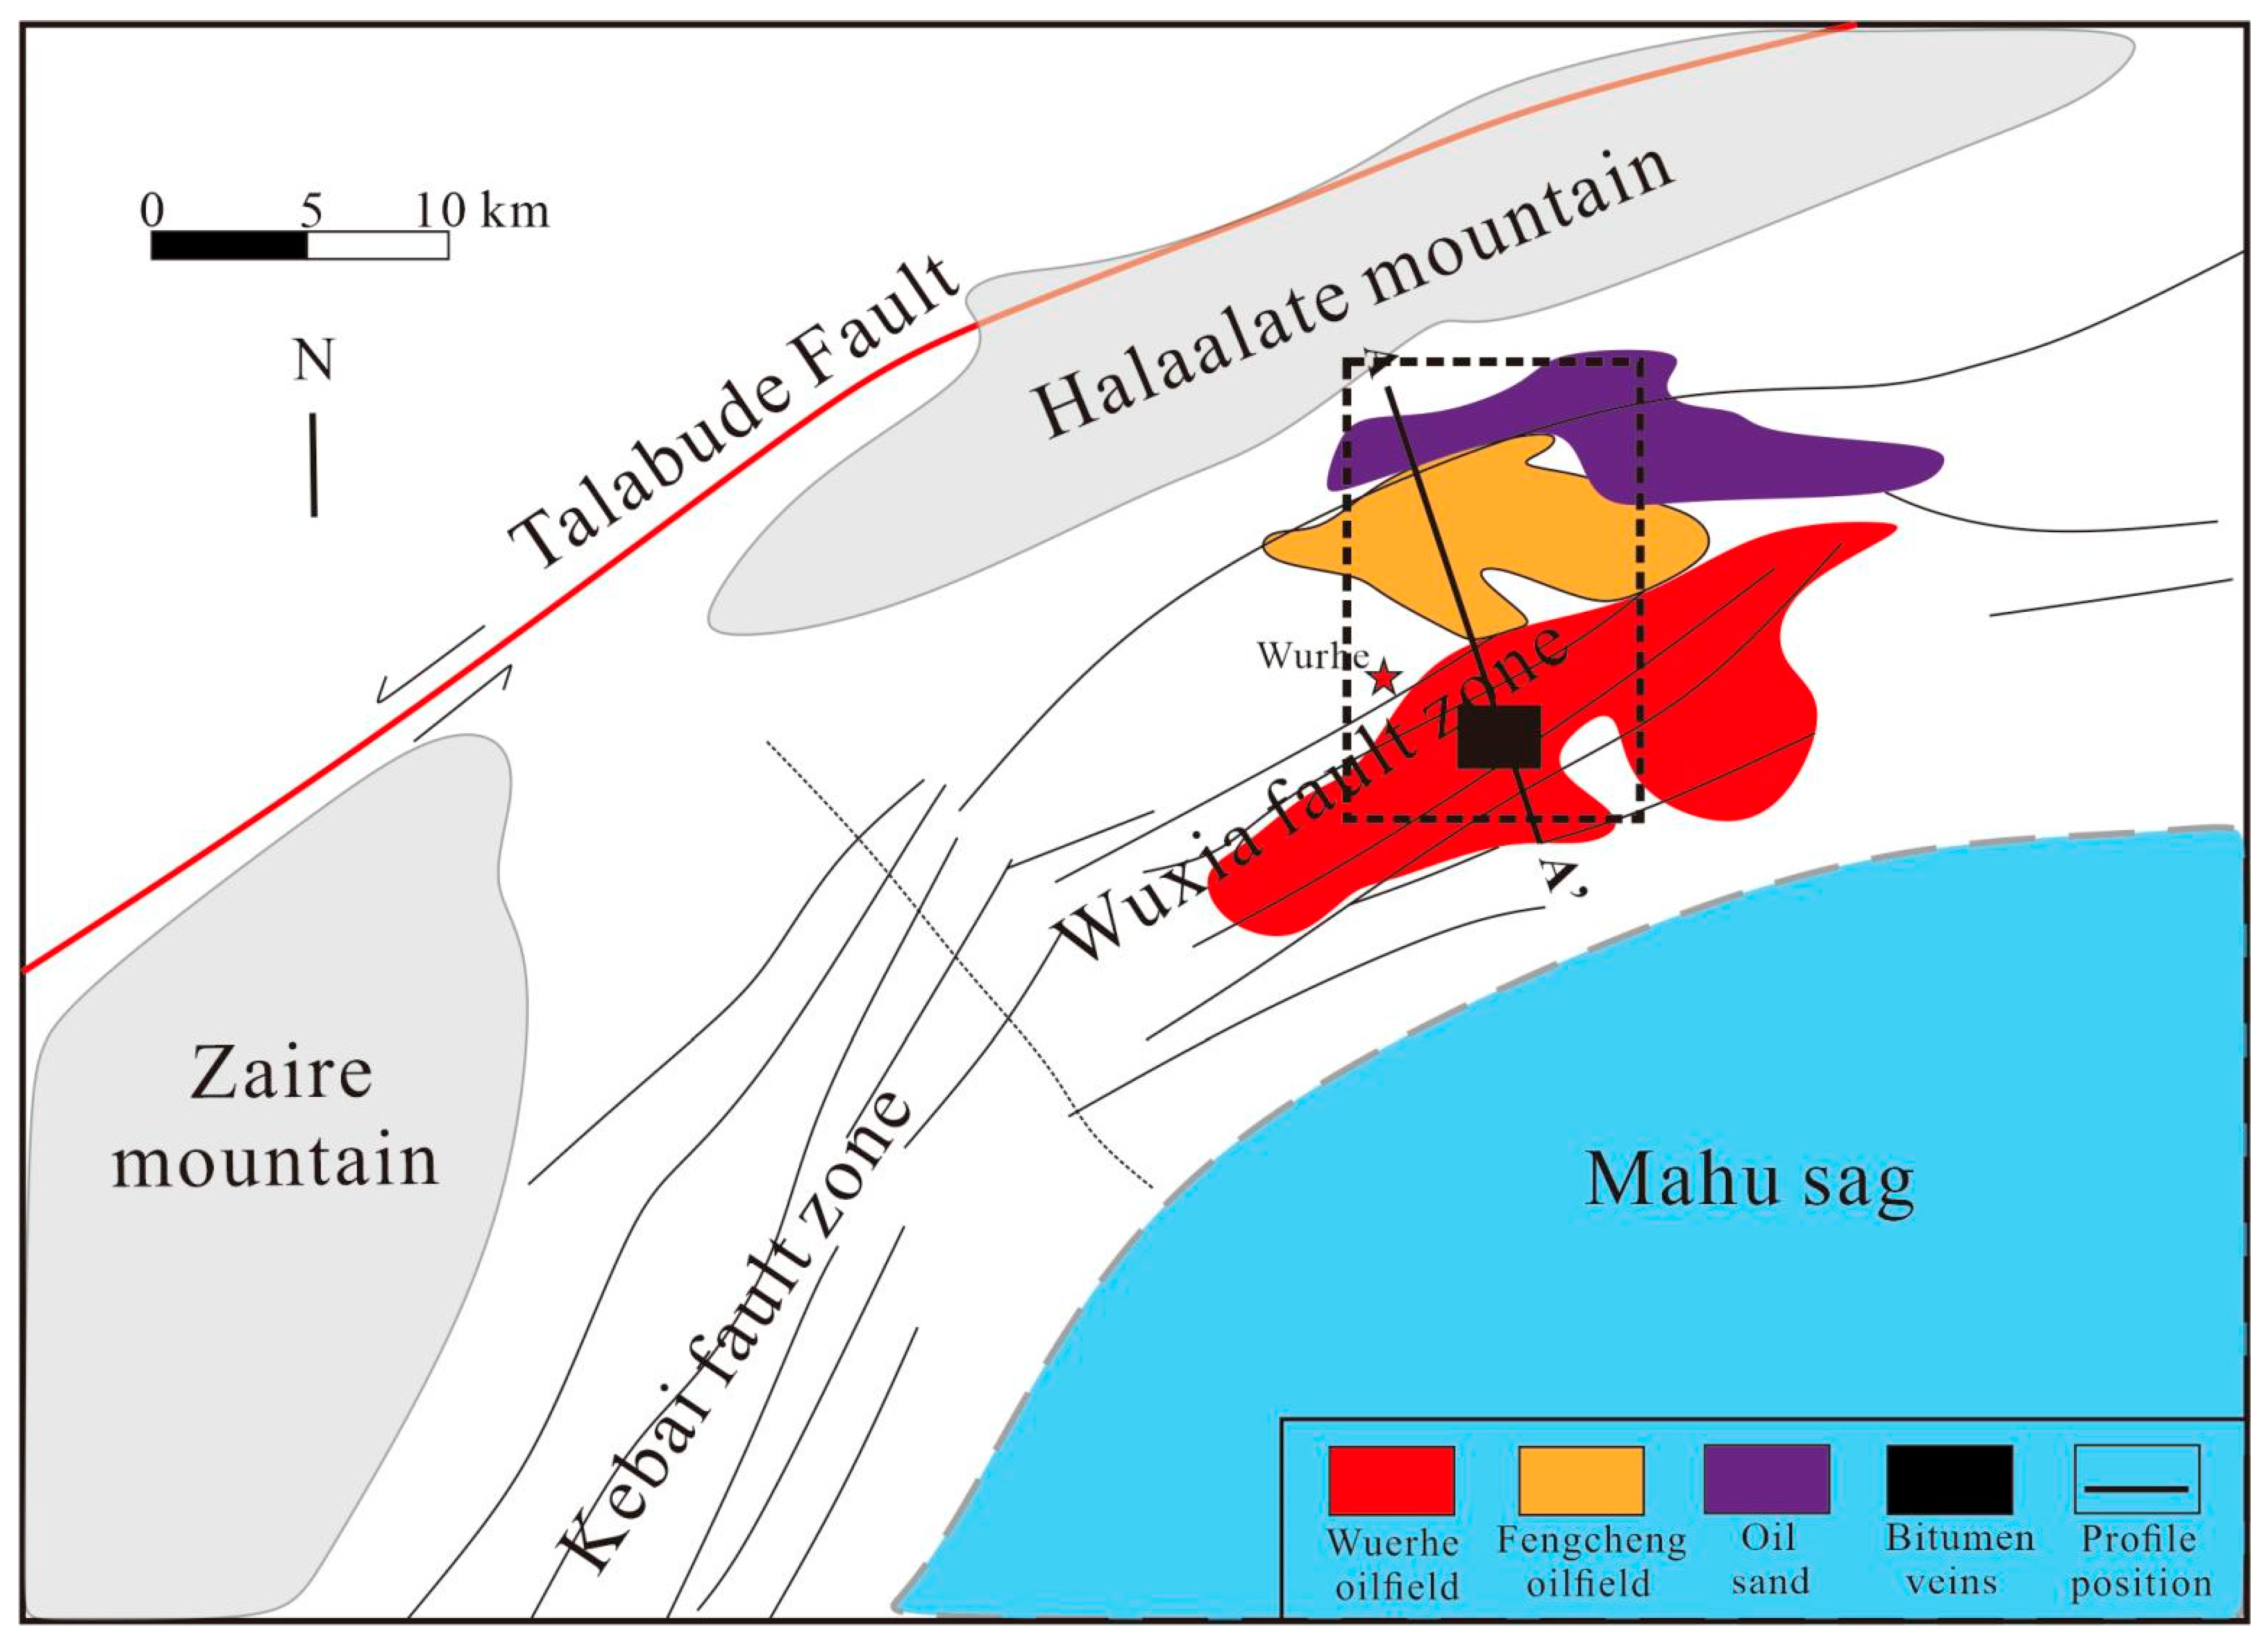
2.1. Geological Setting
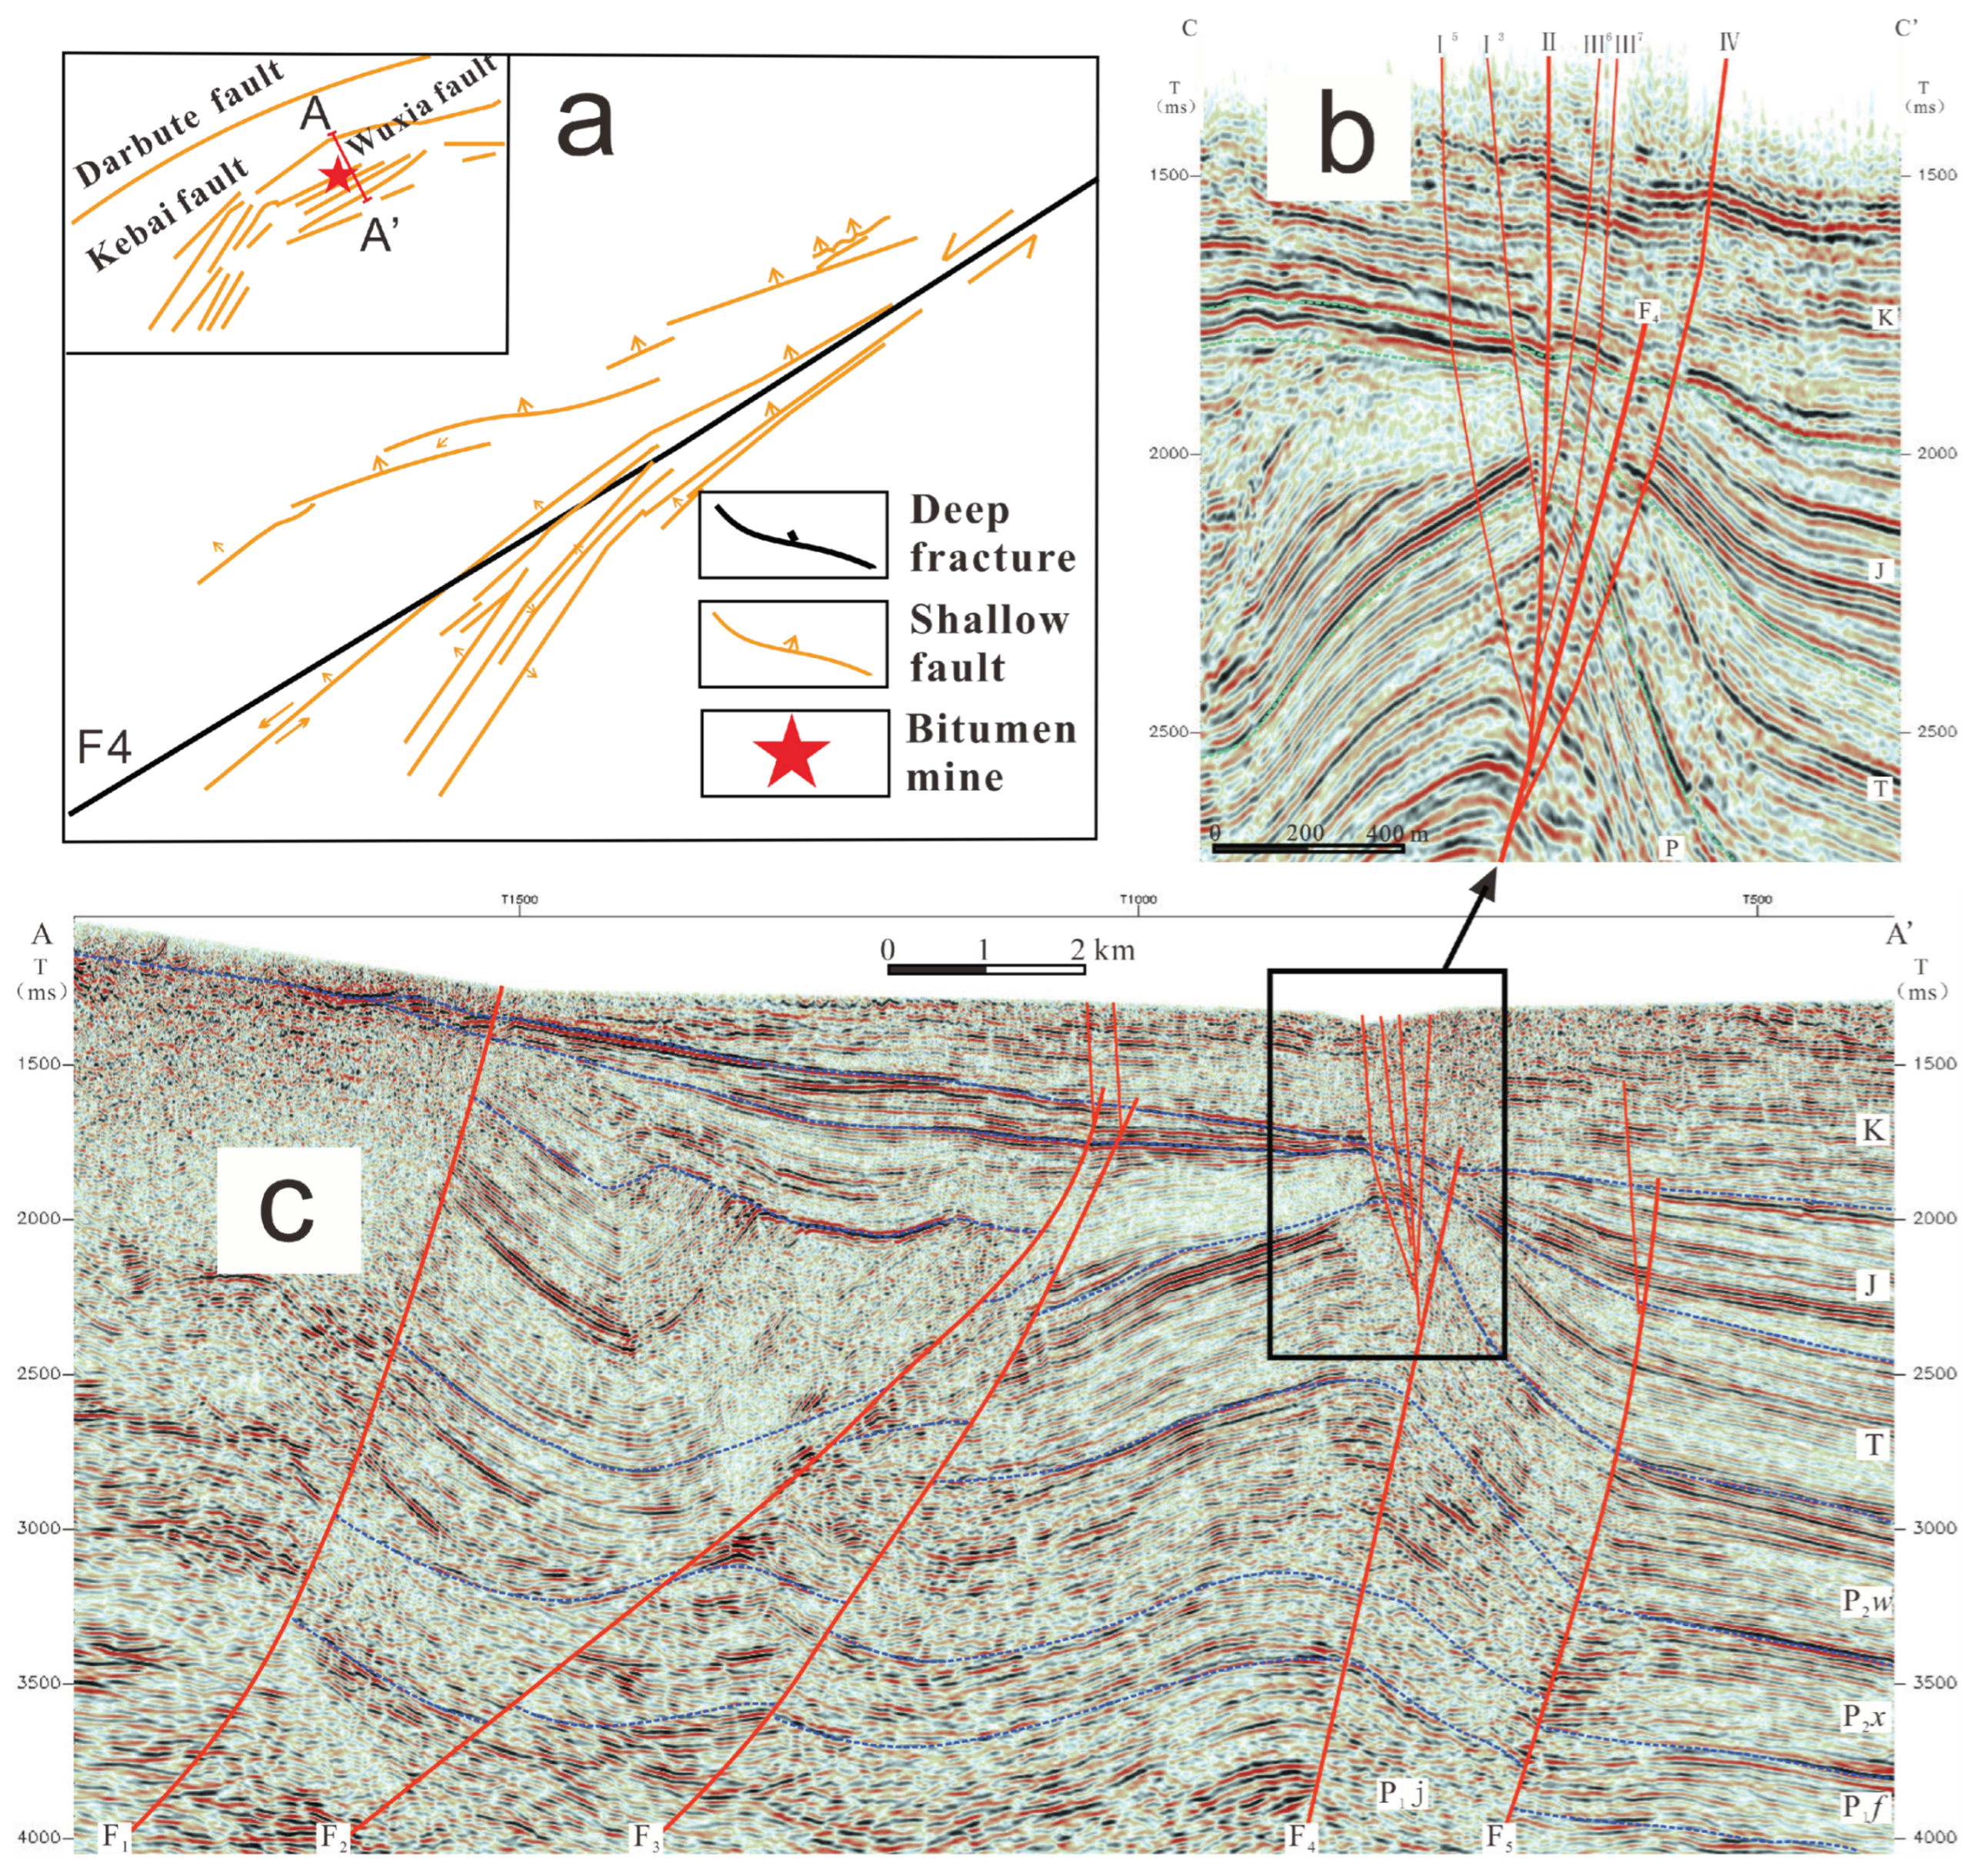
2.2. Structural Characteristics
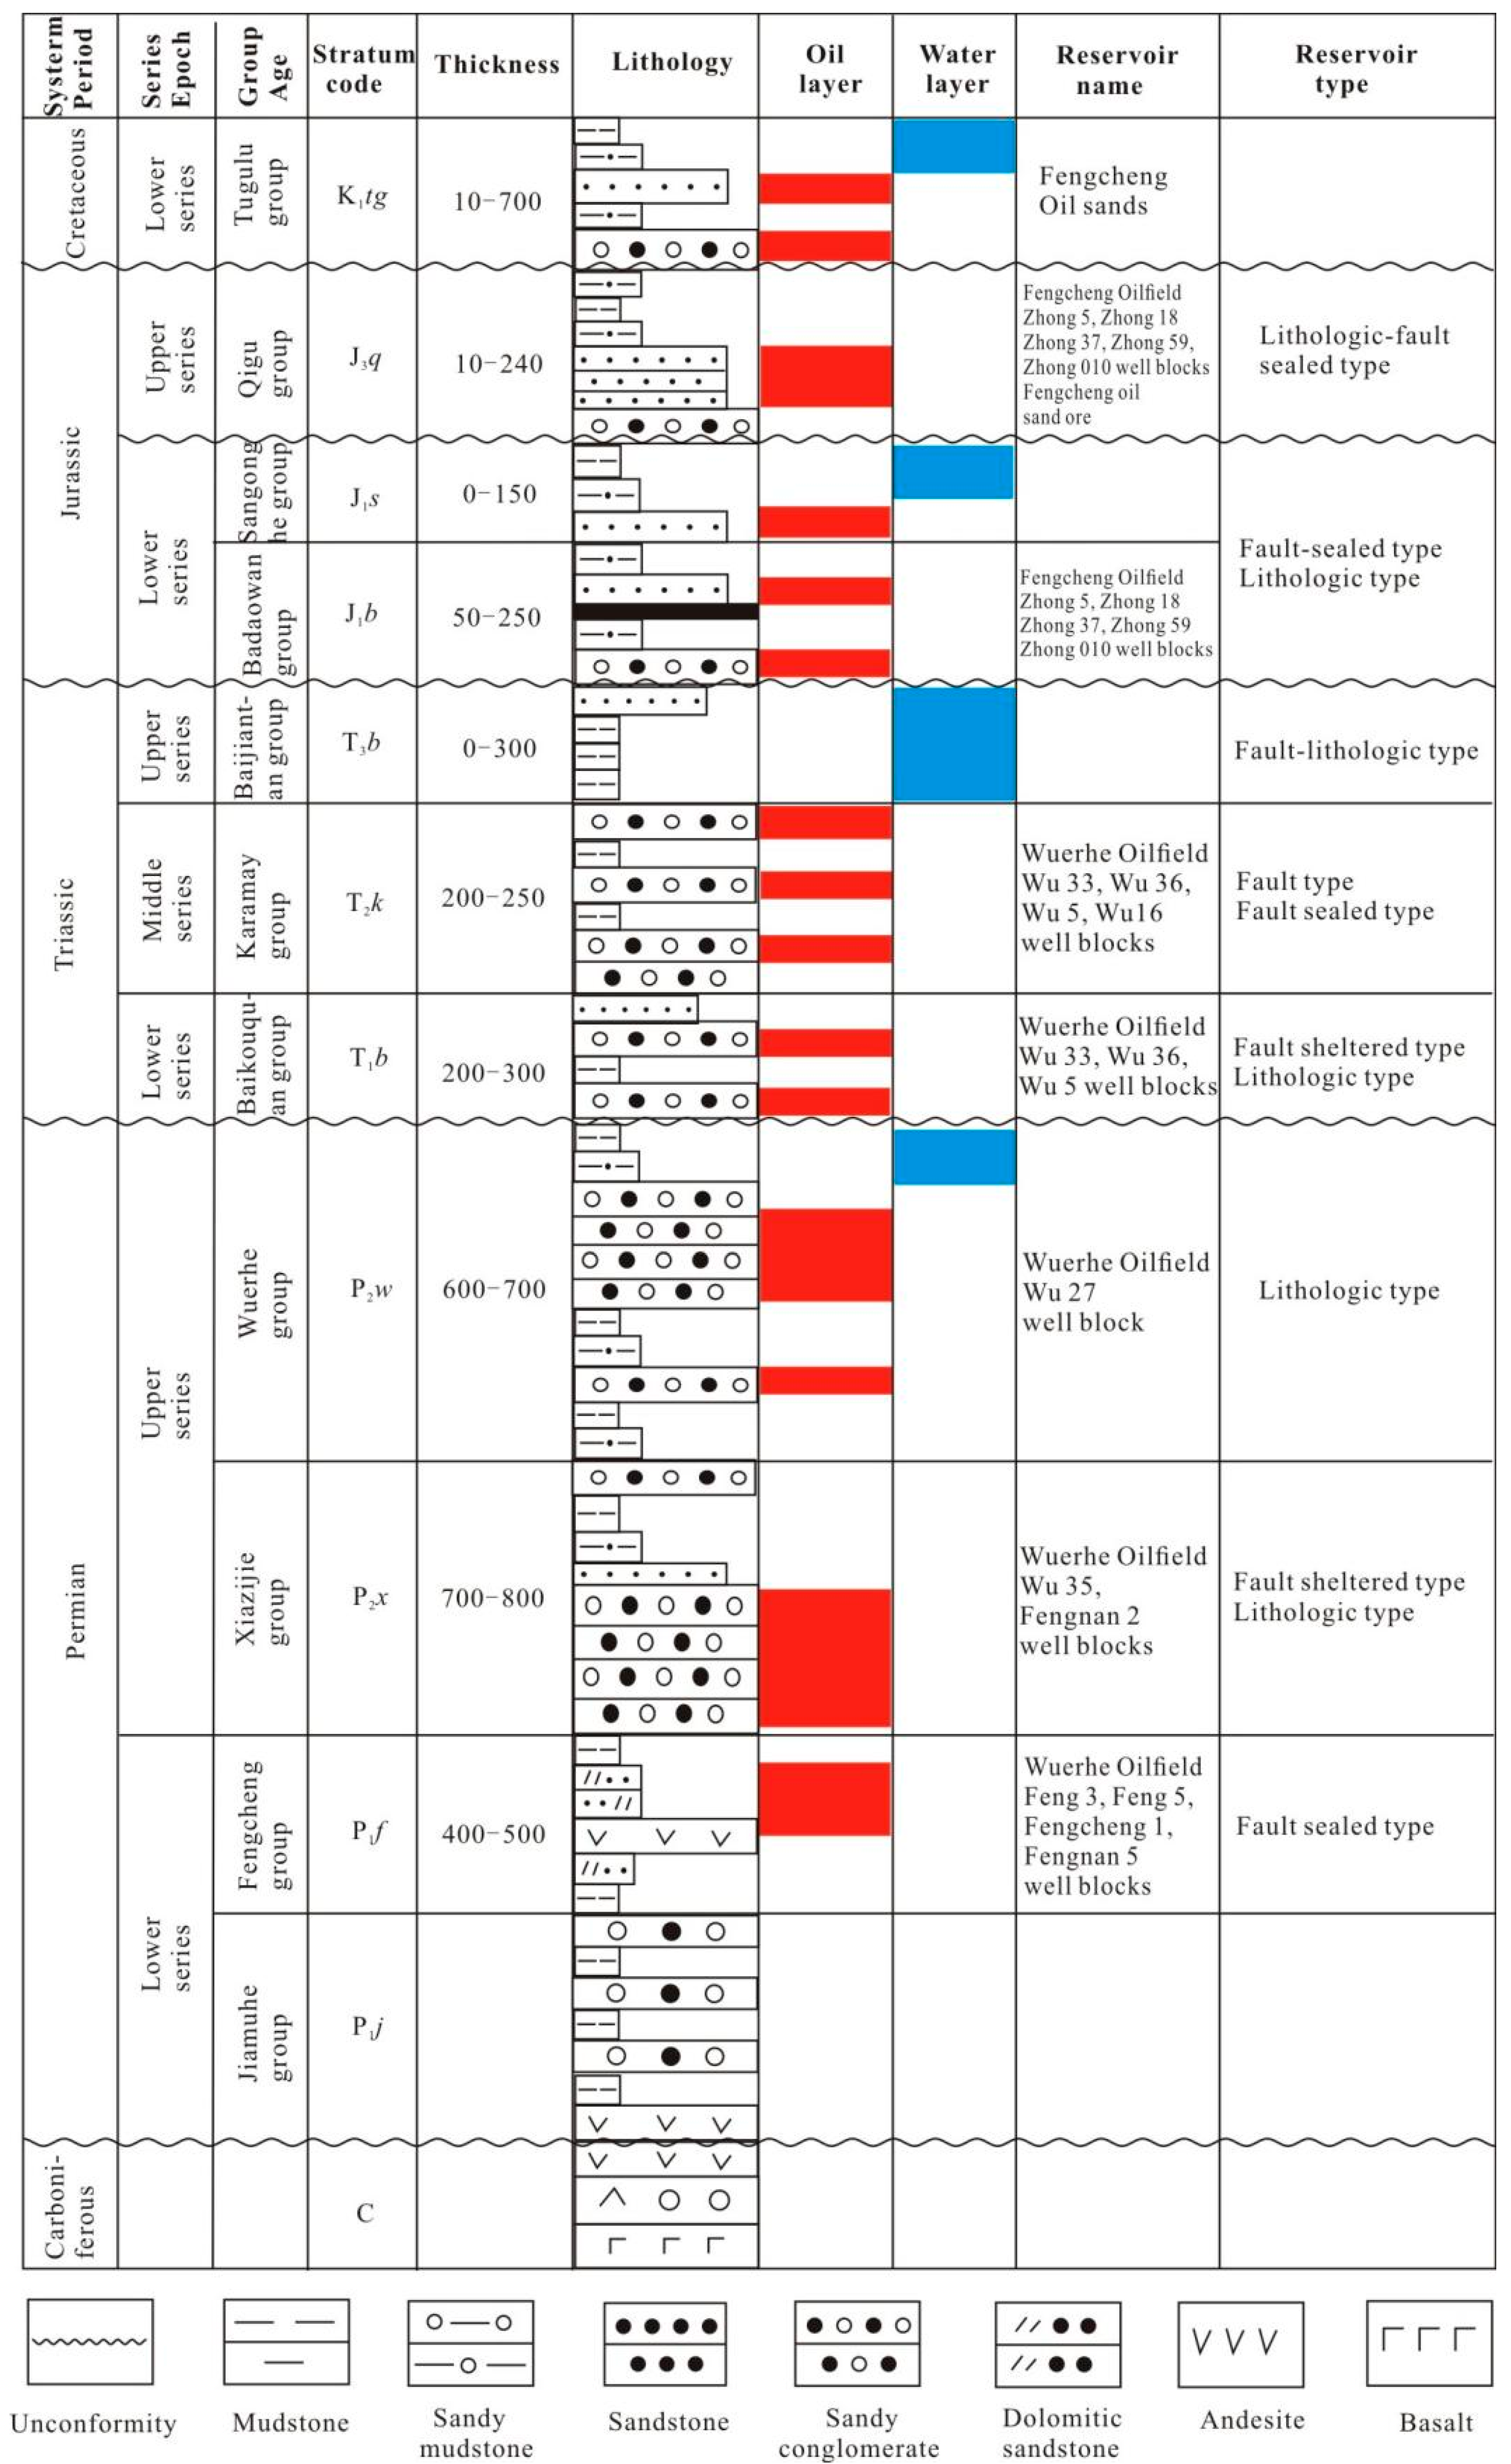
2.3. Petroleum Background
3. Experimental Methods
3.1. Separation of Organic Matter
3.2. GC Analysis
3.3. GC-MS Analysis
4. Results and Discussion
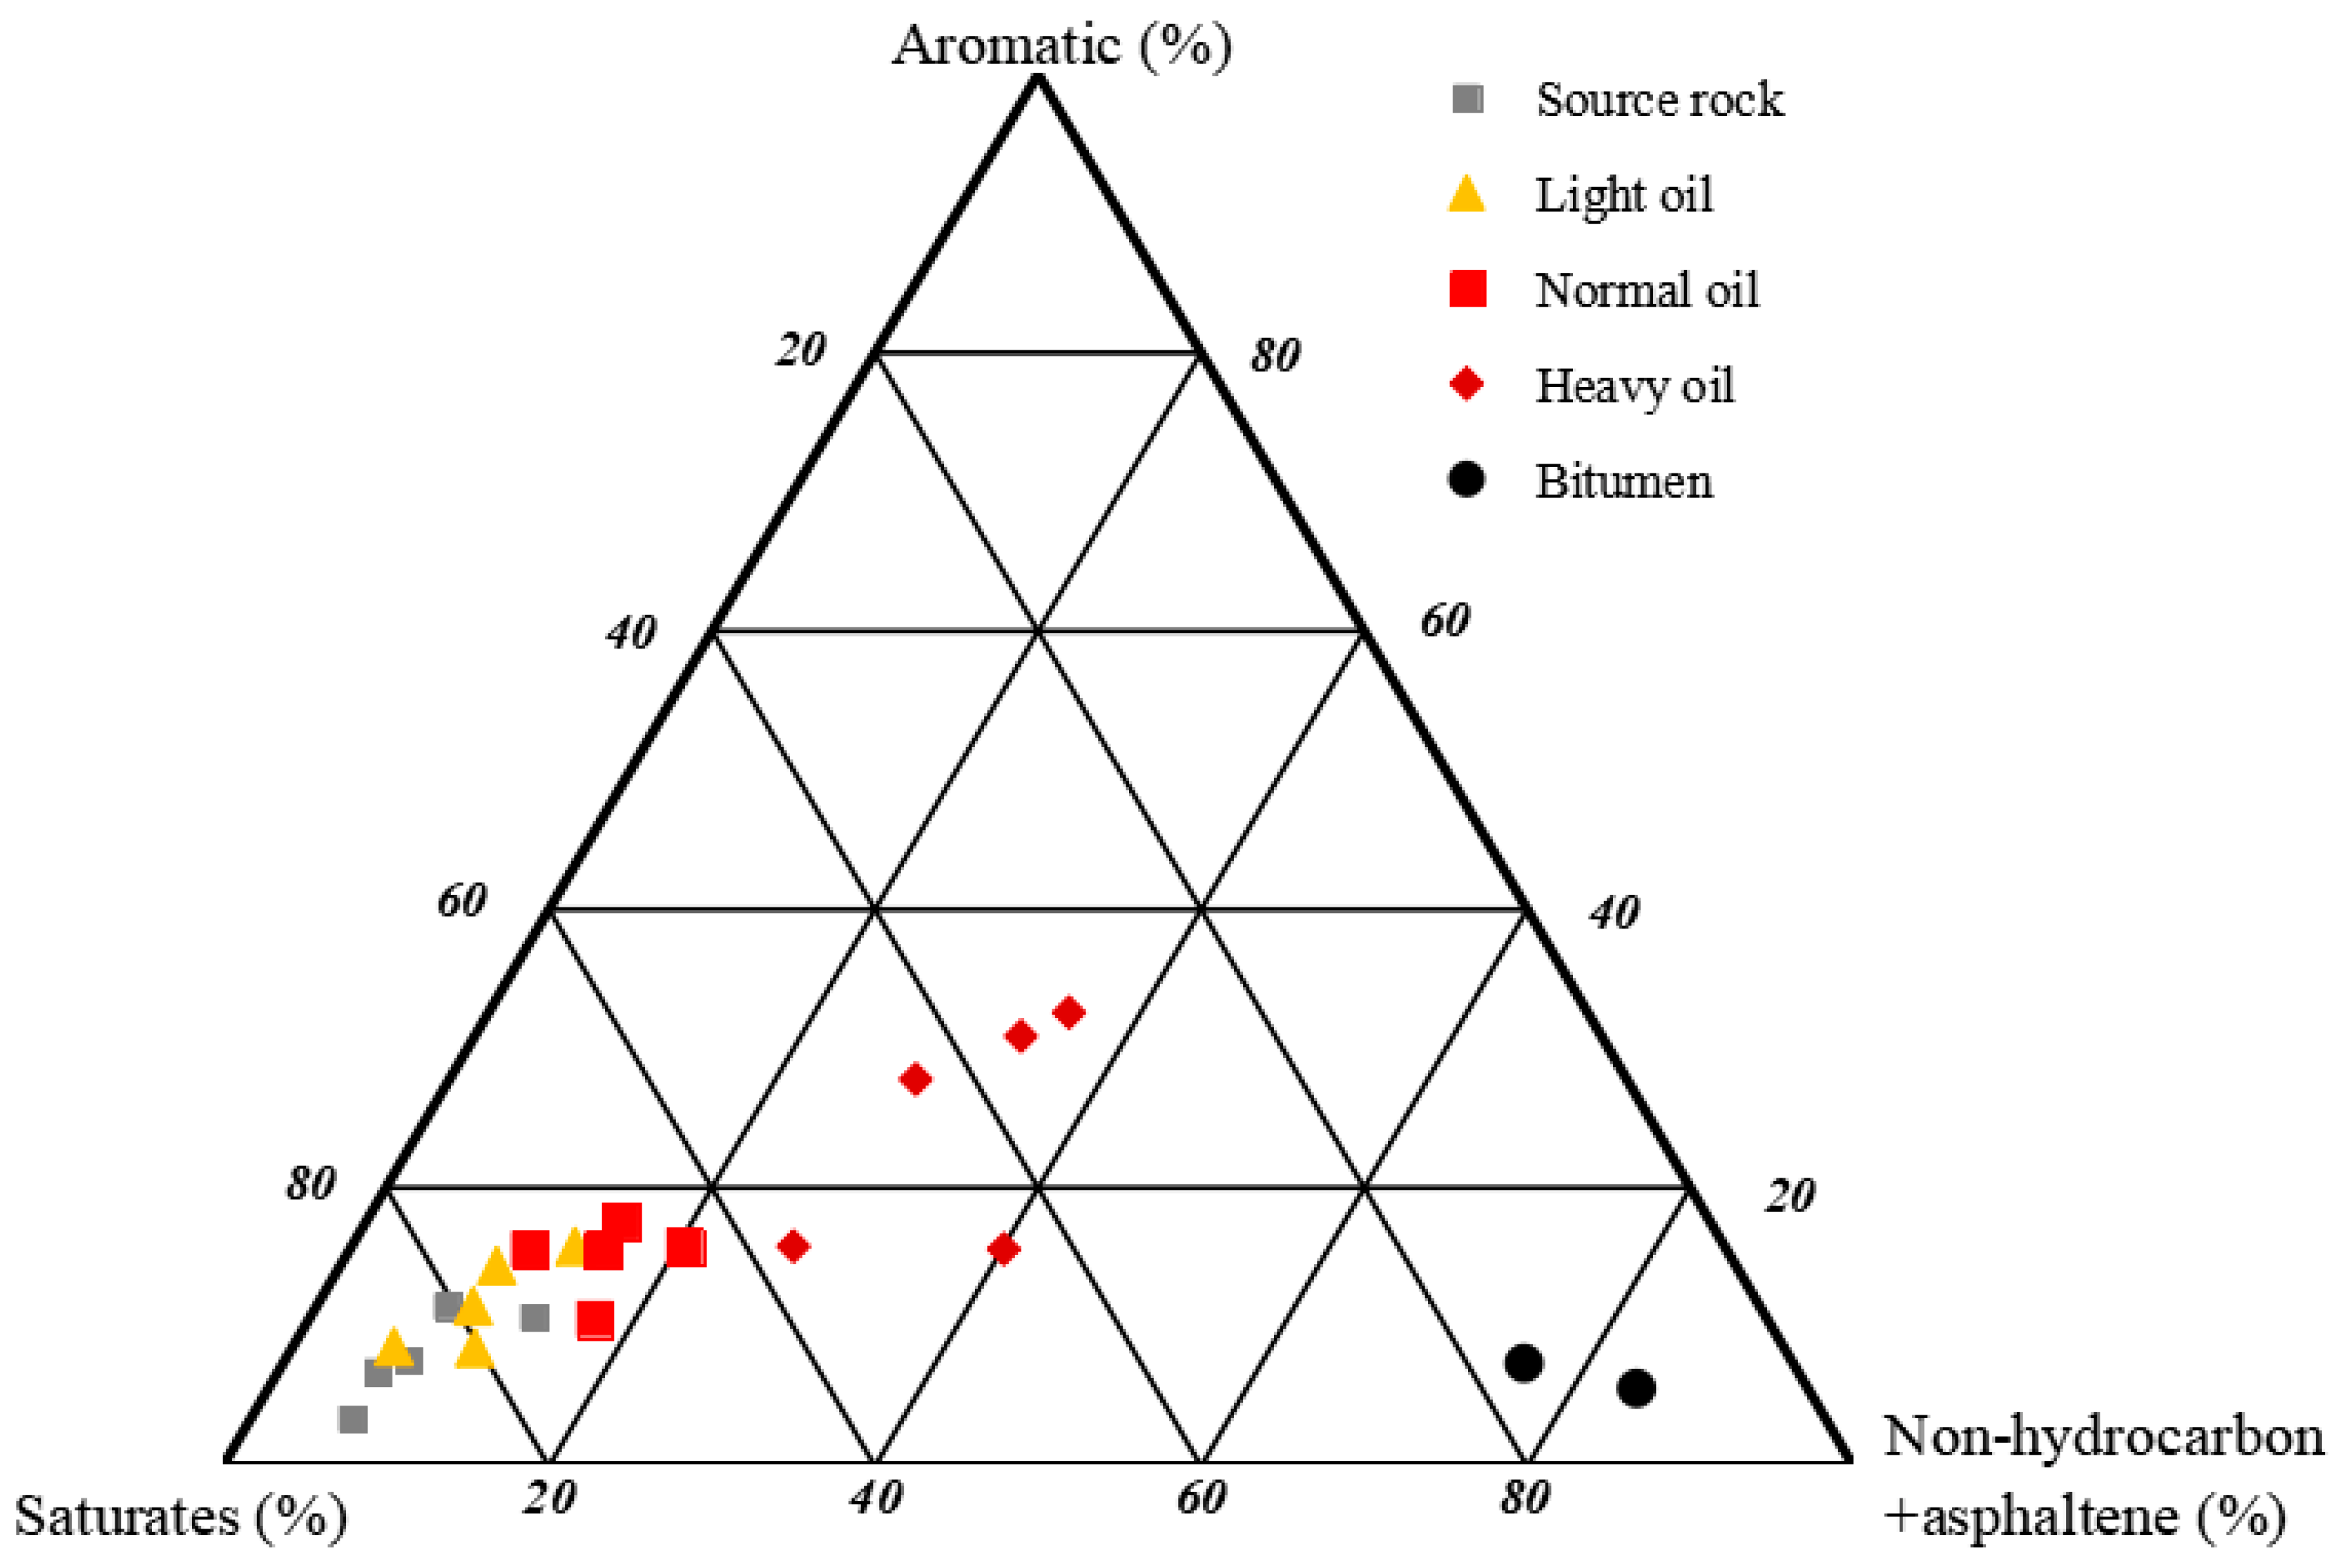
4.1. Group Composition
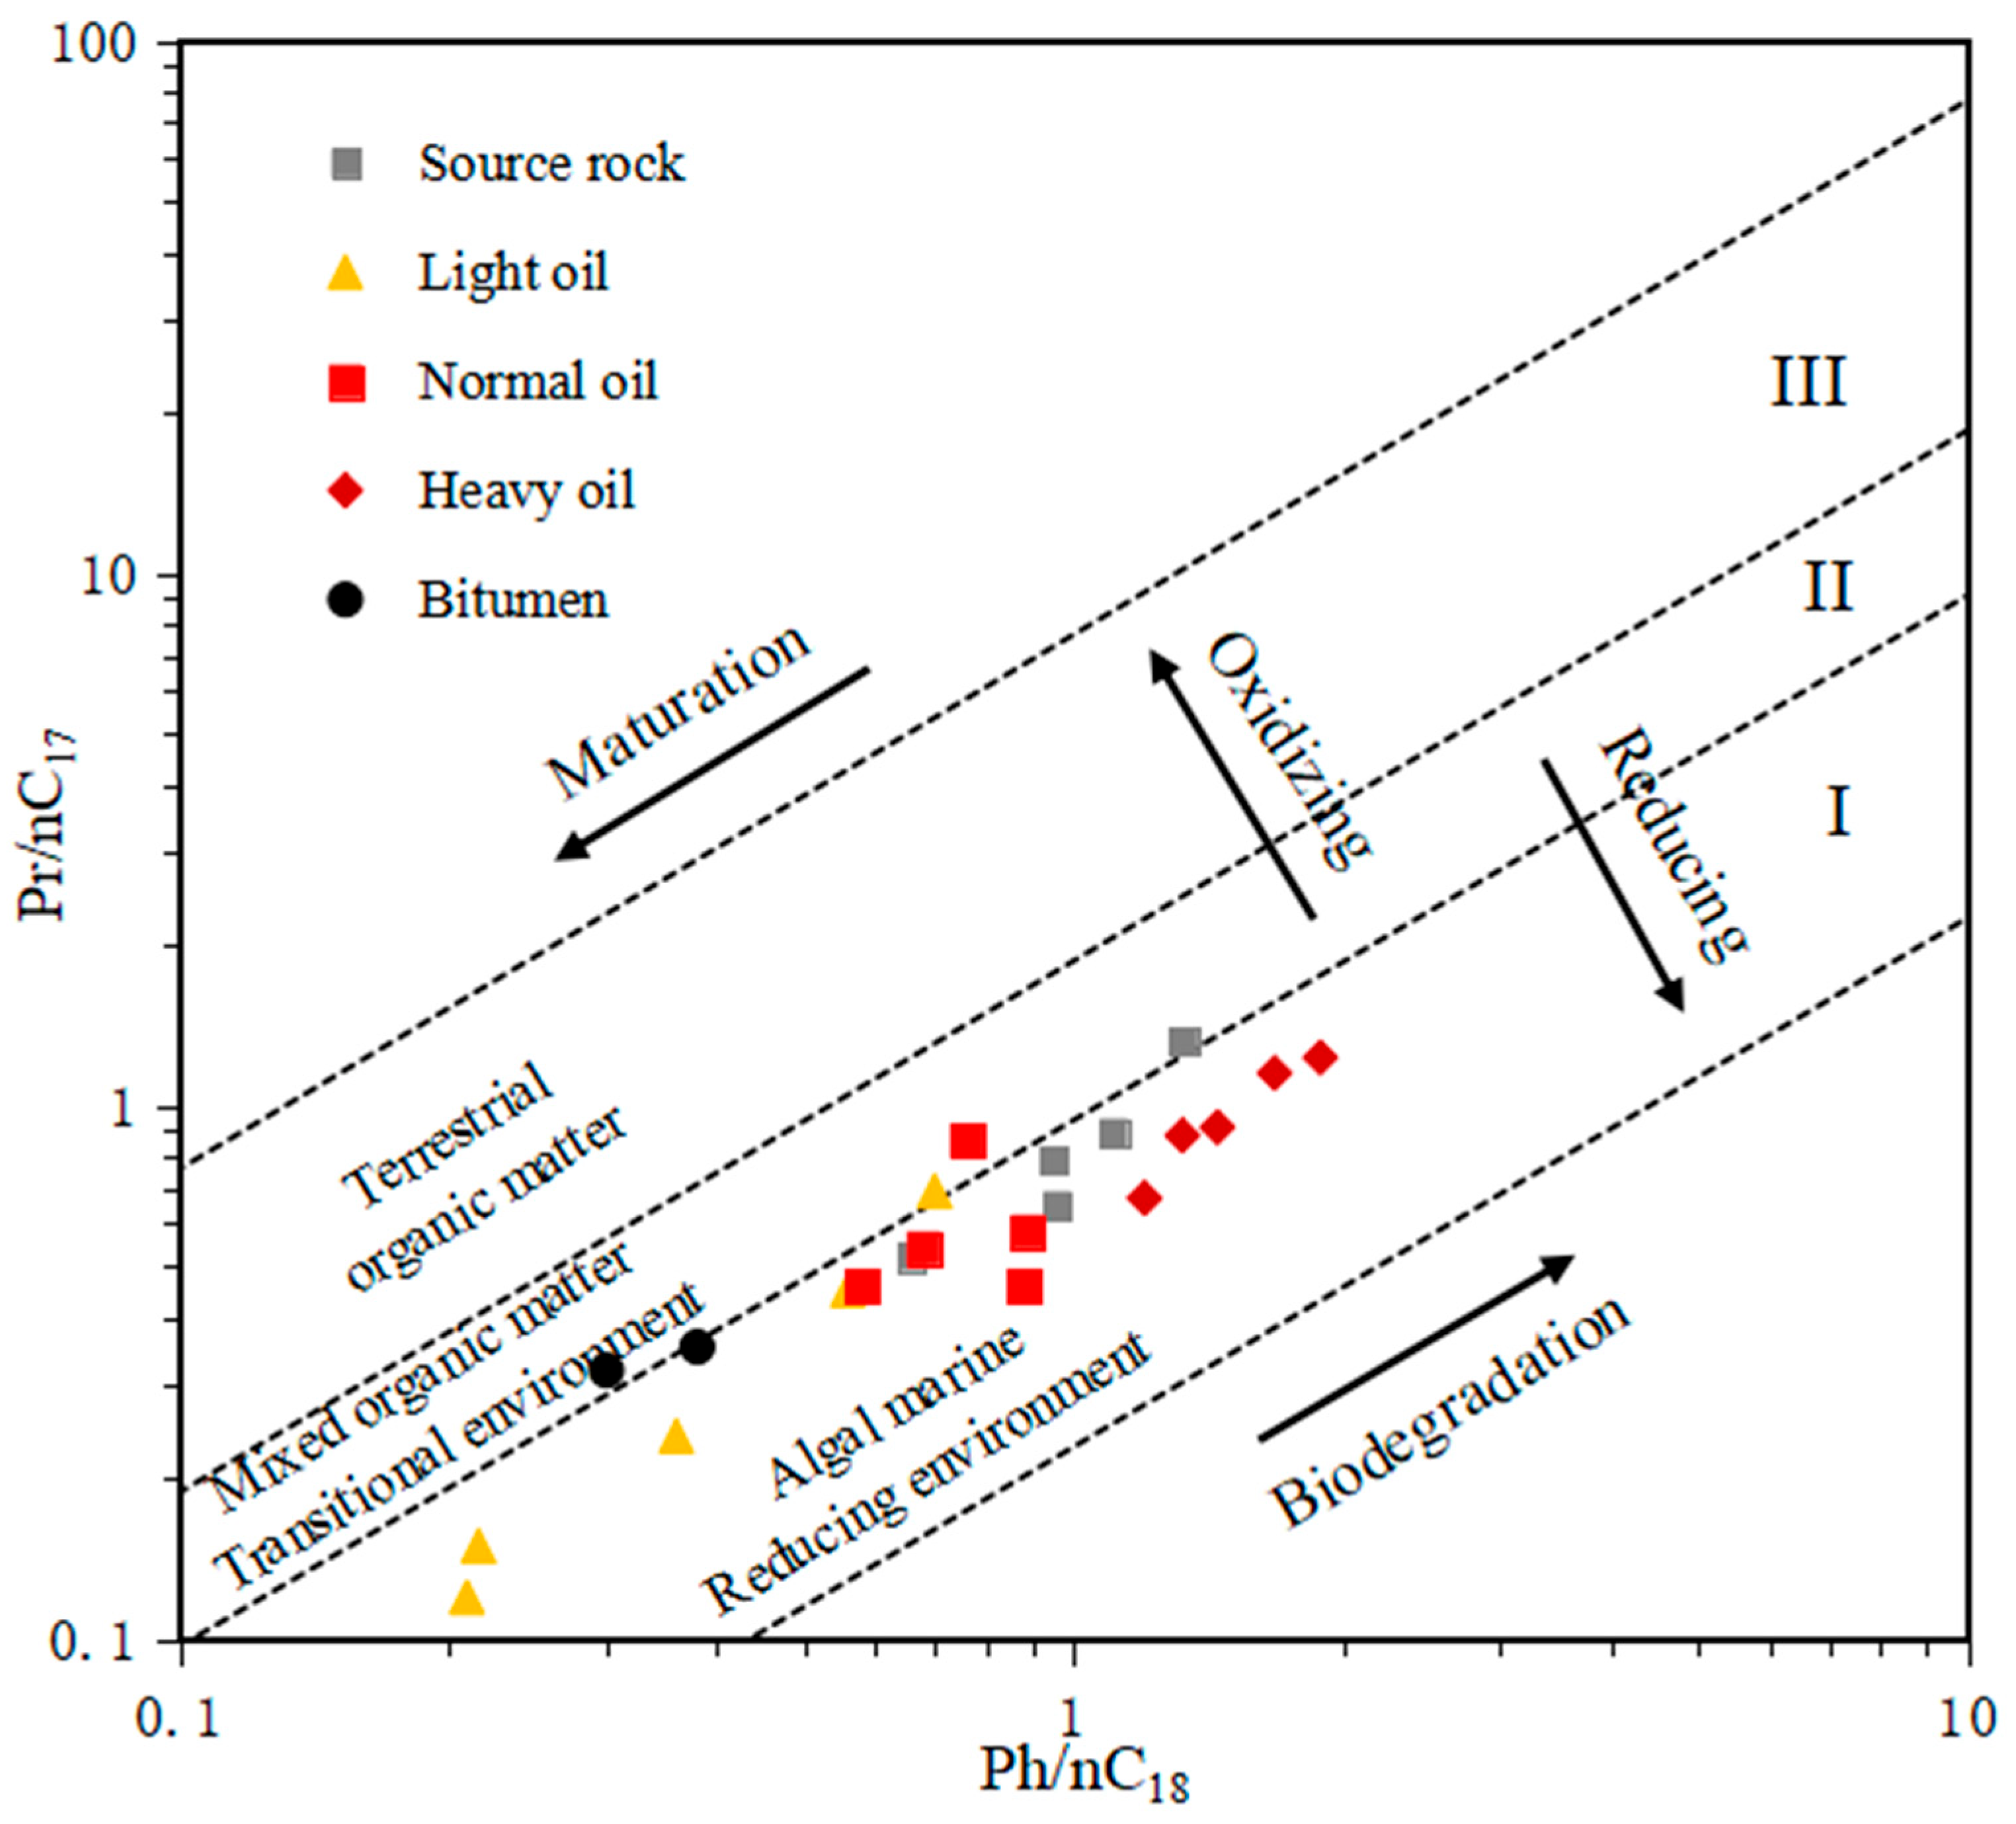
4.2. N-Alkanes
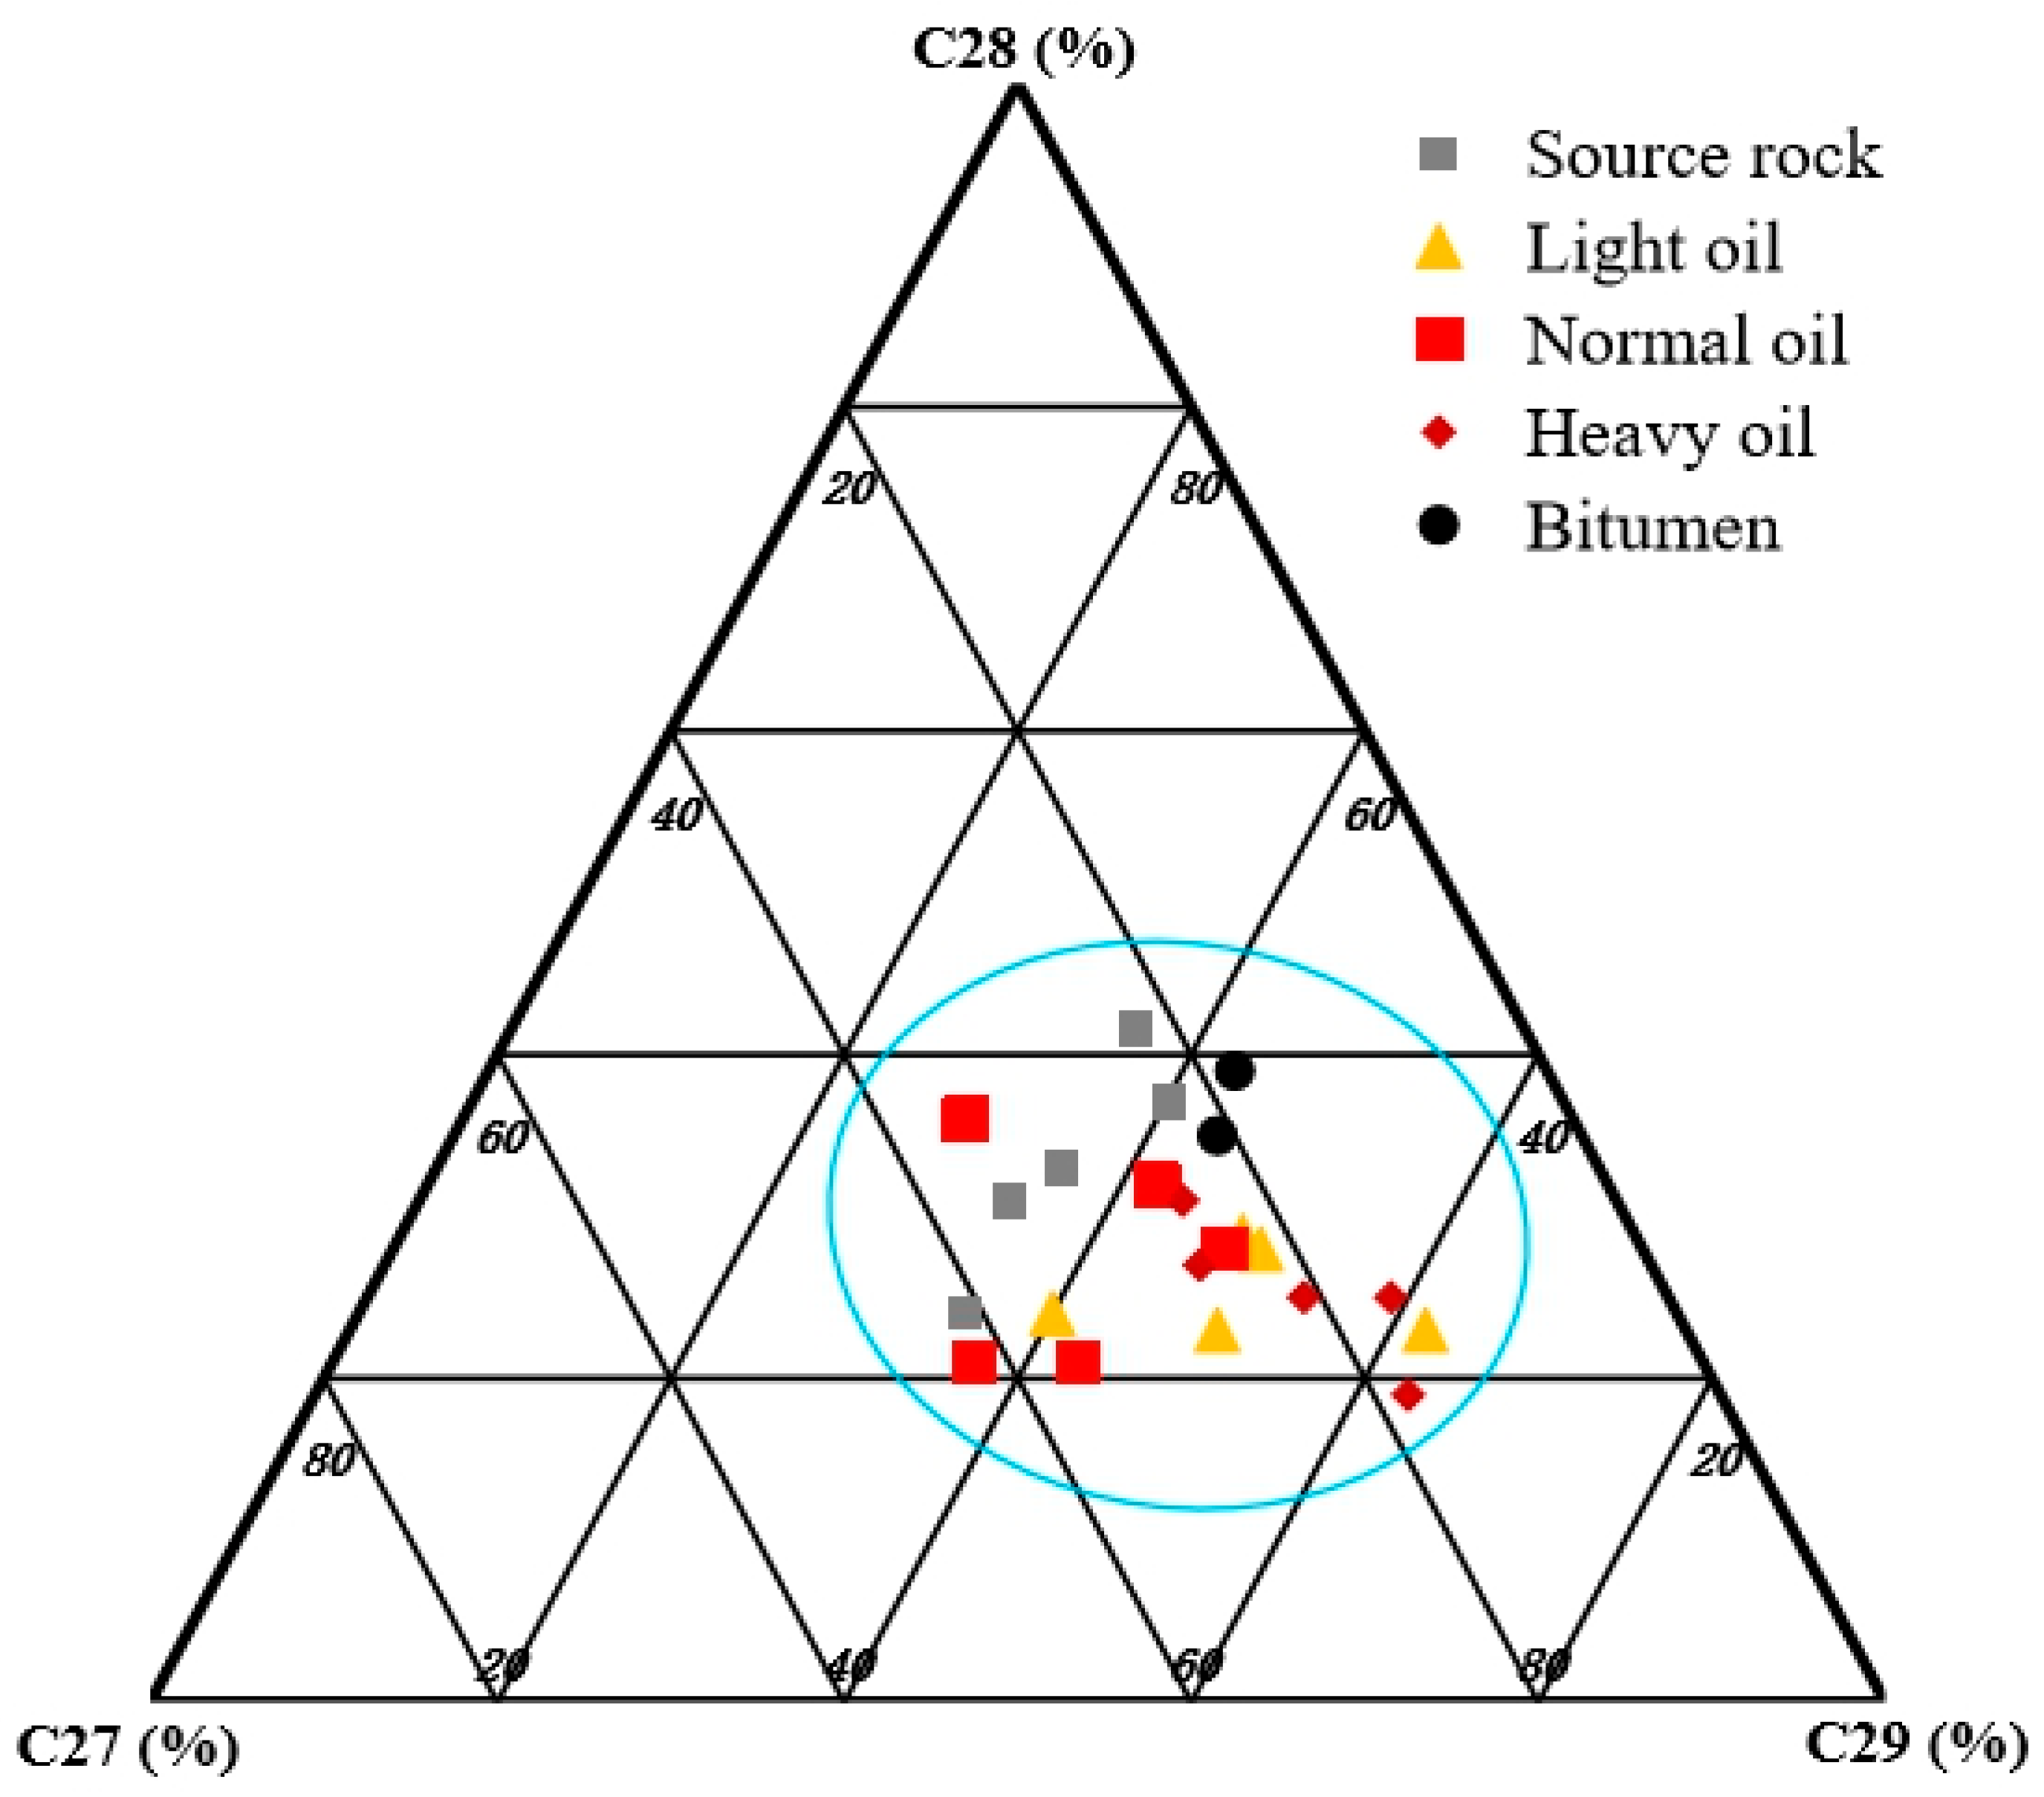
4.3. Steranes
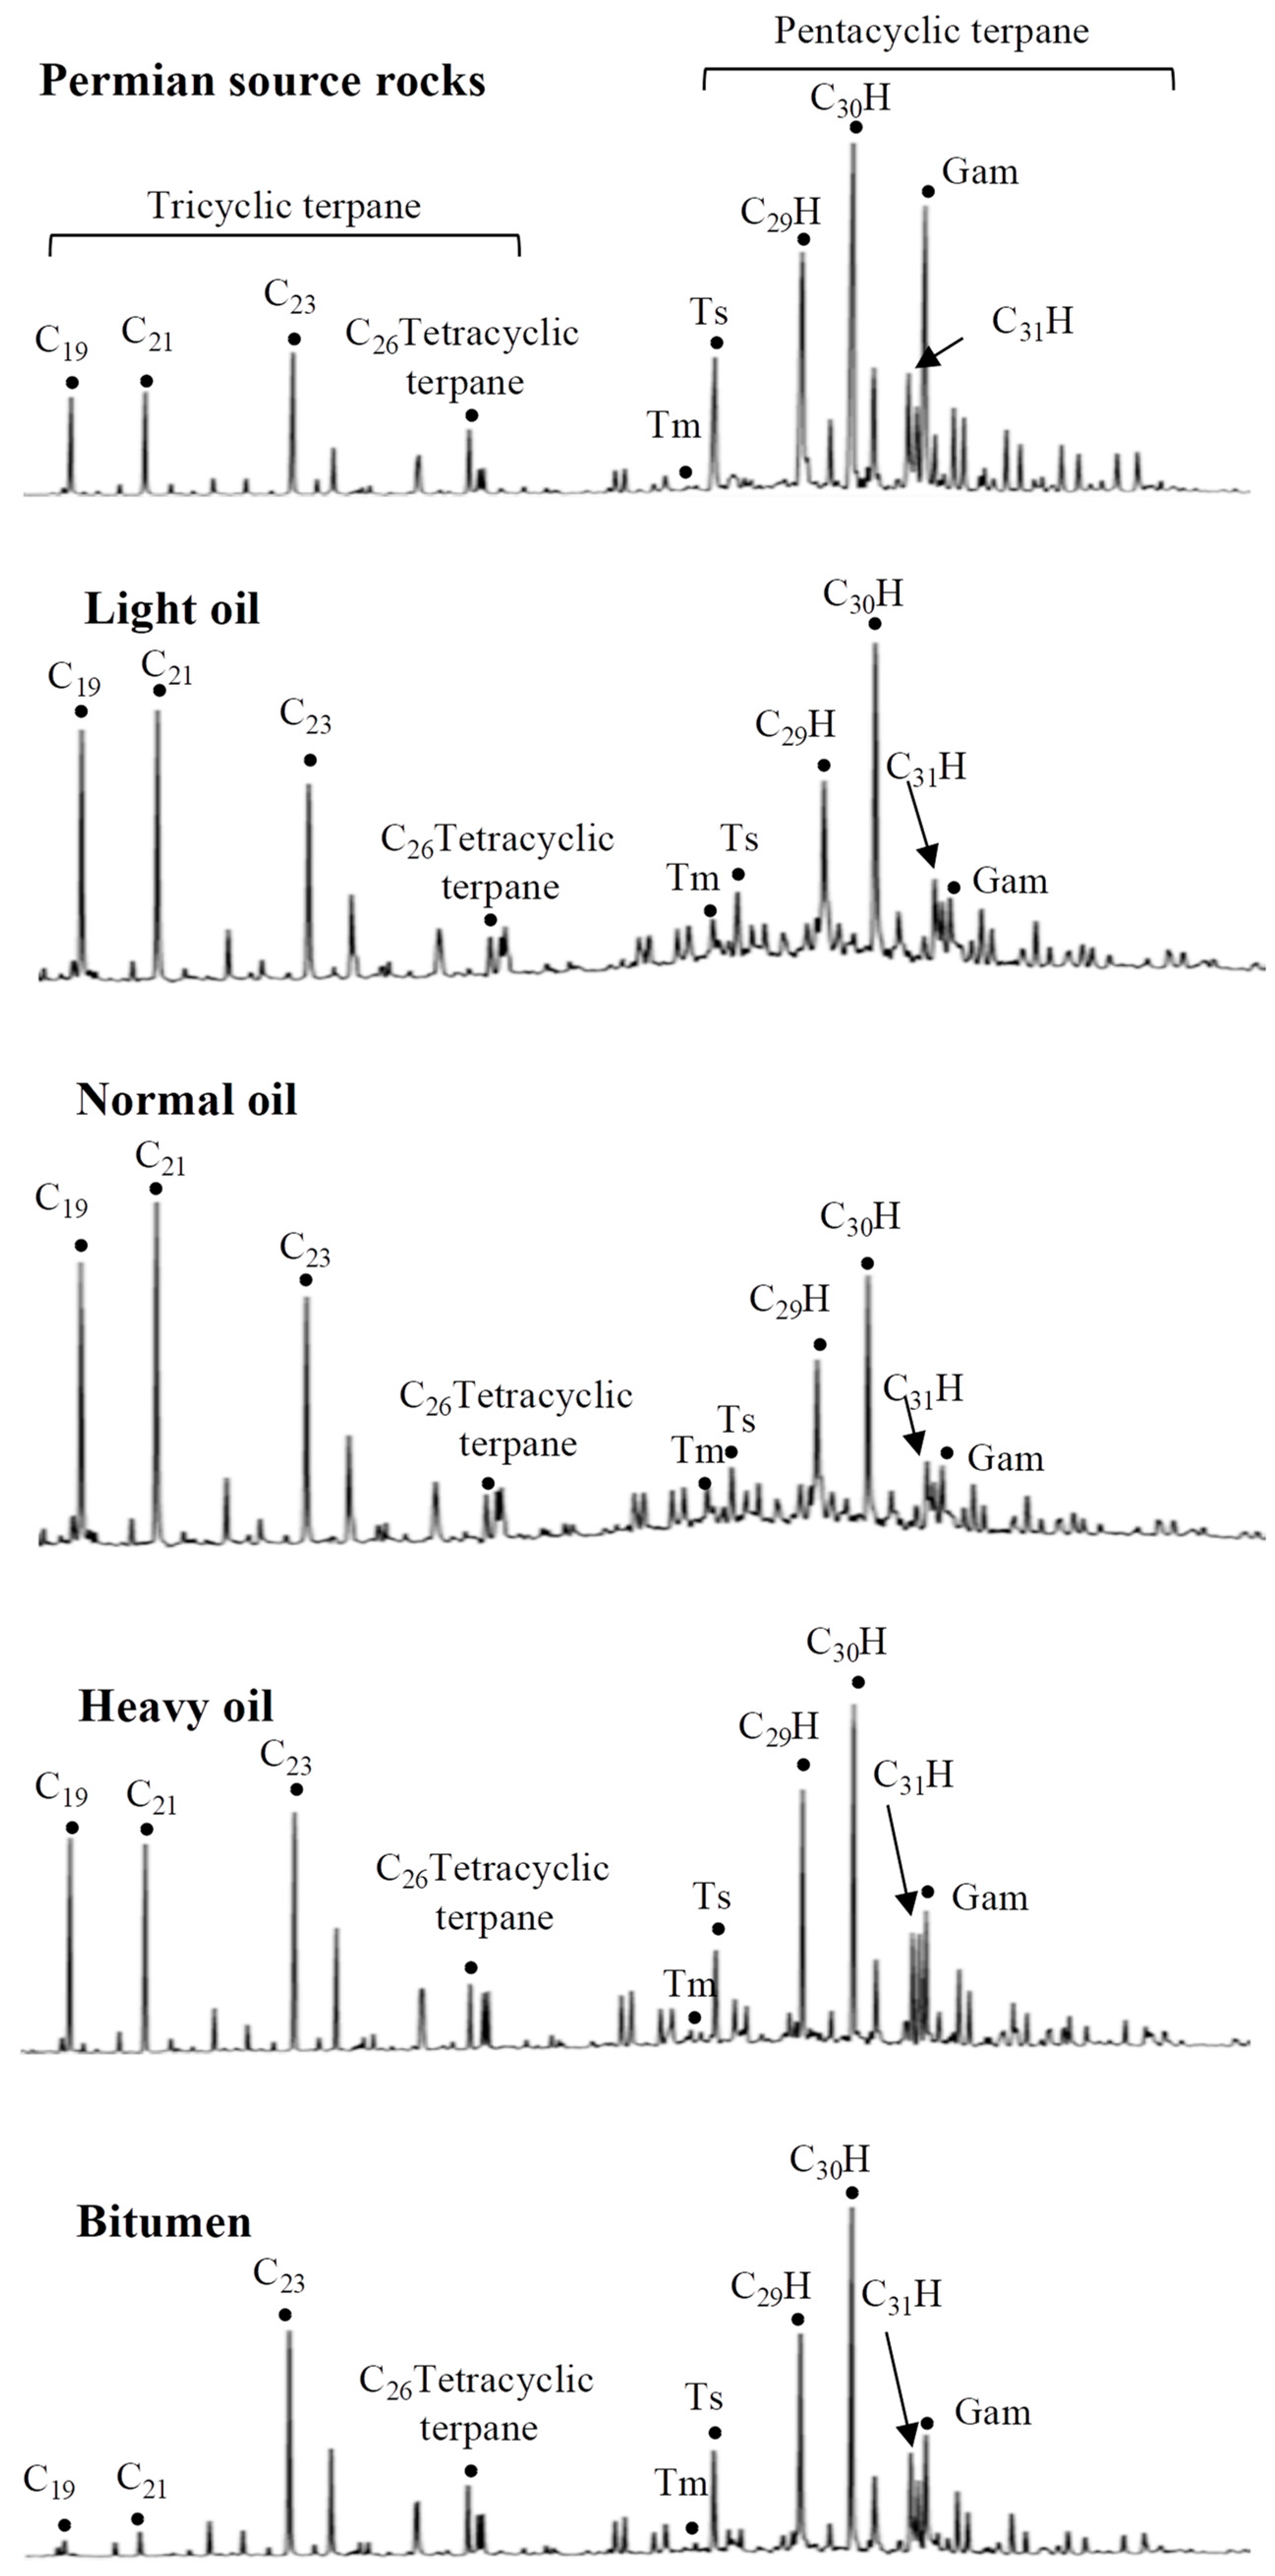
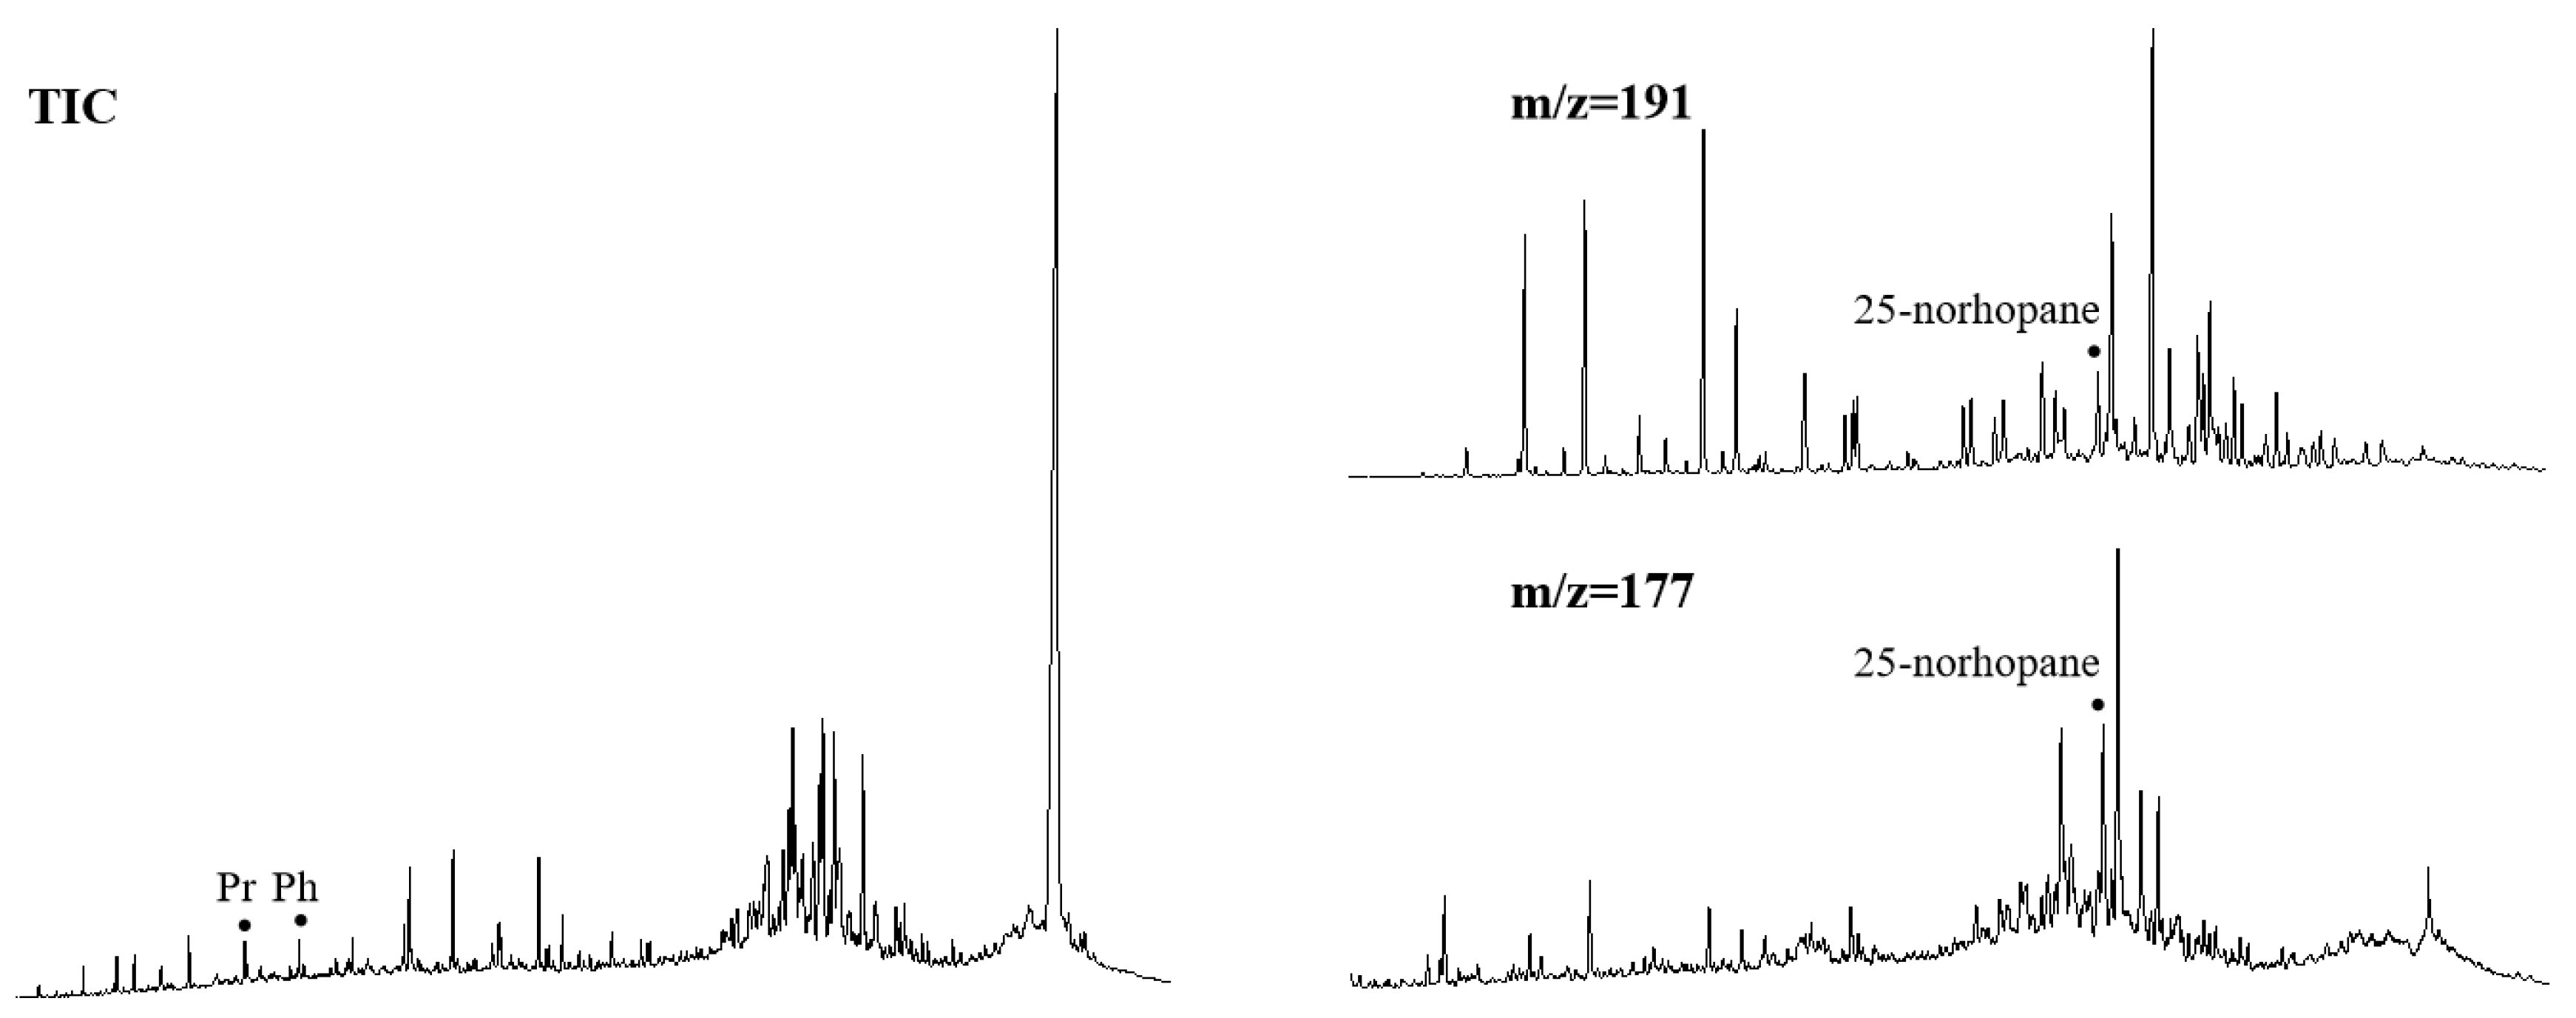
4.4. Hopanes
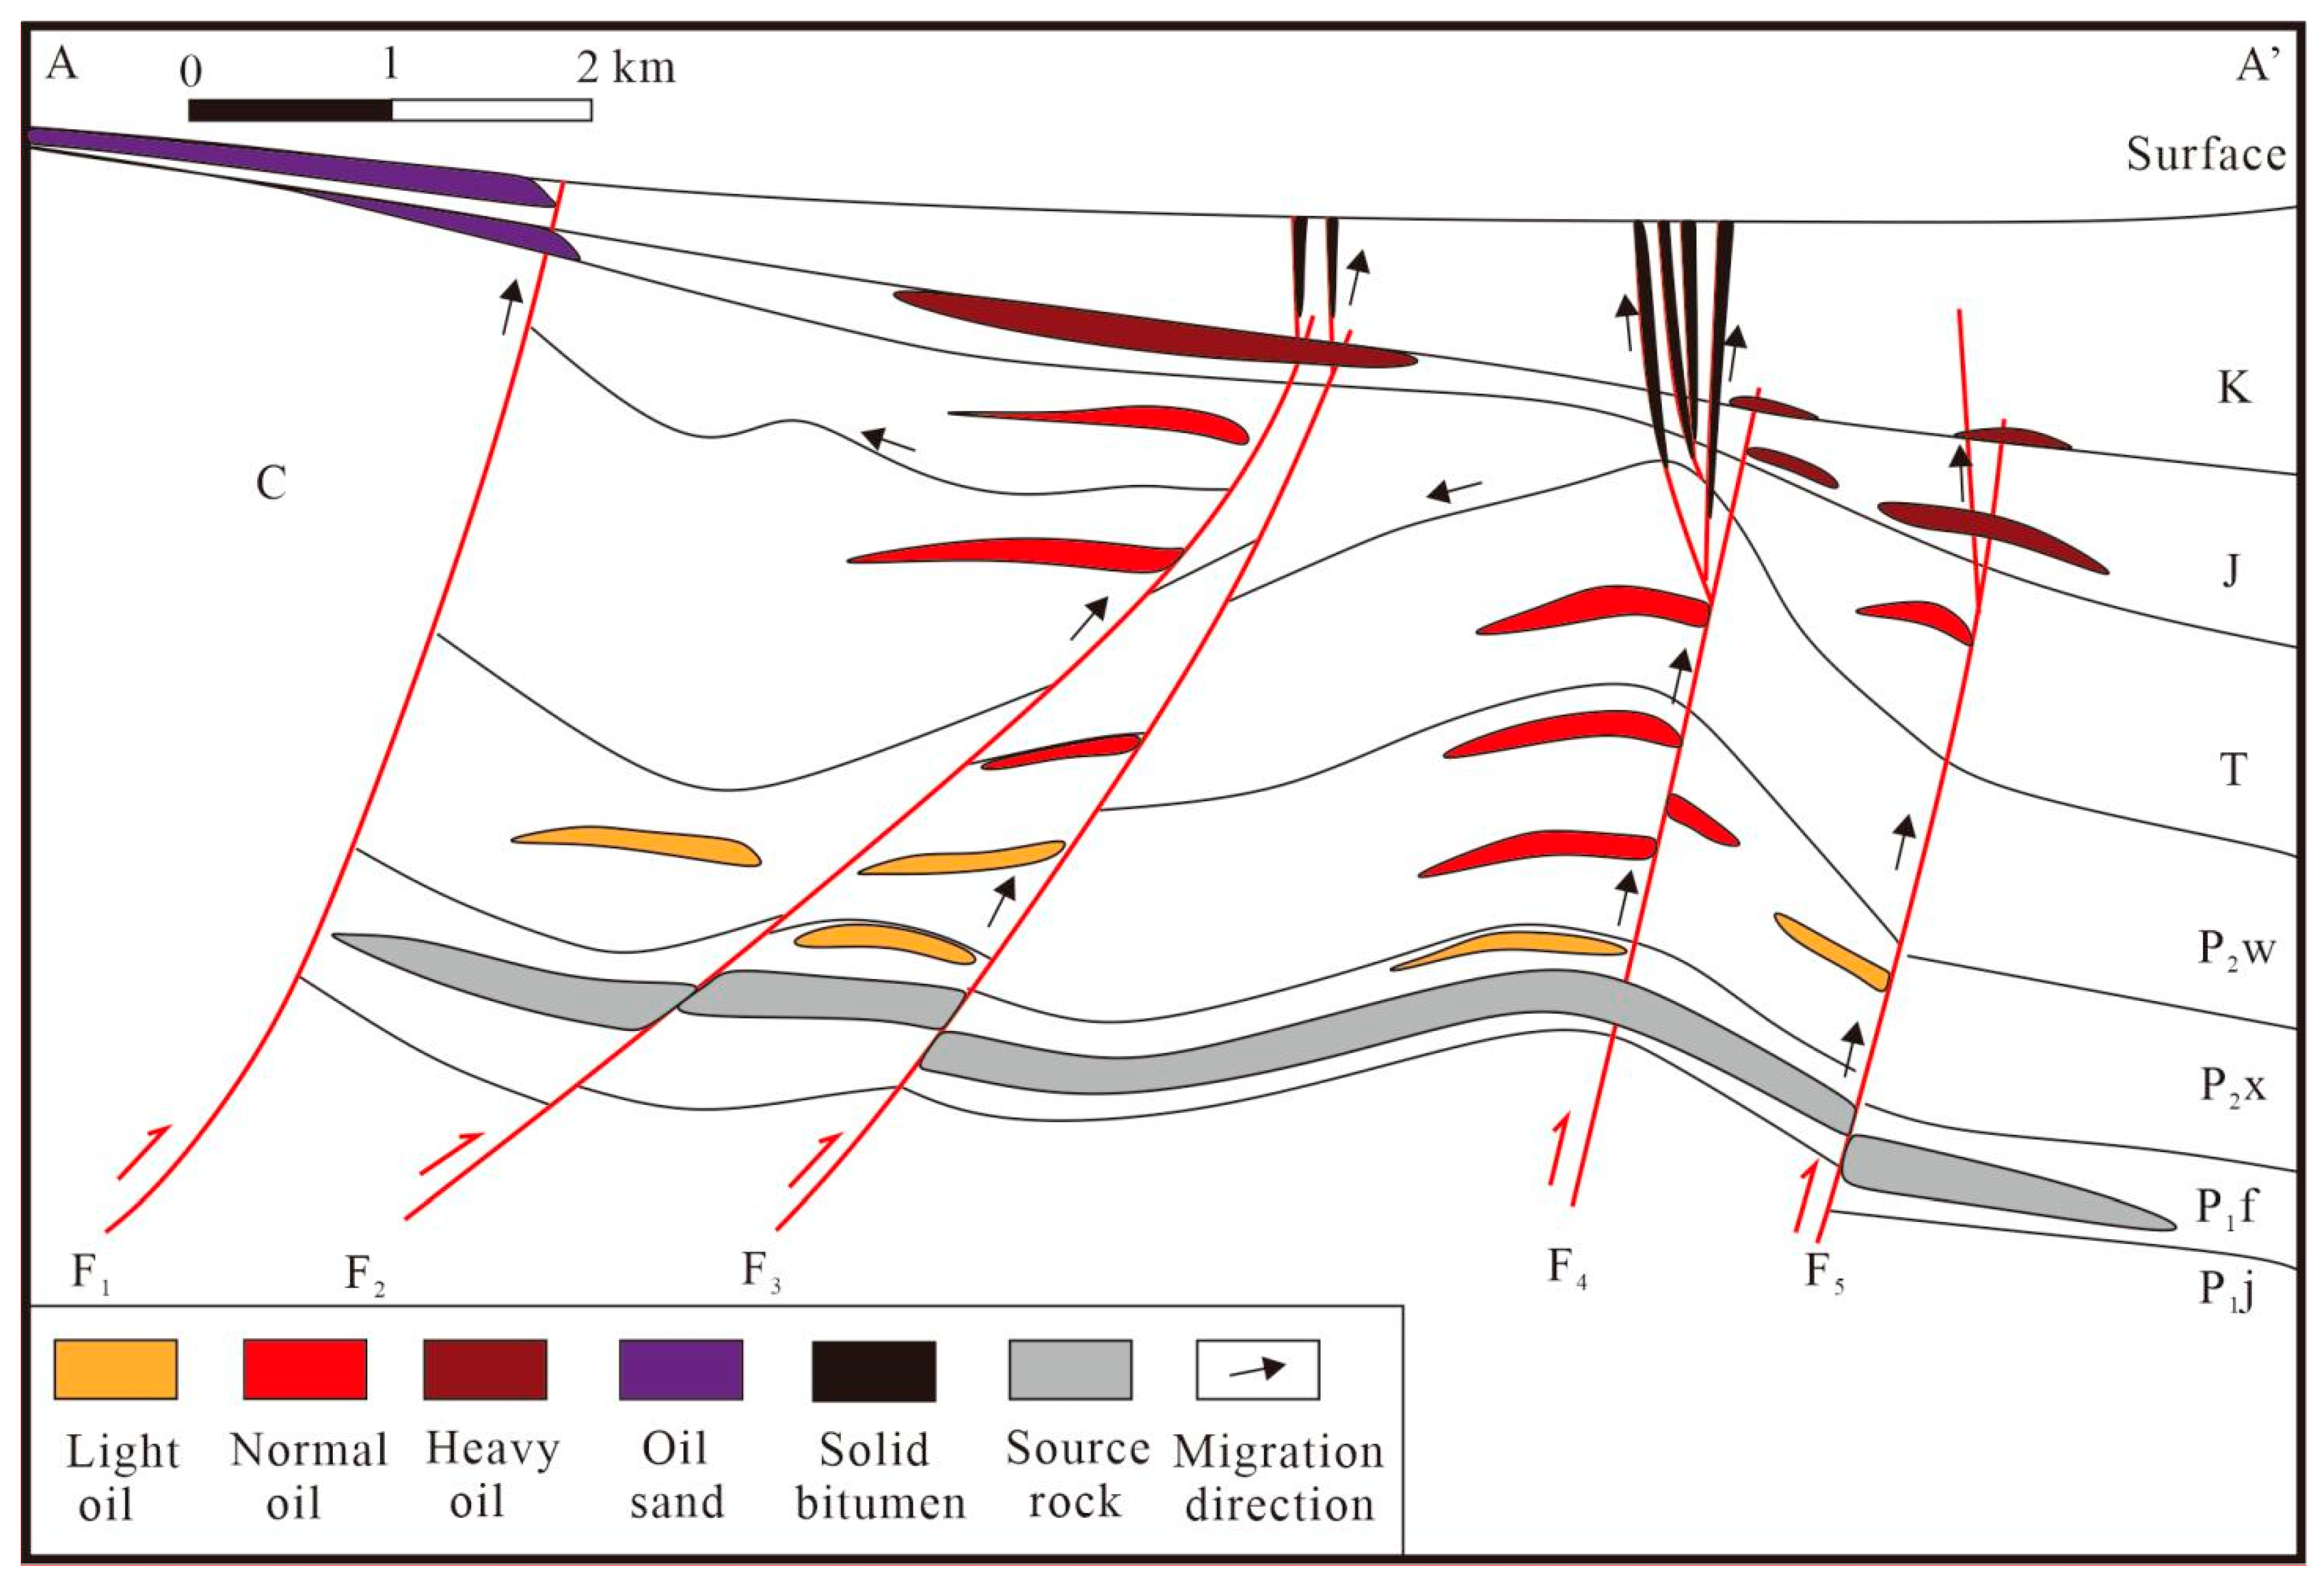
4.5. Reservoir Formation Model
5. Conclusions
Author Contributions
Funding
Conflicts of Interest
References
- Tang, Y.; He, W.; Bai, Y.; Zhang, X.; Zhao, J.; Yang, S.; Wu, H.; Zou, Y.; Wu, W. Source Rock Evaluation and Hydrocarbon Generation Model of a Permian Alkaline Lakes—A Case Study of the Fengcheng Formation in the Mahu Sag, Junggar Basin. Minerals 2021, 11, 644. [Google Scholar] [CrossRef]
- Feng, C.; He, W.J.; Cai, H.; Zhang, J.Y.; Nie, Y.L. Organic geochemical characteristics and comparison of the source rocks and the severely biodegradable oil sands around Karamay, China. Energy Explor. Exploit. 2021, 39, 108–133. [Google Scholar] [CrossRef]
- Qin, Z.J.; Zhi, D.M.; Xi, K.L. Organic petrology, geochemistry, and hydrocarbon generation capacity of Permo–Carboniferous source rocks in the Mahu Sag, northwestern Junggar Basin, China. Energy Explor. Exploit. 2022, 40, 57–78. [Google Scholar] [CrossRef]
- Adelu, A.O.; Aderemi, A.A.; Akanji, A.O.; Sanuade, O.A.; Kaka, S.L.I.; Afolabi, O.; Olugbemiga, S.; Oke, R. Application of 3D staticmodeling for optimal reservoir characterization. J. Afr. Earth Sci. 2019, 152, 184–196. [Google Scholar] [CrossRef]
- Qadri, S.M.T.; Islam, M.A.; Shalaby, M.R.; Ali, S.H. Integration of 1D and 3D modeling schemes to establish the Farewell Formation as a self-sourced reservoir in Kupe Field, Taranaki Basin, New Zealand. Front. Earth Sci. 2021, 15, 631–648. [Google Scholar] [CrossRef]
- Qadri, S.M.T.; Islam, M.A.; Shalaby, M.R.; Aal, A.A.E. Reservoir quality evaluation of the Farewell sandstone by integrating sedimentological and well log analysis in the Kupe South Field, Taranaki Basin-New Zealand. J. Pet. Explor. Prod. Technol. 2020, 11, 11–31. [Google Scholar] [CrossRef]
- Xia, L.W.; Cao, J.; Stüeken Eva, E.; Zhi, D.M.; Wang, T.T.; Li, W.W. Unsynchronized evolution of salinity and pH of a Permian alkaline lake influenced by hydrothermal fluids: A multi-proxy geochemical study. Chem. Geol. 2020, 541, 119581. [Google Scholar] [CrossRef]
- Wang, J.; Zhou, L.; Liu, J.; Li, E.T.; Xian, B.Z. Genesis of diagenetic zeolites and their impact on reservoir formation in the Middle Permian Lower-Wuerhe Formation of the Mahu Sag, Junggar Basin, Northwest China. Energy Explor. Exploit. 2020, 38, 2541–2557. [Google Scholar] [CrossRef]
- Tao, H.F.; Qu, Y.Q.; Wu, T.; Liu, B.B. Oilfield water and favorable petroleum exploration targets for the triassic baikouquan formation in the slope of mahu depression, junggar basin. Geofluids 2021, 2021, 6699489. [Google Scholar] [CrossRef]
- Kuang, L.C.; Tang, Y.; Lei, D.W.; Chang, Q.S.; Ouyang, M.; Hou, L.H.; Liu, D.G. Formation conditions and exploration potential of tight oil in the permian saline lacustrine dolomitic rock, junggar basin, nw china. Pet. Explor. Dev. 2012, 39, 700–711. [Google Scholar] [CrossRef]
- Wang, A.G.; Yi, L.P.; Xiang, B.L.; Li, J.; Fan, C.Y.; Li, C.Y.; Zhou, N.; Wang, Y. Origin of deep heavy oils in the northwestern Junggar Basin (NW China) and implications for gas migration. Energy Explor. Exploit. 2020, 38, 819–840. [Google Scholar] [CrossRef] [Green Version]
- Wang, B.Y.; Liu, B.; Sun, G.X.; Bai, L.H.; Chi, Y.A.; Liu, Q.; Liu, M. Evaluation of the Shale Oil Reservoir and the Oil Enrichment Model for the First Member of the Lucaogou Formation, Western Jimusaer Depression, Junggar Basin, NW China. ACS Omega 2021, 6, 12081–12098. [Google Scholar] [CrossRef] [PubMed]
- Zhao, Z.Y.; Hou, L.H.; Luo, X.; Sun, F.F.; Lin, S.H.; Zhang, L.J. Total Scanning Fluorescence Characteristics and Implications of Shale Oil in the Lucaogou Formation, Jimsar Sag, Junggar Basin, NW China. Front. Earth Sci. 2021, 9, 291. [Google Scholar] [CrossRef]
- Li, S.; Hu, S.; Cao, J.; Wu, M.; Zhang, D. Diamondoid Characterization in Condensate by Comprehensive Two-Dimensional Gas Chromatography with Time-of-Flight Mass Spectrometry: The Junggar Basin of Northwest China. Int. J. Mol. Sci. 2012, 13, 11399–11410. [Google Scholar] [CrossRef] [PubMed]
- Killops, S.; Killops, V. Introduction to Organic Geochemistry, 2nd edn (paperback). Geofluids 2005, 5, 236–237. [Google Scholar] [CrossRef]
- Wang, Y.C.; Cao, J.; Tao, K.Y.; Gao, X.W.; Shi, C.H. Multivariate Statistical Analysis Reveals the Heterogeneity of Lacustrine Tight Oil Accumulation in the Middle Permian Jimusar Sag, Junggar Basin, NW China. Geofluids 2020, 2020, 1860219. [Google Scholar] [CrossRef] [Green Version]


| Name | Block | Horizon | Middle Buried Depth (m) | Reservoir Lithology | Reservoir Type | Crude Oil Density (t/m3) | Gas Oil Ratio (m3/m3) | Geological Reserves (104 t) |
|---|---|---|---|---|---|---|---|---|
| Wuerhe Oilfield | Feng 3, Feng 5., Feng 1 well blocks | P1f | 4100 | Dolomitic siltstone | Structure. structure-lithology | 0.898 | 116 | 4682 |
| Fengnan 5 well block | P1f | 4600 | Dolomitic siltstone | Lithology, slnicture | 0.904 | 75 | 3346 | |
| Wu 35, Fengnan 2 well blocks | P2x | 2880 | Glutenite | Fault nose, structure-lithology | 0.863 | 27 | 5608 | |
| Wu 27 well block | P2w | 2325 | Glutenite | Structure, lithology | 0.871 | 80 | 912 | |
| Wu 33. Wu 36, Wu 5 well blocks | T1b, T2k | 1500 | Glutenite | Structure, lithology | 0.863 | 30 | 7665 | |
| Wu 16 well block | T2k | 1370 | Glutenite | Structure-lithology | 0.877 | 9 | 723 | |
| Fengcheng Oilfield | Zhong 18. Zhong 32, Zhong 5. Zhong 37, Zhong 59. Zhong 010 well blocks | J1b, J3q | 300 | Sandstone | Structure-lithology | 0.958 | 0 | 37,200 |
| Oil sand deposits | Fengcheng oil sand ore | J3q | 100 | Sandstone | - | 0.982 | - | 5017 |
| Bitumen mine | Wuerhe bitumen mine | K1tg | 0–100 | Exist in fault fractures | - | - | - | 12–15 |
| Number | Horizon | Density (g/cm3) | Viscosity (Pa.s·20 °C) |
|---|---|---|---|
| 1 | P2w | 0.8513 | 18.77 |
| 2 | P2w | 0.8809 | 63.10 |
| 3 | P3w | 0.8517 | 19.69 |
| 4 | P3w | 0.8542 | 20.17 |
| 5 | T1b | 0.8400 | 9.74 |
| 6 | T1b | 0.8654 | 28.25 |
| 7 | J3q | 0.9270 | 2779.70 |
| 8 | J3q | 0.9556 | 4847.00 |
| 9 | J3q | 0.9564 | 4712.00 |
| 10 | K1tg | 1.1300 | - |
| 11 | K1tg | 1.1190 | - |
| Type | Permian Source Rocks | Light Oil | Normal Oil | Heavy Oil | Bitumen | ||||
|---|---|---|---|---|---|---|---|---|---|
| NO. | 1 | 2 | 3 | 4 | 5 | 6 | 7 | 8 | 9 |
| A | 0.45 | 0.36 | 0.65 | 0.75 | 0.73 | 0.68 | 0.66 | 0.66 | 0.96 |
| B | 1.13 | 1.05 | 1.05 | 1.03 | 1.09 | 1.09 | 1.05 | 1.01 | 1.01 |
| C | 0.24 | 0.28 | 0.18 | 0.38 | 0.35 | 0.31 | 0.29 | 0.20 | 0.16 |
| D | 1.11 | 0.66 | 0.74 | 0.39 | 0.29 | 0.36 | 0.39 | 0.39 | 0.41 |
| E | 0.59 | 0.54 | 0.56 | 0.53 | 0.52 | 0.53 | 0.54 | 0.49 | 0.59 |
Publisher’s Note: MDPI stays neutral with regard to jurisdictional claims in published maps and institutional affiliations. |
© 2022 by the authors. Licensee MDPI, Basel, Switzerland. This article is an open access article distributed under the terms and conditions of the Creative Commons Attribution (CC BY) license (https://creativecommons.org/licenses/by/4.0/).
Share and Cite
Zou, X.; Fan, X.; Chen, G.; Xu, T.; Ma, C. Geochemical Analysis of a Multi-Layer Hydrocarbon Reservoir in the Wuerhe Area, Junggar Basin. Appl. Sci. 2022, 12, 3871. https://doi.org/10.3390/app12083871
Zou X, Fan X, Chen G, Xu T, Ma C. Geochemical Analysis of a Multi-Layer Hydrocarbon Reservoir in the Wuerhe Area, Junggar Basin. Applied Sciences. 2022; 12(8):3871. https://doi.org/10.3390/app12083871
Chicago/Turabian StyleZou, Xianli, Xing Fan, Gangqiang Chen, Tao Xu, and Chunmiao Ma. 2022. "Geochemical Analysis of a Multi-Layer Hydrocarbon Reservoir in the Wuerhe Area, Junggar Basin" Applied Sciences 12, no. 8: 3871. https://doi.org/10.3390/app12083871