Article

Concept for Generating Energy Demand in Electric Vehicles with a Model Based Approach

1
Institute of Energy Efficient Mobility, University of Applied Sciences Karlsruhe, 76133 Karlsruhe, Germany
2
FEMTO-ST Institute, University Bourgogne Franche-Comté, CNRS, 90000 Belfort, France
*
Author to whom correspondence should be addressed.
Appl. Sci. 2022, 12(8), 3968; https://doi.org/10.3390/app12083968
Submission received: 25 January 2022 / Revised: 2 April 2022 / Accepted: 5 April 2022 / Published: 14 April 2022
(This article belongs to the Special Issue Energy Management of Hybrid Electric Vehicles 2021)

Abstract

:
Hybrid energy storage systems (HESS) for electric vehicles, which consist of lithium-ion batteries and supercapacitors, have become an increasing focus of research and development in recent years. The combination of the two combines the advantages of each storage technology (high energy density in batteries and high power density in supercapacitors) in one system. To effectively manage the energy flow between these two different storage technologies, an intelligent energy management system (EMS) is required. In the development of the EMS, it is usual to run preliminary checks in a simulation environment that is as close to reality as feasible already during the development process. For this purpose, this paper presents a concept for the creation of a simulation environment consisting of realistic routes and a holistic vehicle model. The realistic route data are generated by a route-generating algorithm, which accesses different map services via application programming interfaces (API) and retrieves real route data to generate a simulated route. By integrating further online services (e.g., OpenWeather API), the routes are further specified with, for example, real weather data, traffic data, speed limits and altitude data. For the complete vehicle model, components including the suspension, chassis and auxiliary consumers are simulated as blackbox models. The components that can be accessed during the simulation are simulated as white box models. These are the battery, the supercapacitor, the DC/DC converter and the electric motor. This allows the EMS to control and regulate the HESS in real time during the simulation. To validate the simulation environment presented here, a real BMW i3 was driven on a real route, and its energy demand was measured. The same route was simulated in the simulation environment with environmental conditions that were as realistic as feasible (traffic volume, traffic facilities, weather) and the vehicle model of the BMW i3. The resulting energy demand from the simulation was recorded. The results show that the simulated energy consumption value differs by only 1.92% from the real measured value. This demonstrates the accuracy of the simulation environment presented here.

1. Introduction

The entire transport system is in the midst of a transformation. In December 2020, the European Commission presented a new strategy (The European Green Deal) for sustainable and intelligent mobility. The goal is to reduce transport emissions by 90% by the year 2050 through smart and competitive technologies [1]. In order to accomplish this goal, automotive manufacturers must increasingly focus on powertrain technologies that are more environmentally friendly and cost-efficient. As a result, the topic of electric vehicles has become increasingly important in recent years [2]. The development of electric vehicles is nowadays strongly driven by customer demand with regard to environmental factors and economic aspects [3]. At the same time, one of the key issues in the development of electric vehicles is the energy storage system [4]. The comparatively high cost and limited lifetime of batteries limit the development of electric vehicles in certain areas [5]. In recent years, research has been conducted on a variety of types of batteries with the objective to improve their efficiency and performance [4]. In addition, supercapacitors have been used in the context of hybrid energy storage systems to take advantage of the new opportunities they offer [4]. To operate such a hybrid energy storage system, it needs an intelligent and optimized management system. The potential risk of a non-optimized management system is that it could significantly shorten the battery life due to unfavorable loads and inefficient use of the energy [6]. Furthermore, a non-optimized management system can shorten the lithium-ion battery’s life due to over-voltage, over-temperature and rapid discharge and charge of the lithium-ion battery cell [7].
For the development and especially for the model-based validation of an energy management system, knowledge about the vehicle and the route resulting in the energy consumption of the vehicle is needed [8]. Many studies work with synthetic, standardized driving cycles (e.g., New European Driving Cycle (NEDC), Worldwide Harmonised Light-Duty Vehicles Test Procedure (WLTP)) and the energy consumption data collected there [9,10,11,12,13,14]. Due to the simplified representation of the influences on energy consumption that occur in reality (traffic, gradient, weather, etc.), these data show a partly, not insignificant, difference to real measured energy consumption data [15,16].
The concept presented in this paper is to generate realistic routes and realistic driving simulations and to calculate the corresponding energy consumption. A tool is developed for this work which obtains data from APIs that are then used to generate realistic routes. Due to the access to global GPS data, any route can be simulated. Furthermore, by including additional APIs, various data can be collected that have an influence on energy consumption. These include weather data, real-time traffic data, slopes, etc. The second part of the concept focuses on the simulation of energy consumption. For this purpose, the created route data is transferred to a simulation environment. The modular structure of the simulation allows, for example, various vehicles to be simulated on different routes with different driver models. From the route data and the vehicle simulation, the energy consumption can be calculated. The expected outcomes of the simulated energy consumption are (close to) realistic results. The simulation should be able to perform in different setups (same vehicle on different routes) and maintain its accuracy to simulate the respective energy consumption.
The objective of this work is to generate realistic energy flows of electric vehicles with a hybrid energy storage system using a model-based approach. For this purpose, whitebox models of the vehicle components relevant for us (powertrain, battery, supercapacitor and DC/DC converter) are created and implemented in a simulation environment with further blackbox models to form a complete vehicle. The whitebox representation of the energy storage components and the powertrain allow the components to be controlled and regulated during the simulation. This is particularly relevant for the development and validation of an energy management system, which is not part of this paper but will be part of a follow-up project. The complete vehicle model will then be run in the simulation environment on realistic routes in order to generate energy flows in the vehicle that are as close to reality as possible.

2. State of the Art

Currently, several approaches to model a holistic vehicle for energy flow simulation exist. In [2], the models used to determine energy consumption are divided into three categories. These include a physical model, which is derived from physical relationships and described by using analytical equations, an energy model and a state of charge (SoC) model. The physical model in this work is based on Newton’s laws and uses various variables of the vehicle as input (e.g., vehicle mass, frontal area, rolling resistance, etc.). The energy model and the state of charge model, on the other hand, take the energy and SoC values at the start and destination points, respectively, and the distance traveled as computational variables. To calculate the energy consumption, on the one hand a trip with constant speed is simulated, and on the other hand, a driving cycle with start/stop scenarios is used. For the simulation, it is assumed that the route geometry as well as the speed profile must be completely known in advance.
A similar approach is described in [9]. In this work, Newton’s laws are also chosen as the basis of the physical model. Furthermore, three different driver models are presented here which are respectively designed with a P, PI and a PID controller. At each simulation step, the driver model now compares the vehicle speed with the speed profile of the driving cycle and gives an acceleration or braking signal based on the difference. The NEDC and WLTP driving cycles are used here for the simulation. Similar to [2], this work also assumes that the speed profile is fully known. Since energy consumption models with hybrid energy storage systems are part of the current state of research, they were also considered in the following. In [17,18], the physical model is divided into different submodels. For the energy storage devices, both a supercapacitor model and a battery model are created. These are implemented based on equivalent circuit. As in [2], no driver model is used, but standard cycles like the Artemis Urban (AU) cycle, the New York City Cycle (NYCC) and New York Composite Cycle (NY Comp) are used for the speed profile.
The approach of [19], like [2,9], also uses Newton’s laws as the basis for the physical model. For the simplified modeling of the HESS, it is assumed that the battery, the supercapacitor and the electric power have constant energy transmission/conversion. In contrast to the presented approaches, the data set of a real test drive is used as a speed profile. These data are much more realistic than the previously used standard cycles but have the quantitative disadvantage that only one simulation can be made because only one data set is available.
The approaches presented mostly use simplified vehicle models without the possibility of being able to fully control or regulate the energy storage system during the simulation. In addition, the standard cycles used for most projects mean that a previously defined speed profile is used for the simulation and that these only reproduce reality to a limited extent [15].

3. Route Data

In contrast to the approaches presented so far, this work only uses synthetic standard driving cycles (WLTP, NEFC, etc.) for the validation of the model accuracy. For the simulation of the energy flows, realistic routes are used. This method provides a more accurate representation of real driving situations due to their higher level of parameter detail [15]. To generate such routes, not only is the pure route data in the form of longitude and latitude information needed, but additional information is also needed. In the work of [20] the major influencing factors on energy consumption were identified, and from this, the requirements for the necessary additional data for the route are derived. In this work, current traffic data, weather data, topographical data and speed limits are used in addition to the actual route data.
As a basis for the generation of route data, a route-generating algorithm [21] is used. This takes as input parameters the start and destination coordinates, possibly individual waypoints between the start and destination, and the date of the simulation. Using these input parameters, the route geometry, speed limits, traffic and weather data are generated and combined into a route.
To obtain the data for the route-generating algorithm, various APIs are utilized. The APIs serve as information sources and return the input data for the route-generating algorithm [21]. The APIs are divided into three categories: data for the visual display of the route (map display), data for the compilation of the route (route data) and additional data like slope, weather or traffic data of the route (additional data). The route-generating algorithm collects this data and, in combination with the user’s input data (start and destination of the route, display type and weather/traffic influence), generates the computed route. The schematic of input and output data for the route-generating algorithm is shown in Figure 1. In addition, the route is displayed graphically in the developed RouteGenerator application. The generated data can then be transferred to external programs via an implemented interface. Table 1 shows an overview of available APIs that can be used with the route-generating algorithm.

4. Simulation and Model Environment

The structure of the simulation environment includes three components: The adaptive driver model, the virtual road model and the virtual vehicle model. For the simulation of the energy consumption, a simulation environment is created with the usage of the simulation framework CarMaker from the company IPG Automotive GmbH.

4.1. Vehicle Model

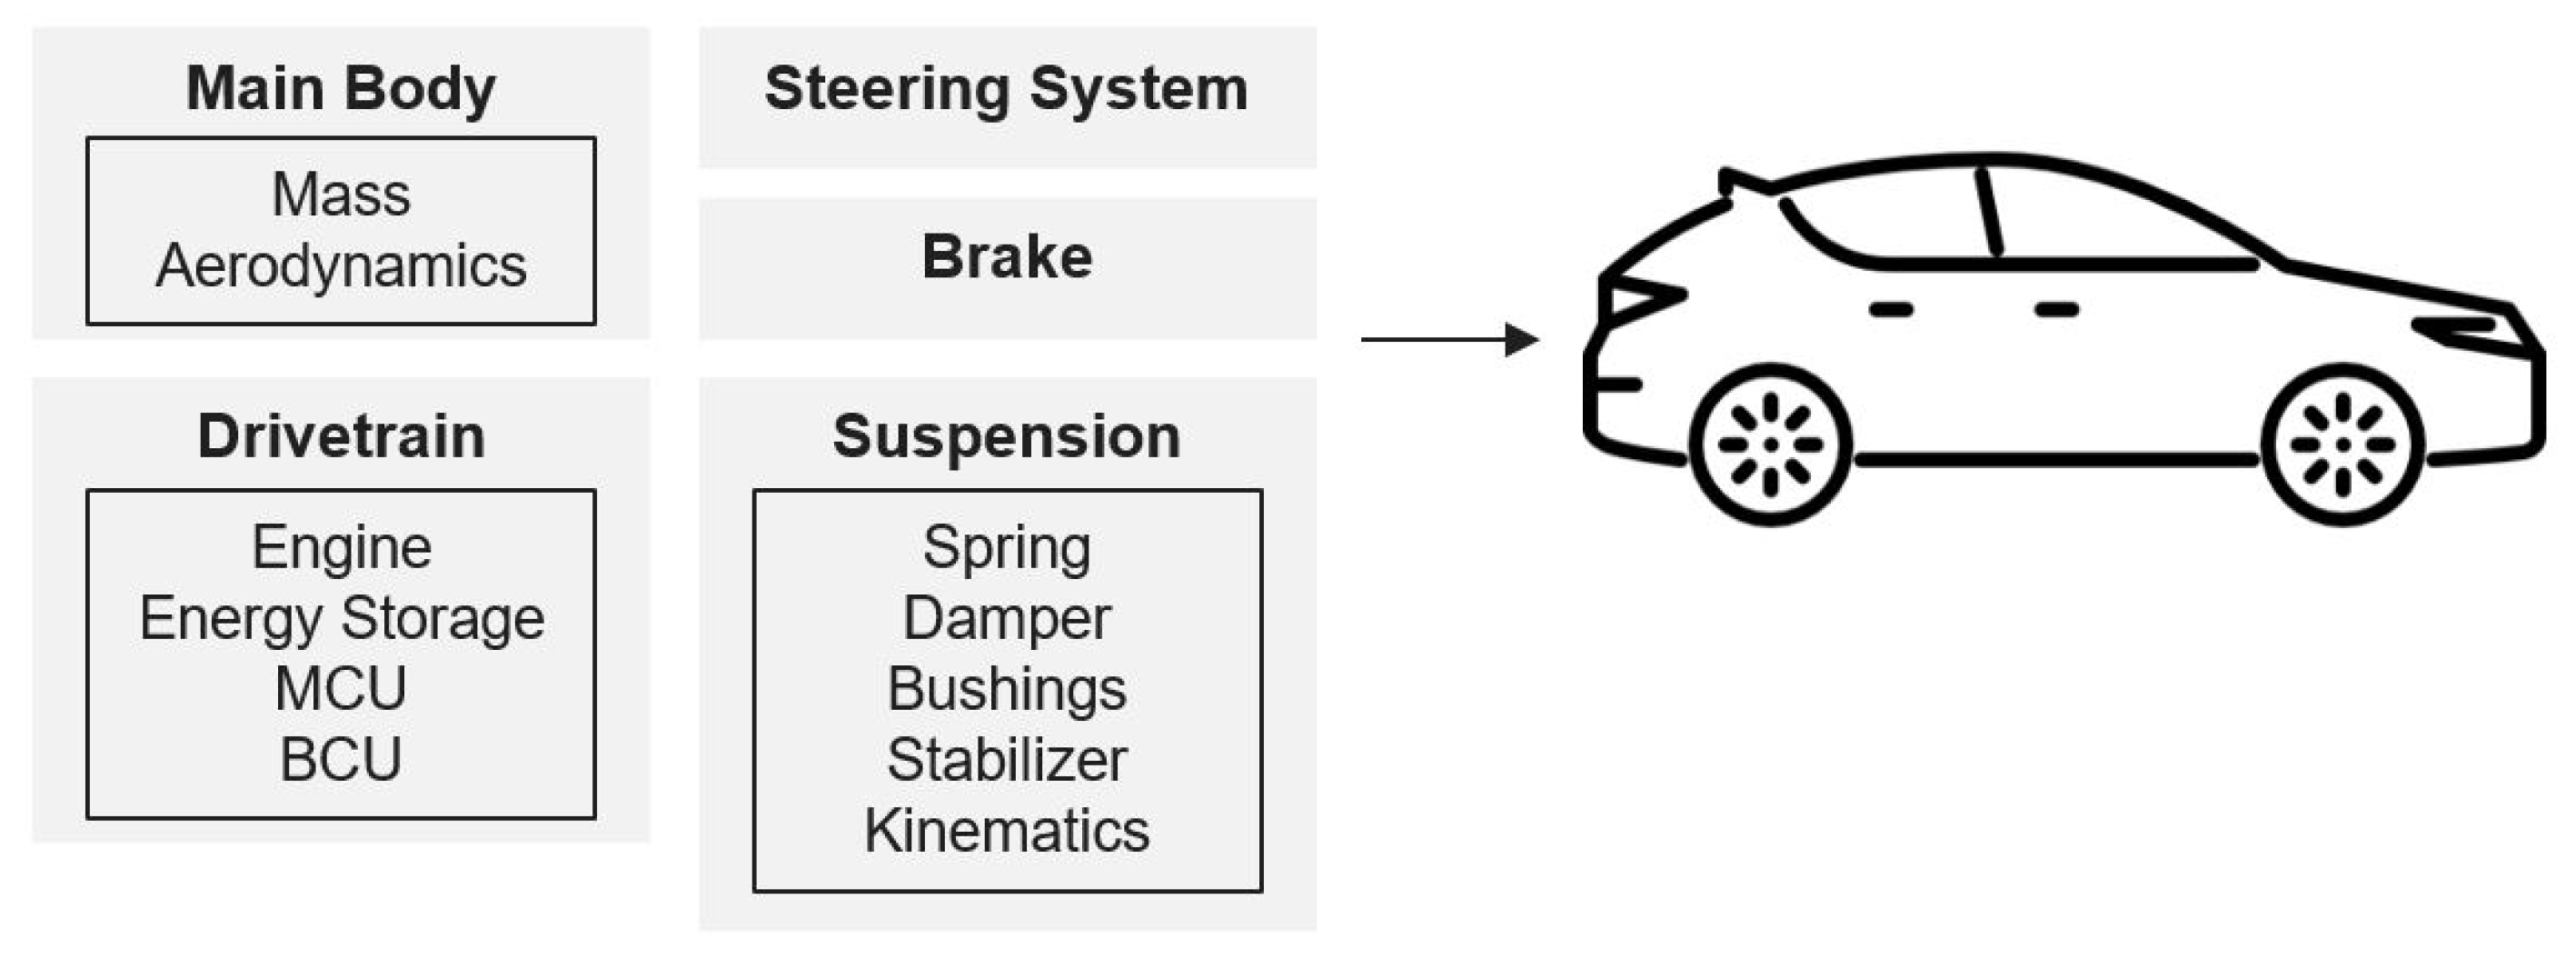
The virtual vehicle model is a computer-generated, mathematical representation of a real vehicle. It combines various subsystems that represent the simulated vehicle. These include:
-
The main body, with information about the total mass and the aerodynamic behavior of the vehicle;
-
The steering system, which contains information about the ratio between the steering wheel angle (or steering wheel torque) and the steering rack displacement;
-
The suspension, with the components including the springs, dampers, bushings, and stabilizers and the kinematics of the chassis;
-
The drivetrain, which contains information about the engine, energy storage, motor control unit (MCU) and the battery control unit (BCU);
-
The brakes, with information about the possible deceleration of the vehicle.
The structure of the subsystems of the virtual vehicle model is shown schematically in Figure 2.
For the BMW i3 evaluated in this study, the following vehicle parameters in Table 2 are used. The selected reference vehicle (BMW i3) is only used to validate the functionality by using real-world measurement results. By altering the individual parameters of the components (main body, drivetrain, steering system, brakes and suspension), it is possible to represent any vehicle and use it for the simulation.

4.1.1. Battery Model

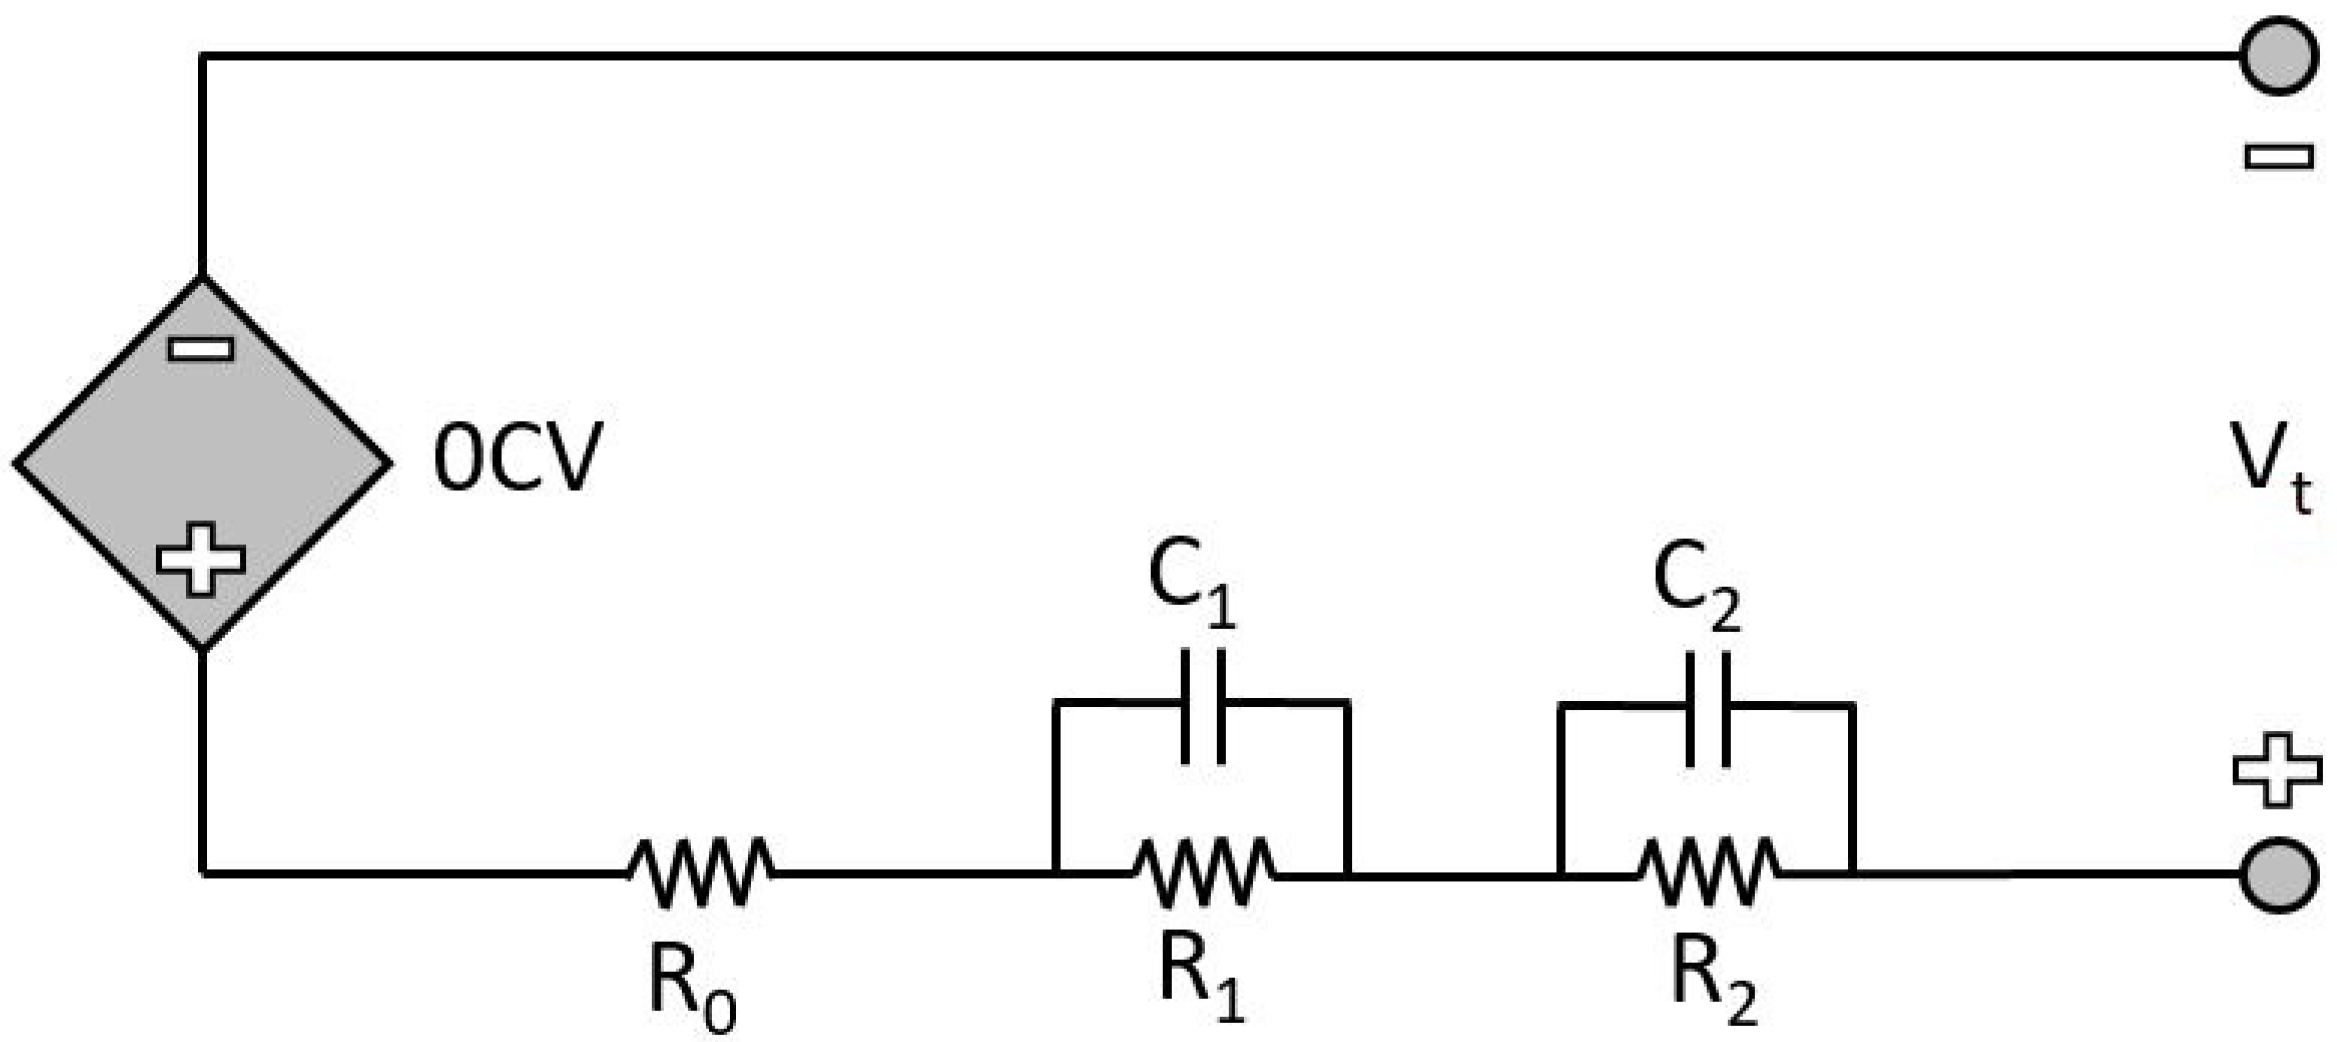
Since the energy storage model is the main objective for the simulation and measurement of energy consumption, the focus in this paper is placed on the energy storage model for clarity reasons. The description of the other subsystems are modeled according to [22,23]. To model the lithium-ion cell, an equivalent circuit—or Thevenin-based model—is used in Figure 3. The proposed model consists of a resistor R 0 , which represents the internal resistance of the lithium-ion cell, and two RC connections of R 1 , C 1 , R 2 and C 2 , which represent the transient voltage response V t of the cell. The model again considers the rate capacitance effect, where the usable capacity varies depending on the current supplied by the cell, as described in [24].The state of charge is calculated using the usable capacity values; therefore, the parameters of this model depend on the state of charge and current [25].
An accuracy analysis in [27] showed that the second RC circuit has the greatest influence on the accuracy and the smallest root-mean-square percentage error (RMSPE) and maximum percentage error (MPE), respectively. With each additional RC circuit, the battery model becomes more accurate, but the rate decreases progressively. Figure 4 shows this correlation.
According to Kirchhoff’s voltage law, Equation (1) can be derived from the equivalent circuit model described in Figure 3. This equation thus also forms the basis of the lithium-ion cell model introduced here.
V t = O C V V 1 V 2 V 0
The usable capacity of a lithium-ion cell can vary depending on the current value at which it is discharged or charged [25]. Equation (2), known as the Peukert equation, applies to determine the usable capacity [28].
Q 0 = ( I B T I B T , r a t e d ) 1 n Q 0 , r a t e d
Q 0 describes the usable capacity, I B T , in A, the current at which the cell discharges, Q 0 , r a t e d the nominal capacity of the cell, which is discharged with a current value I B T , r a t e d and n [h], the Peukert exponent, which for lithium-ion batteries have a value of 1.05 [28].
The method to determine the state of charge of the battery used in this project is the Coulomb counting method, which is described by Equation (3). This method allows the calculation of the current state of charge S o C of a lithium-ion cell as a function of the current value I B T , the usable capacity Q 0 , and the previous state of charge S o C i n i t of the cell.
S o C = S o C i n i t I B T Q 0 3600 d t
When the values of R 1 , R 2 , C 1 and C 2 have been determined for different current values and states of charge, the voltages in each of the electrical components are determined. Therefore, the RC parallel connection is analyzed by using the s-domain, according to [25,29]. Equation (4) is obtained by doing this.
To do this, we proceed according to [25,29], where, using the s-domain to analyze the RC parallel connection, Equation (4) is obtained.
Therefore, Equation (4) is obtained by analyzing the RC parallel connection using the s-domain.
I = V R + s C V V = ( 1 s ) I C V R C
Based on the information explained, a lithium-ion cell with a capacity of 60 Ah is modeled in MATLAB/Simulink. This cell type is used for the battery in the 2014 BMW i3 electric vehicle, which is utilized in this study. The parameters of the lithium-ion cells (Samsung SDI) used in the BMW i3 are shown in Table 3.

4.1.2. Supercapacitor Model

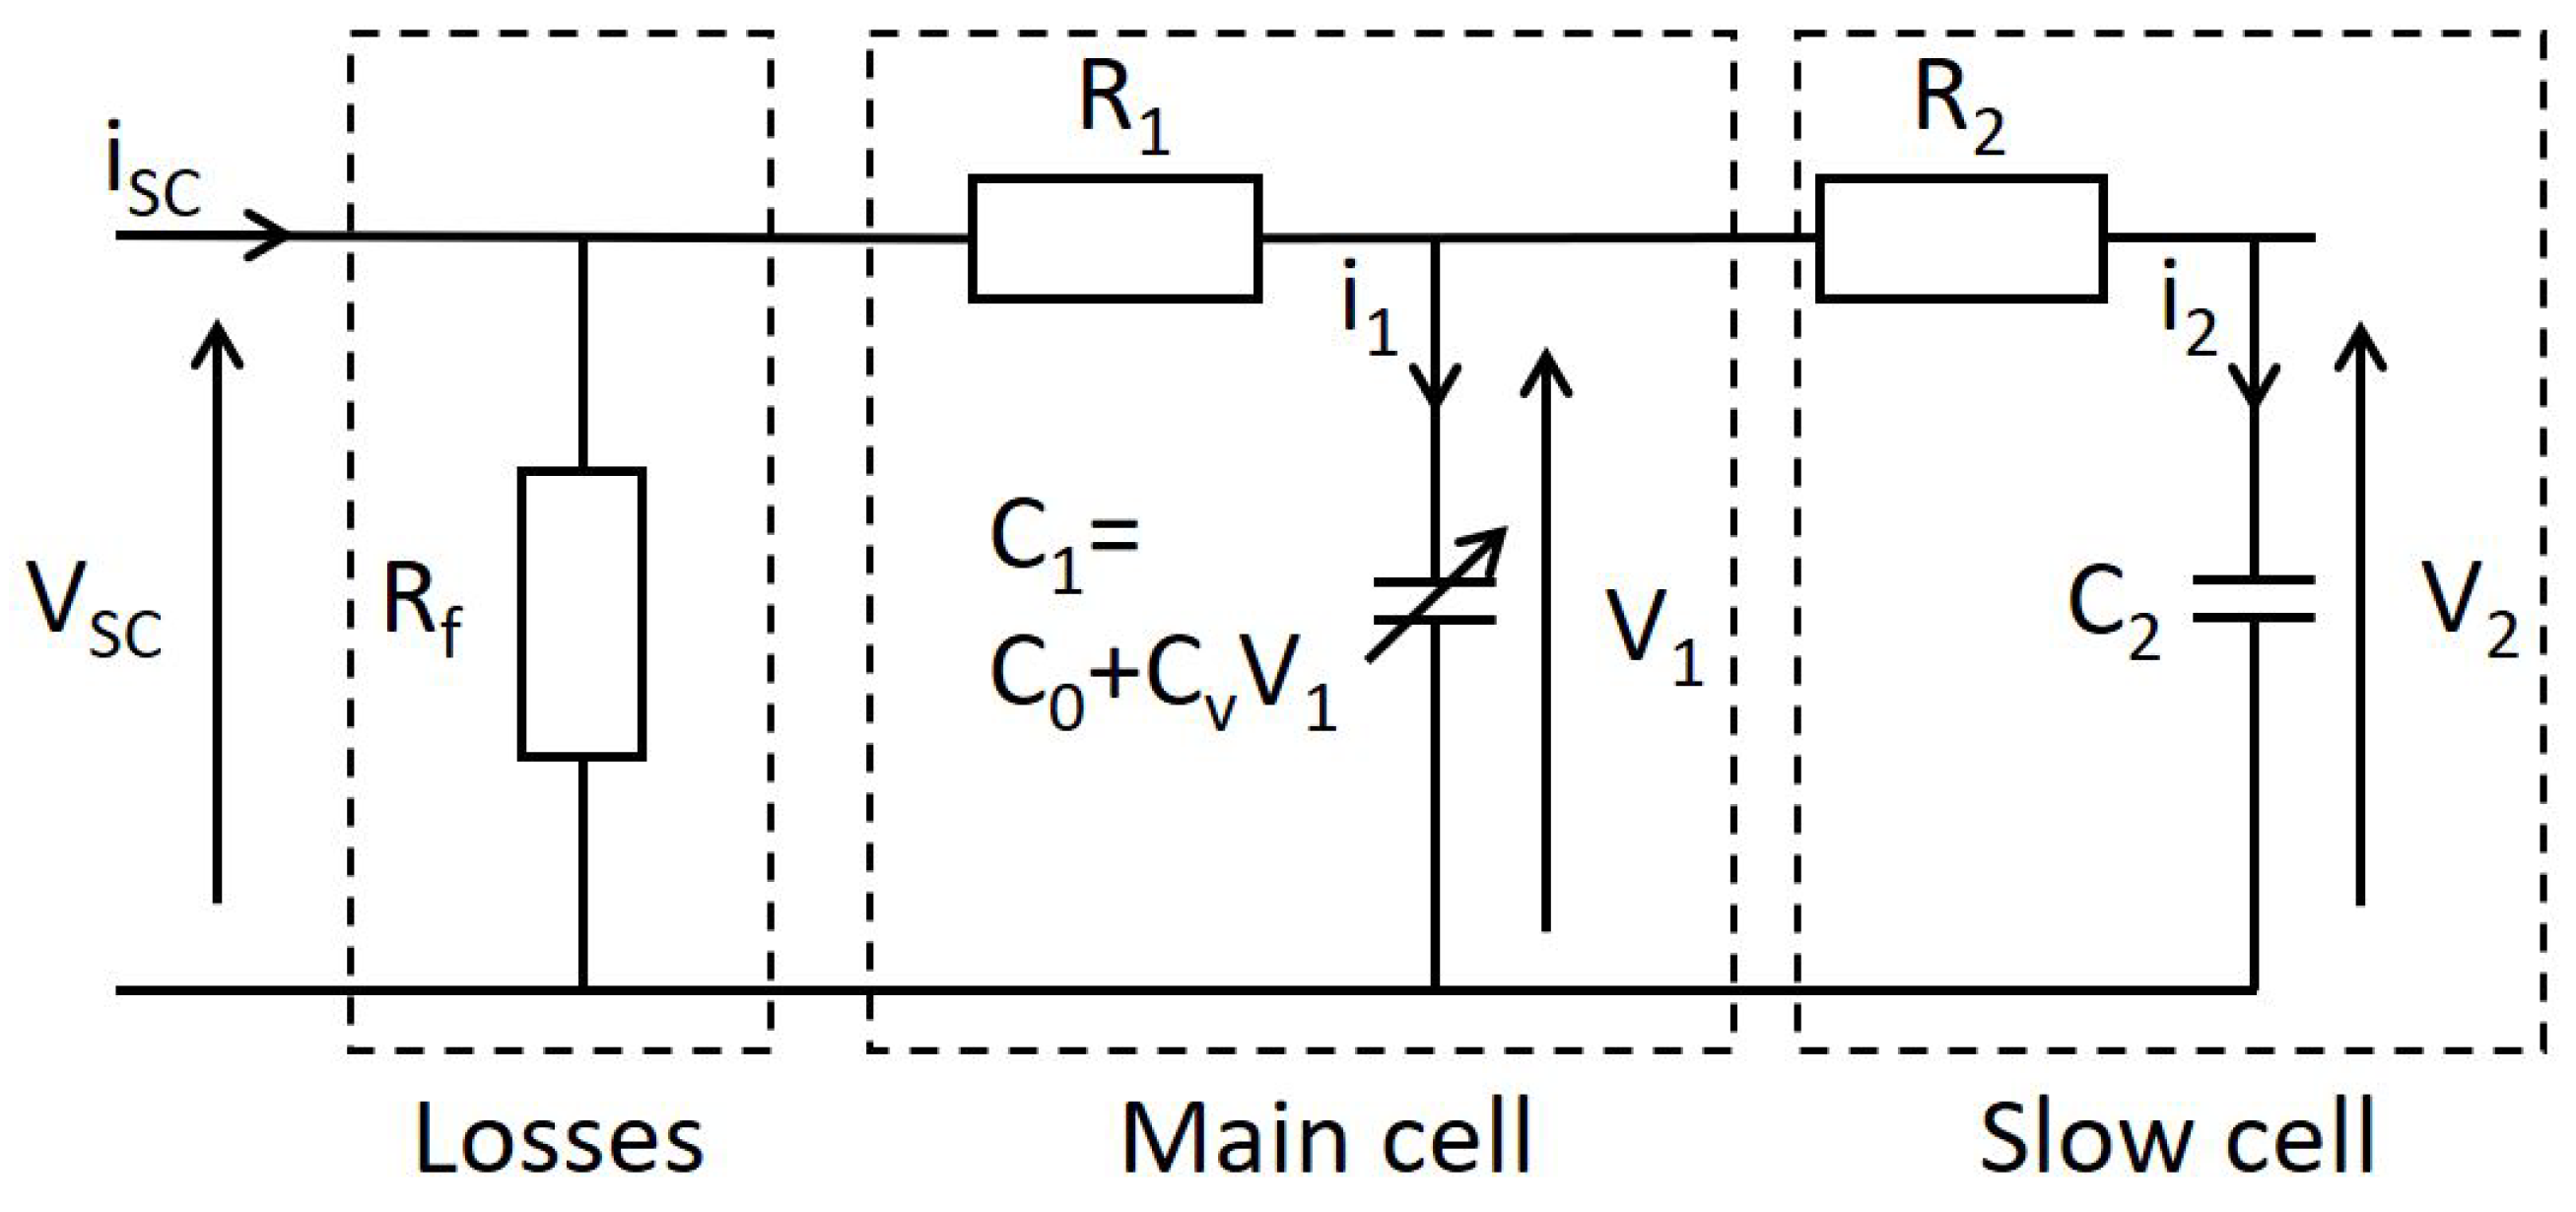
In order to describe the dynamic characteristics of a supercapacitor mathematically, the equivalent circuit shown in Figure 5 was used.
This model describes the dynamic behaviour of the supercapacitor during charge and discharge cycles, i.e., this model makes it possible to determine the voltage delivered by the supercapacitor as a function of the charge or discharge current.
The model shown in Figure 5 is a second-order RC model. The order of the model depends on the time step size in which the supercapacitor operates [31]. In [31], a comparison of different models of supercapacitors is presented and their precision is evaluated considering the load change frequency. In electric vehicles, the load (speed) changes every few seconds (which can be considered as low frequency), so it is sufficient to use a second-order RC model [32]. A simpler model, i.e., a model with only one RC circuit, is not suitable because the error of the supercapacitor output voltage is significant, as shown in [33].
The model consists of three parts. The first part includes the resistor R f , which represents the current losses inside the cell (losses) [30]. The part with the resistor R 1 and the capacitor C 1 (main cell) determines the instantaneous response (seconds) of the supercapacitor to a charge or discharge current [33]. And finally, the part with resistor R 2 and capacitor C 2 (slow cell) determines the slow response (minutes) of the supercapacitor to a charge or discharge current [33].
In order to implement the model shown in Figure 5, it is necessary to know the values of all components describing the circuit, i.e., resistors R f , R 1 , and R 2 and capacitors C 1 and C 2 . The values of all components were obtained from [30], where the Maxwell/BCAP3000 supercapacitor is simulated. Table 4 shows the characteristic values of the supercapacitor.
The following Equation (5) is used to calculate the voltage of the supercapacitor:
U S C = N S C ( V 1 + R 1 I S C N P S C )
The calculation of the voltage V 1 is from:
V 1 = C 0 + C 0 2 + 2 C v Q 1 C v
The calculation of the voltage V 2 is from:
V 2 = 1 C 2 1 R 2 ( V 1 V 2 ) d t
In addition, the voltage of the supercapacitor is calculated based on its state of charge using Equation (8):
S o C S C = U S C N o m i n a l V o l t a g e

4.1.3. Drivetrain Model

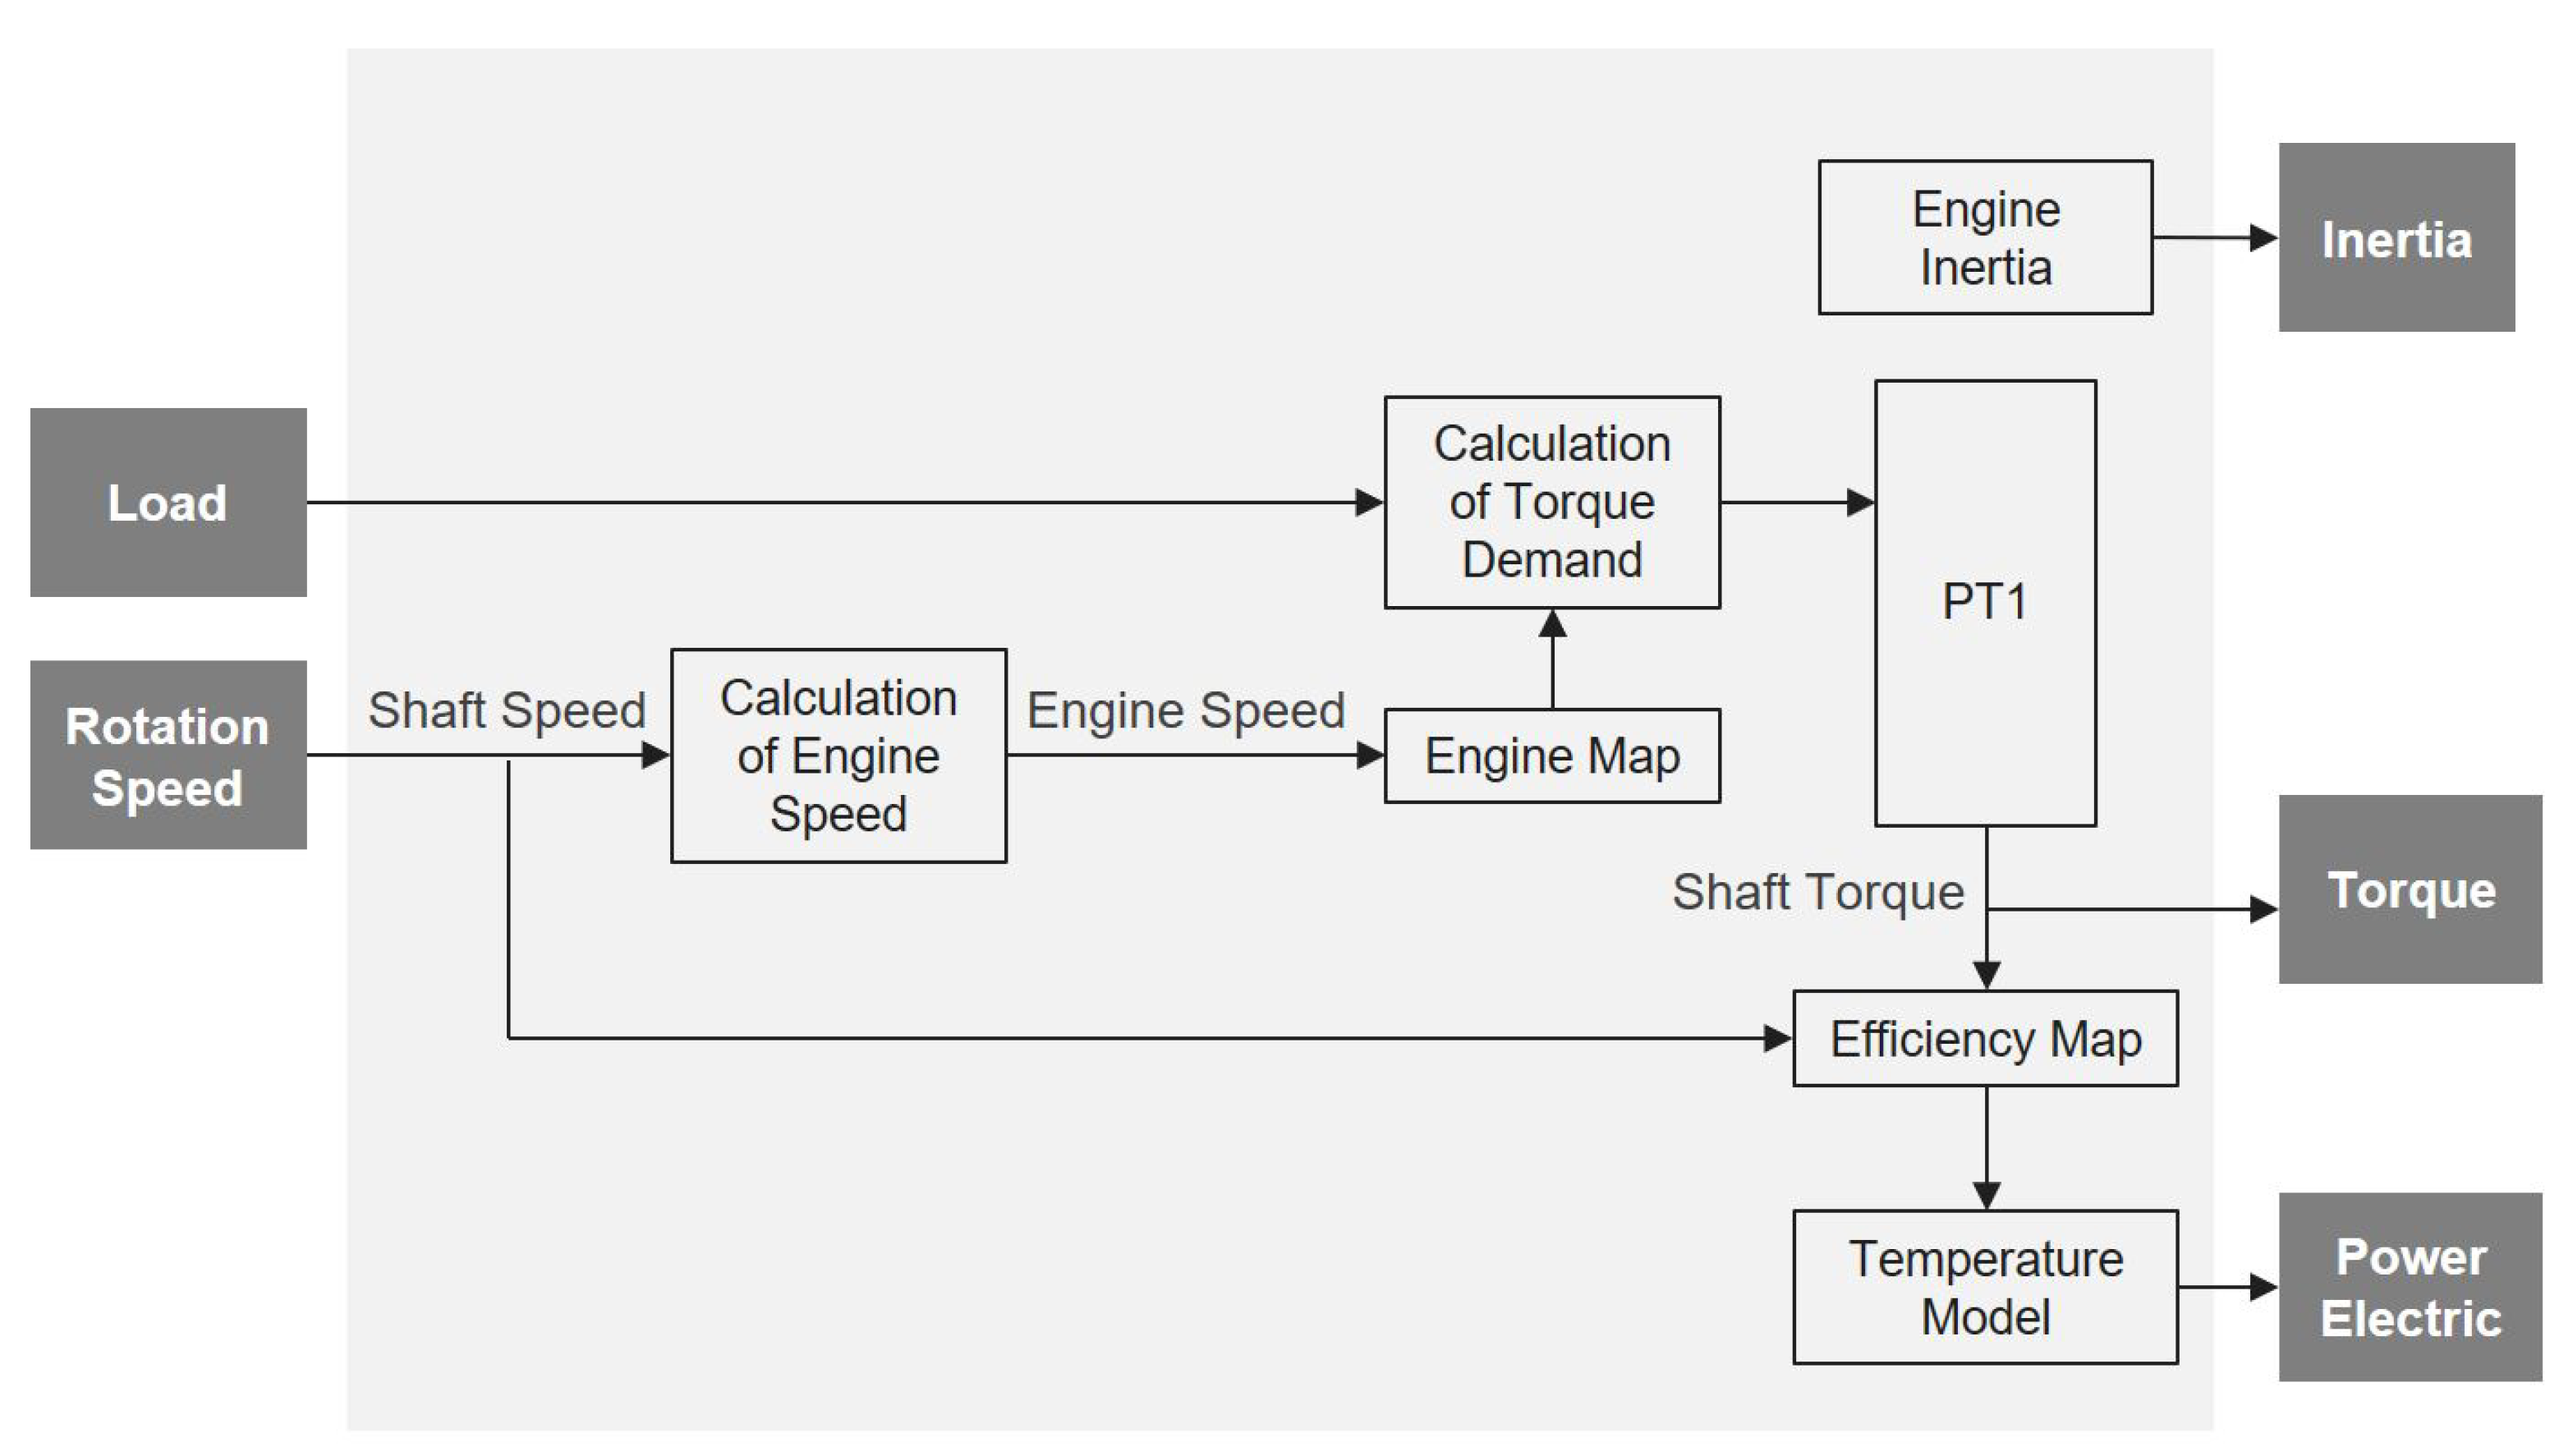
Generally, three types of drivetrain models are classified. These are dynamic models, stationary models, and quasi-stationary models [34]. Dynamic models rely on the mathematical equations of the motor and the inverter as well as their control and promise an exact representation of dynamic transients as well as a realistic calculation of the motor losses. Static models, on the other hand, work in a stationary mode without taking a time constant into account. The control of the motor is not represented in these models and is assumed to be ideal, so the motor torque corresponds directly to the required torque. For each operating point, the motor losses are taken from a static characteristic efficiency map. A compromise of these two modelling approaches is quasi-stationary models. These are essentially stationary models but can also represent the dynamics of the motor. The dynamic behaviour is usually approximated by using a simple P T 1 element [34]. The block diagram of the drivetrain model used in this study is shown in Figure 6.
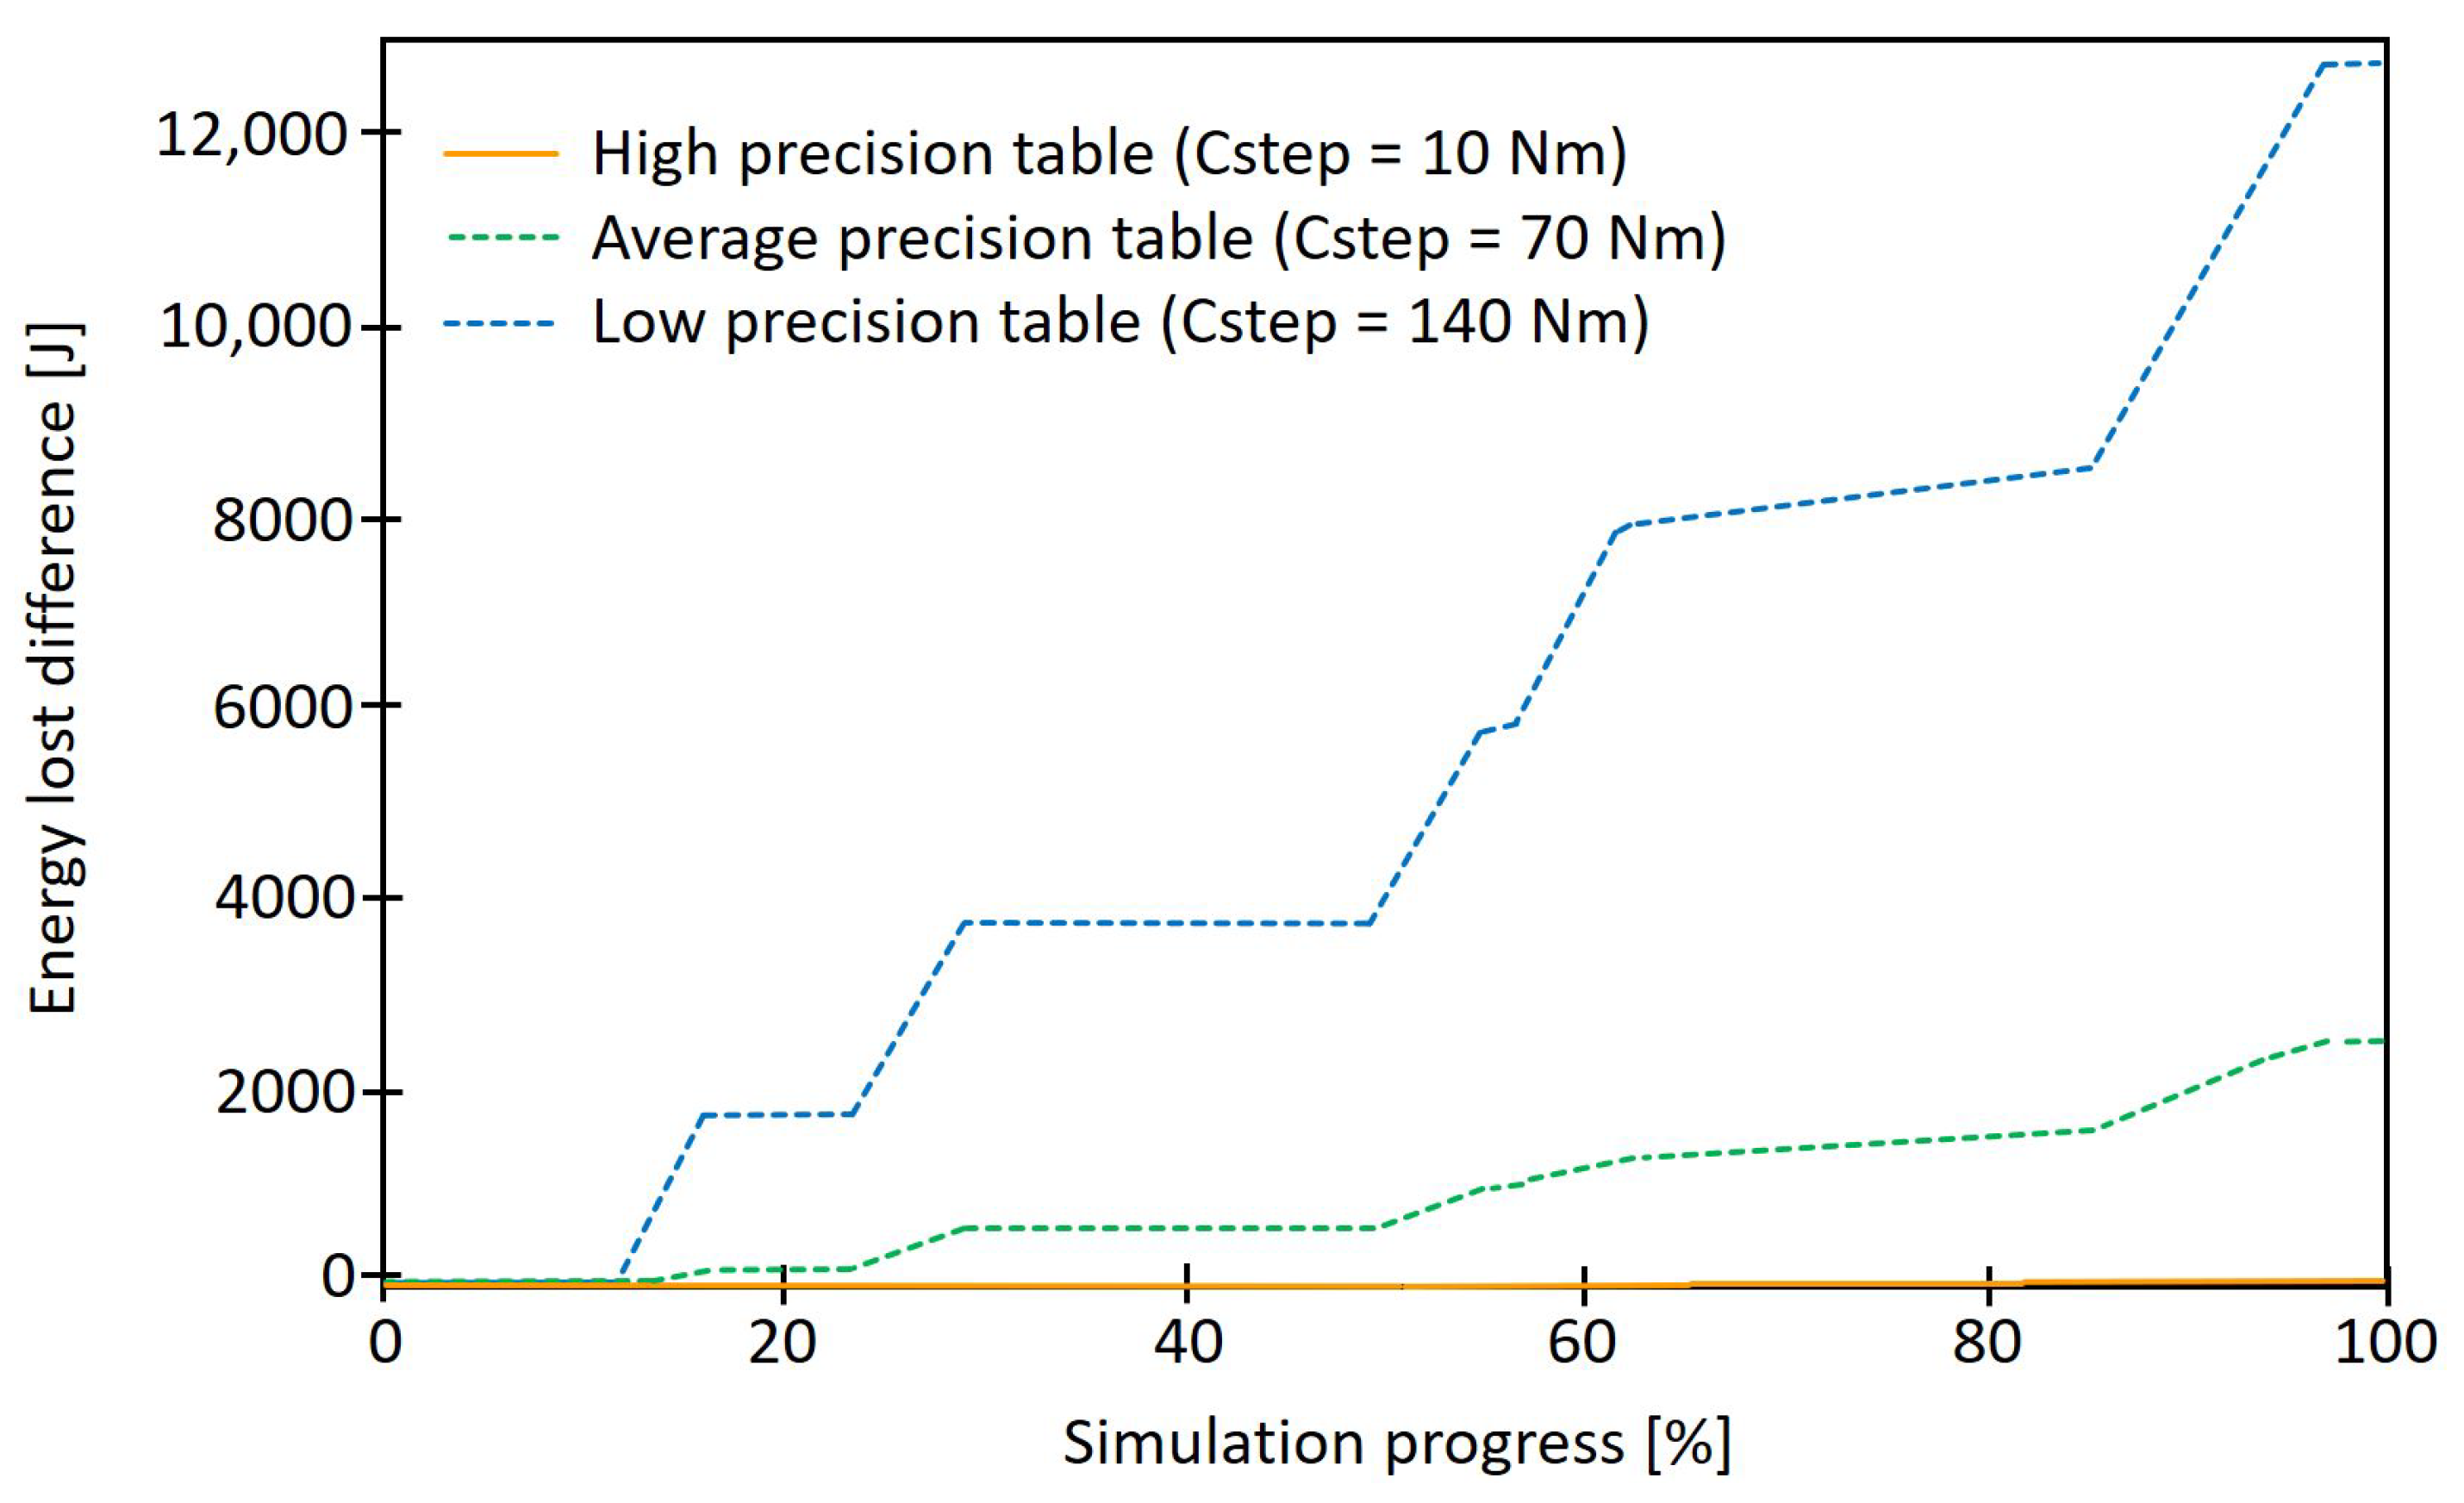
However, it was also shown that the simulation accuracy of the quasi-steady state of the quasi-stationary model correlates directly with the resolution of the stored efficiency map (see Figure 7). Thus, the larger the step size of the data in the efficiency map, the greater the deviation of the simulated drive losses between the quasi-stationary model and the dynamic model [34].
In general, the achievable accuracy of the calculation of the energy consumption is closely related to the drive losses. Therefore, even in simple steady-state models, accurate efficiency maps of the individual drive components are required.
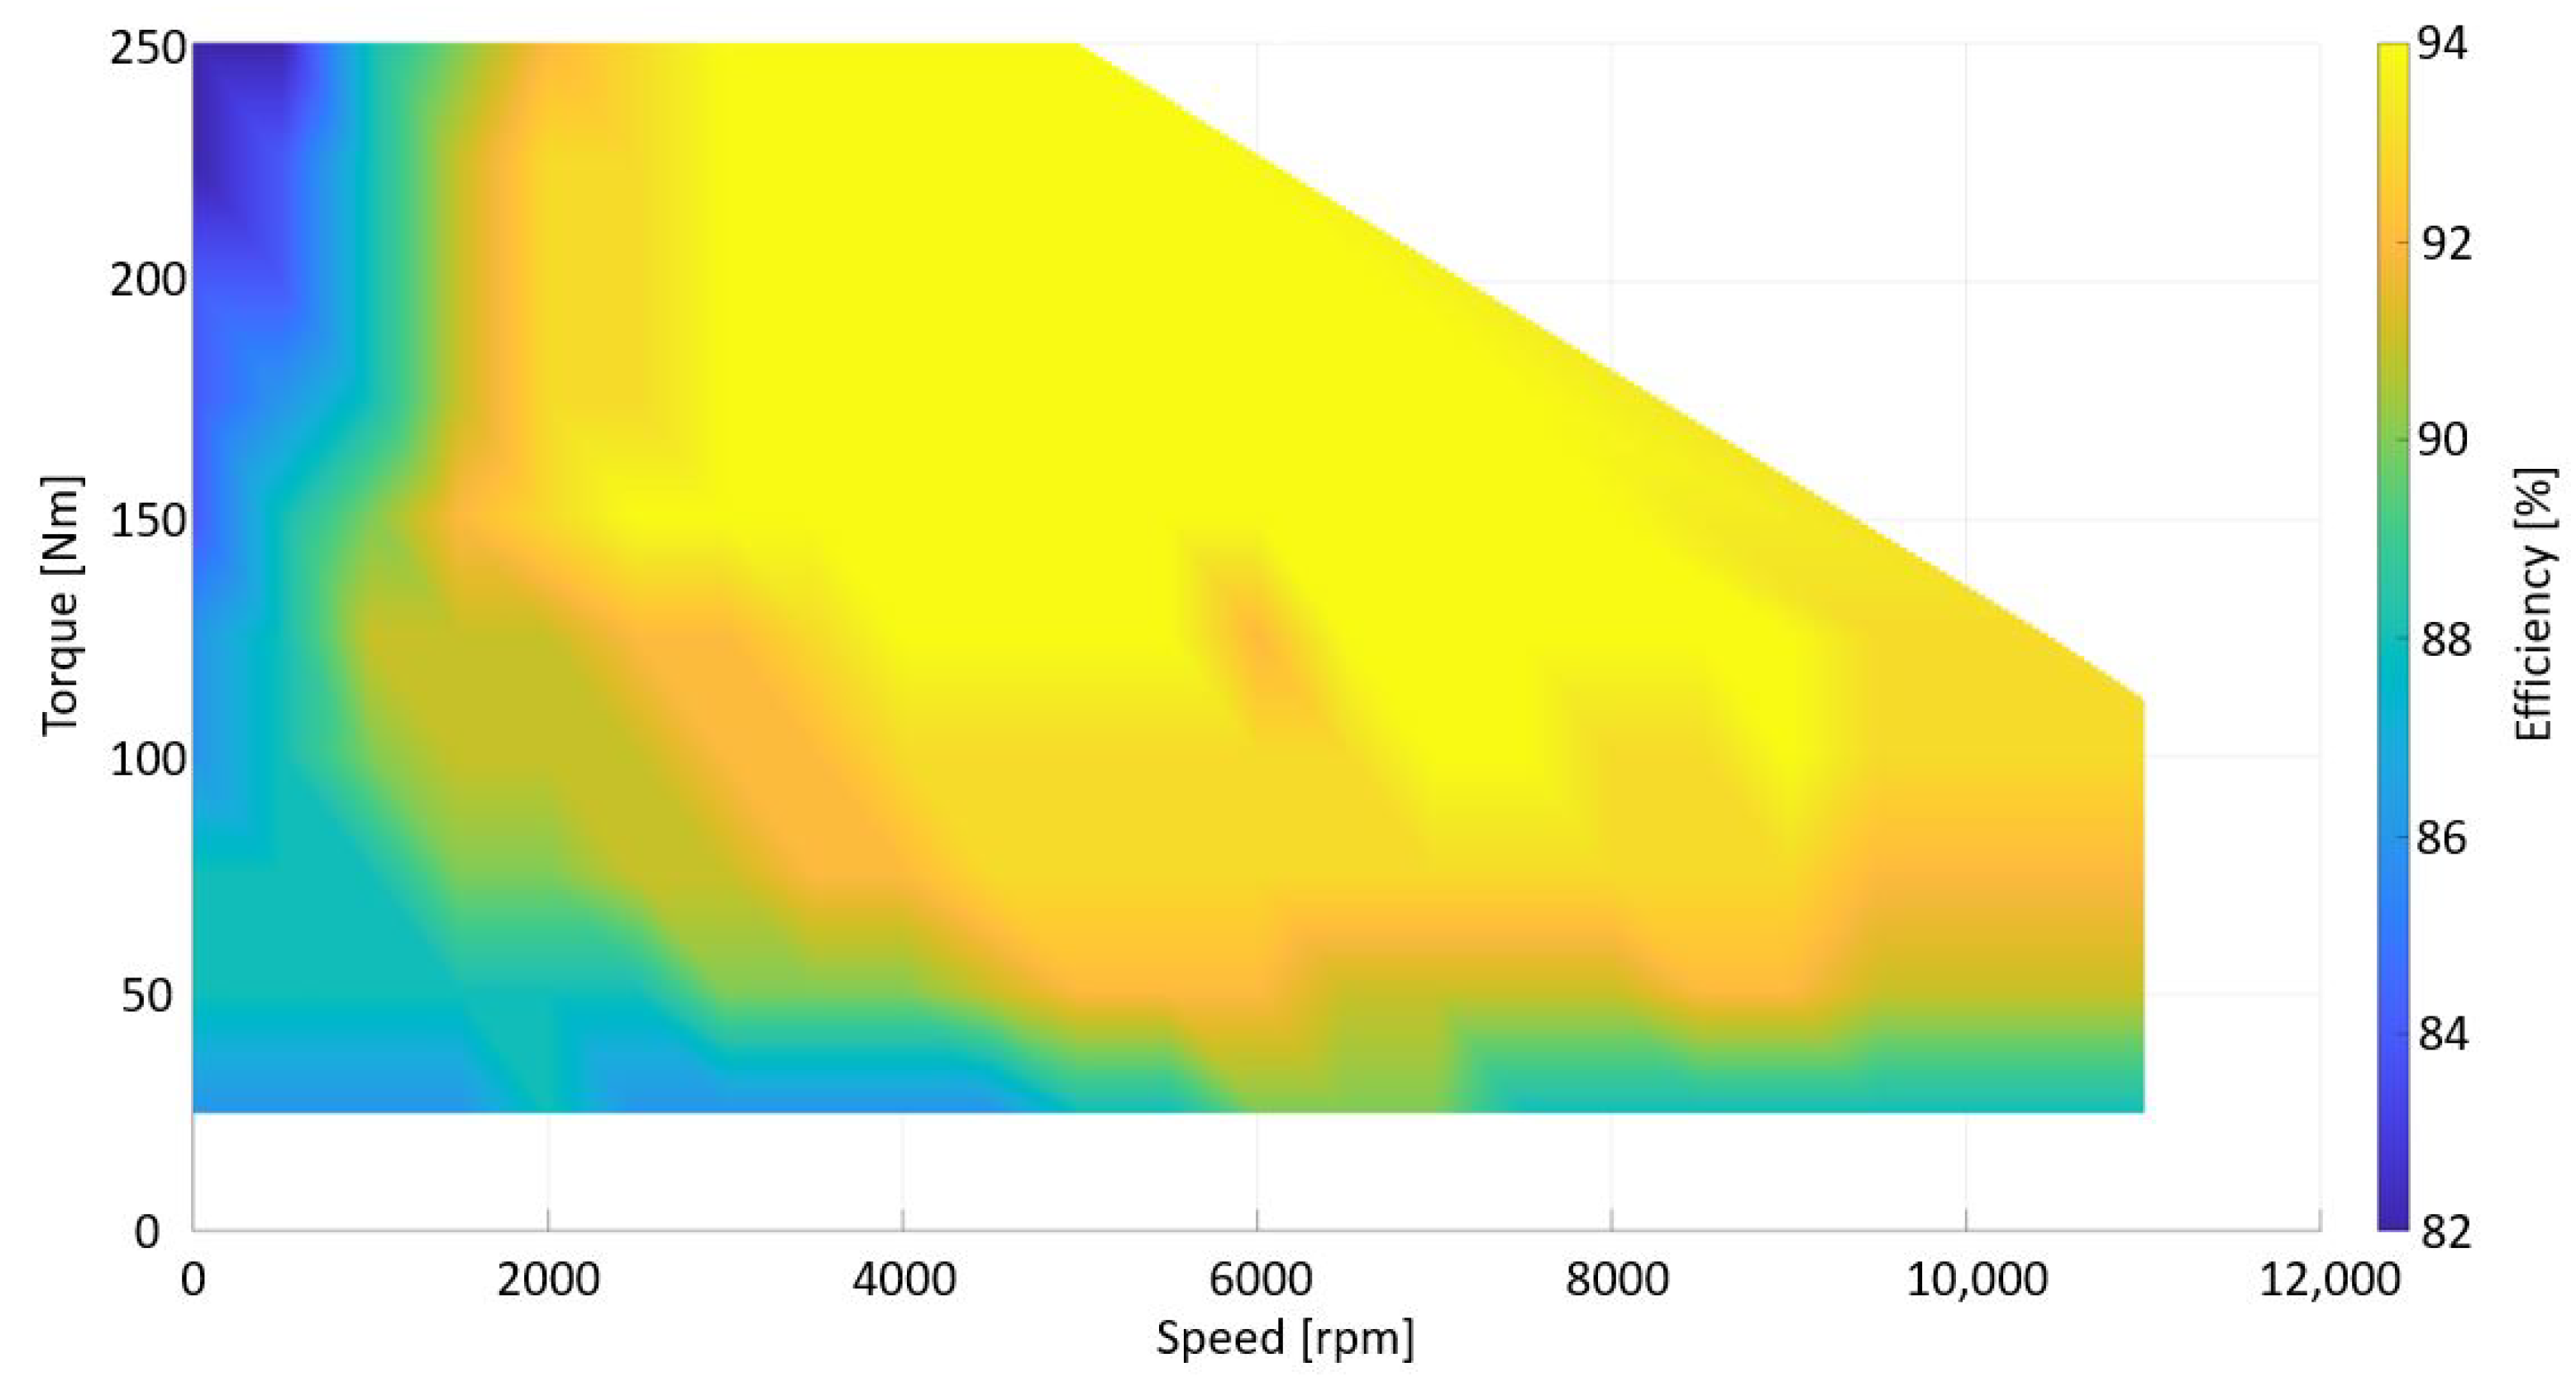
In this study, 188 torque/speed pairs with their corresponding efficiencies are used based on the efficiency map in Figure 8:
The analysis and evaluation of existing model concepts has shown that quasi-stationary or steady-state modelling approaches, which use an efficiency map to determine the required/added energy, can be considered state of the art in the field of complete vehicle simulation [34]. Therefore, a quasi-stationary modelling approach is used for the model concept. The efficiency map from Figure 8 serves as the basis of the model. In general, the achievable accuracy of the calculation of the energy consumption is closely related to the power losses. Therefore, even in simple stationary models, precise efficiency maps of the individual powertrain components are required. The Oak Ridge National Laboratory had the motor and the inverter on a motor test bench as part of a benchmark project and recorded the corresponding efficiency maps. This map is used to determine the efficiencies in motor and generator operation in this model.

4.1.4. DC/DC Converter Model

For modelling the bidirectional DC/DC converter, a semi-active configuration was used in which the supercapacitor is connected in series with the DC/DC converter and the battery is connected directly to the DC bus [36], as shown in Figure 9. This topology has the following advantages [10]:
-
Semiactive control strategies can be implemented;
-
The operating range of the energy storage components can be extended to improve the performance of the HESS;
-
It provides flexibility to reduce the size/voltage of some of the energy storage components.
A bidirectional converter was chosen because the energy is transferred from the supercapacitor to the DC bus in boost mode and the supercapacitor charges with the vehicle’s braking energy in buck mode. To perform the mathematical model of the bidirectional DC/DC converter, the circuit presented in [10] was used. To perform the analysis of the circuit, it is necessary to divide it into its two modes of operation.
The boost mode is represented as follows:
d i L d t = 1 L [ i L ( R S C R L R D ( 1 d ) R S W d ) + ( 1 d ) ( V C V D ) + V S C ]
d V C d t = 1 C [ 1 R b ( V b V c ) I d m d + i L ( 1 d ) ]
The buck mode is represented as follows:
d i L d t = 1 L [ i L ( R S C R L R D ( 1 d ) R S W d ) V C d + V D ( 1 d ) + V S C ]
d V C d t = 1 C [ 1 R b ( V b V c ) I d m d + i L d ]

4.2. Adaptive Driver Model

The Adaptive Driver Model is basically a fully automated vehicle’s movement control that shows a behaviour similar to a human driver. To ensure a driving behaviour similar to a human driver, the driver model uses the route information generated using RouteGenerator to control the choice of speed, choice of trajectory and the steering of the vehicle. Figure 10 shows all inputs and outputs of the driver model.
In addition to the information of the virtual road model, further data such as the driver mode (defensive, neutral or aggressive) and other parameters can be set up during the preparation phase. This information is provided for the actual simulation phase and communicated to the respective modules.
-
Target course: Builds the course based on the input data. This is represented as a trajectory over a 2D surface by defining the x and y coordinates along a centerline (with a certain width). This form of mapping can be adjusted by the parameters previously set by the driver model, such as adjusting the ideal driving line. If this is set so that the driver model should use the entire width of the road (or only one lane), the model will adjust the centerline accordingly [38];
-
Target speed: A speed profile is generated during the preparation phase for the entire route. For this purpose, information such as the maximum top speed, braking before curves, acceleration behavior, etc. is used as input. The driver model tries to maintain the specified speed profile throughout the entire simulation process. However, the model can react adaptively to the situation, for example, due to increased traffic volume, and adjust the speed profile [38];
-
Vehicle state: The driver model has all the information about the vehicle’s state of movement available at all times. This includes, for example, speed, longitudinal and lateral acceleration, sideslip angle and other relevant data [23].
-
Steering wheel torque: Similar to the vehicle state information, this information comes from the vehicle model. For example, if the vehicle’s steering wheel torque is below a certain threshold, it means that the driver model has lost control of the vehicle in the simulation [38].
As output, the driver model provides the gas pedal position, brake pedal position, and steering angle. This data is then used as input for the virtual vehicle model.

5. Simulation and Result

5.1. Approach

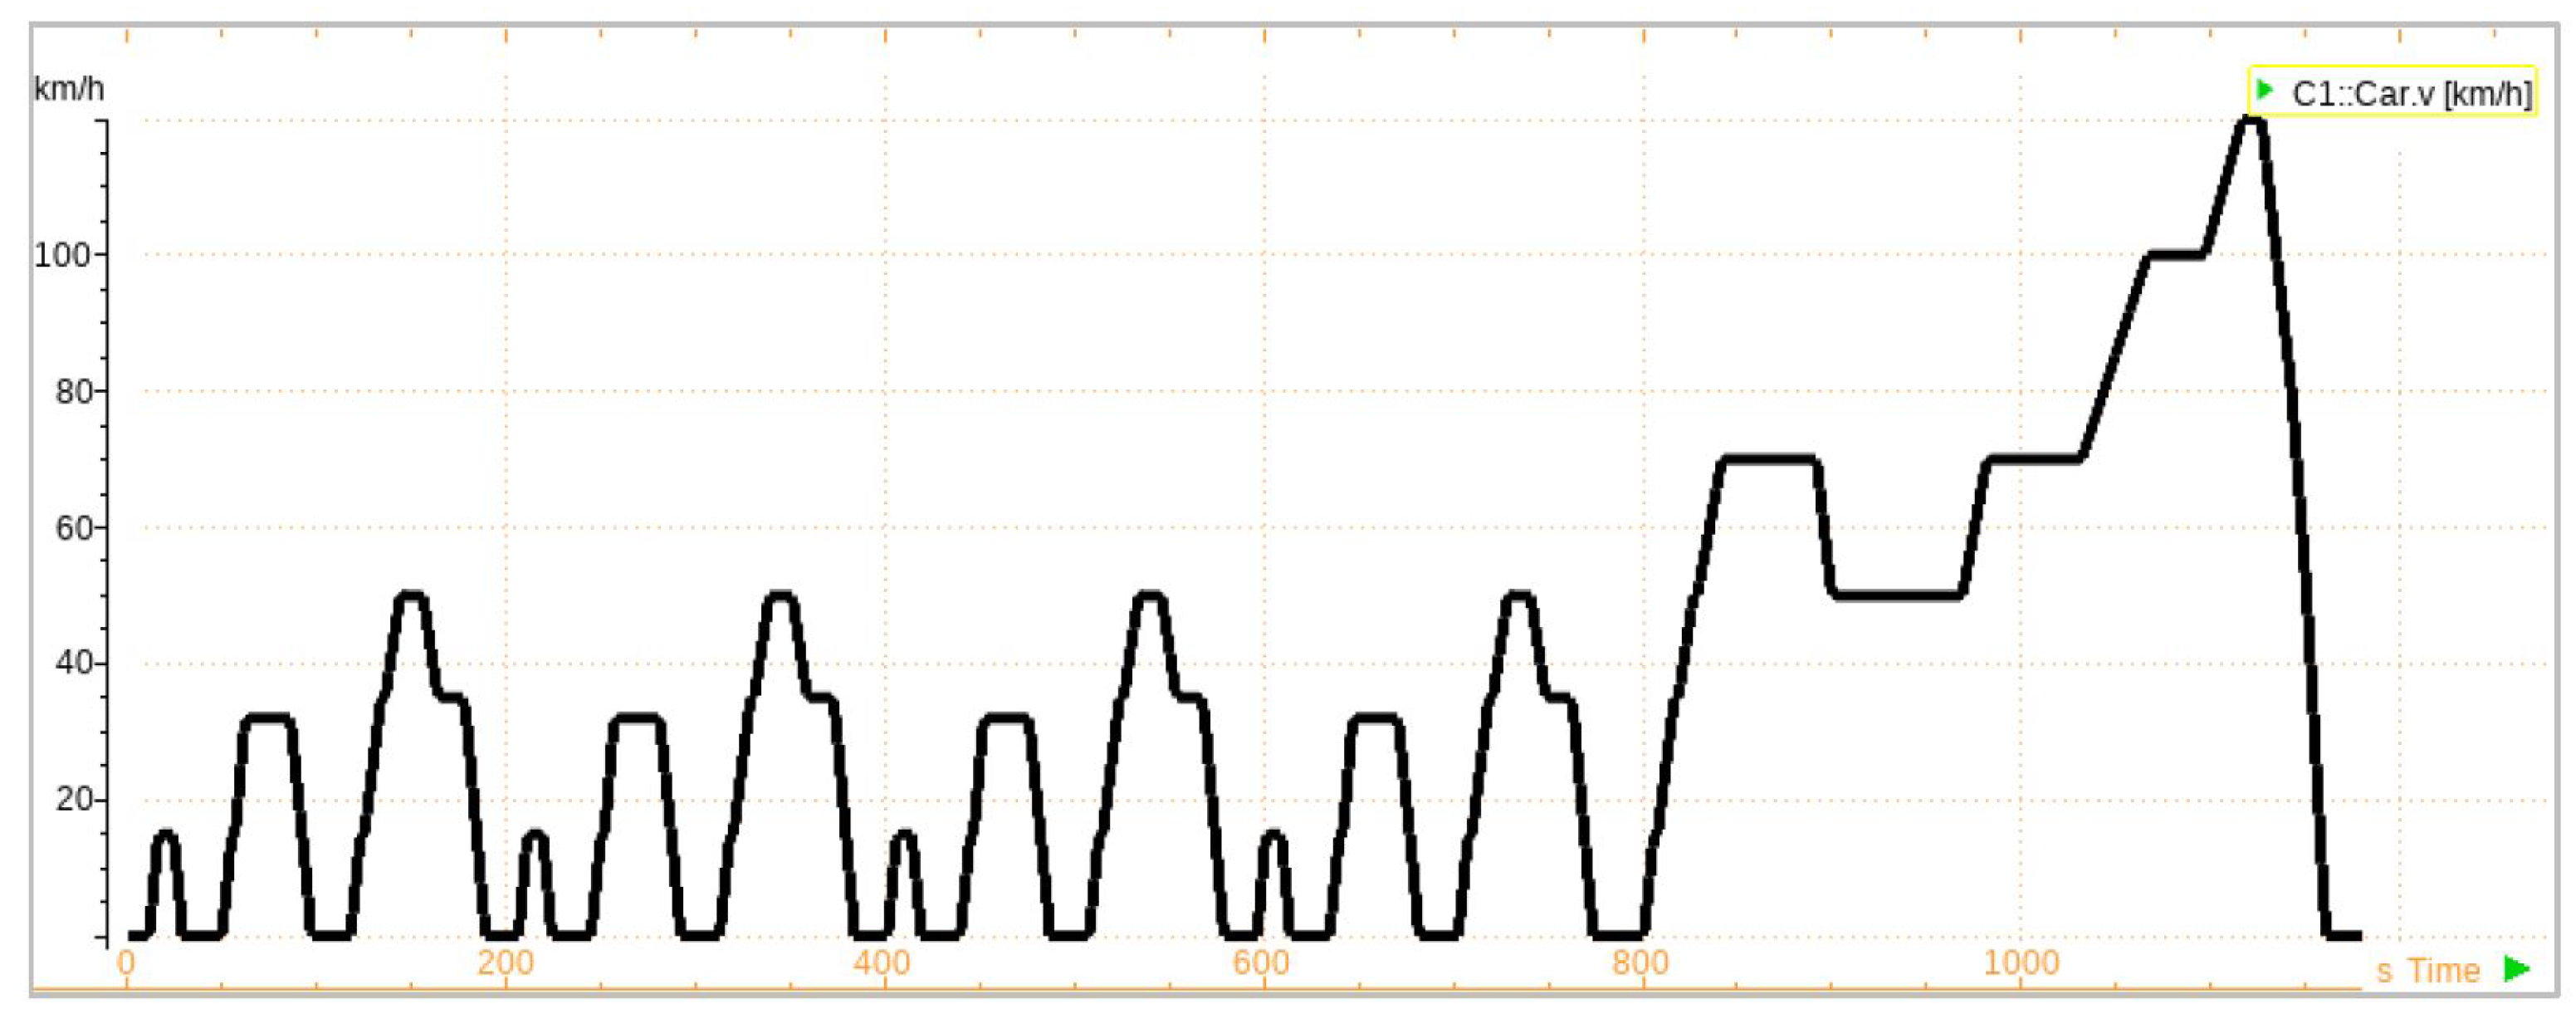
For the simulation of energy consumption, the created vehicle model (see Section 4.1) drives on a defined route, and the progression of the battery state of charge is recorded. The average consumption is then calculated from these results. For the validation of the simulation results, a standardized test cycle is at first chosen, since there are already real measured results for such an energy consumption measurement [39]. In this work, the simulation results are validated with the literature values of the NEDC [40]. In the second step, a real test drive is simulated, which is compared with the recorded results of the real test drive. Additionally, for the validation, the modeled supercapacitor is deactivated, since it is not provided in the real BMW i3. The vehicle model is therefore structurally equivalent to the real model. For the comprehensibility of the simulations, the tests are carried out under the same boundary conditions as taken from the literature data. The simulation-dependent results are compared with the respective literature data given by the test cycle. In order for an evaluation of the simulation to take place, relevant measured variables from the simulation are recorded. A simulation always starts with a state of charge (SOC) of 100%, which corresponds to a fully charged battery. All auxiliary consumers were deactivated for this simulation, and the reference temperature in the simulations was set to 20 °C. Monitoring the simulated speed profile (see Figure 11) provides the background for comparable measurement results.
In [20,41], a similar approach was used for the validation of the simulation-based energy consumption. While [20,41] created the predicted energy consumption values using algorithms and simplified vehicle models sufficient for the needs, in this study, a whole vehicle model (see Section 4.1) in combination with white box models of the energy storage system and engine model are simulated to produce the energy consumption values in a simulation environment.
The duration and distance of the simulation exhibit only minor deviations (0.73% and 0.00%) compared to the literature data (see Table 5). This results in a simulated energy consumption which deviates from the literature value by only 1.21%.

5.2. Results

As in the previous presented validation, the same vehicle model and the same route were used here for the real measurement under approximately the same conditions as in the simulation.
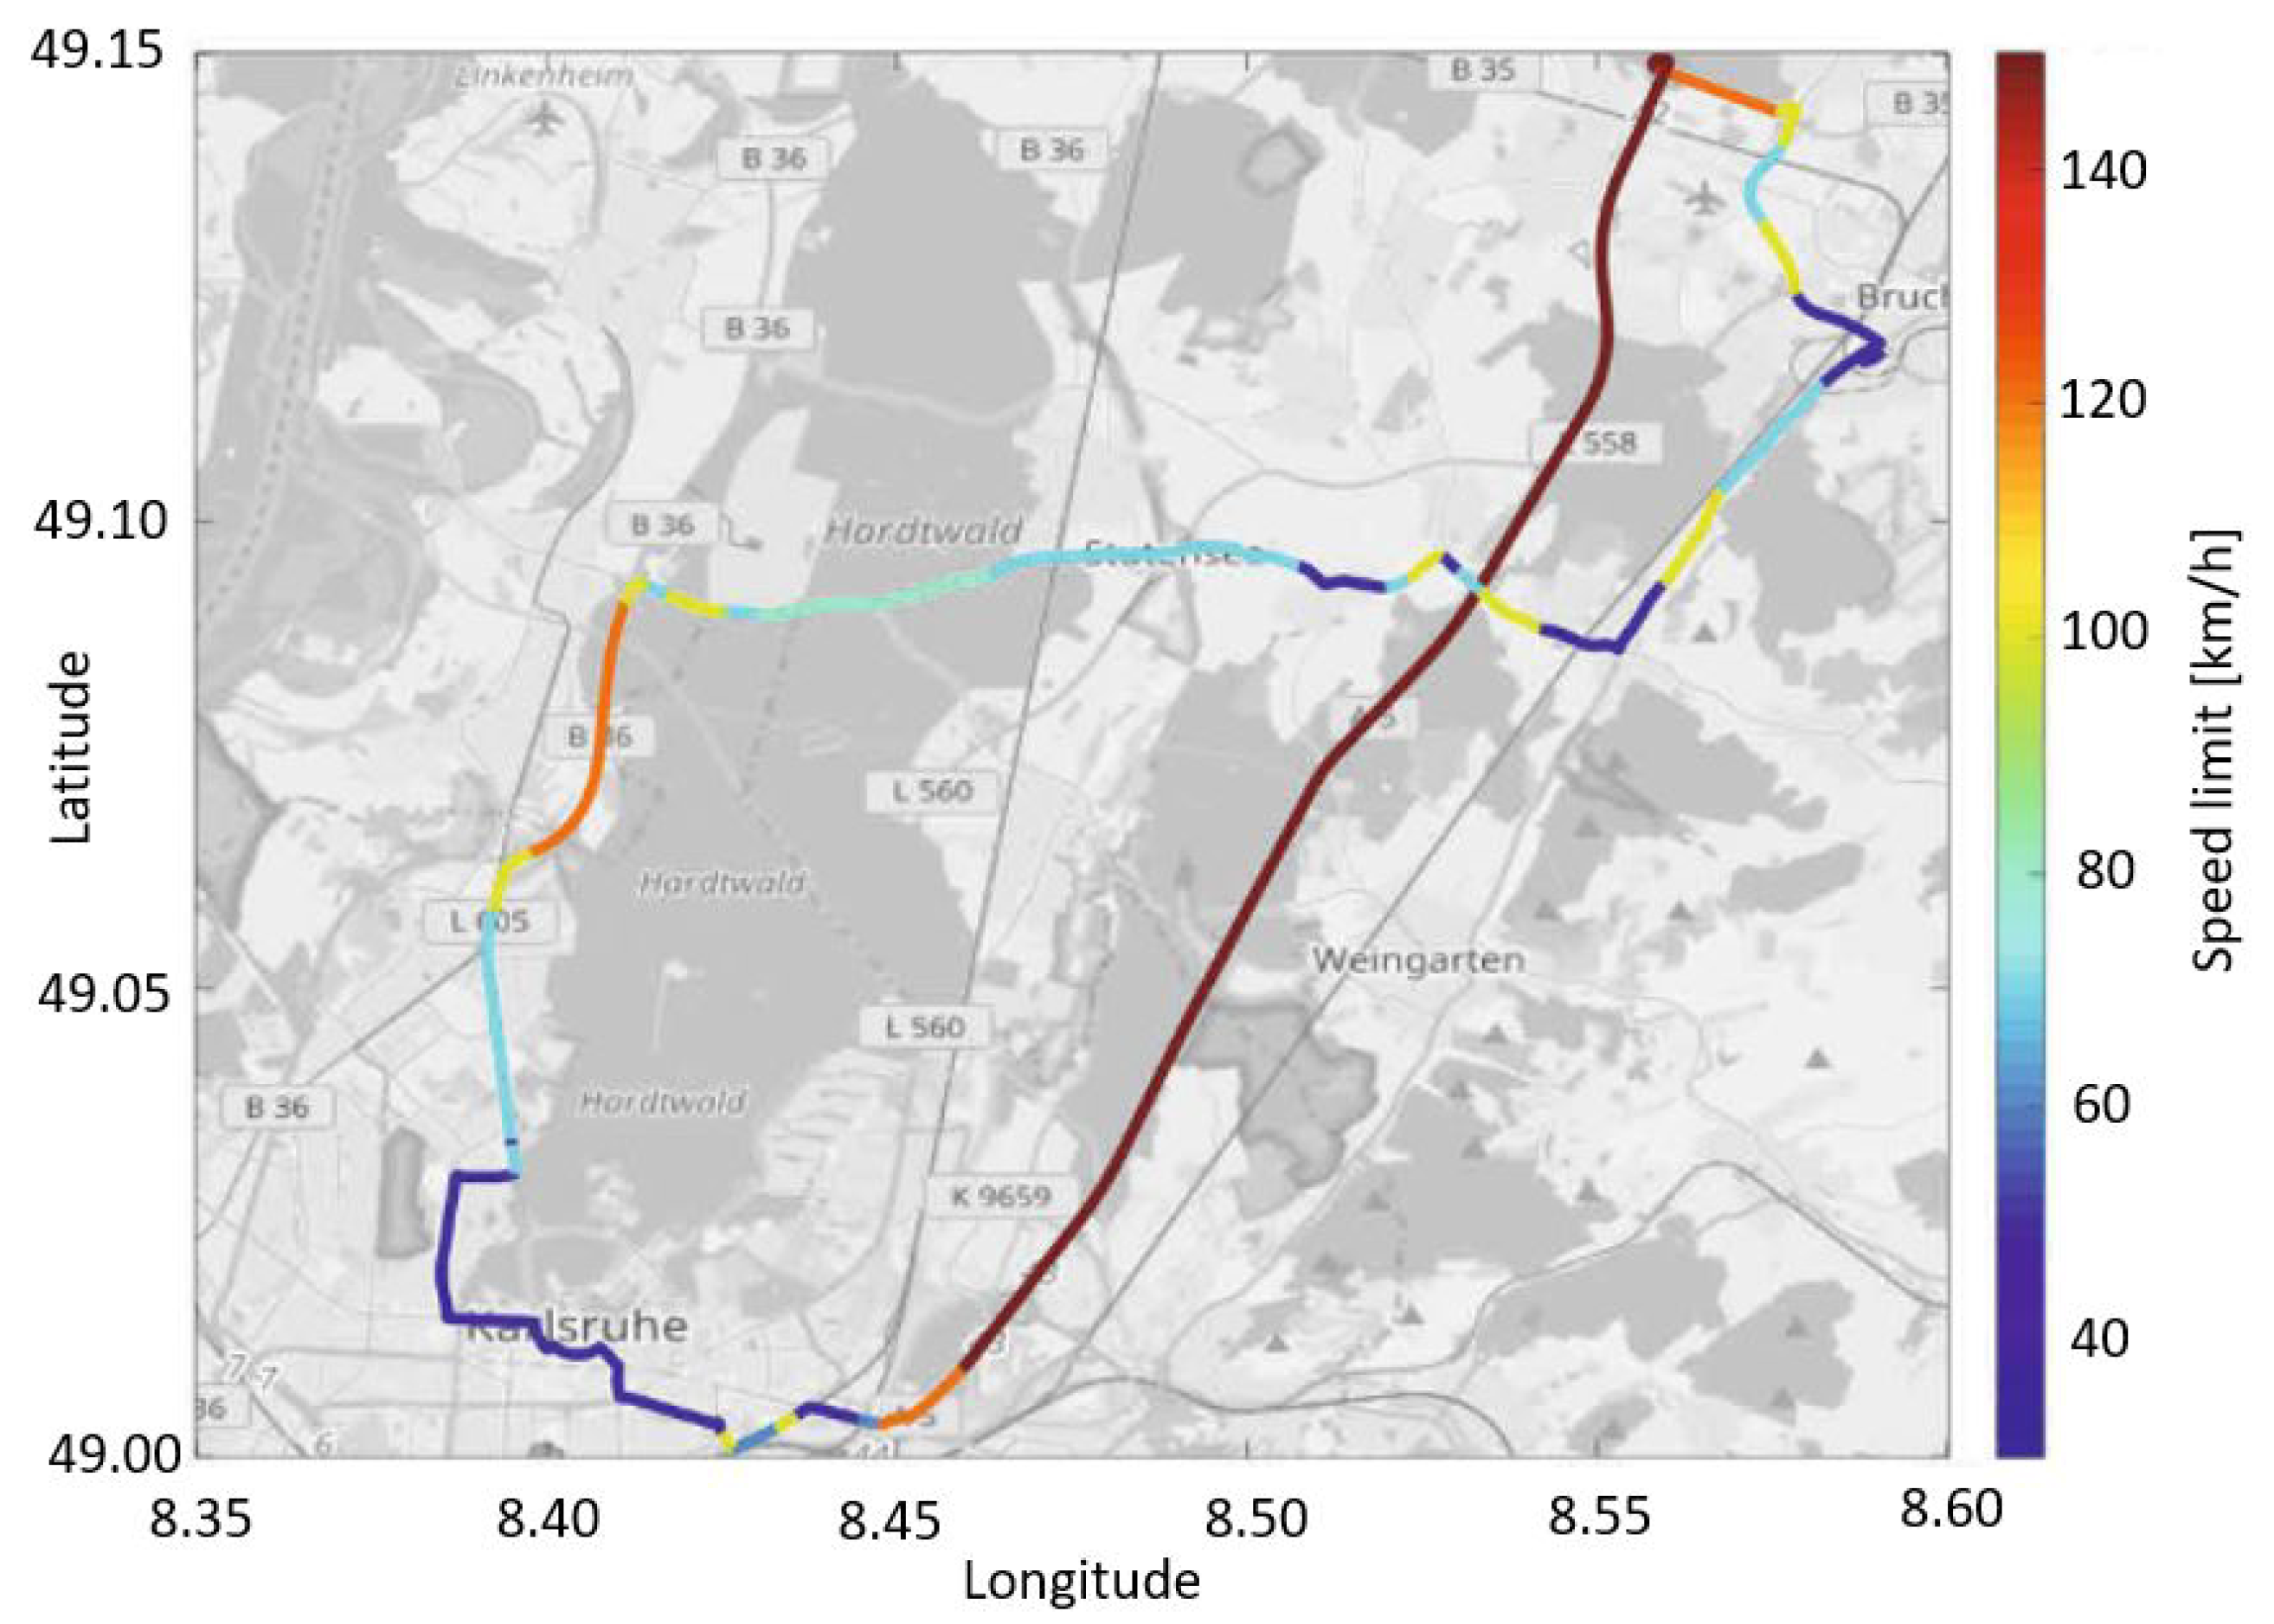
For the simulation of a real test drive, a round trip from Bruchsal to Karlsruhe and back to Bruchsal (BR-HKA-BR Circuit) was selected and modeled. In order to approach a typical real trip as realistically as possible, the route included highway, urban and extra-urban roads and thus covered all common speed ranges (see Figure 12) [18,41].
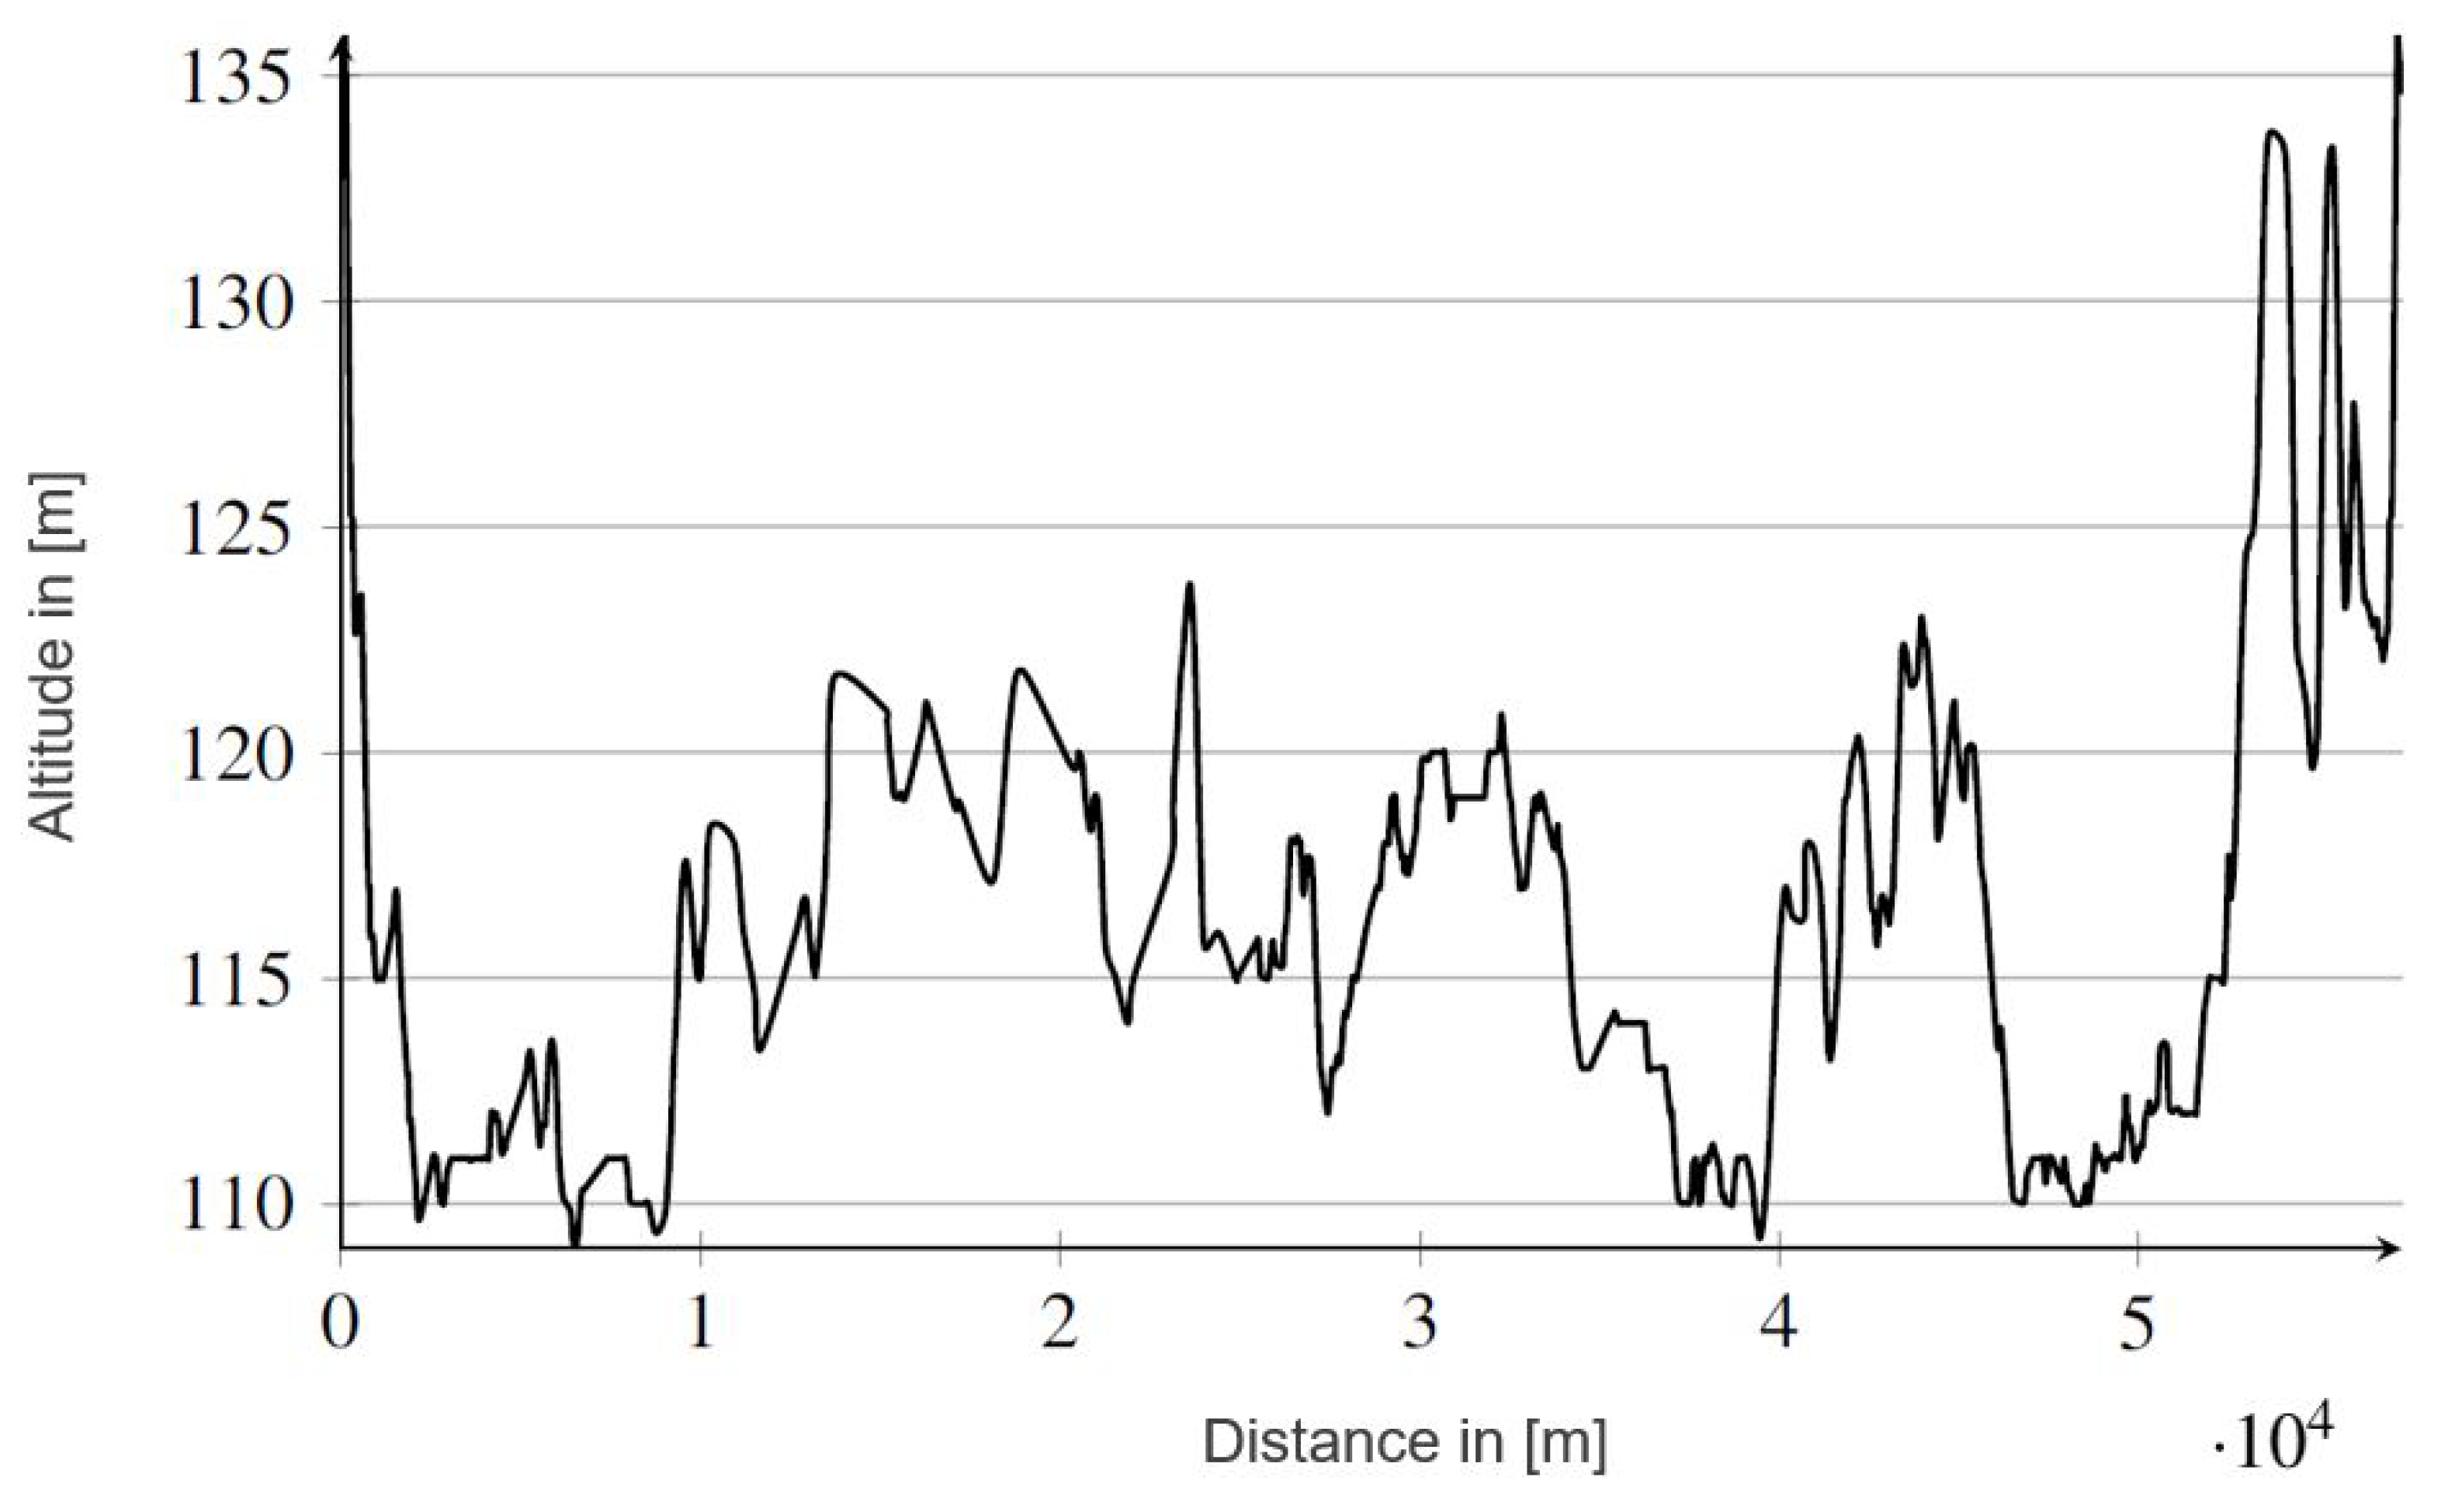
This covers 16.7 km of urban roads, 22.2 km of extra-urban roads and 18.2 km of highway. There are 44 speed limits and 33 traffic lights on the route. The speed limits are shown in Figure 12 for the route layout. The topology of the route is shown in Figure 13, where the maximum altitude difference is 25 m.
The conditions for the simulation were adapted to those of the real test drives. The automatic climate control was activated at the medium level. The temperature of the surrounding area was 20 °C. The speed profile of the simulation was implemented by the speed limits set in the RouteGenerator and the driver model. This virtual driver shows a normal driving behavior with medium accelerations and adapted maneuvers in curves.
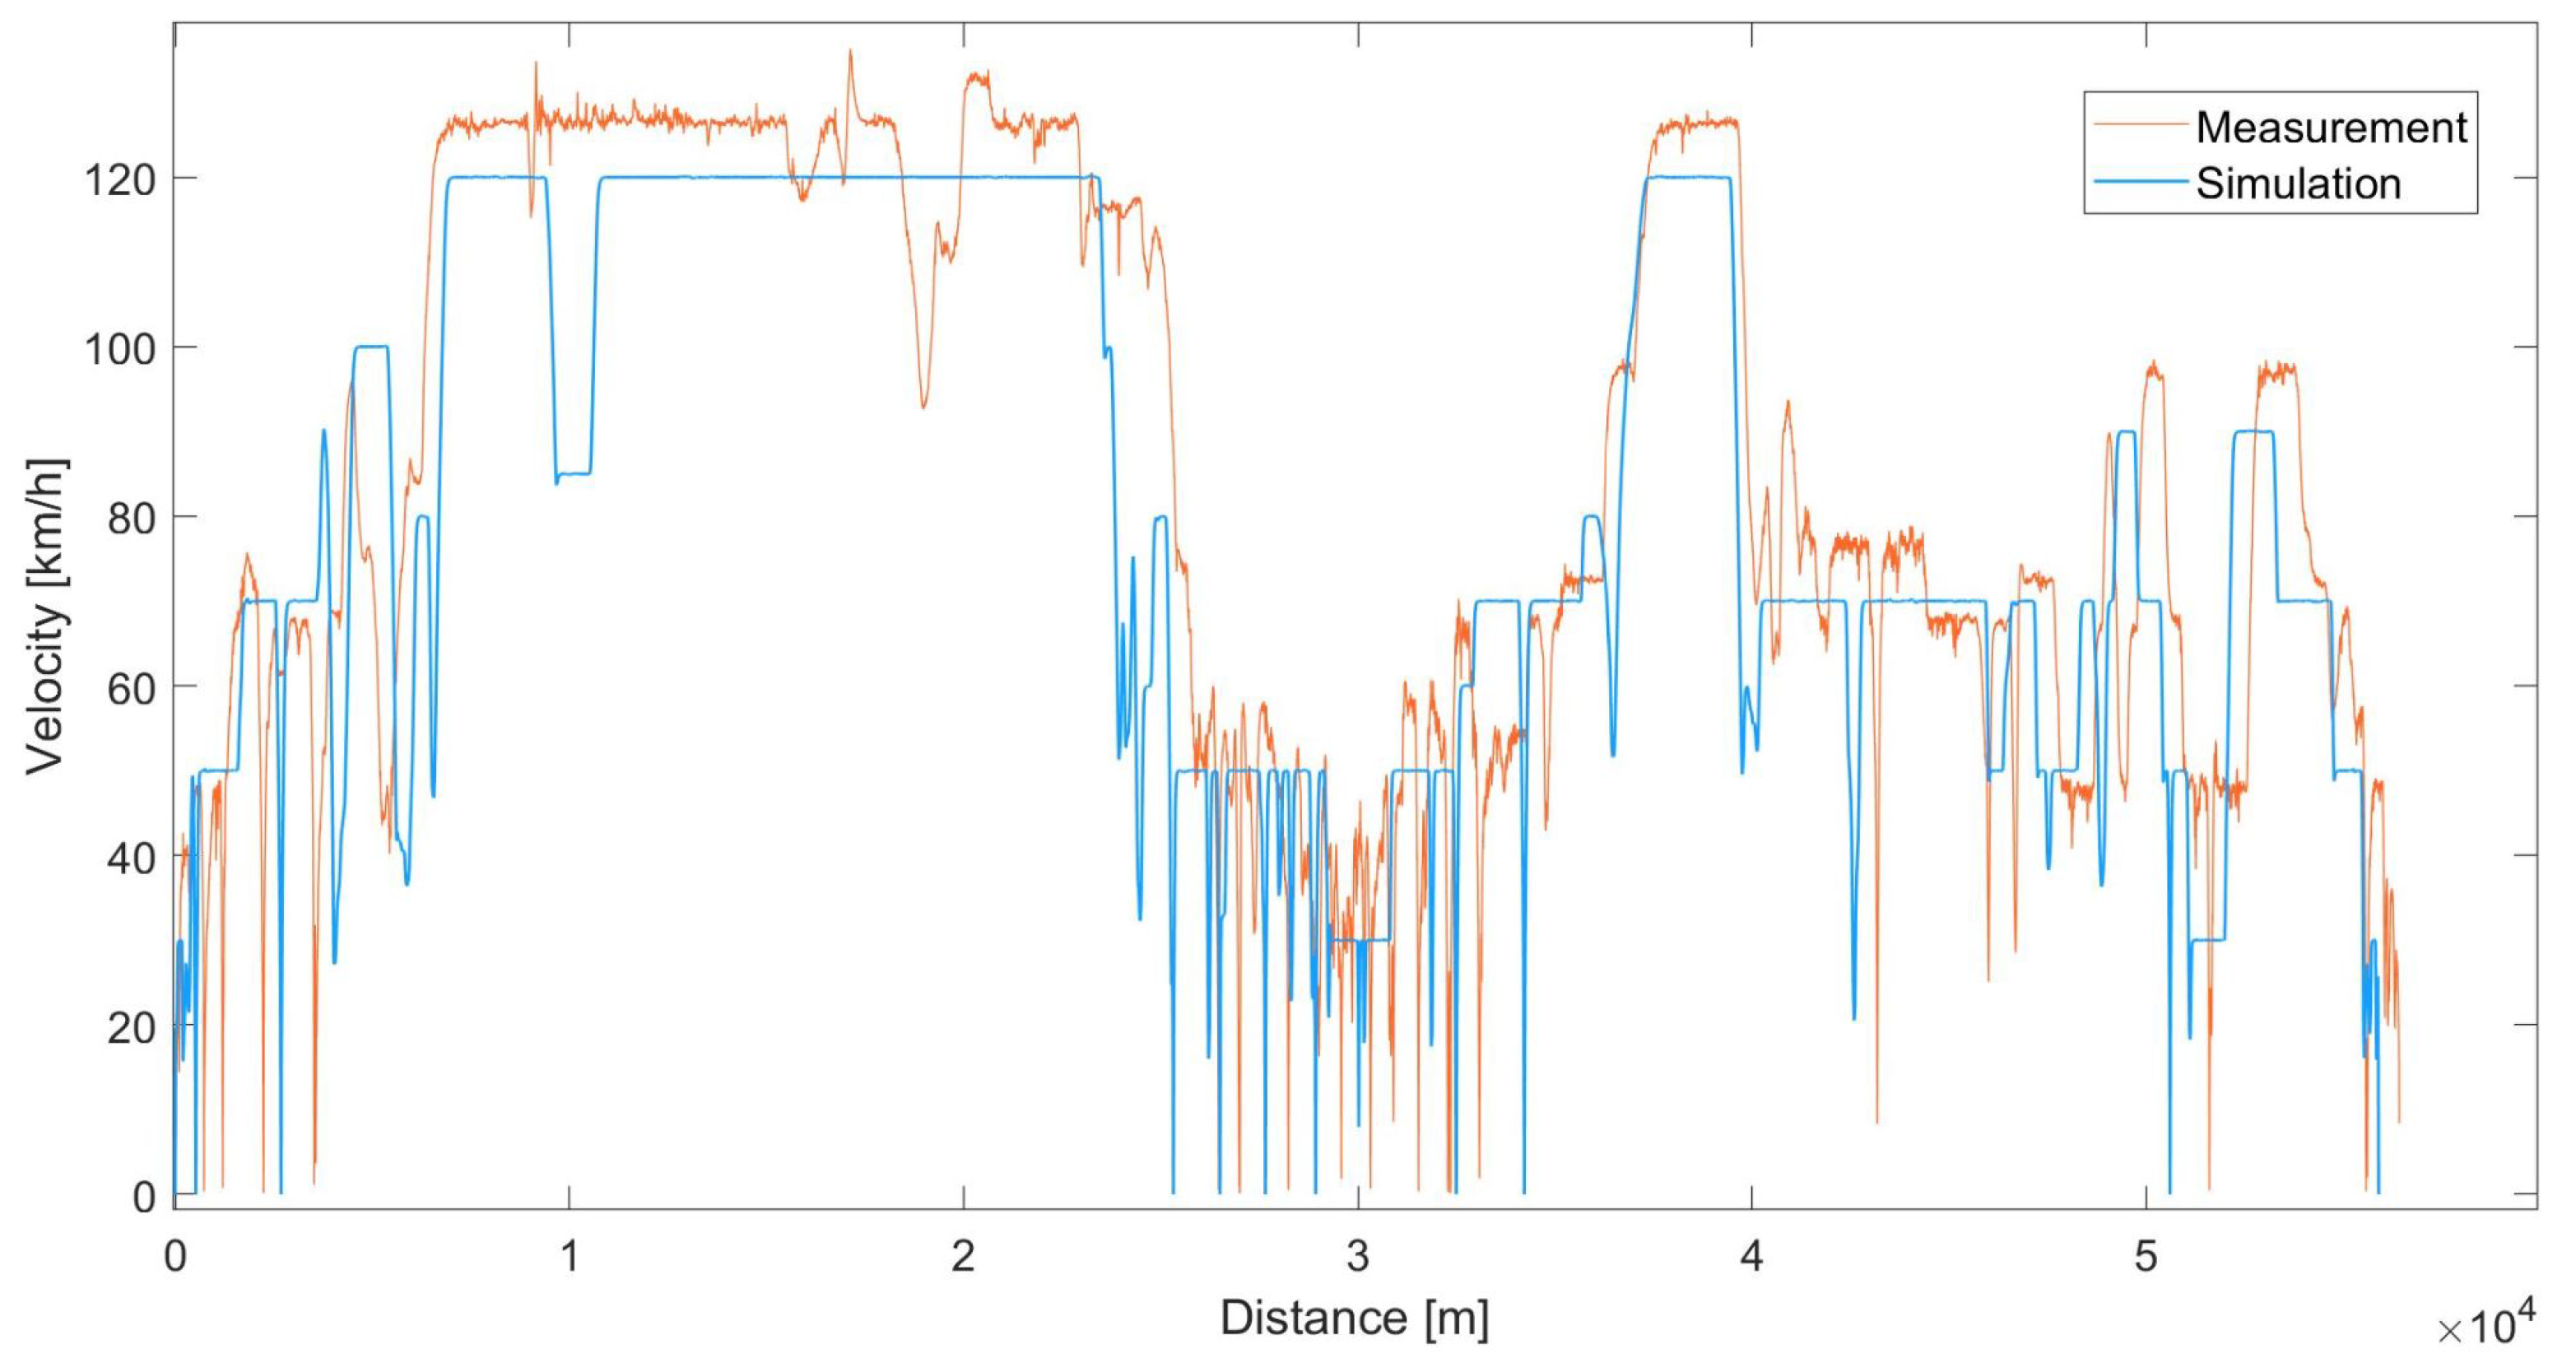
Figure 14 shows the speed profile of the real vehicle and the simulated vehicle. By using the real route data and traffic data, traffic influences are included in the speed profile in addition to the pure speed limits. It can be seen that the dynamic course of the simulation corresponds closely to the real measured course. The simulation shows that during the highway section, traffic-induced speed reductions have been taken into account. In the simulation, this occurs somewhat earlier than in the real measurement due to the available traffic data. Additionally, stop-and-go situations due to traffic were depicted in the simulation in the urban area (around the 30 km mark). The speed profile also allows conclusions to be drawn, to a certain extent, about the dynamic behavior of the energy consumption characteristic.
The comparison of the simulated values and the real measured values results in a deviation of the covered distance of 2.19%. This results, on the one hand, from the difference of the actual driving line of the vehicle (lane center in the simulation and possible lane changes in the real driving) and, on the other hand, from the accuracy of the GPS track data over the API and the real track. The deviation of 4.63% which occurs in the driving time can be explained by the differences between the traffic light times of the simulation and the real traffic light phases and the deviation between the retrieved traffic data and the actual traffic volume. For more representative results, the route was driven several times for the real measurement, and the respective parameters were recorded. Due to the mentioned influencing parameters, there were differences in driving duration during the real measurement, which in the minimum amounted to −0.23% and in the average to the used 4.63%. The difference in average speed traveled of 4.24% between simulation and real measurement is due to the adaptive driver model and the simulated traffic volume.
The simulated energy consumption of the vehicle model on the generated route thus corresponds closely to the actual measured values, down to a deviation of 1.92%. This shows that the presented model in combination with the presented method for generating the route does not only work at standard cycles (see Table 5) but also under regular traffic conditions with increased traffic volume or jam.

6. Conclusions and Perspective

This work presents a concept for the generation of energy consumption of electric vehicles using a model-based approach. For this purpose, an algorithm (RouteGenerator) requests route data via APIs from different map services, navigation services and weather services and prepares this information for the simulation environment CarMaker. Within this simulation environment, a vehicle model and a driver model are generated in addition to the modeled route. The results from the simulation are compared with real world results from the NEDC test procedure and checked for congruency. The evaluation shows that the simulation results have a deviation of about 1.21%. Since the focus of the test cycles like NEDC is generally on comparability and reproducibility and therefore do not always correlate with the real world results, further routes were tested and simulated. In order to represent a realistic driving experience, a round trip from Bruchsal to Karlsruhe and back to Bruchsal was modeled. This covers the different road types (highway, urban and extra-urban road) and thus also the typical speed ranges of a vehicle. The results of a test drive with a real BMW i3 serve as a reference. The simulation results show that the simulated values diverge by just 1.92% compared to the real measured values. The work shows that the simulation, compared with both synthetic test cycles and real test drives, comes to a small deviation in the single-digit percentage range from the reference values. The concept thus offers the possibility to realistically simulate the energy consumption of vehicles on different routes. To further increase the accuracy of the simulation results, it could be interesting to specify the various components of the vehicle model in more detail. First of all, a more detailed powertrain model including parameterization (engine parameters from the engine test bench and data for the battery from a pulse discharge test) would be a possibility to create a more realistic model. In addition, the determined material properties of the real components could be used to represent the temperature dependence in the powertrain in more detail. This would make it possible, for example, to simulate the lifetime of the battery with this concept.

Author Contributions

Conceptualization, T.N., R.K. and D.C.; methodology, T.N.; software, T.N.; validation, T.N.; investigation, T.N.; resources, R.K. and D.C.; data curation, T.N.; writing—original draft preparation, T.N.; writing—review and editing, T.N., R.K. and D.C.; visualization, T.N.; supervision, R.K. and D.C.; project administration, T.N., R.K. and D.C.; All authors have read and agreed to the published version of the manuscript.

Funding

This work was carried out as part of VEHICLE project, sponsored by INTERREG V A Upper Rhine Programme—Der Oberrhein wächst zusammen: mit jedem Projekt, European Regional Development Fund (ERDF) and Franco-German regional funds (Baden-Württemberg, Rhineland- Palatinate and Grand Est). This work has been supported by the EIPHI Graduate School (contract ANR-17-EURE-0002) and the Region Bourgogne Franche-Comté.

Acknowledgments

This work has been supported by the EIPHI Graduate School (contract ANR-17-EURE-0002) and the Region Bourgogne Franche-Comté.

Conflicts of Interest

The authors declare no conflict of interest.

Abbreviations

The following abbreviations are used in this manuscript:
HESSHybrid energy storage systems
EMSEnergy management system
APIApplication programming interface
NEDCNew European Driving Cycle
WLTPWorldwide harmonized Light vehicles Test Procedure
GPSGlobal Positioning System
SOCState of charge
DCDirect current
NYCCNew York City cycle
AUArtemis urban
NY CompNew York composite cycle
TMCTrafficMessage Channel
SRTMShuttle Radar Topography Mission
MCUMotor control unit
BCUBattery control unit
RMSPERoot-mean-square percentage error
MPEMaximum percentage error
HVHigh voltage
LVLow voltage

References

  1. Transport and the Green Deal. Available online: https://ec.europa.eu/info/strategy/priorities-2019-024/european-green-deal/transport-and-green-deal_en (accessed on 10 August 2021).
  2. Grewal, K.S.; Darnell, P.M. Model-based EV range prediction for Electric Hybrid Vehicles. In Proceedings of the IET Hybrid and Electric Vehicles Conference 2013 (HEVC 2013), London, UK, 6–7 November 2013. [Google Scholar]
  3. Viola, F.; Longo, M.; Zaninelli, D.; Romano, P.; Miceli, R. How is the spread of the Electric Vehicles? In Proceedings of the 2015 IEEE 1st International Forum on Research and Technologies for Society and Industry Leveraging a Better Tomorrow (RTSI), Turin, Italy, 16–18 September 2015. [Google Scholar] [CrossRef]
  4. Allègre, A.L.; Trigui, R.; Bouscayrol, A. Different energy management strategies of Hybrid Energy Storage System (HESS) using batteries and supercapacitors for vehicular applications. In Proceedings of the 2010 IEEE Vehicle Power and Propulsion Conference, Lille, France, 1–3 September 2010. [Google Scholar]
  5. Joud, L.; Da Silva, R.; Chrenko, D.; Kéromnès, A.; Le Moyne, L. Smart Energy Management for Series Hybrid Electric Vehicles Based on Driver Habits Recognition and Prediction. Energies 2020, 13, 2954. [Google Scholar] [CrossRef]
  6. Feng, Y.; Cao, Z.; Shen, W.; Yu, X.; Han, F.; Chen, R.; Wu, J. Intelligent battery management for electric and hybrid electric vehicles: A survey. In Proceedings of the 2016 IEEE International Conference on Industrial Technology (ICIT), Taipei, Taiwan, 14–17 March 2016. INSPEC Accession Number: 16035706. [Google Scholar]
  7. Miller, J.M. Energy Storage Technology Markets and Application’s: Ultracapacitors in Combination with Lithium-ion. In Proceedings of the 7th International Conference on Power Electronics, Daegu, Korea, 22–26 October 2007. [Google Scholar] [CrossRef]
  8. Gunasagran, S.K.; Kriesten, R.; Nguyen, T. Implementation of a Model for the Generation of Realistic Energy Flow Based on a Typical Driving Cycle. Bachelor’s Thesis, University of Applied Sciences Karlsruhe—IEEM, Karlsruhe, Germany, 2020. [Google Scholar]
  9. Fotouhi, A.; Auger, D.J.; Propp, K.; Longo, S. Simulation for prediction of vehicle efficiency, performance, range and lifetime: A review of current techniques and their applicability to current and future testing standards. In Proceedings of the 5th IET Hybrid and Electric Vehicles Conference (HEVC 2014), London, UK, 5–6 November 2014. IET INSPEC Accession Number: 14737982. [Google Scholar]
  10. Shen, J. Energy Management of a Battery-Ultracapacitor Hybrid Energy Storage System in Electric Vehicles. Ph.D. Thesis, University of Maryland, College Park, MD, USA, 2016. [Google Scholar]
  11. Shen, J.; Khaligh, A. A Supervisory Energy Management Control Strategy in a Battery/Ultracapacitor Hybrid Energy Storage System. Trans. Transp. Electrif. 2016, 1, 223–231. [Google Scholar] [CrossRef]
  12. Munoz, P.M.; Correa, G.; Gaudiano, M.E.; Fernández, D. Energy management control design for fuel cell hybrid electric vehicles using neural networks. Int. J. Hydrogen Energy 2017, 42, 28932–28944. [Google Scholar] [CrossRef]
  13. Hu, J.; Jiang, X.; Jia, M.; Zheng, Y. Energy management strategy for the hybrid energy storage system of pure electric vehicle considering traffic information. Appl. Sci. 2018, 8, 1266. [Google Scholar] [CrossRef]
  14. Li, J.; Zhou, Q.; He, Y.; Shuai, B.; Li, Z.; Williams, H.; Xu, H. Dual-loop online intelligent programming for driver-oriented predict energy management of plug-in hybrid electric vehicles. Appl. Energy 2019, 253, 113617. [Google Scholar] [CrossRef]
  15. Fontaras, G.; Ciuffo, B.; Zacharof, N.; Tsiakmakis, S.; Marotta, A.; Pavlovic, J.; Anagnostopoulos, K. The difference between reported and real-world CO2 emissions: How much improvement can be expected by WLTP introduction? Transp. Res. Procedia 2017, 25, 3933–3943. [Google Scholar] [CrossRef]
  16. Pavlovic, J.; Tansini, A.; Fontaras, G.; Ciuffo, B.; Otura, M.G.; Trentadue, G.; Bertoa, R.S.; Millo, F. The Impact of WLTP on the Official Fuel Consumption and Electric Range of Plug-in Hybrid Electric Vehicles in Europe. In Proceedings of the 2017 SAE 13th International Conference on Engines and Vehicles, Capri, Italy, 12–14 September 2017. SAE Technical Paper JRC107229. [Google Scholar]
  17. Zhang, Q.; Li, G. A predictive energy management system for hybrid energy storage systems in electric vehicles. Electr. Eng. 2019, 101, 759–770. [Google Scholar] [CrossRef]
  18. Kruppok, K.; Kriesten, R.; Sax, E. Calculation of route-dependent energy-saving potentials to optimize EV’s range. In 18. Internationales Stuttgarter Symposium 2018; Springer: Stuttgart, Germany, 2018; pp. 1349–1363. [Google Scholar] [CrossRef]
  19. Zhang, L.; Ye, X.; Xia, X. A Real-Time Energy Management and Speed Controller for an Electric Vehicle Powered by a Hybrid Energy Storage System. IEEE Trans. Ind. Inform. 2020, 16, 6272–6280. [Google Scholar] [CrossRef]
  20. Kruppok, K. Analyse der Energieeinsparpotenziale zur Bedarfsgerechten Reichweitenerhöhung von Elektrofahrzeugen. Ph.D. Thesis, Karlsruhe Institut für Technologie, Elektrotechnik und Informationstechnik, Karlsruhe, Germany, 2020. [Google Scholar]
  21. Gutenkunst, C.; Chrenko, D.; Kriesten, R.; Neugebauer, P.; Jaeger, B.; Giereth, T. Route Generating Algorithm Based on OpenSource Data to Predict the Energy Consumption of Different Vehicles. In Proceedings of the 2015 IEEE Vehicle Power and Propulsion Conference (VPPC), Montreal, QC, Canada, 19–22 October 2015. [Google Scholar] [CrossRef]
  22. IPG Automotive GmbH. Reference Manual Version 8.1.1; CarMaker, IPG Automotive Group: Karlsruhe, Germany, 2019. [Google Scholar]
  23. IPG Automotive GmbH. User’s Guide Version 8.1.1; CarMaker, IPG Automotive Group: Karlsruhe, Germany, 2019. [Google Scholar]
  24. Rao, R.; Vrudhula, S.; Rakhmatov, D.N. Battery modeling for energy-aware system design. Computer 2003, 36, 77–87. [Google Scholar] [CrossRef]
  25. Yao, L.W.; Aziz, J.A.; Kong, P.Y.; Idris, N.R.N. Modeling of lithium-ion battery using MATLAB/simulink. In Proceedings of the IECON 2013, 39th Annual Conference of the IEEE Industrial Electronics Society, Vienna, Austria, 10–13 November 2013; IEEE: Piscataway, NJ, USA, 2013; pp. 1729–1734, ISBN 978-1-4799-0224-8. [Google Scholar]
  26. Chen, M.; Rincon-Mora, G.A. Accurate electrical battery model capable of predicting runtime and I-V performance. IEEE Trans. Energy Convers. 2006, 21, 504–511, INSPEC Accession Number: 8919488. [Google Scholar] [CrossRef]
  27. Zhang, H.; Chow, M.-Y. Comprehensive dynamic battery modeling for PHEV applications. In Proceedings of the 2010 IEEE Power and Energy Society General Meeting, [IEEE PES-GM 2010], Minneapolis, MN, USA, 25–29 July 2010; IEEE: Piscataway, NJ, USA, 2010; pp. 1–6, ISBN 978-1-4244-6549-1. [Google Scholar]
  28. Doerffel, D.; Sharkh, S.A. A critical review of using the Peukert equation for determining the remaining capacity of lead-acid and lithium-ion batteries. J. Power Sources 2006, 155, 395–400. [Google Scholar] [CrossRef]
  29. Madani, S.; Schaltz, E.; Kaer, K.S. An Electrical Equivalent Circuit Model of a Lithium Titanate Oxide Battery. Batteries 2019, 5, 31. [Google Scholar] [CrossRef]
  30. Lahyani, A.; Venet, P.; Guermazi, A.; Troudi, A. Battery/Supercapacitors Combination in Uninterruptible Power Supply (UPS). IEEE Trans. Power Electron. 2013, 28, 1509–1522. [Google Scholar] [CrossRef]
  31. Dougal, R.A.; Gao, L.; Liu, S. Ultracapacitor model with automatic order selection and capacity scaling for dynamic system simulation. J. Power Sources 2004, 126, 250–257. [Google Scholar] [CrossRef]
  32. Eldeeb, H.H.; Elsayed, A.T.; Lashway, C.R.; Mohammed, O. Hybrid Energy Storage Sizing and Power Splitting Optimization for Plug-In Electric Vehicles. IEEE Trans. Ind. Applicat. 2019, 55, 2252–2262. [Google Scholar] [CrossRef]
  33. Zubieta, L.; Bonert, R. Characterization of double-layer capacitors for power electronics applications. IEEE Trans. Ind. Applicat. 2000, 36, 199–205. [Google Scholar] [CrossRef]
  34. Letrouve, T.; Bouscayrol, A.; Lhomme, W.; Dollinger, N.; Calvairac, F.M. Different models of a traction drive for an electric vehicle simulation. In Proceedings of the 2010 IEEE Vehicle Power and Propulsion Conference, Lille, France, 1–3 September 2010. [Google Scholar] [CrossRef]
  35. Burress, T. Oak Ridge National Laboratory (ORNL), Research Area: Benchmarking Electric Vehicles and Hybrid Electric Vehicles in FY 2016 Annual Progress Report for Electric Drive Technologies Program (2016); U.S. Departement of ENERGY: Washington, DC, USA, July 2017; pp. 196–207.
  36. Wang, Y.; Wang, L.; Li, M.; Chen, Z. A review of key issues for control and management in battery and ultra-capacitor hybrid energy storage systems. eTransportation 2020, 4, 100064. [Google Scholar] [CrossRef]
  37. Cao, J.; Emadi, A. A New Battery/UltraCapacitor Hybrid Energy Storage System for Electric, Hybrid, and Plug-In Hybrid Electric Vehicles. IEEE Trans. Power Electron. 2012, 27, 122–132. [Google Scholar] [CrossRef]
  38. IPG Automotive GmbH. User Manual Version 8.1.1; IPG Driver, IPG Automotive Group: Karlsruhe, Germany, 2019. [Google Scholar]
  39. Technische Daten BMW i3. Available online: https://www.press.bmwgroup.com/deutschland/article/detail/T0189822DE/technische-daten-bmw-i3-gueltig-ab-03/2014?language=de (accessed on 10 December 2020).
  40. NEDC Emission Test Cycles. Available online: https://dieselnet.com/standards/cycles/ece_eudc.php (accessed on 16 October 2020).
  41. Gutenkunst, C. Prädiktive Routenenergieberechnung eines Elektrofahrzeugs. Ph.D. Thesis, University of Applied Sciences Karlsruhe—IEEM, Karlsruhe, Germany, 2020. [Google Scholar]
Figure 1. Blackbox schematic with input and output data for the route-generating algorithm [21].
Applsci 12 03968 g001
Figure 2. Structure of subsystems used for the virtual vehicle model. The five main subsystems are: the main body, the drivetrain, the steering system, the brakes and the suspension.
Applsci 12 03968 g002
Figure 3. The equivalent circuit the battery model based on [26].
Applsci 12 03968 g003
Figure 4. Relationship between RMSPE/MPE and the number of RC circuits based on [27].
Applsci 12 03968 g004
Figure 5. The equivalent circuit the supercapacitor model is based on [30].
Applsci 12 03968 g005
Figure 6. Block diagram of the modeling concept of the quasi-stationary drivetrain model.
Applsci 12 03968 g006
Figure 7. Mean model error with different torque step size of the stored motor map based on [34].
Applsci 12 03968 g007
Figure 8. Interpolated efficiency map of the BMW i3 based on Oak Ridge National Laboratory based on [35].
Applsci 12 03968 g008
Figure 9. The equivalent circuit the DC/DC converter model is based on [37].
Applsci 12 03968 g009
Figure 10. Layout for the Adaptive Driver Model seperated in two steps: preparation phase and simulation based on [38].
Applsci 12 03968 g010
Figure 11. Speed profile of the simulated NEDC consisting of four equal ECE-15 urban segments and one extra-urban EUDC segment.
Applsci 12 03968 g011
Figure 12. Route from Bruchsal to Karlsruhe and back to Bruchsal with indicated speed limit [18].
Applsci 12 03968 g012
Figure 13. Altitude data of the route from Bruchsal to Karlsruhe and back [41].
Applsci 12 03968 g013
Figure 14. Measured and simulated speed profile of the route from Bruchsal to Karlsruhe and back.
Applsci 12 03968 g014
Table 1. Services available from various providers via application programming interfaces (Traffic Message Channel (TMC), Shuttle Radar Topography Mission (SRTM)) [20].
OSMGoogleTomTomHEREOthers
RouteMapQuest,
Skobbler,
etc.
Directions
API
Routing
API
Routing
API
-
Realtime
traffic
TMCTraffic
API
Routing
API
Traffic
API
-
ElevationOpen-
Elevation
API
Elevation
API
Search
API
Routing
API
SRTM
WeatherOpen-
Weather
API
-Advanced-
Weather
API
Destination-
Weather
API
SolCast
Speed
limit
Overpass
API
Geocoder
API
-Routing
API
-
Traffic
light
Overpass
API
--Advanced
Data sets
-
Bridge/
Tunnel
Overpass
API
----
Table 2. Parameters of the modelled BMW i3.
ValueUnit
Curb Mass1195kg
Engine Power125kW
Max. Torque250Nm
Max. Velocity150km/h
Length3999mm
Width1775mm
Height1579mm
No. of Electric Motors1-
Capacity of Battery61Ah
Voltage360V
Table 3. Characterized parameters of the lithium-ion cell of Samsung SDI.
ValueUnit
Nominal Voltage3.7V
Nominal Capacity61Ah
Min./Max. Voltage2.70/4.10V
Material CathodeNCM
(Nickel-Cobalt-Manganese)
Table 4. Specifications of the Maxwell/BCAP3000 supercapacitor.
ValueUnit
Nominal Voltage2.7V
Capacitance3000F
ESR0.29
Usable Specific Power5.9kW/kg
Specific Energy6.0Wh/kg
Stored Energy3.04Wh
Operating Temperature
range (min./max.)
−40/65°C
Storage Temperature
range (min./max.)
−40/70°C
Mass (typical)510g
Table 5. Validation of the determined simulation results of the NEDC.
UnitLiteratureSimulationDeviation in (%)
Distancekm10.9311.010.73
Durations118011800.00
Rangekm190188−1.05
Energy DemandkWh/100 km11.5811.721.21
Publisher’s Note: MDPI stays neutral with regard to jurisdictional claims in published maps and institutional affiliations.