Article

Automotive Seat Comfort and Vibration Performance Evaluation in Dynamic Settings

1
Seat Comfort Engineering, Lear Corporation, Southfield, MI 48033, USA
2
Department of Envrionmental and Occupational Health Science, University of Washington, Seattle, WA 98105, USA
3
School of Biological and Population Health Science, Oregon State University, Corvallis, OR 97331, USA
*
Author to whom correspondence should be addressed.
Appl. Sci. 2022, 12(8), 4033; https://doi.org/10.3390/app12084033
Submission received: 18 March 2022 / Revised: 12 April 2022 / Accepted: 13 April 2022 / Published: 16 April 2022
(This article belongs to the Special Issue Comfort Congress 2021)

Abstract

:
An automotive seat is a key component which not only provides restraint and support for its occupant, but also mitigates vibration. Since an automotive seat is in constant contact with the vehicle occupant, its dynamic comfort is of great importance in automotive seat designs. In this study, three automotive seats with different foam firmnesses were evaluated to understand how the foam firmness, through different foam formulations, affected the seat vibration performance and perceived dynamic comfort in a laboratory (study 1) and field setting (study 2). In a repeated-measures laboratory based study, whole-body vibration (per ISO 2631-1), self-reported body discomfort, and seating comfort were measured and compared among the three automotive seats while participants were exposed to tri-axial, field-measured, automotive vibration and X-Y-Z axis 1–30 Hz sine sweeps. In a subsequent ride-and-drive field study, the two seats that received the highest comfort ratings from the laboratory study were installed in two identical vehicles and whole body vibration (WBV) and self-reported seating comfort were evaluated by the participants. The results showed that the foam firmness significantly affected WBV measures and self-reported comfort (p < 0.05). This study demonstrated that altering foam formulation can be an effective way of further improving dynamic vibration and seat comfort performance.

1. Introduction

Whether it is in conventional driving or riding in an autonomous vehicle, the automotive seat continuously supports the vehicle occupants and has the greatest effect on the overall ride-and-drive comfort. Of all the components within the seat, the foam consists of the most volume, has the largested contact areas as a primary interface between the seat and occupants, and provides the most direct support to the occupant. Therefore, it plays a key role in the occupants’ seating comfort. Foam mechanical properties, including density and firmness, are known to affect contact pressure, buttocks tissue oxygenation, and perceived seating comfort [1,2,3]. In addition, previous studies have shown that these foam properties can also mitigate vibration being transmitted from the vehicle floor to the occupants, and therefore impact the occupants’ perceptions on their riding experiences [4,5].
Extensive research has indicated that foam mechanical properties such as firmness and vibration transmissibility can significantly affect the occupants’ seating comfort and body discomfort [6,7,8,9,10]. However, these studies also have some notable limitations. For example, the standardized vibration testing for seat comfort evaluations specified by SAE [11] uses a sine sweep input, rather than actual field-measured vibration profiles. Therefore, such tests only measure the seat mechanical properties and do not directly translate to the occupants’ perceptions on seating comfort in real-life driving or riding scenarios. Additionally, most studies which evaluated the effects of the foam characteristics on seating comfort have been conducted in static, short term, laboratory settings [11,12]. Because commonly-used automotive seating foams (open cell polyurethane foam) have time dependent viscoelastic material properties [13,14,15,16], the existing short-term evaluations may not provide accurate implications for longer-term dynamic comfort. Hence, it is of great importance to evaluate seating comfort with suitable time durations to account for time-dependency nature of the foam mechanical properties.
The foam mechanical properties are known to affect the occupants’ vibration exposures. The vibration transmitted from a vehicle to the human body is defined as whole body vibration (WBV) [17]. WBV has long been associated with various adverse health outcomes, especially in the lower back and neck regions [18,19,20,21]. Other studies have indicated that WBV substantially affects a vehicle occupant’s perceptions of seating comfort, fatigue, and alertness, especially for longer-term (>45 min) driving and riding scenarios [4,5,22,23]. Extensive research on WBV has been carried out on commercial vehicles which widely use active, mechanical or pneumatic suspension systems to mitigate vibration [21,24,25]. On the contrary, passenger vehicles mostly rely on the seat cushion foam for damping and vibration isolation [26]. Because the seat foam is a sole source for vibration mitigation in passenger vehicles, it is important to understand how different mechanical properties of the seat foam affect WBV and associated seating comfort. While previous studies evaluated the effects of foam properties on WBV and related comfort measures, those comfort studies used rigid laboratory-built testing seats or disassembled incomplete automotive seats in laboratory settings [8,27,28]. Such incomplete testing seats usually have inferior surface, bolstering, and body support compared to those currently in the market, which can significantly affect WBV exposures and associated comfort measures. Moreover, as occupants’ perceived seating comfort is affected by both physical and psychologoial factors [29], the existing laboratory studies may not accurately characterize realistic seating comfort as compared to field-based studies on the real road. Therefore, those existing comfort study results may be confounded with potential noises due to those unrealistic settings (i.e., laboratory and incomplete seats).
Hence, to fill these research gaps and further understand the effects of different seat foam properties on WBV and dynamic seating comfort, it is critical to adopt comprehensive evaluation methods that consist of a controlled study in a laboratory setting which controls potential confounding factors, supplemented by an on-road ride-and-drive field study for realistic validations. Thus, the goals of this study were to determine whether altering seat foam mechanical properties had any effect on WBV exposure, perceived dynamic seating comfort, and desirability in both a controlled laboratory setting and subsequent field-based longer-term riding conditions.

2. Materials and Methods

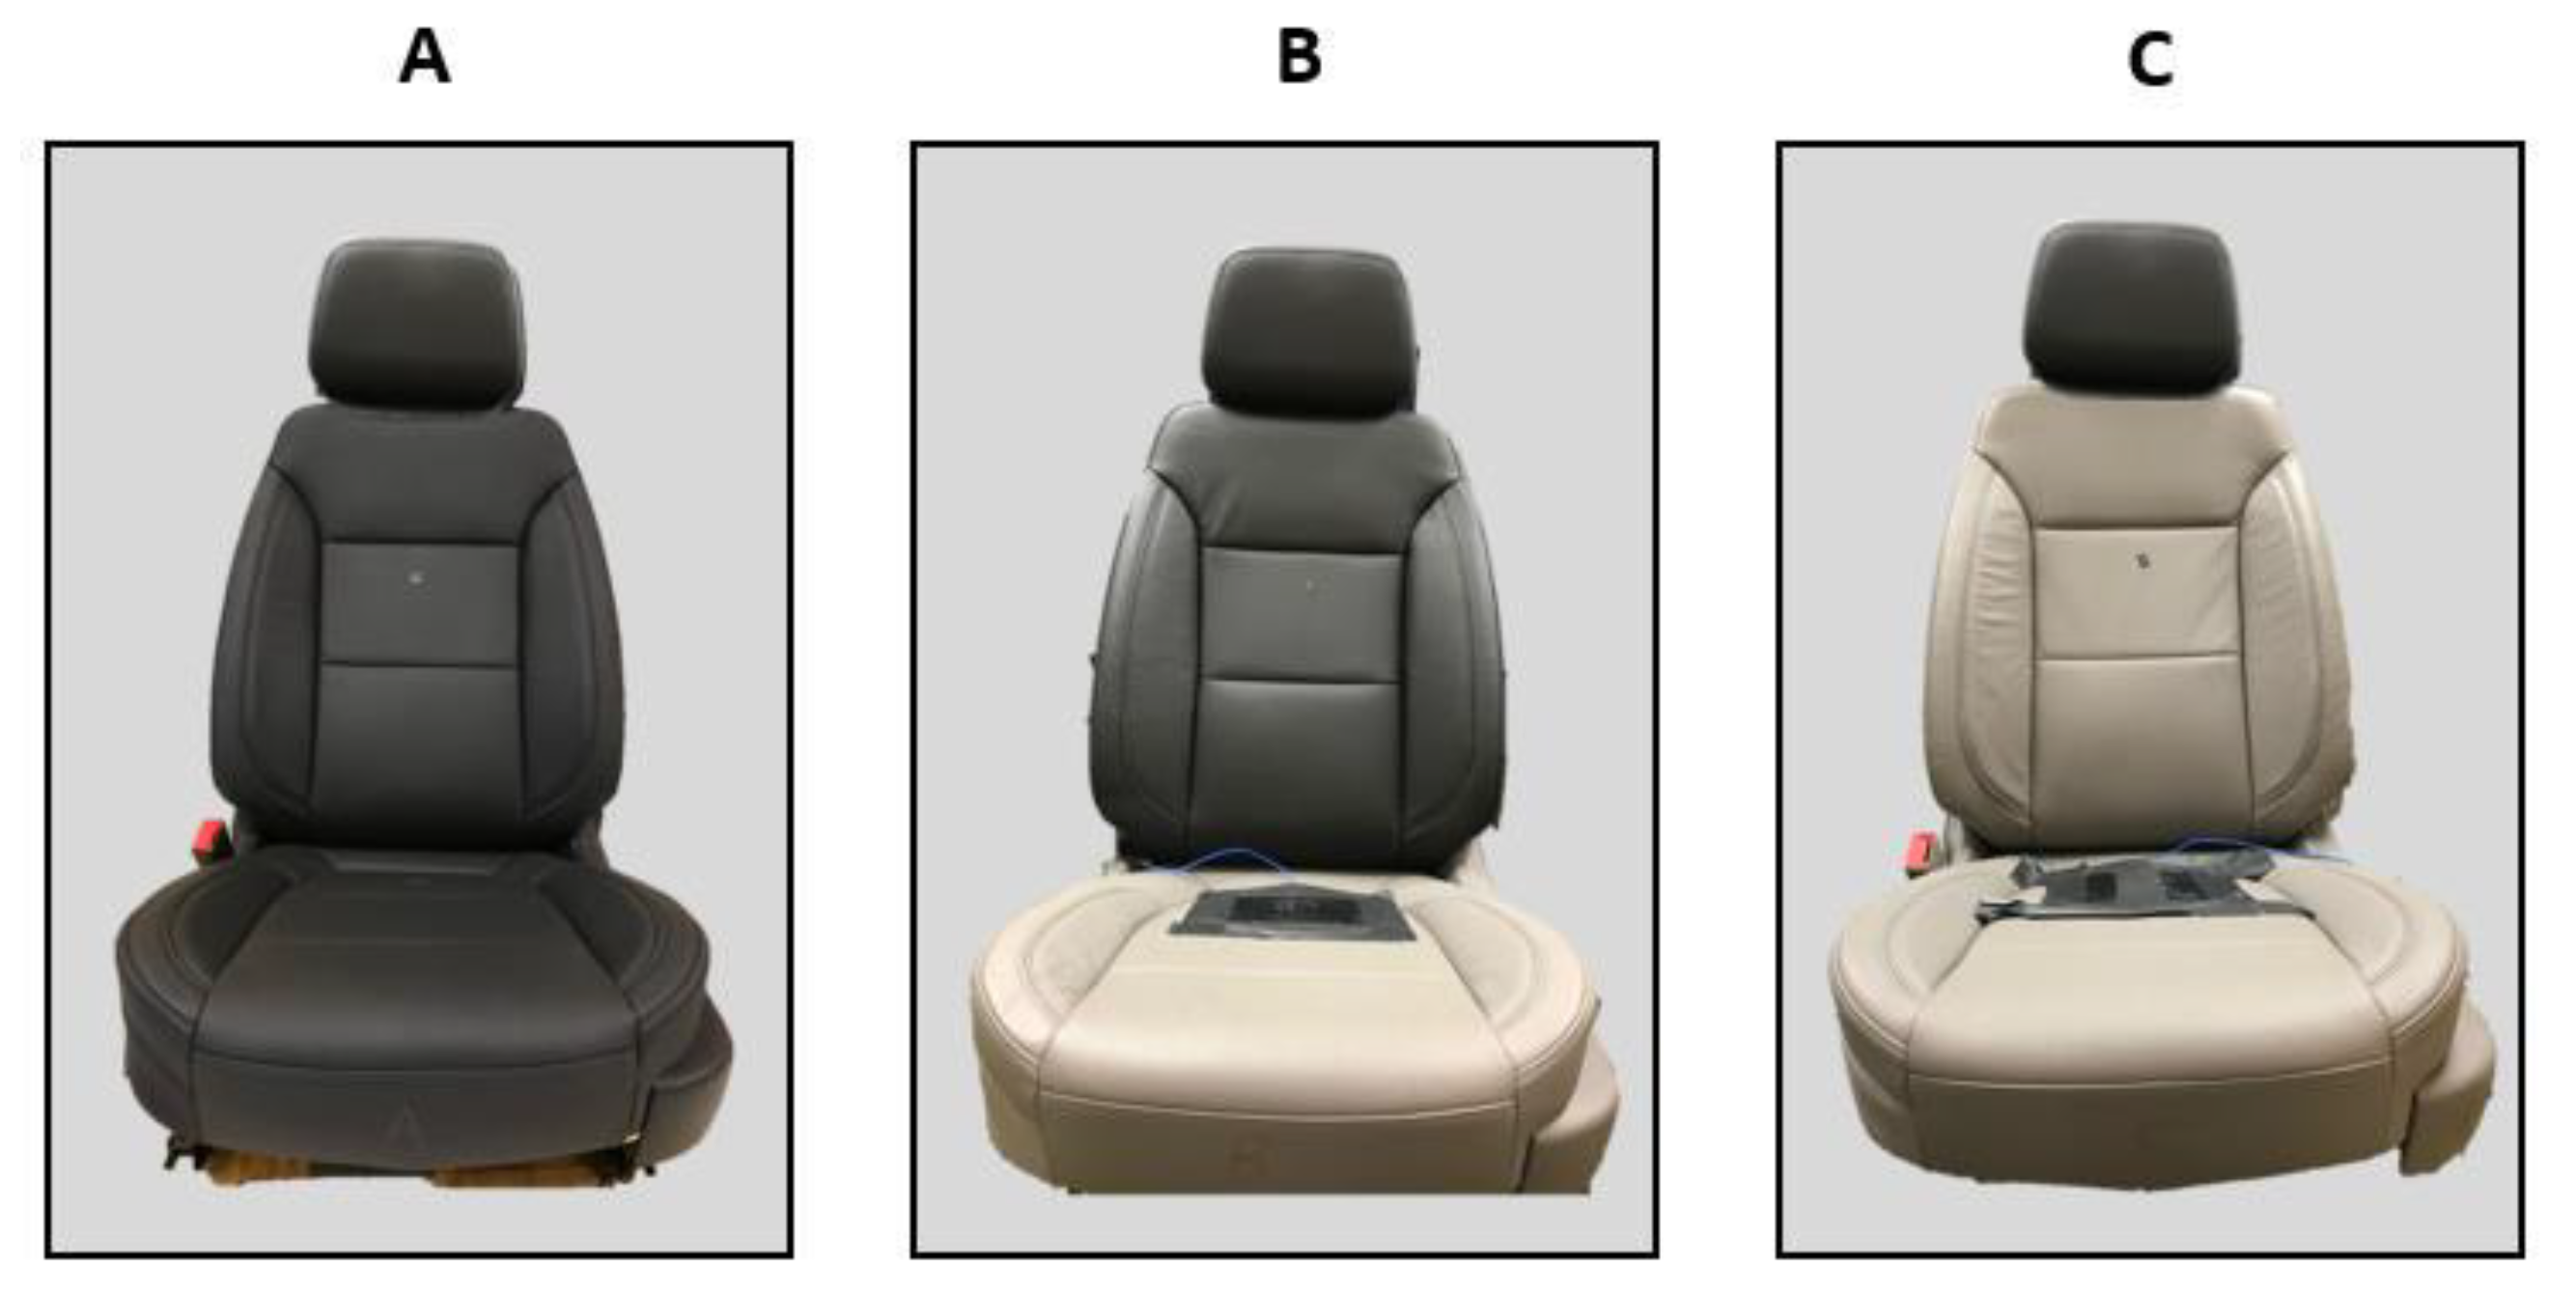
2.1. Seat Sample Preparation

Full-size pick-up truck seats were selected for this study. Three seats were built with base level attributes (i.e., only with simple adjustment functions, no heating, venting, or pneumatics were included) to eliminate potential bias on seating comfort perceptions (Figure 1). The three seats were identical except for the foam in the seat cushions, which were specially formulated for this study. Seat B used the current production foam, whereas Seat A and Seat C contained foams with different chemical formulations. All three foams had the same density of 58 ± 3 kg/m3.
Three cushion foam pads were tested per ASTM D3574 [12] prior to being assembled into the seats. The mechanical properties are shown in Table 1 and their definitions are as follows:
Foam Firmness was evaluated by the indentation force (load) deflection test and summarized as 50% indentation load in newtons.
Support factor (also known as compression modulus) indicates foam’s ability to support weight. The support factor was calculated by the ratio of 65% to 25% indentation loads obtained from the indentation force deflection test. The greater support factor measurements indicate that the foam can better sustain the weight while the lower support factor indicates that the foam more easily bottoms out.
Hysteresis loss was also evaluated by the indentation force deflection test and defined as the difference between loading and unloading portion (energy) of the load-deflection curve expressed as a percentage of the loading energy. As hysteresis loss indicates how much energy the foam can absorb, the foam with the higher hysteresis loss can better absorb vibration.
All three seats, which were in a new and unused state, were evaluated using basic mechanical characterizations according to SAE J2896 [11]. The overall seat cushion foam hardness (i.e., load-deflection curve) as well as vibration transmissibility are shown in Figure 2. The mechanical property measures showed that Seat A was the firmest, followed by Seat B, and Seat C was the softest (Table 1, Figure 2 Left). Although the three seats differed in the foam firmness, the support factors (defined as load ratio of 65% indentation over 25% indentation [12]) remained comparable. Seat A and Seat C had less hysteresis loss than Seat B. Differences in hysteresis may affect the effective stiffness and energy management of the foam while being exposed to vibration. Both Seat B and Seat C had lower vibration transmissibility than Seat A. Seat C also had lower resonance frequency than Seat A and Seat B (Figure 2 Right).
Overall, these three seats were specially built so that, when comparing between the newly formulated seats (Seat A and C), the firmness and peak vibration transmissibility were the major differentiators. When comparing between Seat B (current production) and Seat C, the hysteresis loss and the resonance frequency were the major differentiators per standardized SAE J2896 testing specifications.

2.2. Laboratory Evaluation

2.2.1. Participants

A total of 10 participants (5 males, 5 females) were recruited to participate in a laboratory study via emails and printed flyers throughout a university community. Participants’ eligibility criteria included a minimum of 3 years of driving experience; no current (in the past 7 days) musculoskeletal pain and history of musculoskeletal disorders in the neck, shoulder, back regions; age of 18 years or older; and no pregnancy. These criteria were chosen to minimize the potential risk for injuries while being exposed to WBV during the test procedures. The demographics are shown in Table 2. Participants on average drove 6674 miles per year, with the range of 540–21,600 miles. All participants confirmed their eligibility as self-reported during the screen process. The study protocols were reviewed and approved by the University’s Institutional Review Board (IRB# IRB-2019-0323).

2.2.2. Lab Test Protocols

The study was designed as a repeated-measures double blinded test (neither the researchers or participants were aware of or knew the differences among the seats) with a randomized seat testing order. Three test seats were installed on a six degree-of-freedom motion platform that created different WBV exposures in a laboratory setting. Prior to the experiment, all the participants were briefed on the study objectives and protocols, and gave their written consent. Then, anthropometric and demographic data were collected to adjust the seat. The seat height was adjusted to make the thighs parallel to the floor while the seatback angle was set at 110 degrees (i.e., 20 degrees reclined) per ergonomic guidelines [30]. Participants were not allowed to adjust the pre-determined seat back angle to avoid any potential confounding due to different postures.
Before being exposed to the vibration, the first impression ranking data were collected based on the participants’ initial preference and overall comfort. Then, each participant sat for 45 min in each seat with a 10-min break between seats (Figure 3). The 45-min testing time per seat consisted of real tri-axial field-measured vibration (15 min) and sinusoidal vibration (30 min). Perceived body discomfort was collected via the Borg-100 questionnaire before the vibration exposure and at the end of each vibration condition (indicated with the black arrows in Figure 3). Seating comfort was measured with a Likert 7-point questionnaire before the vibration exposure and at the end of field vibration and sinusoidal vibration exposure (red arrows in Figure 3). After completing all the conditions, the post ranking was collected based on the participants’ post preference and overall comfort.

2.2.3. Laboratory Vibration Exposures

To expose the participants to the field-measured and sinusoidal vibration, a 6-degree-of-freedom motion platform (MB-E-6DOF/24/1800KG; Moog Inc.; East Aurora, NY, USA) was used.
For the field-measure vibration exposures, tri-axial vibration was collected at 1280 Hz using a data recorder (DA-40; Rion Co. LTD; Tokyo, Japan) with a tri-axial accelerometer (352C33; PCB Piezotronics; Depew, NY) magnetically mounted to the floor below the driver’s seat of a sedan (2015 Hyundai Sonata) and an SUV (2019 GMC Yukon XL). To obtain representative vibration exposure input, a sedan and a SUV were chosen as they account for the largest proportion of passenger car markers. Tri-axial vibration was measured while the vehicles were going over city streets, freeway, a cobblestone road, speed bumps, speed humps, and expansion joints on a freeway. The field-measured vibration was iteratively brick wall filtered and converted to displacement data by integration. Detailed information on the raw data processing and conversion is available in our previous studies [31,32,33]. Our validation studies have shown that the mean RMS errors between the field-measured vibration and the vibration output from the motion platform were less than 1% [31].
For the sinusoidal vibration exposures, continuous sine sweeps (1–30 Hz) with peak amplitudes of ± 0.5, 1.0 and 1.5 m/s2 in each of the X, Y, and Z axes were created using a motion platform control software program (Moog Inc.; East Aurora; NY). The frequency range was determined based on previous findings that most of the WBV energy content is below 30 Hz; the amplitudes were chosen to encompass the daily vibration action (0.5 m/s2) and exposure limit values (1.15 m/s2) included in the the European Union (EU) Vibration Directive [34].

2.2.4. Measures

WBV

While the participants were being exposed to the actual field-measured and sinusoidal vibration on the motion platform, raw unweighted vibration data were collected at 1280 Hz using a data recorder (DA-40; Rion Co. LTD; Tokyo, Japan) with a tri-axial seat-pad accelerometer (Model 356B40; PCB Piezotronics; Depew, NY, USA) mounted on the testing seats and an additional tri-axial accelerometer (352C33; PCB Piezotronics; Depew, NY, USA) magnetically mounted to the floor of the motion platform according to the ISO 2631-1 WBV standard [17]. The raw unweighted acceleration data were filtered, weighted, and analyzed to calculate root-mean-square (RMS) weighted average vibration (Aw), as shown below. Aw was then normalized to daily equivalent vibration exposure measures [A(8)]:
A w = [ 1 T 0 T a w 2 ( t ) d t ] 1 2
where A w (t): instantaneous frequency-weighted acceleration at time, t; T: the duration of the measurement, in seconds.
Power spectral density (PSD) analyses were also performed to determine how the foam characteristics of the three seats impacted the vibration energy as a function of frequency (m2/s4/Hz). A custom-built LabVIEW program (Version 2018; National Instruments, Austin, TX, USA) was used to extract and summarize the vibration energy content over the frequency range from 0.5 to 30 Hz with a frequency resolution of 0.5 Hz.

Self-Reported Measures

Pre-/post- rankings were collected based on participants’ preferences. The Borg CR-100 scale was used to evaluate self-reported localized body discomfort in the upper and low back, shoulders, neck, ankles/feet, knees, thighs, and tailbone (0 being no discomfort at all; 100 being maximal discomfort). Perceived seating comfort was measured using a 7-point Likert scale (1 being least comfortable; 7 being most comfortable).

2.2.5. Statistical Analyses

The independent variable was ‘seat’; the dependent variables included WBV [A(8)], self-reported body discomfort, seating comfort, and seat ranking. WBV [A(8)], self-reported body discomfort, and seat comfort data were analyzed via a mixed model with restricted maximum likelihood estimation (REML) in JMP (Pro 13; SAS Institute Inc., Cary, SC, USA) to determine whether there were differences in WBV and seating comfort measures among the three seats. To account for within-subject correlation, ‘subject’ was included as a random effect while ‘seat’ was the fixed effect in the mixed model. Any statistical significance was followed up with post-hoc multiple comparisons by adjusting type I errors (Tukey HSD). Pre-post ranking data were analyzed using χ 2 tests. Statistical significance was determined when p < 0.05.

2.3. Field Evaluation

After the laboratory study, the two seats rated more comfortable (Seat B and Seat C) were selected for a subsequent on-road field testing to evaluate the two seats in realistic riding and driving settings.

2.3.1. Participants

Twelve adult participants (8 males, 4 females) were recruited from a company campus (demographics shown in Table 3). The eligibility criteria included: being able to sit in the moving vehicle for two hours without any body pain; over 18 years old; and not being pregnant. The participants provided their ages as age groups (7 in 20 s, 1 in 30 s, 2 in 40 s, 1 in 50 s, and 1 in 60 s). The participants provided verbal consents and the study followed company’s guidelines for on-road ride and drive testing with the ISO accredited lab personnels stationed in the vehicle.

2.3.2. Field Test Protocols

This field evaluation was based on a repeated-measures design with a randomized seat order. The participants had no prior knowledge about the seats being tested. The two seats were installed in two identical vehicles (2021 Chevy Silverado). Silverado was used, as the Yukon (which vibration tested in the lab study) and Silverado share the same platform and components, including the seats. Therefore, the participants’ exposure to vibration and sitting postures were expected to be comparable. Prior to driving, the participants were allowed to adjust the seats to their comfort preferences. Then, they drove the two vehicles over the same test route for 50–60 min per vehicle with a 5–10 min break between testing in each vehicle. The test route consisted of two segments of highway, one segment of dirt road, one segment of city street, and one segment of freeway. WBV was collected during the test ride; perceived seating comfort was collected before and after the test ride.

2.3.3. Measures

WBV

Vibration data were collected at a sampling rate of 2048 Hz with two tri-axial accelerometers (Model 356A44; PCB Piezotronics; Depew, NY, USA) instrumented in each seat (per vehicle): one in the cushion foam under right Ischial Tuberosity (IT); and one at the rear end of the front passenger seat track (Figure 4). The two accelerometers were aligned to provide the most accurate measurement of vertical vibration transmissibility.
Vibration data were processed in HEAD Acuoustics Artemis (HEAD acoustics GmbH, Hersogenrath, Germany) software with following parameters: sepctrum size: 8192; windowing: Hanning; overalpping: 90%; FRF estimator: H1. The transmissibility was defined as the transfer function of the acceleration ratio between the cushion and seat track. The attenuation frequency here was defined as the frequency that was higher than resonance frequency (where the peak transmissibility occurred), and at the frequency where the transmissibility value fell below 1 (Figure 5). As can be seen from Figure 4, 4.x Hz was the resonant frequency and 7.x Hz the attenuation frequency.
The weighted average vibration (Aw) values were calculated per ISO 2631-1. Seat Effective Amplitude Transmissibility (SEAT) values [35] were then calculated as the vibration ratio for Aw between the cushion and seat track (i.e., truck floor) in order to compare the vibration performance between the two seats.

Self-Reported Seating Comfort

Before and after each ride, self-reported seating comfort was evaluated using a custom-designed comfort questionnaire [26]. The participants were asked to rate the seat firmness and support on a 5-point scale (i.e., too little support being −2, and too much support being 2, with ideal being 0) and the overall comfort of the complete seat on a 10 point scale (with 1 being very uncomfortable and 10 being very comfortable). The participants were also asked about their perception of the vibration for each of the 5 road segments at 7 different body regions (Feet/Lower legs, Thigh, Buttocks/Hips, Lower back, Middle Back, Upeer back/Shoulder, and Neck/Head). The participant’s perception for vibration on the 7 body regions was recorded as Y/N. If they felt the vibration on one body region, it was counted as one vibration felt on that body region.

2.3.4. Statistical Analyses

Paired t-tests (Minitab 18, Minitab LLC, PA, USA) were used to determine whether there were any differences in peak transmissibility, resonance frequency, attenuation frequency, SEAT, and self-reported seating comfort ratings as well as vibration perceptions between the two seats. Statistical significance was determined when p < 0.05.

3. Results

3.1. Laboratory Vibration Exposures

3.1.1. Simulation of Field-Measured Vibration Exposures

As no differences in WBV among the three seats were observed for the field-measured sedan and SUV profiles, the WBV data from the sedan and SUV were combined for the data analysis. The A(8) values showed that WBV exposures were predominant in the vertical direction (Z-axis). The A(8) values on the speedbumps, speedhumps, and cobblestone segments were higher than the EU daily vibration action limit (0.5 m/s2) [34,36] as shown in Table 4. There were very small differences among the seats in the X-axis vibration exposures with Seat C having slightly higher exposures. There were no differences in the Y-axis WBV exposures among the seats. The Z-axis WBV exposures showed small differences among the seats with Seat C having the lowest exposure. In general, the seat-measured A(8) values tended to be higher than the floor-measured values except for the speedbump segment. When comparing the three seats, Seat C had the lowest A(8) values for all six road segments (p < 0.0001). Moreover, Seat C had superior vibration attenuation performance in the speedbumps, speedhumps, and expansion-joint segments where the vibration was more impulsive than the city street or freeway segments. Lastly, Seat C was the only seat that reduced the vibration magnitudes over the expansion joint segment.
The PSD analyses indicated all seats amplified low to mid frequency energy in all three axes for all road segments. The Z-axis was the dominant axis for vibration exposure. As a representative example, Figure 6 shows the weighted PSD curves on the X,Y, and Z axes from the city street segment. The results showed that all the three seats attenuated the Z-axis vibration energy above 9 Hz, as indicated by all three seat lines being below the black line (floor). While all the three seats amplified the Z-axis vibration energy between 2.5 and 8.5 Hz, Seat C attenuated Z-axis vibration energy above 6 Hz more so than the other two seats.

3.1.2. X-Y-Z Axis Continuous Sine Sweep Vibration

At all three different amplitudes: 0.5 m/s2, 1.0 m/s2, and 1.5 m/s, the results showed the same trends. Small differences in the seat vibration attenuation performance were observed on the X and Y axes, whereas moderate differences were observed on the Z-axis. As shown in the Z-axis sine sweeps in Figure 7, Seat C had the lowest resonance frequency (3.2 Hz) and amplified the input by 2.1-fold at the resonance frequency. Seat A and Seat B had a resonant frequency of 3.5 Hz and amplified the vibration by 1.8- and 1.7- fold at the resonant frequency, respectively. Seat C also attenuated the vibration at lower frequencies (down to 6 Hz) compared to Seat A and Seat B only attenuating the vibration down to 8 Hz. The transmissibility results from this laboratory study mirrored the SAE J2896 vibration transmissibility results which were collected without humans sitting on the foam (Figure 2).
In addition, as shown in Figure 8, all seats amplified the low frequency X-axis vibration(1–3 Hz) and attenuated the intermediate frequency vibration (3–15 Hz). For the Y-axis vibration, all seats amplified the vibration over the whole frequency range with Seat B amplifying the Y-axis vibration more than Seats A and Seat C.

3.1.3. Subjective Vibration Comfort

The first impression ranking data showed that Seat C was rated the highest (p = 0.015) when compared to Seat A and Seat B. The post ranking data showed that Seat C was still ranked the highest; however, the differences were no longer significant (p = 0.65).
Perceived body discomfort data showed that exposure to either field-measured or sinusoidal vibration did not affect the perceived body discomfort measures (most discomfort < 10 in 0–100 scale) as shown in Table 5. Despite the limited changes, the perceived body discomfort was consistently lower with seat C in most body parts for both the field-measured vibration and the sinusoidal vibration exposures (Table 5).
The dynamic seating comfort rating data showed that all the three seats were rated as relatively comfortable (ratings > 4 in the 1–7 scale) as shown in Figure 9. Seat C was consistently and significantly rated higher for the eight criteria compared to Seat A and Seat B (Figure 9).

3.2. Field Vibration Exposures

3.2.1. Vibration Measures

For the on road ride-and-drive field evaluations, Seat C (best WBV attenuation performance and most preferred in the laboratory study) and Seat B (the second most preferred and current production) were compared.
No significant differences were observed between Seat B and Seat C for the resonance frequency or peak transmissibility across all five road segments (p > 0.05). However, as shown in Figure 10, Seat C had lower attenuation frequency and lower Aw SEAT values for all the road segments compared to Seat A and Seat B.

3.2.2. Subjective Measures

Overall seating comfort rating changes before and after riding/driving were compared among the three seats. Seat C had a significantly smaller decrease in overall comfort (p = 0.02) and current seating comfort level (p < 0.001) as compared to Seat B. Additionally, Seat C also exhibited smaller changes in cushion comfort and overall seat comfort than Seat B. Seven out of the 12 participants reported feeling tired with Seat B, whereas only two participants reported feeling tired after using Seat C.
Additionally, the participants reported the body regions where they noticed the vibration. Over the entire route, most vibrations were felt under the buttocks and lower back. Seat B had a total of 187 noticeable vibration events across seven body regions (feet/lower leg, thigh, buttocks, lower back, middle back, upper back/shoulder, and neck/head) for all 12 participants, whereas Seat C had a total of 167 noticeable vibrations.

4. Discussion and Conclusions

This study evaluated the effects of different foam properties of automotive seats on WBV, self-reported localized body discomfort, seating comfort, and seat preferences in both a laboratory and a field setting. The results showed that the seat foam firmness and hysteresis loss affected WBV, various body discomfort, and seating comfort measures. The study findings indicate that altering mechanical foam properties through foam formulation may be an effective way to improve an occupant’s seating comfort while reducing exposure to WBV in passenger cars.

4.1. Seat Vibration Performance

Mechanical properties of the testing seat foam were measured prior to the human vibration laboratory testing. Seat A was the firmest, followed by Seat B, and Seat C was the softest (Table 1). Seat A and Seat B had a higher resonance frequency than Seat C (Figure 2). Seat A also had higher vibration peak transmissibility frequency than Seat B and Seat C (Figure 2).
With respect to the field-measured vibration profiles, the X- and Y-axes WBV showed small to no differences among the three seats (Table 4). On the Z axis, Seat C had better vibration attenuation performance than Seat A and Seat B, exhibiting the lowest vibration magnitudes on all six road profiles (Table 4). All seats amplified the cyclic exposures (i.e., vibration profiles from city streets, freeway, a cobblestone road). Mid to high-frequency attenuation from Seat C might have played a greater role than the lower- frequency amplification (Seat A and Seat B) when it comes to seat vibrational performance.
The Z-axis WBV measures showed that Seat C had greater low-frequency amplification and greater higher-frequency attenuation than Seat A and B (Figure 7). Seat A and Seat B had better low frequency (<3 Hz) performance, whereas Seat C was the best for the intermediate frequency (3–6 Hz) performance. Seat C also attenuated more vibration energy above 6 Hz than Seats A and B. Because Seat C was most preferred in seating comfort and less vibration perceiption in the body parts, the intermediate and higher vibration frequency may play an important role in perceived seating comfort.
Furthermore, the ride-and-drive test on the real road showed that Seat C had significantly lower attenuation frequencies and lower Aw SEAT values in all five road segments, with 4 out of 5 profiles and 3 out of the 5 road profiles differences reaching significance, respectively. This lower attenuation frequency and lower SEAT value from Seat C mirrored the findings from the laboratory test.

4.2. Seating Comfort and Body Discomfort

From the laboratory seating comfort evaluations, Seat C was ranked the most comfortable for both pre- and post-vibration exposures. The perceived comfort data showed that Seat C also had significantly higher ratings for seat comfort, cushion firmness, cushion width, bolstering, backrest width and height (Figure 9). Given the foam firmness data (Table 1), this indicated that the participants might prefer a softer seat. Interestingly, the participants had different perceived comfort on the seat dimensions (e.g., bolstering, width and height) even though all three seats were identical in those dimensions. This indicates that foam mechanical properties can affect the participants’ perception not only on overall comfort and firmness, but also percieved seat dimensions through potential differences in the contact areas. This was also in line with the ride-and-drive test on the real road, in which the performance and preference of Seat B and Seat C were compared. Although both seats were perceived firmer than ideal and the feeling of firmness increased post-ride, Seat B was still perceived firmer than Seat C and did not sustain the seating comfort level (i.e., the comfort score had a greater decrease) as good as Seat C did during the 1-h ride-and-drive tests. More interestingly, most participants felt “not tired” to “relaxed” after sitting on Seat C, whereas most participants felt “tired” after using Seat B.
The localized body discomfort measures showed all three seats had relatively low body discomfort levels. Seat C consistently showed lower body discomfort ratings on most of the body regions. The greater body discomfort observed in the tailbone regions from the laboratory study was likely due to the participants sitting on the seat-pad accelerometers. This presumable discomfort bias was eliminated during the subsequent on-road test where the researchers were able to instrument the accelerometers below the surface cover (trim) of the seat but flush with cushion foam pad surface. Nevertheless, from the ride-and-drive test, Seat C again had a lower number of noticeable vibration reportings when compared to Seat B. The majority of the noticeable vibrations were felt under the buttocks and in the lower back regions for both seats.

4.3. Conclusions, Limitations, and Future Work

This study was the first of its kind to systematically and more holistically evaluate vibrational dynamic seating comfort from the isolated foam testing to complete intact seat testing with both objective and subjective measures [37,38]. The study results showed that the seat firmness and hysteresis loss significantly affected WBV exposures and several key indicators for seat vibration performance, including resonance frequency, vibration transmissibility, and attenuation frequency. Moreover, the foam mechanical properties significantly affected the participants’ perception not only on overall comfort and firmness, but also percieved seat dimensions. These results indicate that changing the foam formulation is a potential way to mitigate vibration at certain frequencies in automotive seats.
While this study has many notable strengths, there are a few potential limitations in this study. First, although the duration of vibration exposure was over 45 min in both the laboratory and on road ride-and-drive field studies, it may not have been long enough to characterize “long-term” comfort. While one study suggested a testing duration of 45 min as the minimum time required to quantify “long term” comfort [15], other studies suggested a minimum of 90–120 min of vibration exposures for evaluating long-term dynamic comfort [13,39]. Therefore, future studies aiming to evalute long-term comfort should consider longer exposure durations. Another limitation was potential heterogeneity between the laboratory and on-road study participants. We attempted to match the participant sex and body stature/mass distributions between the two studies. However, as they were not the same participants, the outcome measures may not be directly compared between the studies. Nonetheless, the results showed relatively consistent trends between the laboratory and on-road studies.
This study has provided a foundation on how to more comprehensively measure foam mechanical properties and their effects on seat vibration performances and perceived comfort. Future work includes understanding how other foam chemical and mechanical parameters might impact seat vibration performance as well as performing a larger scale study with longer vibration exposure times and a large sample size.

Author Contributions

Conceptualization—W.P.-Z., M.P., P.W.J., J.H.K.; methodology—W.P.-Z., P.W.J., J.H.K..; software—P.W.J., J.H.K..; validation—W.P.-Z., P.W.J., J.H.K.; formal analysis—P.W.J., J.H.K.; investigation—W.P.-Z., P.W.J., J.H.K.; resources—M.P., W.P.-Z., P.W.J., J.H.K.; data curation—P.W.J., J.H.K..; writing—W.P.-Z., P.W.J., J.H.K..; writing—review and editing—W.P.-Z., P.W.J., J.H.K.,.; visualization—W.P.-Z., P.W.J., J.H.K.,.; supervision—P.W.J., J.H.K.; project administration—W.P.-Z., J.H.K.; funding acquisition—M.P., W.P.-Z., P.W.J. All authors have read and agreed to the published version of the manuscript.

Funding

This research received no external funding.

Institutional Review Board Statement

The study was conducted in accordance with the Declaration of Helsinki, and approved by the Institutional Review Board of Oregon State University (protocol code IRB-2019-0323and 11/18/2019).

Informed Consent Statement

Informed consent was obtained from all participants involved in the study.

Data Availability Statement

Not applicable.

Acknowledgments

The authors would like to thank Kiana Kia, Hakim Ishak, Ed Lee, and Kevin Briggs for their contribution in data collection and process. We want to acknowledge and thank the participants in the study, Jennifer Ibbotson-Brown, a Research Scientist at the University of Washington for developing the vibration analysis software, NIOSH and the Washington State Medical Aid and Accident for financially supporting the development of the vibration analysis software, and Lear Corporation for developing and supplying the three seats and providing the funding to conduct the study. This work has been previously presented at the 2020 annual meeting of the Human Factors and Ergonomic Society [37] and 2021 International Comfort Congress [38].

Conflicts of Interest

The authors declare no conflict of interest.

References

  1. Blair, G.R.; Milivojevich, A.; Pageau, J.-G.; van Heumen, J.D. Automotive Seating Comfort; Defining ComfortProperties in Polyurethane Foam. SAE Trans. 1999, 108, 504–514. [Google Scholar]
  2. Ishii, N.; Matsumoto, T.; Ao, T. Development of High-Performance PUF and Organoleptic Evaluation of Polyurethane Foam for Car Seat. Honda R&D Technical Review. 2014, 26, 139–149. [Google Scholar]
  3. Murakami, S.; Saiki, K.; Hayashi, M.; Satou, T.; Fukami, T. A Newly Developed Mdi-Based Polyurethane Flexible Foam for Automotive Seat Cushion Having Both Superior Static and Dynamic Properties. J. Cell. Plast. 2001, 37, 249–261. [Google Scholar] [CrossRef]
  4. Ebe, K.; Griffin, M.J. Qualitative Models of Seat Discomfort Including Static and Dynamic Factors. Ergonomics 2000, 43, 771–790. [Google Scholar] [CrossRef]
  5. Ebe, K.; Griffin, M.J. Factors Affecting Static Seat Cushion Comfort. Ergonomics 2001, 44, 901–921. [Google Scholar] [CrossRef]
  6. Mehta, C.R.; Tewari, V.K. Vibrational Characteristics of Tractor Seat Cushion Materials and Ride Comfort. J. Low Freq. Noise Vib. Act. Control 2002, 21, 77–85. [Google Scholar] [CrossRef]
  7. Joshi, G.; Bajaj, A.K.; Davies, P. Whole-Body Vibratory Response Study Using a Nonlinear Multi-Body Model of Seat-Occupant System with Viscoelastic Flexible Polyurethane Foam. Ind. Health 2010, 48, 663–674. [Google Scholar] [CrossRef] [Green Version]
  8. Mansfield, N.; Sammonds, G.; Nguyen, L. Driver Discomfort in Vehicle Seats – Effect of Changing Road Conditions and Seat Foam Composition. Appl. Ergon. 2015, 50, 153–159. [Google Scholar] [CrossRef] [Green Version]
  9. Patten, W.N.; Sha, S.; Mo, C. A Vibrational Model of Open Celled Polyurethane Foam Automotive Cushions. J. Sound Vib. 1998, 217, 145–161. [Google Scholar] [CrossRef]
  10. Zhang, X.; Qiu, Y.; Griffin, M.J. Transmission of Vertical Vibration through a Seat: Effect of Thickness of Foam Cushions at the Seat Pan and the Backrest. Int. J. Ind. Ergon. 2015, 48, 36–45. [Google Scholar] [CrossRef]
  11. SAE J2896; Motor Vehicle Seat Comfort Performance Measures; SAE International: Warrendale, PA, USA, 2012; Available online: https://www.sae.org/standards/content/j2896_201201/ (accessed on 17 March 2022).
  12. ASTM D3574-17; Standard Test Methods for Flexible Cellular Materials-Slab, Bonded, and Molded Urethane Foams; ASTM International: West Conshohocken, PA, USA, 2017.
  13. Sammonds, G.M.; Fray, M.; Mansfield, N.J. Effect of Long Term Driving on Driver Discomfort and Its Relationship with Seat Fidgets and Movements (SFMs). Appl. Ergon. 2017, 58, 119–127. [Google Scholar] [CrossRef] [PubMed] [Green Version]
  14. Mansfield, N.J.; Mackrill, J.; Rimell, A.N.; MacMull, S.J. Combined Effects of Long-Term Sitting and Whole-Body Vibration on Discomfort Onset for Vehicle Occupants. ISRN Automot. Eng. 2014, 1–8. [Google Scholar] [CrossRef] [Green Version]
  15. Na, S.; Lim, S.; Choi, H.-S.; Chung, M.K. Evaluation of Driver’s Discomfort and Postural Change Using Dynamic Body Pressure Distribution. Int. J. Ind. Ergon. 2005, 35, 1085–1096. [Google Scholar] [CrossRef]
  16. Kim, D.Y.; Bang, J.H.; Lee, C.A.; Kim, H.Y.; Choi, K.Y.; Lim, B.G. Numerical Evaluation of Time-Dependent Sagging for Low Density Polyurethane Foams to Apply the Long-Term Driving Comfort on the Seat Cushion Design. Int. J. Ind. Ergon. 2018, 64, 178–187. [Google Scholar] [CrossRef]
  17. ISO 2631-1: Mechanical Vibration and Shock-Evaluation of Human Exposure to Whole-Body Vibration-Par1-General Requirements; International Organization for Standardization: Geneva, Switzerland, 1997; Available online: https://www.iso.org/standard/7612.html (accessed on 17 March 2022).
  18. Burström, L.; Nilsson, T.; Wahlström, J. Whole-Body Vibration and the Risk of Low Back Pain and Sciatica: A Systematic Review and Meta-Analysis. Int. Arch. Occup. Environ. Health 2015, 88, 403–418. [Google Scholar] [CrossRef] [PubMed]
  19. Bovenzi, M.; Hulshof, C.T.J. An Updated Review of Epidemiologic Studies on the Relationship between Exposure to Whole-Body Vibration and Low Back Pain (1986-1997). Int. Arch. Occup. Environ. Health 1999, 72, 351–365. [Google Scholar] [CrossRef]
  20. Troup, J.D.G. Clinical Effects of Shock and Vibration on the Spine. Clin. Biomech. 1988, 3, 232–235. [Google Scholar] [CrossRef]
  21. Kim, J.H.; Zigman, M.; Aulck, L.S.; Ibbotson, J.A.; Dennerlein, J.T.; Johnson, P.W. Whole Body Vibration Exposures and Health Status among Professional Truck Drivers: A Cross-Sectional Analysis. Ann. Occup. Hyg. 2016, 60, 936–948. [Google Scholar] [CrossRef]
  22. Johnson, D.A.; Nève, M. Analysis of Possible Lower Lumbar Strains Caused by the Structural Properties of Automobile Seats: A Review of Some Recent Technical Literature. J. Manip. Physiol. Ther. 2001, 24, 582–588. [Google Scholar] [CrossRef]
  23. Park, S.J.; Subramaniyam, M. Evaluating Methods of Vibration Exposure and Ride Comfort in Car. J. Ergon. Soc. Korea 2013, 32, 381–387. [Google Scholar] [CrossRef] [Green Version]
  24. Blood, R.P.; Ploger, J.D.; Johnson, P.W. Whole Body Vibration Exposures in Forklift Operators: Comparison of a Mechanical and Air Suspension Seat. Ergonomics 2010, 53, 1385–1394. [Google Scholar] [CrossRef] [PubMed]
  25. Johnson, P.W.; Zigman, M.; Ibbotson, J.; Dennerlein, J.T.; Kim, J.H. A Randomized Controlled Trial of a Truck Seat Intervention: Part 1—Assessment of Whole Body Vibration Exposures. Ann. Work. Expo. Health 2018, 62, 990–999. [Google Scholar] [CrossRef] [PubMed]
  26. Pan-Zagorski, W.; Pereny, M.A. Quantitative Investigation on Dynamic Comfort in Automotive Seats: A Ride and Drive Study. In Proceedings of the 2019 International Comfort Congress, Delft, Netherland, 29–30 August 2019. [Google Scholar]
  27. DeShaw, J. New Methodologies for Evaluating Human Biodynamic Response and Discomfort during Seated Whole-Body Vibration Considering Multiple Postures; University of Iowa: Iowa City, IA, USA, 2013. [Google Scholar]
  28. Mulder, M.; Abbink, D.A. Subjective Perception of Discomfort Due to Vehicle Vibrations in the Sagittal Plane. IFAC-PapersOnLine 2016, 49, 494–499. [Google Scholar] [CrossRef]
  29. Naddeo, A.; Cappetti, N.; Vallone, M.; Califano, R. New Trend Line of Research about Comfort Evaluation: Proposal of a Framework for Weighing and Evaluating Contributes Coming from Cognitive, Postural and Physiologic Comfort Perceptions. In Proceedings of the 5th International Conference on Applied Human Factors and Ergonomics AHFE 2014, Kraków, Poland, 19–23 July 2014. [Google Scholar]
  30. SAE J826: Devices for Use in Defining and Measuring Vehicle Seating Accommodation; SAE International: Warrendale, PA, USA, 2021; Available online: https://www.sae.org/standards/content/j826_202106 (accessed on 17 March 2022).
  31. Kim, J.H.; Dennerlein, J.T.; Johnson, P.W. The Effect of a Multi-Axis Suspension on Whole Body Vibration Exposures and Physical Stress in the Neck and Low Back in Agricultural Tractor Applications. Appl. Ergon. 2018, 68, 80–89. [Google Scholar] [CrossRef] [PubMed]
  32. Marin, L.S.; Rodriguez, A.C.; Rey-Becerra, E.; Piedrahita, H.; Barrero, L.H.; Dennerlein, J.T.; Johnson, P.W. Assessment of Whole-Body Vibration Exposure in Mining Earth-Moving Equipment and Other Vehicles Used in Surface Mining. Ann. Work Expo. Health 2017, 61, 669–680. [Google Scholar] [CrossRef] [Green Version]
  33. Kia, K.; Fitch, S.M.; Newsom, S.A.; Kim, J.H. Effect of Whole-Body Vibration Exposures on Physiological Stresses: Mining Heavy Equipment Applications. Appl. Ergon. 2020, 85, 103065. [Google Scholar] [CrossRef]
  34. European Union Directive 2002/44/EC of the European Parliament and of the Council of 25 June 2002 on the Minimum Health and Safety Requirements Regarding the Exposure of Workers to the Risks Arising from Physical Agents (Vibration). Off. J. Eur. Communities 2002, 177, 13–19.
  35. Mansfield, N.J. Human Response to Vibration; CRC Press: Boca Raton, FL, USA, 2005; ISBN 978-0-203-48722-8. [Google Scholar]
  36. Pelmear, P.L.; Leong, D.K.N. EU Directive on Physical Agents—Vibration. J. Low Freq. Noise Vib. Act. Control 2002, 21, 131–139. [Google Scholar] [CrossRef]
  37. Kim, J.H.; Pan-Zagorski, W.; Pereny, M.A.; Johnson, P.W. The Evaluation of Seat-Comfort, Body Discomfort and Seat Vibration Performance in a Dynamic Testing Environment. In Proceedings of the Human Factors and Ergonomics Society Annual Meeting, Online, 5–9 October 2020; SAGE Publications Sage CA: Los Angeles, CA, USA, 2020; Volume 64, pp. 1530–1531. [Google Scholar]
  38. Pan-Zagorski, W.; Kim, J.H.; Pereny, M.A.; Collins, J.G.; Johnson, P.W. Dynamic Comfort Testing of Automotive Seats in a Laboratory Setting. In Proceedings of the 2021 International Comfort Congress, Online, 2–3 September 2021. [Google Scholar]
  39. Porter, J.M.; Gyi, D.E.; Tait, H.A. Interface Pressure Data and the Prediction of Driver Discomfort in Road Trials. Appl. Ergon. 2003, 34, 207–214. [Google Scholar] [CrossRef] [Green Version]
Figure 1. Three seats tested: Seat (A) (Left), Seat (B) (Middle), Seat (C) (Right).
Applsci 12 04033 g001
Figure 2. Overall hardness measured by load-deflection curves (left) and vibration transmissibility (right) of three testing seats per SAE J2896.
Applsci 12 04033 g002
Figure 3. Lab test protocols. * Trial-axial field vibration was randomized between Sonata and Yukon. ** X-Y-Z Sinusoidal vibration was randomized among the axes.
Applsci 12 04033 g003
Figure 4. Accelerometers instrumentation for field test. Accelerometer in the cushion (left); accelerometer on the floor-mounted seat track (right).
Applsci 12 04033 g004
Figure 5. Example of vibration transmissibility plot and the definition of resonance frequency and attenuation frequency in this study.
Applsci 12 04033 g005
Figure 6. Average Power Spectral Density (PSD) from the city street road profile (n = 10).
Applsci 12 04033 g006
Figure 7. Representative Z-axis 1.5 m/s2 sine sweep from one subject. Red dashed lines indicate resonant frequencies; green lines indicate frequencies from which the floor-measured vibration is attenuated.
Applsci 12 04033 g007
Figure 8. Unweighted power spectral densities for the x-, y- and z-axes (top) and Transmissibility (bottom) (n = 10).
Applsci 12 04033 g008
Figure 9. Dynamic seat comfort comparisons among the three seats (A-blue lines, B-orange lines, C-gray lines) during the 50 min of vibration exposures (15-min field vibration and 30-min sinusoidal vibration) (n = 10).
Applsci 12 04033 g009
Figure 10. Attenuation frequency (left) and Seat Effective Amplitude Transmissibility (SEAT: Aw right) comparison between Seat B and Seat C (n = 12). Asterisks indicate statistical significance (p < 0.05).
Applsci 12 04033 g010
Table 1. Mechanical properties of the cushion foam pads.
Seat ID50% Indentation Load
(N)
Support
Factor 1
Hysteresis
Loss (%)
Thickness
(mm)
A698.43.3020.384.0
B386.63.2726.582.7
C333.83.2419.782.2
1 Support Factor is defined as ratio of 65%/25% Indentation loads (ASTM D3574-17).
Table 2. Laboratory vibration study participants’ demographic summary (n = 10).
Mean ± SDRange
Age (years)27.3 ± 6.719–40
Height (cm)169.6 ± 11.2154–185
Weight (kg)67.5 ± 9.852–80
BMI (kg/m2)23.7 ± 3.019.6–29.6
Driving Experience (years)10.0 ± 6.93.5–24
Table 3. Field vibration study participants’ demographic summary (n = 12).
Mean ± SDRange
Height (cm)171.7 ± 8.8152.4–185.4
Weight (kg)76.4 ± 23.949.8–135.0
BMI (kg/m2)25.7 ± 7.017.7–43.9
Daily Commute Time 1 (mins)27.5 ± 11.015.0–50.0
Personal Vehicle Age (years)5.4 ± 7.30.0–20.0
1 Daily commute time defined as one way between home and work.
Table 4. Mean (standard error) laboratory vibration exposures (weighted average vibaration: A(8) m/s2) across the three seats by road type comparing the three seats (n = 10).
Axis
X Y Z
Seat ASeat BSeat Cp-ValueSeat ASeat BSeat Cp-ValueSeat ASeat BSeat Cp-Value
Speed0.1420.1360.147<0.00010.1480.1520.1510.030.6210.6240.569<0.0001
Bunps(0.002)(0.002)(0.002)(0.001)(0.001)(0.001)(0.009)(0.01)(0.007)
Speed0.2080.1940.217<0.00010.1570.1580.1570.690.5820.5920.559<0.0001
Hunps(0.005)(0.004)(0.003)(0.002)(0.002)(0.001)(0.007)(0.006)(0.006)
Expansion0.0960.0760.101<0.00010.060.0620.0620.440.3920.3960.363<0.0001
Joints(0.006)(0.004)(0.003)(0.001)(0.001)(0.001)(0.006)(0.005)(0.005)
Cobblestone0.2080.1940.217<0.00010.1570.1580.1570.020.5820.5920.559<0.0001
Road(0.005)(0.004)(0.003)(0.002)(0.002)(0.001)(0.007)(0.006)(0.006)
City0.0960.0870.101<0.00010.1230.1240.1240.540.4110.4160.3950.0006
Streets(0.003)(0.002)(0.002)(0.001)(0.001)(0.001)(0.003)(0.005)(0.005)
Freeway0.0730.0560.077<0.00010.0630.0630.0640.820.2730.2760.263<0.0001
(0.005)(0.004)(0.003)(0.001)(0.001)(0.001)(0.002)(0.002)(0.001)
Table 5. Mean (Standard error) perceived discomfort in eight body parts when exposed to the 15-min tri-axial field vibration and sinusoidal vibration (10 min per each of X, Y, Z axes) (n = 10).
Body PartsSeatTri-Axial Field VibrationSinusoidal Vibration
0 min7 min15 minXYZ
PrePostPrePostPrePost
Ankles
/Feet
A3.9 (2.4)2.7 (1.5)5.2 (6.3)5.2 (3.5)2.4 (1.1)2.6 (1.1)2.5 (1.1)1.9 (1.1)1.8 (0.7)
B2.8 (1.5)1.2 (0.7)2.4 (2.3)1.1 (0.4)1.1 (0.4)1.1 (0.4)1.2 (0.4)1.8 (0.5)1.3 (0.5)
C0.7 (0.4)0.8 (0.4)0.9 (1.1)3.2 (1.8)2.2 (1.1)2.4 (1.1)2.2 (1.1)0.8 (0.4)3.4 1.6)
KneesA3.9 (1.8)5.1 (3.1)8.8 (6.3)9.7 (7.0)6.2 (3.5)6.4 (3.6)10.2 (5.2)6.9 (4.8)6.6 (3.5)
B6.1 (2.0)6.5 (1.9)7.0 (2.3)6.4 (2.4)5.9 (2.1)5.4 (2.2)7.1 (3.1)6.4 (2.8)6.8 (2.8)
C3.1 (0.9)1.9 (0.6)3.3 (1.1)3.9 (1.6)4.6 (1.8)5.3 (2.2)6.4 (3.2)3.7 (1.2)5.7 (2.1)
ThighsA3.1 (1.3)2.6 (1.3)3.1 (1.1)3.2 (1.5)5.9 (3.2)5.9 (3.3)4.6 (2.0)3.1 (1.1)3.3 (1.3)
B1.5 (0.9)3.1 (1.4)2.6 (0.9)1.3 (0.4)2.8 (1.6)3.1 (1.7)1.4 (0.5)2.0 (0.5)1.9 (0.8)
C1.0 (0.5)1.2 (0.5)1.2 (0.6)1.7 (0.7)2.3 (1.1)3.0 (1.4)2.6 (1.2)1.2 (0.6)2.4 (1.2)
TailbonesA1.2 (0.5)2.4 (0.6)3.3 (1.1)7.2 (4.2)7.3 (4.1)5.7 (2.7)8.9 (4.5)3.4 (1.1)5.7 (2.7)
B2.9 (2.0)1.7 (0.6)2.7 (0.9)1.6 (0.6)2.5 (0.6)2.9 (0.6)3.8 (1.6)2.0 (0.7)2.4 (0.6)
C1.3 (0.6)1.8 (0.7)1.4 (0.5)2.7 (1.0)3.4 (1.0)2.7 (0.9)7.1 (2.9)3.8 (1.8)5.0 (2.1)
Lower BackA1.1 (0.4)3.0 (1.3)4.2 (1.6)3.6 (1.5)4.3 (1.8)3.7 (1.5)4.7 (1.6)4.9 (1.7)4.2 (1.3)
B0.9 (0.5)1.7 (0.7)2.5 (1.0)2.3 (1.1)2.7 (0.6)2.9 (0.8)2.0 (0.7)2.3 (0.7)4.2 (1.1)
C2.1 (0.9)2.5 (0.9)2.3 (0.9)2.5 (1.1)2.6 (1.0)2.9 (1.0)5.1 (2.1)4.8 (2.1)5.2 (2.1)
Upper BackA4.7 (2.9)2.9 (0.9)6.6 (3.1)7.9 (3.3)6.7 (1.6)5.8 (2.2)6.1 (1.4)5.3 (1.1)5.9 (1.5)
B5.4 (2.4)4.4 (1.7)4.7 (1.6)3.8 (1.7)5.2 (2.3)4.7 (2.4)5.2 (2.3)6.3 (2.2)6.3 (2.7)
C2.9 (1.1)3.4 (0.9)3.1 (0.9)4.3 (1.4)4.7 (1.2)4.3 (1.4)4.7 (1.6)3.3 (1.0)5.3 (1.6)
ShouldersA2.2 (0.8)4.2 (1.6)5.9 (2.9)6.7 (3.1)5.7 (2.1)5.4 (2.4)8.9 (3.4)6.9 (3.5)5.7 (2.1)
B5.8 (3.2)5.6 (2.2)5.0 (2.2)5.2 (2.3)5.4 (2.5)4.4 (2.6)5.8 (2.9)6.4 (2.8)6.4 (2.8)
C1.8 (0.8)1.8 (0.6)3.0 (1.0)4.1 (2.1)5.1 (2.1)5.2 (2.2)6.1 (3.2)2.8 (1.1)4.9 (2.2)
NeckA6.9 (4.8)7.9 (5.3)9.7 (6.2)10.4 (6.9)7.6 (3.9)7.5 (3.9)10.5 (4.7)8.7 (4.8)7.5 (3.6)
B7.8 (4.4)6.7 (2.6)6.1 (2.4)5.8 (2.7)9.4 (3.3)7.3 (2.7)7.3 (2.8)8.6 (3.5)7.5 (3.3)
C4.2 (1.7)3.7 (1.4)4.4 (1.7)5.4 (2.2)5.2 (1.6)6.0 (1.8)6.5 (1.8)4.3 (1.3)5.1 (1.5)
Publisher’s Note: MDPI stays neutral with regard to jurisdictional claims in published maps and institutional affiliations.

