Article

Safety and Energy Implications of Setback Control in Operating Rooms during Unoccupied Periods

by
Ana Tejero-González
1,*,
Héctor López-Pérez
1,
Fernando Espí-García
2,
Luis M. Navas-Gracia
3 and
Julio F. SanJosé-Alonso
1
1
ITAP, Escuela de Ingenierías Industriales, Universidad de Valladolid, 47011 Valladolid, Spain
2
Hospital Universitario Río Hortega, 47012 Valladolid, Spain
3
Department Ingeniería Agroforestal, E.T.S. de Ingenierías Agrarias, Universidad de Valladolid, 34004 Palencia, Spain
*
Author to whom correspondence should be addressed.
Appl. Sci. 2022, 12(9), 4098; https://doi.org/10.3390/app12094098
Submission received: 1 April 2022 / Revised: 6 April 2022 / Accepted: 15 April 2022 / Published: 19 April 2022
(This article belongs to the Special Issue Thermal Comfort and Indoor Air Quality in the 2021 Built Environment)

Abstract

:

Featured Application

The reduction in the minimum number of air changes and the alterations of the design temperature and relative humidity in health care rooms requiring positive pressure during unoccupied periods is allowed by the ASHRAE/ASHE Standard 170-2021 and the Spanish standard UNE 100713:2005 with energy conservation purposes, provided that the required pressure relationship or the minimum air changes required are not compromised and that the set conditions are reestablished immediately once the space becomes occupied. This work provides evidence of the savings and safety of this energy efficiency measure in operating rooms.

Abstract

Health care facilities are high energy-demanding buildings. The energy-saving potential is limited due to safety regulations, especially in critical care areas like operating rooms (ORs). Reducing the supply airflows during unoccupied periods, also called ventilation turndown or setback, is accepted as an energy efficiency measure as long as it does not compromise the pressure relationship. In addition, temperature and relative humidity setbacks can introduce further energy savings. This work aims at studying the effect that a setback has on the OR-positive pressure and the savings achievable in both the energy supply and CO2 emissions. Towards this target, five tests are performed in two ORs of a public hospital during the summer, winter, and midseason. A setback is applied on the basis of an occupancy sensor, and the pressure difference from the OR adjacent spaces is monitored. The outdoor and supply air conditions and airflows, as well as fan energy consumption, are measured. Punctual pressure relationship losses are observed during the occupied periods due to doors opening but not during ventilation setback operations. The energy savings achieved accounted for 75% of the natural gas consumption and 69% of the electricity in the ORs. The yearly estimations imply economic savings of near 20,000 EUR and more than 100 tons of CO2 emissions.

1. Introduction

Health care facilities are energy-intensive buildings where the energy supply is critical as they must operate 24 h a day yearly [1,2]. Energy consumption in hospitals can be optimized through different energy efficiency measures and appropriate management but must not compromise the environmental requirements [2].
Energy use in hospitals can be dedicated to medical equipment, lighting, services, and, also, to Heating, Ventilation and Air Conditioning (HVACs), among others [1]. HVAC systems are highly energy demanding due to the large outdoor airflows required to remove indoor contaminants [2]. However, the Indoor Air Quality requirements vary by health function, where operating rooms are amongst the most demanding areas [3].
The implementation of energy conservation measures related to HVAC systems must comply with the safety standards at all times. The typical measures considered in health care facilities are the use of heat recovery equipment [2,4,5]; maintenance and replacement of old, low-performing equipment [1,6]; enhancing ventilative cooling when possible [1,7]; zonification and optimal control [1,6], etc. In addition, the current Spanish and ASHRAE standards [8,9] admit to the reduction of the minimum number of air changes and alterations of the set temperature and relative humidity in certain spaces during unoccupied periods, such as in operating rooms (ORs). This is also called a turndown or setback.
Reducing the supply airflow to ORs during unoccupied periods can save a lot of energy from fans, as well as air heating and cooling. However, there are critical issues, such as [10]:
-
Maintaining the required positive pressure. It is necessary to control both the supply and return airflow (many old systems do not include the latter).
-
Maintaining an appropriate ventilation rate to remove contaminants from cleaning activities.
-
The control of unoccupied periods through occupancy sensors, timers, light switches, etc.
-
Rapid transition from unoccupied periods to occupied operations while maintaining the indoor set temperature and humidity.
The large air change rates usually applied in ORs incur significant expenses for health care buildings [11]. The first evidence in the literature of ventilation control to reduce energy consumption in ORs dates back to 1986 [12]. In 2005, Tschudi et al. [13] proposed controlling the airflow during nonworking hours of two operating rooms and achieved a reduction in the fan power consumption of up to 72% without any adverse effects observed.
Recent research has proposed different percentages of supply airflow reduction to introduce energy savings, adjusting the return airflow to maintain the minimum positive pressure of the adjacent areas. Most authors have proposed a 50% reduction in the airflow rate supplied to an OR [14,15,16,17]. Wang et al. [15] ensured a positive pressure relationship of 1 Pa. Loomans et al. [17] introduced the 50% reduction in the air change rate after 30 min of no occupation and controlled the indoor air quality by particle counting. They observed that, while unoccupied, there was no source of contamination in the cleanroom. Cacabelos-Reyes et al. [16] estimated 70% yearly energy savings, complying with the requirements for the patients’ and staff’s safety and health. Alternatively, Porowski [18] proposed a reduction of the supply outdoor air to 30% during unoccupied periods and achieved up to 6.5% savings in the annual primary energy demand.
Other authors have evaluated the energy savings possible through air recirculation, achieving 24.1% and 44.31% reductions in the energy consumption for 25% or 50% recirculated air, respectively [19].
In those cases where the OR air handling unit is equipped with a heat recovery device, the reduction of the supply airflow prevents the system operations. However, it has been demonstrated that the supply airflow control can still entail larger energy savings than the operation of heat recovery units, especially when air humidification is required [5].
The present work focuses on the energy conservation approach of reducing the supply airflow and adjusting the design temperature and relative humidity during unoccupied periods. The final aim is to provide evidence of its implementation in ORs without compromising the positive pressure relationships, as well as to determine the energy, economic, and emissions savings that are achievable.

2. Materials and Methods
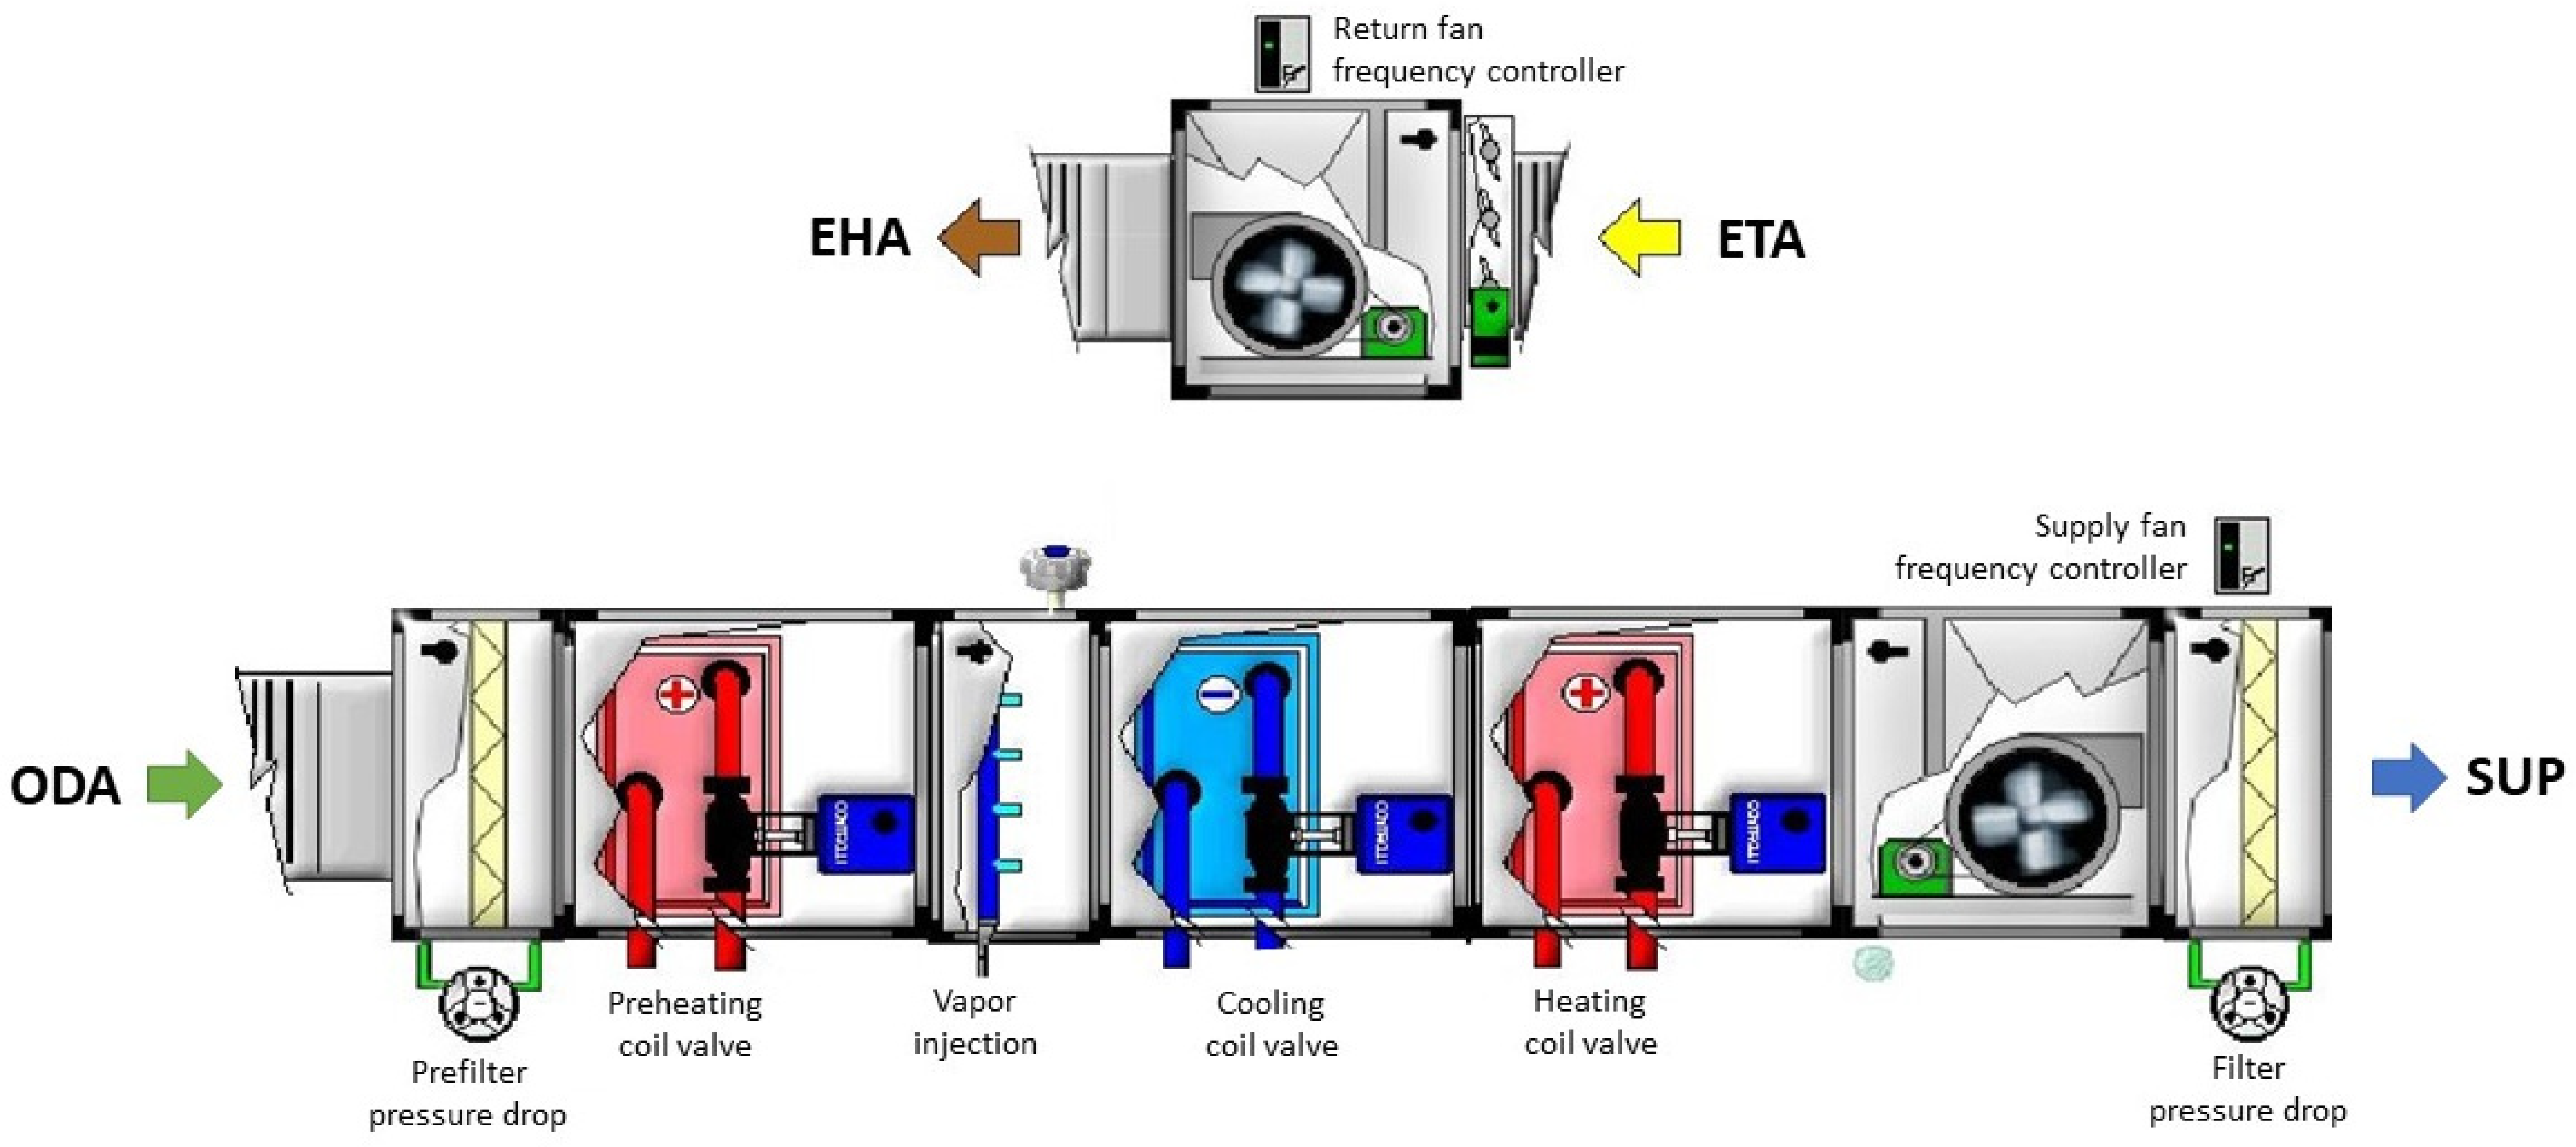
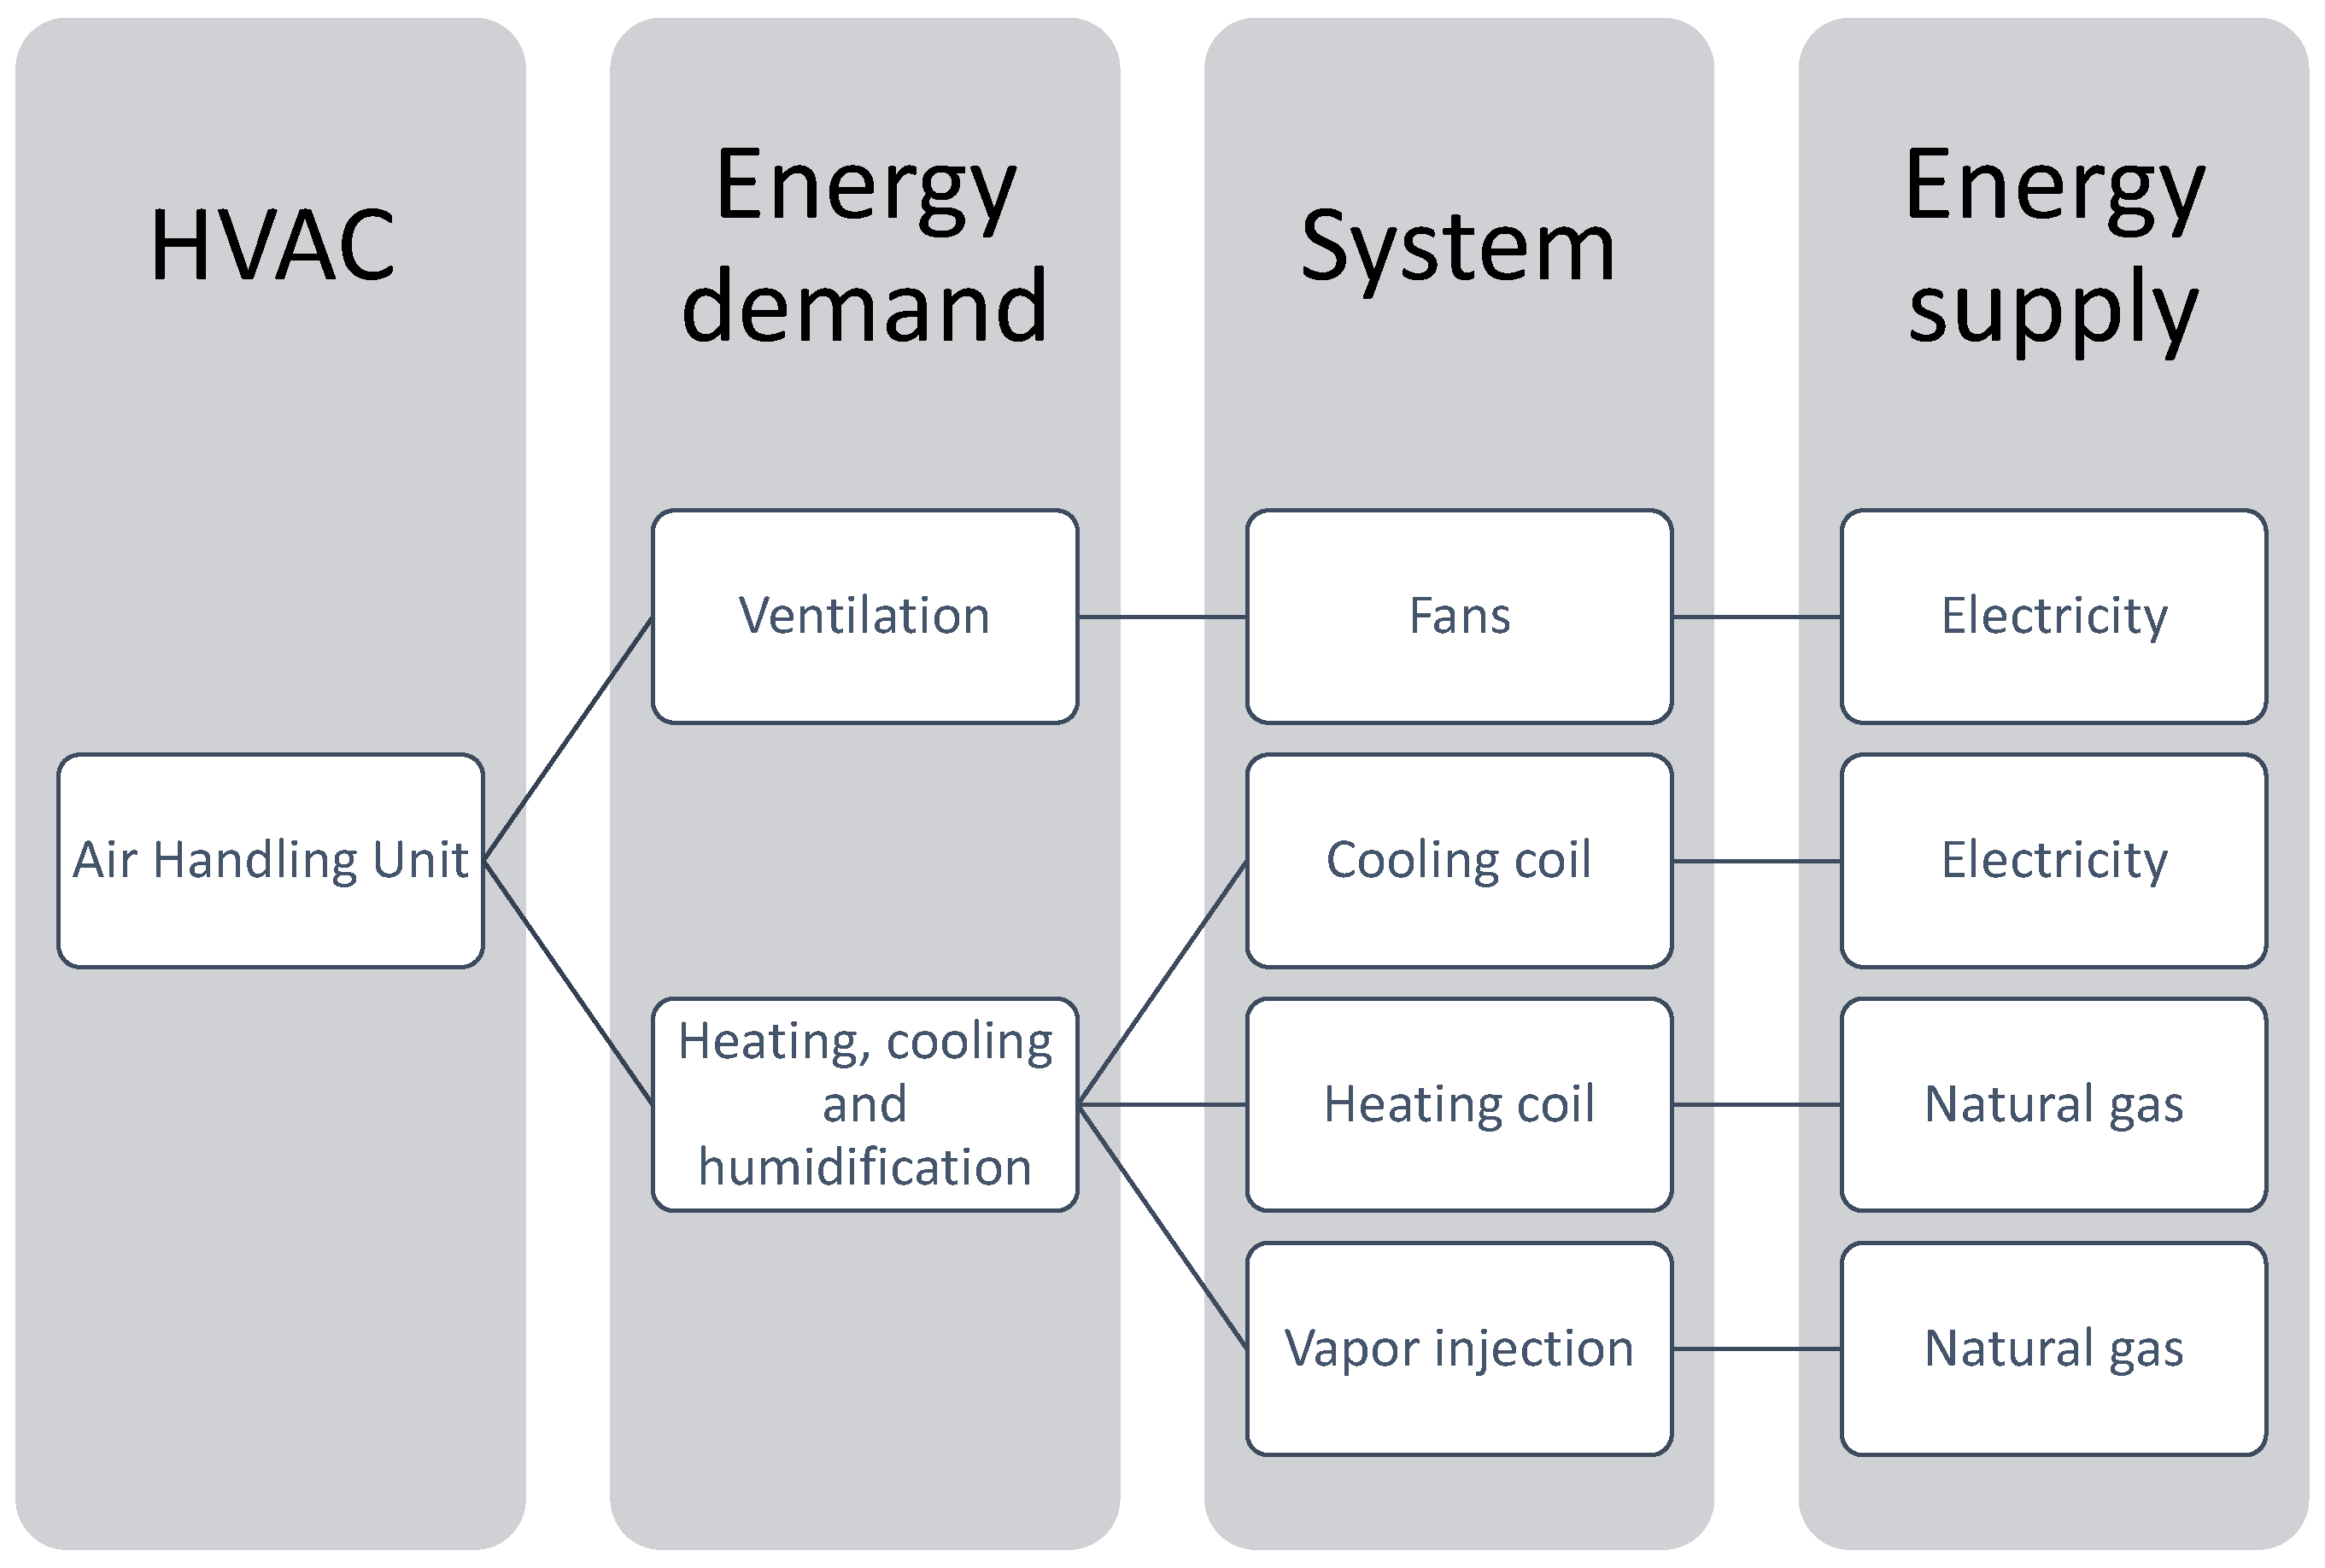
2.1. Case Study

The target ORs belong to the University Hospital Río Hortega in Valladolid (Spain). It has 115,354 m2, 600 beds, and over 3000 employees. There is a total of 18 ORs, among which four are dedicated to minor surgical interventions, one for obstetrics, and another for burns. The Köppen-Geiger climate classification for Valladolid is Csa. The electric energy consumption during 2021 was 15,489,623 kWh, implying 1,635,325.37 EUR, and 25,591,744 kWh for natural gas, implying 844,616.83 EUR.
The tests were performed in two different ORs: one emergency OR and another OR for general use, both equipped with a pressure-independent return/exhaust system. It must be noted that the pressure relationships can only be ensured when the return/exhaust ductwork has air terminal units (are pressure-independent) [20].
Each OR has an individual air handling unit working with the outdoor air, equipped with (see Figure 1):
  • Preheating and heating coils: work with hot water from natural gas boilers.
  • Cooling coil: works with cold water from vapor compression, air-condensed chillers.
  • Vapor injection unit: connected to the hospital’s steam distribution system.
  • Supply and exhaust fans, dampers, and filters.
The SCADA (Supervisory Control and Data Acquisition) permits measurements of the variables gathered in Table 1 and the control parameters shown in Table 2.

2.2. Tests Performed

The tests are performed simultaneously in two ORs by implementing ventilation setback during nonoccupation periods. Occupation is monitored through an occupancy sensor; setback is activated after 20 min of nonoccupation, while regular ventilation is reactivated immediately when occupation is detected. It is checked that activation of the regular ventilation is almost instantaneous, taking only seven seconds from the moment when the OR becomes occupied.
Ventilation setback consists of reducing the supply airflow while maintaining the required pressure relationships by controlling the return airflow. It is important to notice that increasing the air changes does not necessarily imply less of a risk of microbial contamination [11]. Moreover, Loomans et al. [17] demonstrated through particle counting that there is no contaminant source during nonoccupation periods. The ANSI/ASHRAE/ASHE Standard 170:2021 [9] stipulates a time delay of at least 20 min after the OR becomes unoccupied, which corresponds to a reduction in airborne contamination of approximately 90%, providing six air changes per hour (ach) with perfect mixing. Consequently, because the setback is activated after 20 min since the last occupation, the pressure relationship is considered sufficient to ensure the asepsis of the OR, thus justifying the reduction in the air change rate.
The two tests are performed during the winter period (December and January), one during the midseason (April), and two further tests during the summer period (July and August). During the tests, the measured parameters (Table 1) are registered every five minutes. The tests are performed simultaneously at two ORs.
As shown in Table 1, the only information that can be obtained through the SCADA regarding the fans’ operation is their frequency. To know the actual electric consumption of the fans, measurements are performed with the net analyzer Fluke model 1730 on a minute-by-minute basis.

2.3. Data Analysis

The measurements are analyzed with two aims: (1) checking that the pressure relationships are not compromised through the ventilation setback and (2) estimating the energy, emissions, and economics savings achievable. The first objective is directly studied by analyzing the differential pressures registered during the setback (nonoccupation) operating periods during the tests performed (Table 3). The second is approached by extrapolating the achieved results from the Typical Meteorological Year data of the target location.
ORs must be always be maintained at a positive pressure with respect to the adjoining spaces. Table 4 gathers the minimum air changes per hour and the pressure relationships to adjacent areas specified in the Spanish Standard [21] and the ANSI/ASHRAE/ASHE Standard 170-2021 [9].
The energy savings achievable can be distinguished between thermal and electrical savings. In terms of energy supply, the heating thermal savings entail a reduction in the consumption of natural gas of the boilers, while the cooling thermal savings involve electric energy savings in the chillers. The reduction in the energy consumed by fans directly involves electric energy savings. When necessary, humidification is provided through vapor injection fed by the hospital’s steam system and, thus, involves natural gas savings in the boilers. However, due to the particular climate of the location, controlled dehumidification during the summer period is not necessary, and it only occasionally occurs in the cooling coil in an uncontrolled way (Figure 2).
The ventilation setback operating periods ( t s e t b a c k ) directly imply electric energy savings when using the frequency-controlled fans of the AHU:
F a n s   e n e r g y   s a v i n g s = ( P o c c u p a t i o n P s e t b a c k ) ·   t s e t b a c k
Energy savings in the cooling coil during the setback derive from the lower ventilation thermal loads due to both the reduced supply airflow and the modification in the set temperature (Table 2).
C o o l i n g   c o i l   s a v i n g s = ( V ˙ · 1 v · Δ h t o t   c c V ˙ s e t b a c k · 1 v · Δ h t o t   c c   s e t b a c k ) · Δ t
where V ˙ is the design supply ventilation rate (see Table 2), V ˙ s e t b a c k is the supplied airflow during the setback operation, v is the dry air specific volume at the measured supply air conditions, and Δ t is the period of the setback operation. The total enthalpy variation achieved in the coil Δ h t o t   c c is due to both cooling and uncontrolled dehumidification when cooling down the outdoor conditions to the set supply temperature during regular operations or during the setback (Table 2).
Since it operates with chilled water, the electric energy savings derived from the effect of the setback in the cooling coil demand can be calculated by multiplying the result from Equation (2) with the European Seasonal Energy Efficiency Ratio (ESEER) of the chiller. The air-cooled chiller ESEER is 4.83, thanks to the integration of the adiabatic cooling pads at the air inlet of the condenser [22].
Similarly, the energy savings in the heating coil are due to the lower ventilation thermal loads:
H e a t i n g   c o i l   s a v i n g s = ( V ˙ · 1 v · Δ h s e n s   h c V ˙ s e t b a c k · 1 v · Δ h s e n s   h c   s e t b a c k ) · Δ t
In this case, the enthalpy variation considered Δ h s e n s   h c is only sensible heat and corresponds to the heating of the outdoor conditions up to the set supply temperature during the regular operations or during the setback (Table 2).
In this case, energy savings in the heating coil involve natural gas savings in the boiler, whose performance, η, is 97%. The energy savings associated with natural gas consumption can be calculated by dividing the results from Equation (3) from the boiler performance.
Finally, the energy savings due to less vapor injection will depend on the humidity ratio variation achieved in the treated air, Δ w , and the water vapor latent heat, C L :
V a p o r   i n j e c t i o n   e n e r g y   s a v i n g s = ( V ˙ V ˙ s u p ) · 1 v · Δ w · C L · Δ t
All the psychrometric variables required are calculated from the measured ones (Table 1) through the known psychrometric expressions [23].
The CO2 emissions corresponding to the natural gas and to the electricity consumption are obtained through the conversion factors for Spain [24]:
C a r b o n   e m i s s i o n   c o n v e r s i o n   f a c t o r   f o r   n a t u r a l   g a s = 0.252   kg CO 2 / kWh
C a r b o n   e m i s s i o n   c o n v e r s i o n   f a c t o r   f o r   e l e c t r i c i t y = 0.331   kg CO 2 / kWh

3. Results and Discussion

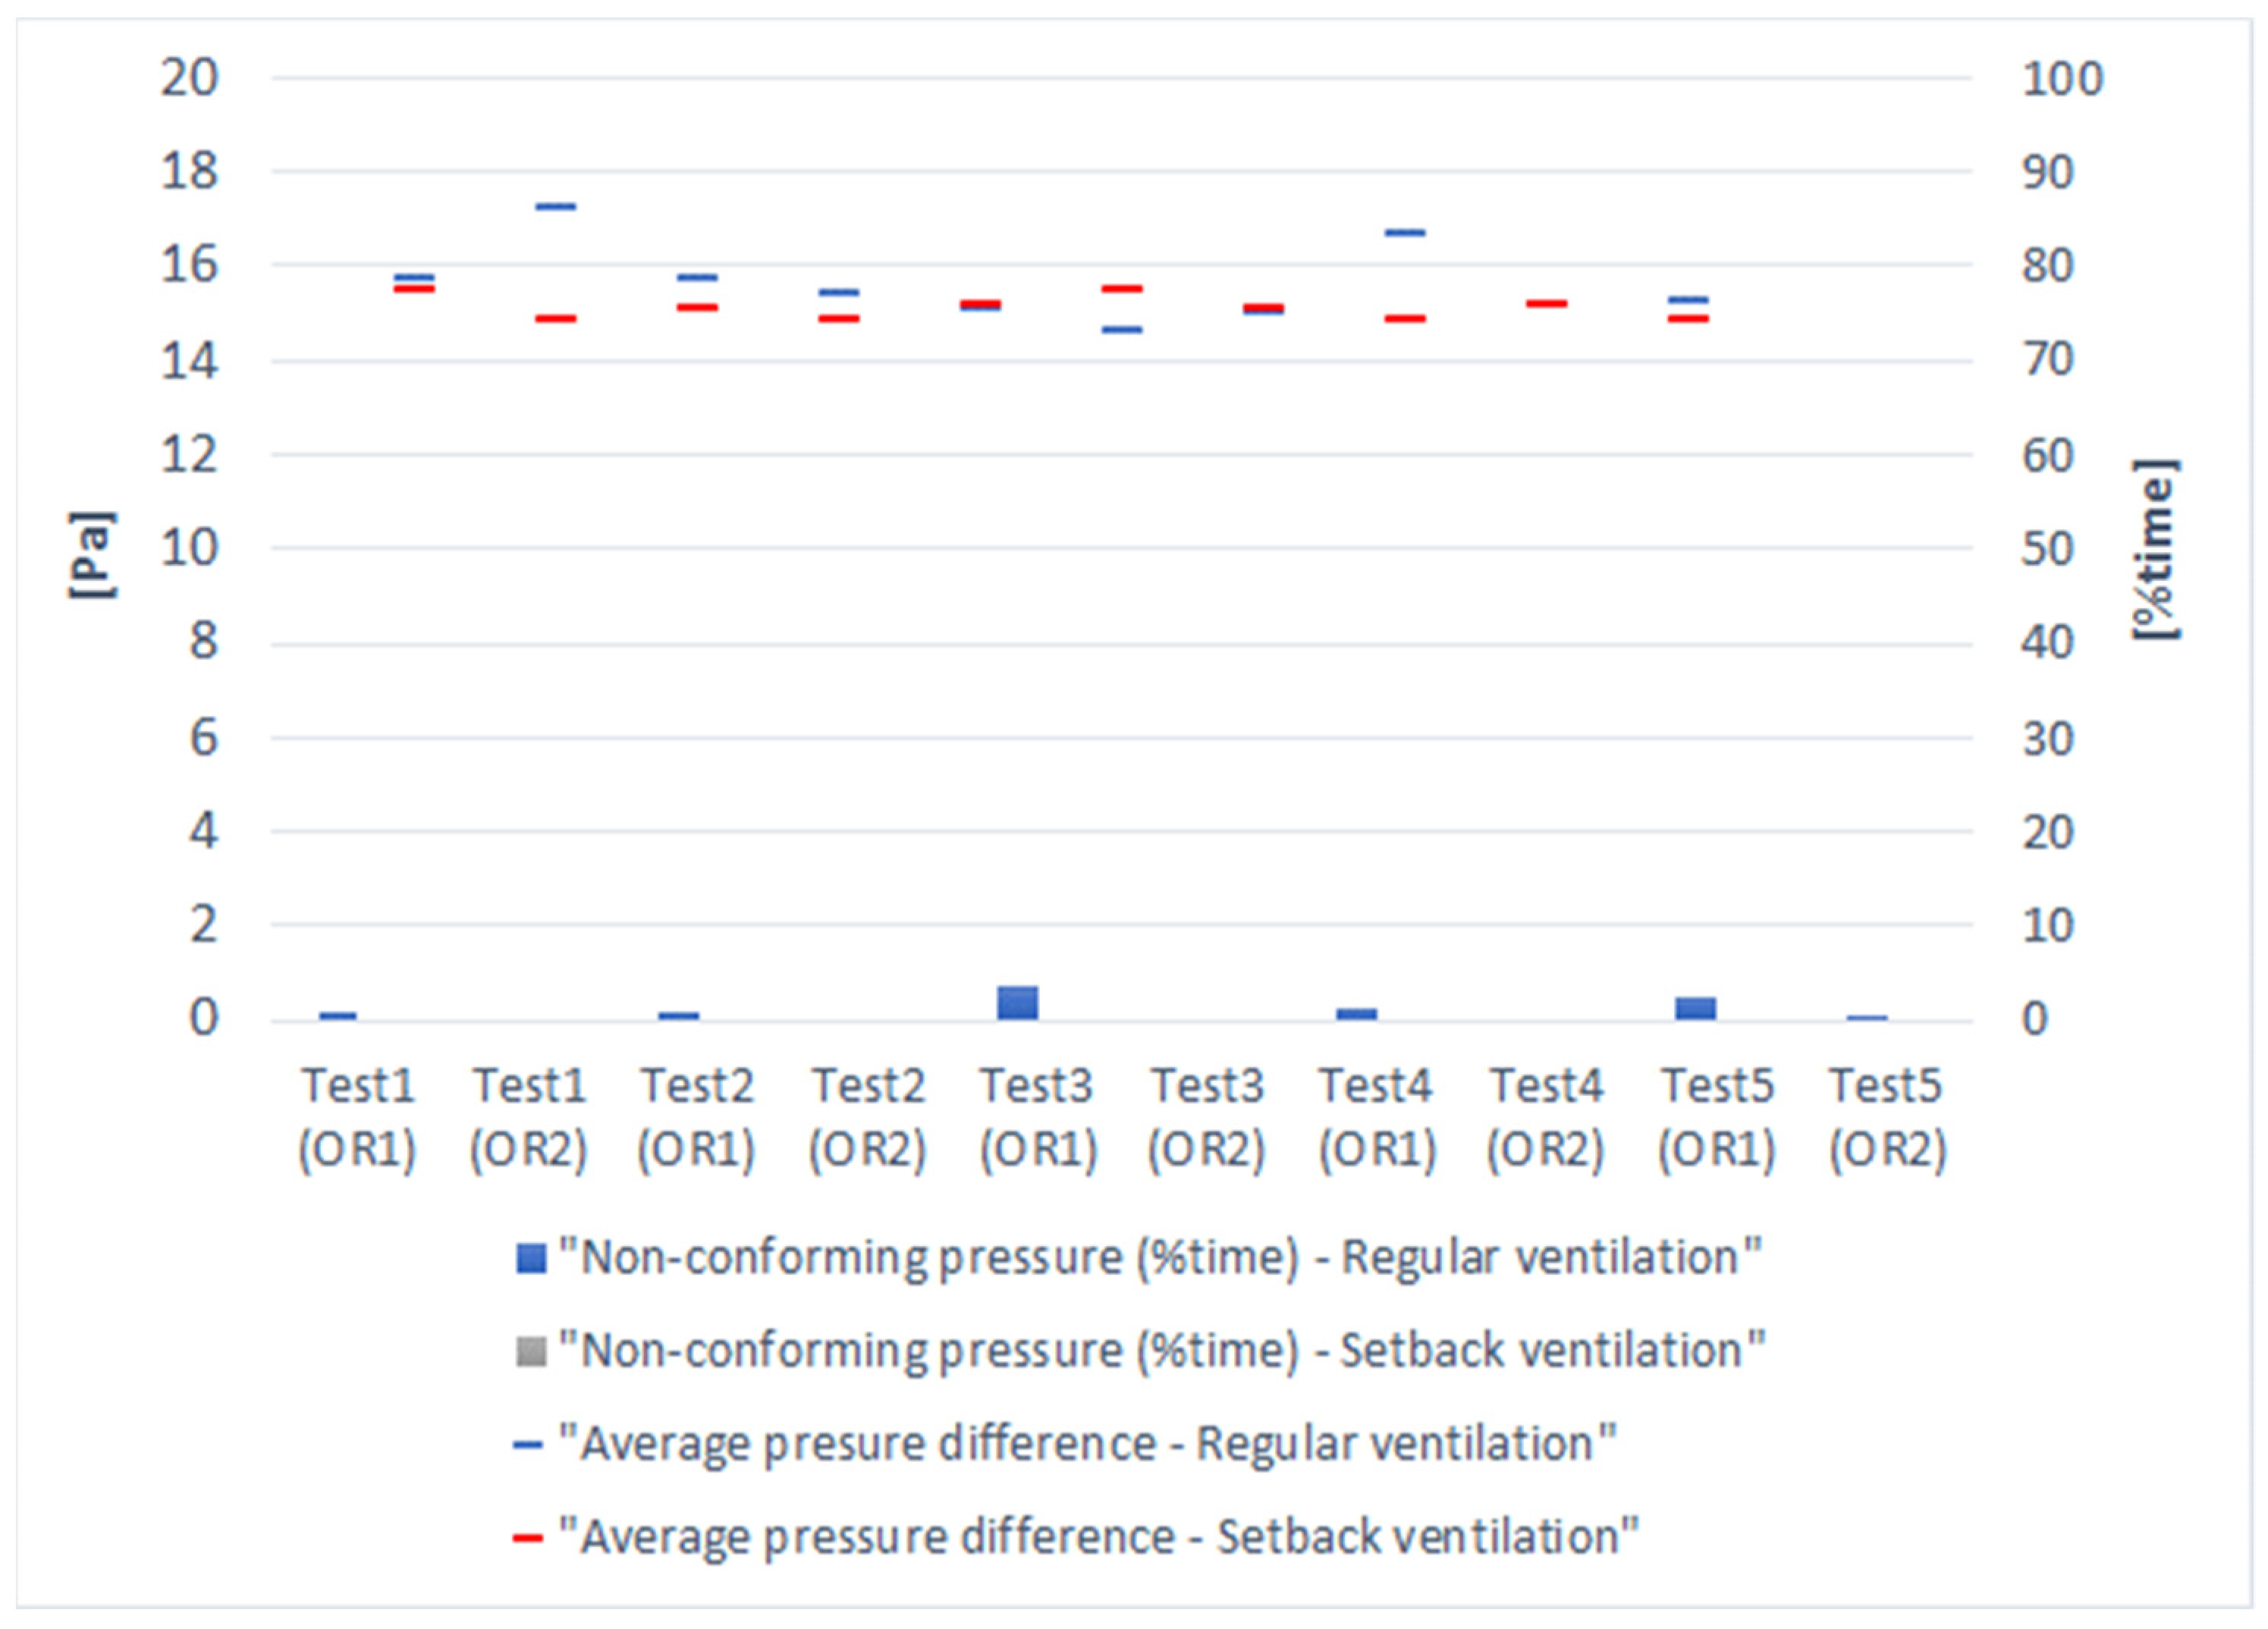
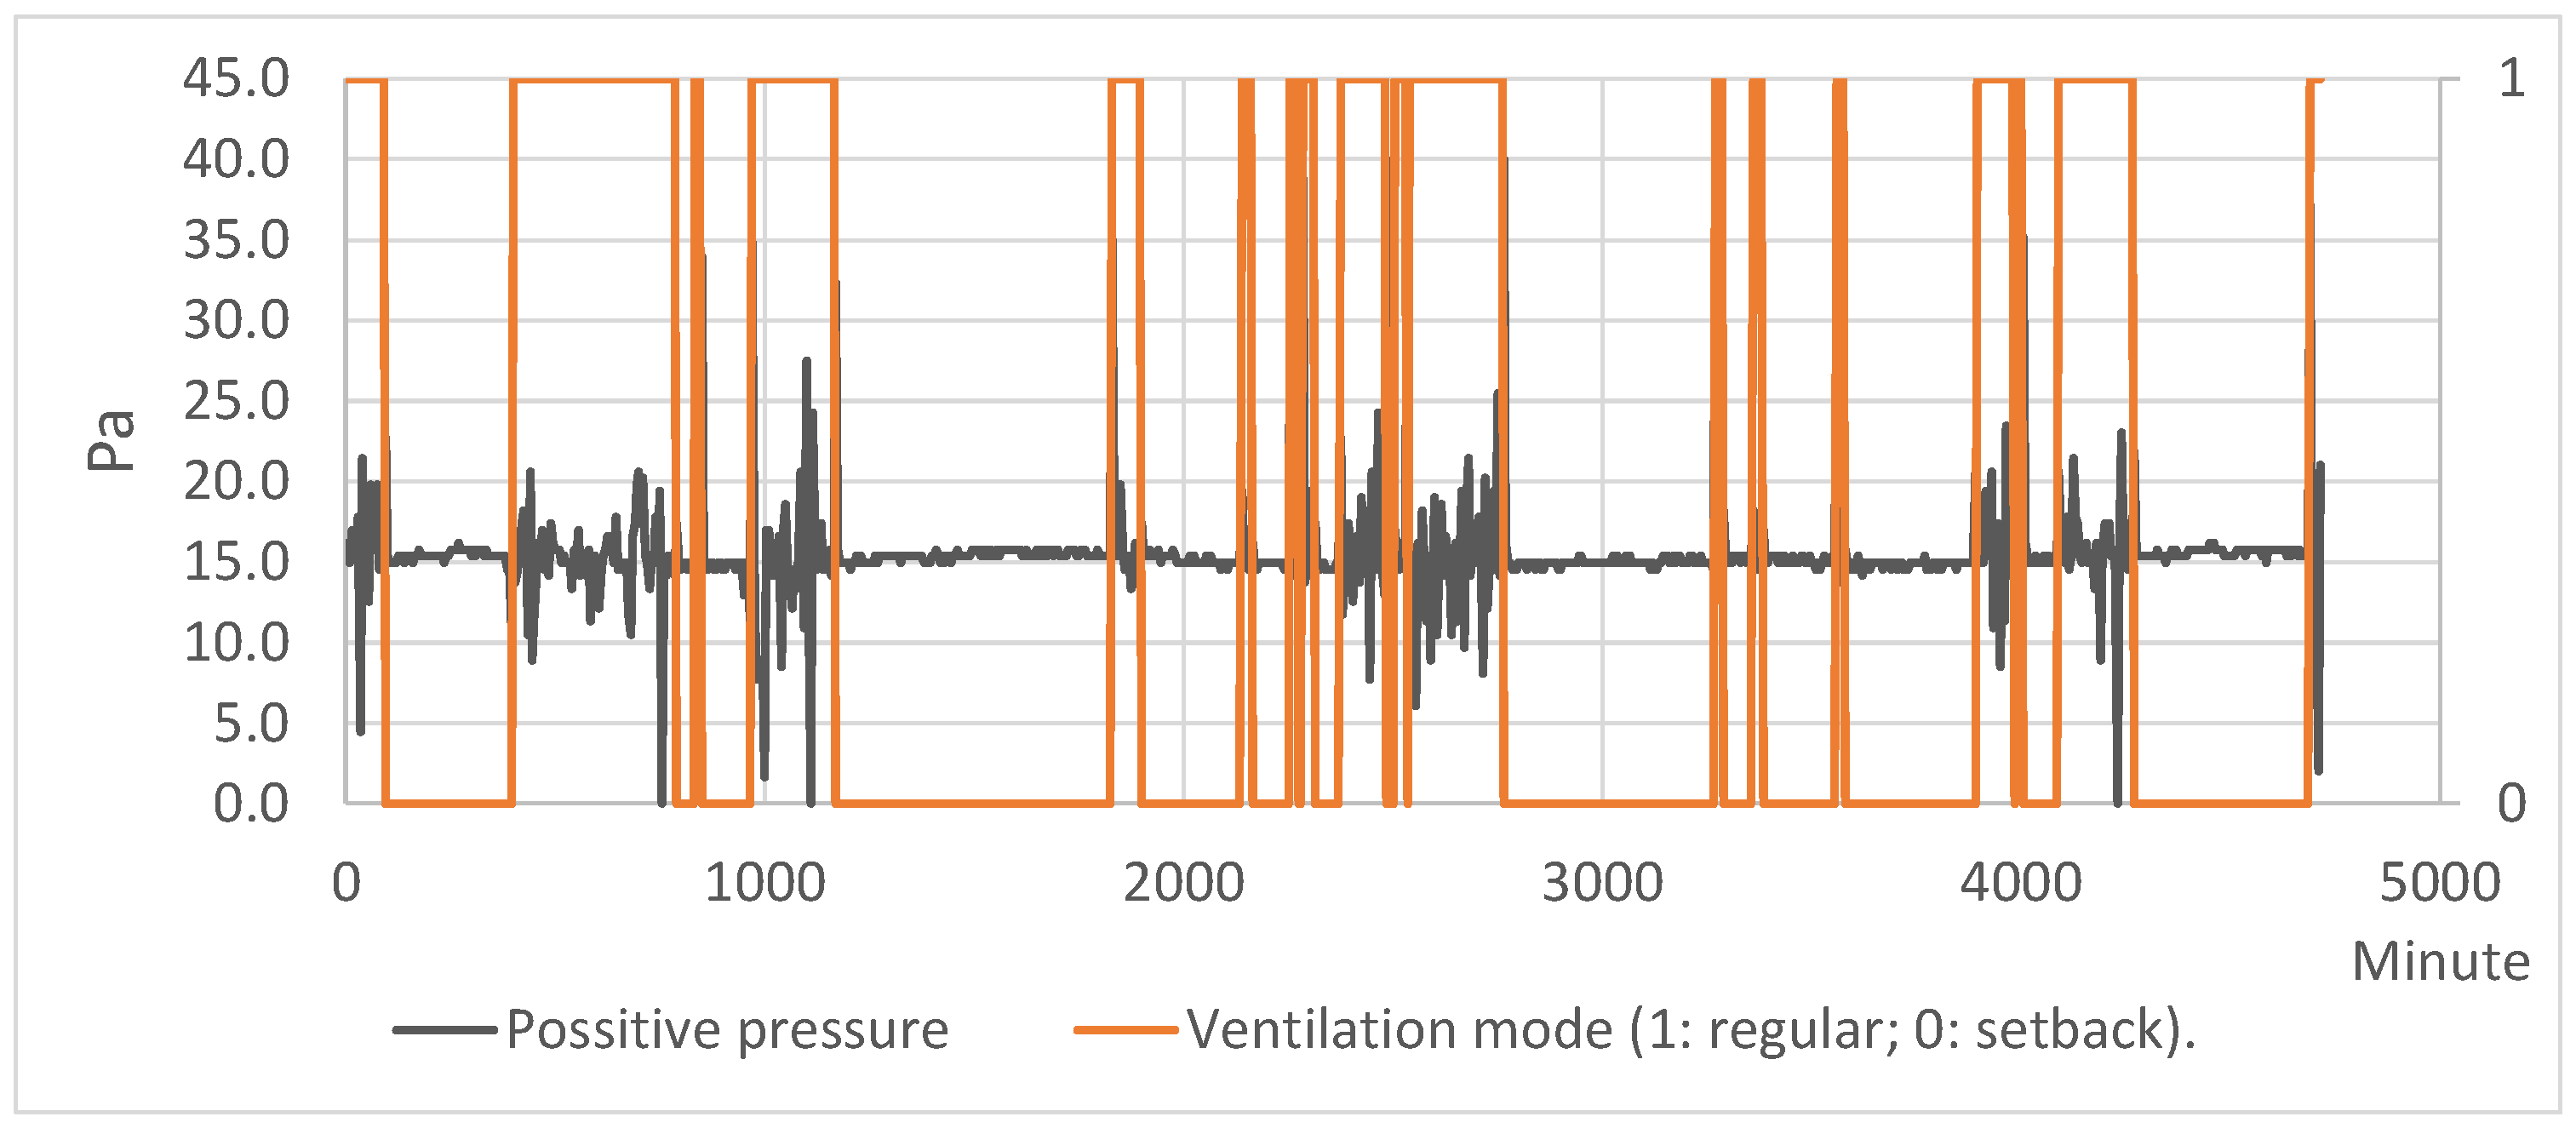
3.1. Pressure Relationships

Table 5 gathers the pressure relationships registered during each test in both ORs. The results are separated for the periods of regular ventilation (occupation) and for the periods under ventilation setback (nonoccupation). Besides the average pressure differences registered, Table 5 shows the “nonconforming” cases that occur when the pressure difference registered drops below 6 Pa. This value corresponds to the minimum accepted according to the Spanish regulations, being the strictest among the two standards (Table 4), and the revised literature [15,25]. The average and the minimum pressure differences registered during these nonconforming periods are also shown.
It can be seen that no nonconforming pressure relationships are registered during setback operation, with the only exception of test 5 in OR1, while almost all the periods under regular ventilation show nonconforming pressure relationships. This is due to the positive pressure difference loss caused by the door opening, which will only occur during occupation periods. These occupation periods are either for medical use of the ORs or for cleaning and maintenance work. To better illustrate this, Figure 3 represents the percentage of time when nonconforming pressure relationships occur for each test and OR when the average pressure differences are maintained. Consequently, it can be concluded that the ventilation setback does not compromise the pressure relationships required at ORs for safety issues.
As an example, the results from OR1 during test 1 are graphed in Figure 4. It can clearly be seen that the remarkable variations in the required 15 Pa pressure relationships occur during occupation periods, hence the regular operation of the ventilation system. On the contrary, during the nonoccupation periods when ventilation setback is applied, the pressure relationship is almost stable at 15 Pa. Indeed, punctual losses of this pressure difference only occur during occupation periods due to the door opening.

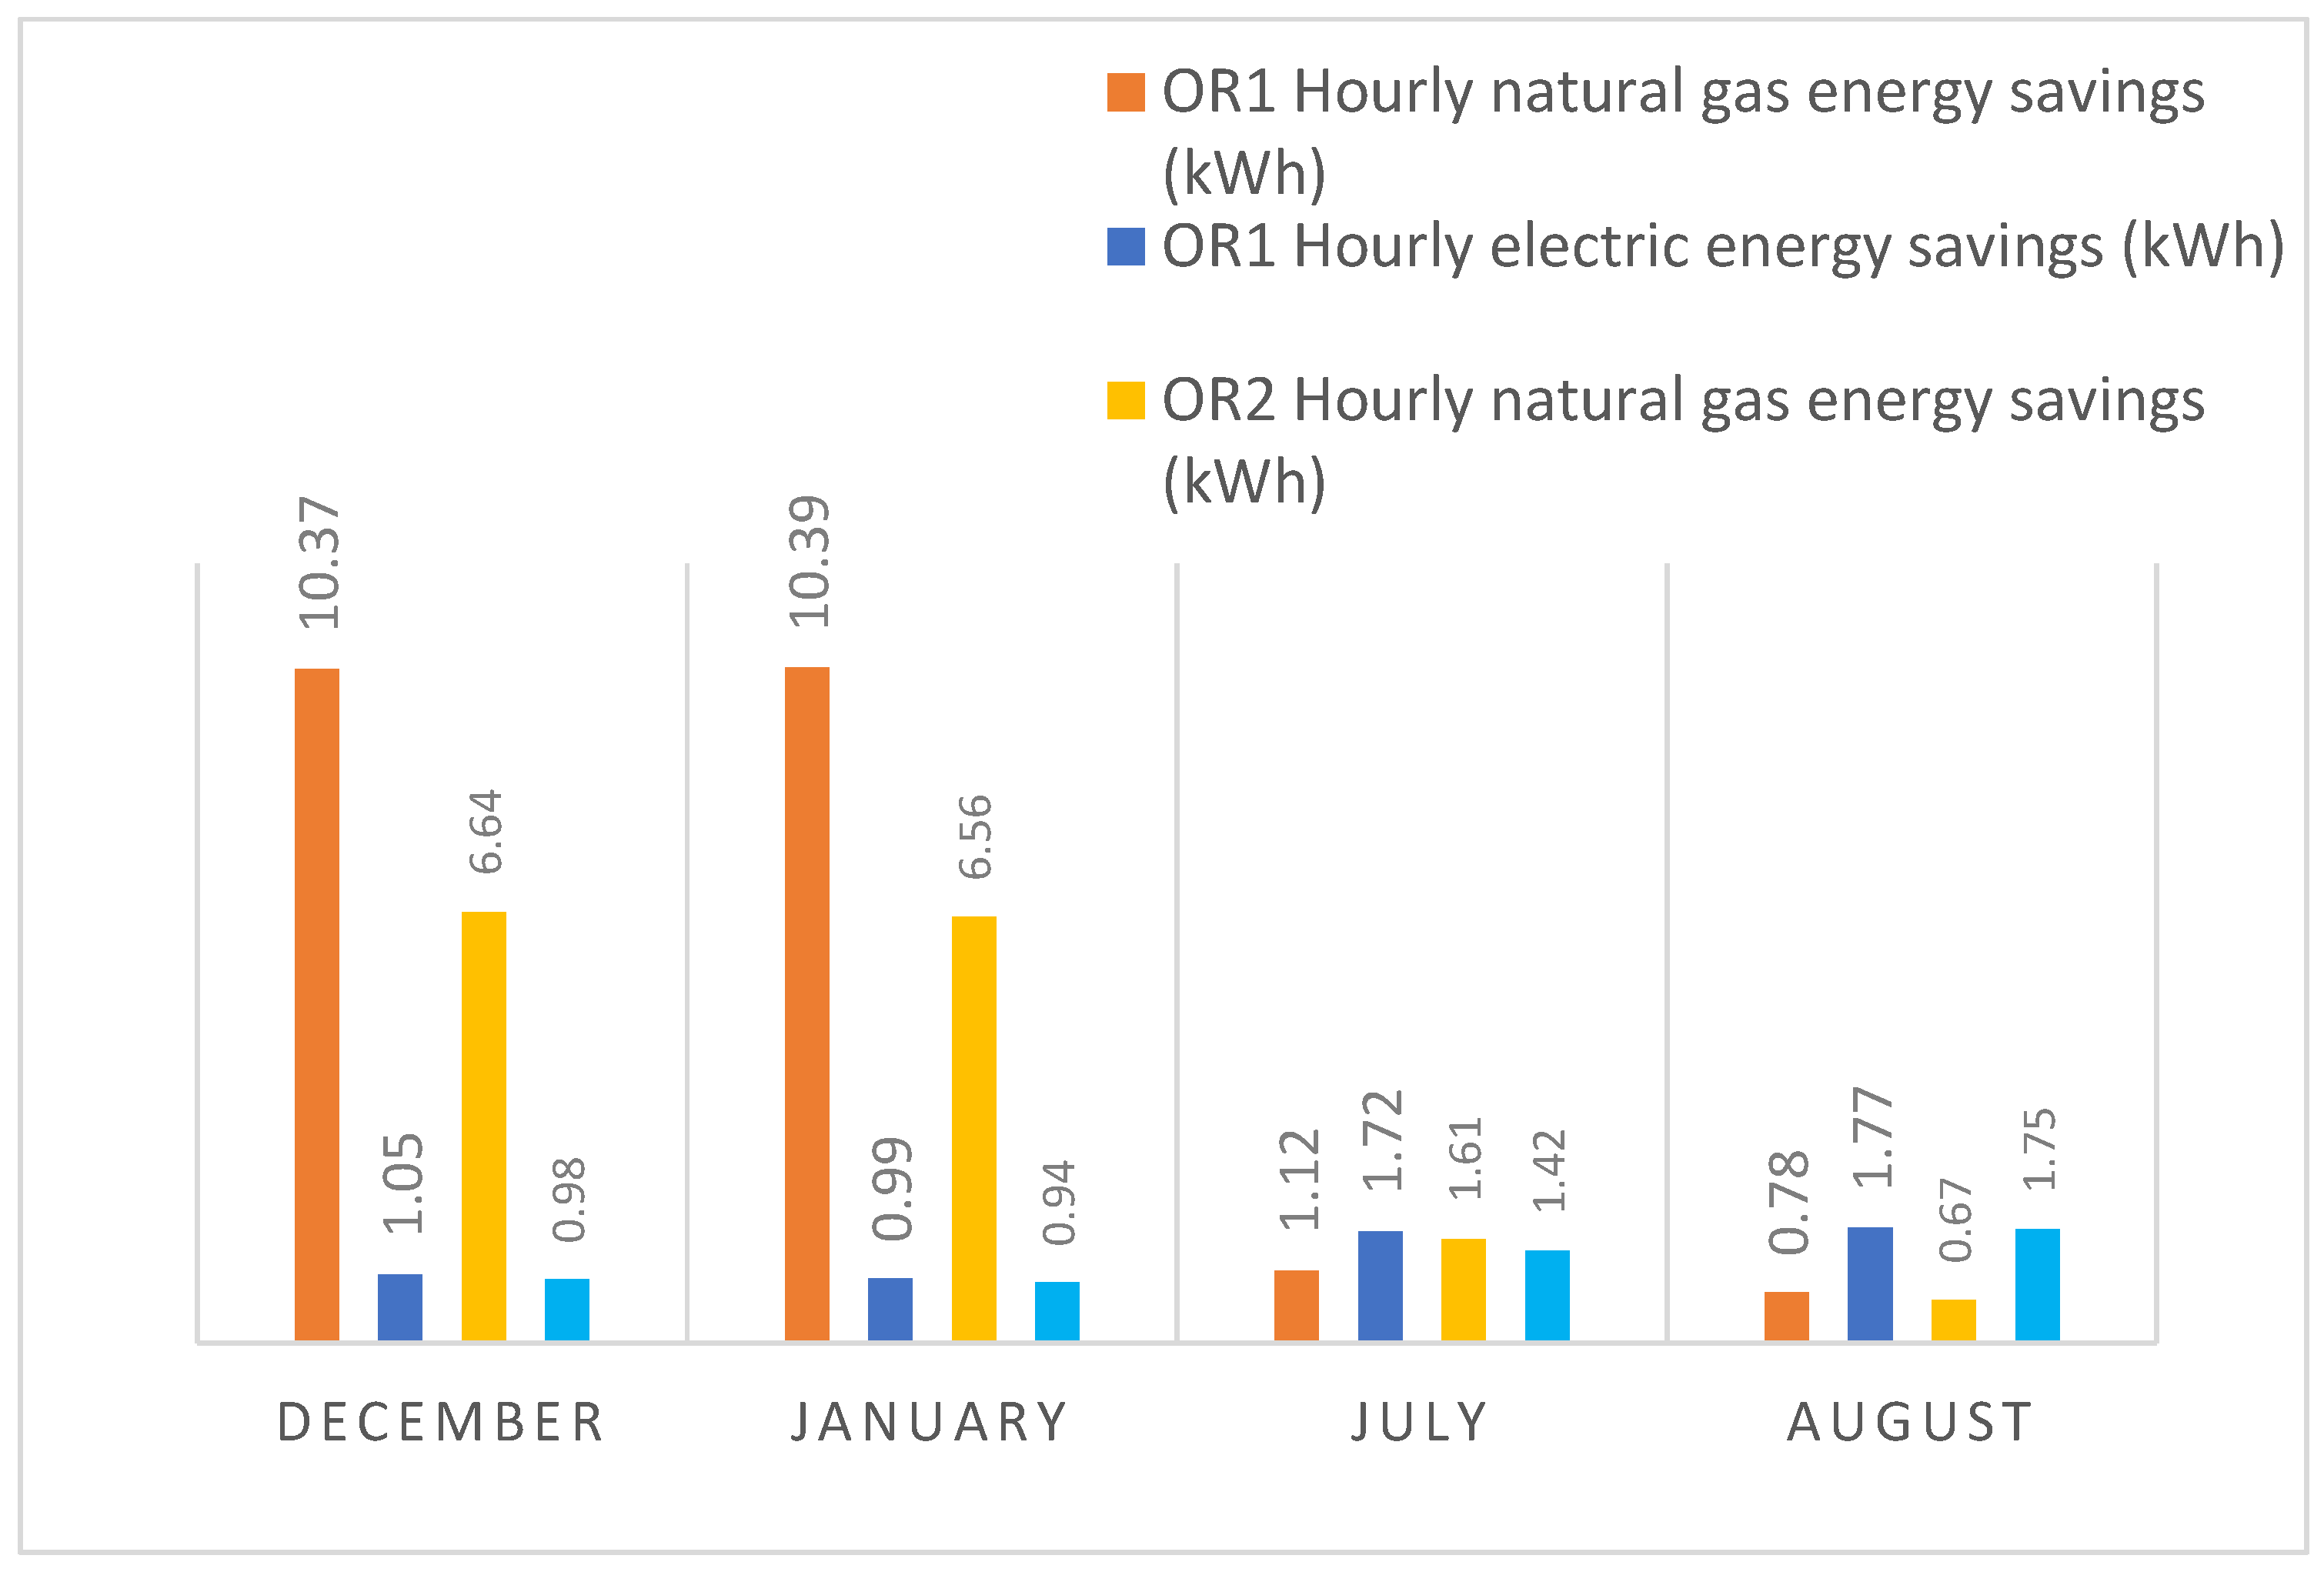
3.2. Energy and Emissions Savings

Table 6 gathers the energy and emissions savings calculated under the setback operation of the OR HVAC systems for the nonoccupation periods.
It can be seen that, with the exception of test 3, OR2 was unoccupied almost the whole period (90–99% of the time), while OR1 remained unoccupied only during 50–70% of the time. However, in the wintertime (tests 1 and 2), the thermal energy savings are lower for OR2. This can be explained by having a closer look at the setback operating conditions: whilst in OR1, the positive pressure was maintained with an average supply airflow of only 860–970 m3/h; in OR2, the required supply airflow could not be reduced below 1540 m3/h without compromising the required relationships.
Electric energy savings in the fans are nonetheless higher for the cases when the setback operates during longer periods. This is because the power required in the fans does not vary so importantly for different airflows; indeed, the frequency converter for a supply airflow of about 860 m3/h is close to 20 Hz, which results in approximately 850 W, while, for 1540 m3/h, it keeps close to 35 Hz, implying 914 W.
During the summer season (tests 4 and 5), electric energy savings are due not only to the reduced airflow in the fans but also to the lower ventilation cooling loads, hence the reduced energy consumption in the chiller. For the climate of the location, the midseason test performed (test 3) did not imply a cooling demand; consequently, from test 1 to test 3, all electric savings were due only to the reduced airflow in the fans.
A heating demand also occurs beyond the winter period due to the low nighttime temperatures; since the ORs have no external walls, ventilation is the only thermal load during nonoccupation, being necessary to heat the outdoor air up to the indoor set temperature. In these cases, the influence of the higher setback supply airflow required in OR2 was not a determinant of the heating energy savings because of the smaller differences between the outdoor and supply air temperatures.
Therefore, the actual energy savings of the setback control will depend on the particularities of each OR, which will result in different needs of the setback supply airflow. Figure 5 shows the hourly energy savings achieved through the setback for the winter and summer tests—that is, the energy savings achieved related to the number of hours when the setback is applied during these tests. It is clearly seen that the expected energy savings, either for natural gas or electricity, will strongly depend on the OR.
Finally, it is important to notice that humidification was not required during the tests; otherwise, the energy savings related to the natural gas consumption would have been even higher.

3.3. Annual Estimations

To provide a global view of the prospective annual savings, the analysis described in Section 2.3 is extrapolated for a yearly basis. The Typical Meteorological Year data of the hospital location is considered for the outdoor air operating conditions, while the set supply airflow, temperature, and relative humidity correspond to the design conditions given in Table 2. For the unoccupied periods, the less favorable supply airflow registered during the tests of 1500 m3/h is considered.
To simplify the prediction of the non-occupied periods, an emergency OR is considered, which is also used during the weekends. Use periods from 7:00 to 15:00 are considered for the estimations. A ventilation setback is established at 1500 m3/h to evaluate the less-favorable scenario. The temperature setback is adjusted to the set points given in Table 2.
The expected savings through the setback operation account for 15,884 kWh of natural gas and 5498 kWh of electricity, corresponding to 75% and 69% energy savings, respectively, which results in a 5664 kgCO2 reduction in the emissions. These predicted energy savings correspond to the expected figures from the literature [16,17].
Since the actual use of the operating rooms is less, these calculations will be conservative. This is justified regarding the use periods registered for the 15 ORs of general use (Table 7). A typical operating schedule is from 8:00 to 15:00, though, usually, at 14:00, all ORs are already no longer being used. On the contrary, the obstetrics and the burns ORs are used on demand and, thus, present unusual occupation; while the obstetrics OR is usually occupied during larger periods than the general ORs, the burns OR is rarely used.
If the results are extrapolated from the total of 18 ORs in the hospital, the annual energy savings would account for 1.12% of the total natural gas and 0.64% of electric energy consumed at the hospital during 2021, which would involve more than 9400 EUR and 10,490 EUR, respectively, as well as a reduction in the carbon emissions of more than 100 tons of CO2. Since the real use periods of the ORs are shorter, the actual energy savings are expected to be more than these estimations.
An investment to equip each OR requires 1682 EUR: 625 EUR for the exhaust fan frequency converter and 200 EUR for the backdraft shutter to enable a pressure-independent exhaust duct, 70 EUR for the occupancy sensor, 212 EUR and 340 EUR for the airflow and the differential pressure sensors, respectively, 60 EUR for minor materials, and 175 EUR for labor costs. For 18 ORs, this implies a total investment of 30,276 EUR, which would be returned in less than two years. Moreover, provided that most ORs are already equipped with most of these systems, the actual investment would be a minor cost.

4. Conclusions

The setback controls of Heating, Ventilation and Air Conditioning systems in Operating Rooms (ORs) can yield large energy savings in hospitals, but they must comply with the safety regulations.
A ventilation setback requires air terminal units (pressure-independent) in both the supply and return ductworks; otherwise, the pressure relationship cannot be guaranteed. The supply airflow and pressure difference must be continuously measured and controlled. This work uses occupancy sensors to control the nonoccupation periods. These sensors must cover the whole OR.
It is accepted that there are no indoor sources of pollutants during the nonoccupation periods. The setback must be applied after a certain period since the last occupation of the OR to ensure the remaining contaminants from the occupants are properly removed. In this work, a 20-min lag was applied, which complied with the standards.
During the ventilation setback, there is no loss of the positive pressure difference required at the ORs, which is nonetheless caused by the door opening during the occupation periods. Consequently, the ventilation setback does not compromise the pressure relationships required for safety issues.
Since the ventilation setback must be controlled to maintain the required positive pressure inside the OR, the reduced supply airflow may be different for each space. Consequently, the energy savings will vary among different ORs, even in the same hospital.
The expected annual energy savings for one OR reach 15,884 kWh of natural gas and 5498 kWh of electricity. The extrapolation for the 18 ORs yields conservative results due to the actual short operating periods and accounts for 1.12% of the total natural gas and 0.64% of the electric energy consumed at the hospital during 2021.

Author Contributions

Conceptualization, J.F.S.-A.; methodology, A.T.-G.; formal analysis, H.L.-P. and A.T.-G.; investigation, F.E.-G. and L.M.N.-G.; data curation, H.L.-P.; writing—original draft preparation, A.T.-G.; and supervision, J.F.S.-A. All authors have read and agreed to the published version of the manuscript.

Funding

This research was funded by ENTE REGIONAL DE LA ENERGÍA of the Regional Government of Castile and Leon (grant number EREN_2019_L2_UVA) and by the European Union through the LIFE Programme, LIFE SMART HOSPITAL project (grant number ENV/ES/001013). The APC was funded by the Institute of Advanced Production Technologies (ITAP) of the University of Valladolid.

Institutional Review Board Statement

Not applicable.

Informed Consent Statement

Not applicable.

Data Availability Statement

The data presented in this study are openly available in https://uvadoc.uva.es/handle/10324/52820.

Acknowledgments

The authors would like to acknowledge the managers and maintenance staff of the University Hospital Rio Hortega for their permission and assistance when developing the study.

Conflicts of Interest

The authors declare no conflict of interest. The funders had no role in the design of the study; in the collection, analyses, or interpretation of the data; in the writing of the manuscript; or in the decision to publish the results.

References

  1. EPTA. Guidelines for energy efficiency in hospitals. EMAS Inf. Technol. Hosp. 2007, 4, 1–15. [Google Scholar]
  2. ASHRAE. Chapter 9. Health care facilities. In ASHRAE Handbook—HVAC Applications; ASHRAE: Atlanta, GA, USA, 2019. [Google Scholar]
  3. Capolongo, S.; Settimo, G.; Gola, M.; Mele, A.; Tolino, B.; D’Alessandro, D.; Fara, G.M.; Bonadonna, L.; Briancesco, R.; Coccia, A.M.; et al. Indoor Air Quality in Healthcare Facilities; Capolongo, S., Settimo, G., Gola, M., Eds.; Springer: Cham, Switzerland, 2017. [Google Scholar]
  4. Yau, Y.H.; Ng, W.K. A comparison study on energy savings and fungus growth control using heat recovery devices in a modern tropical operating theatre. Energy Convers. Manag. 2011, 52, 1850–1860. [Google Scholar] [CrossRef]
  5. Tejero-González, A.; DeFreitas-Barros-Galvão, V.M.; Zarzuelo-Sánchez, A.M.; SanJosé-Alonso, J.F. Energy use optimization in ventilation of operating rooms during inactivity periods. Build. Res. Inf. 2021, 49, 308–324. [Google Scholar] [CrossRef]
  6. García-Sanz-Calcedo, J.; Al-Kassir, A.; Yusaf, T. Economic and environmental impact of energy saving in healthcare buildings. Appl. Sci. 2018, 8, 440. [Google Scholar] [CrossRef] [Green Version]
  7. Short, C.A.; Al-Maiyah, S. Design strategy for low-energy ventilation and cooling of hospitals. Build. Res. Inf. 2009, 37, 264–292. [Google Scholar] [CrossRef]
  8. Spanish Standard UNE 100713:2005 Instalaciones de Acondicionamiento de Aire en Hospitales. 2015. Available online: https://www.une.org/encuentra-tu-norma/busca-tu-norma/norma/?c=N0034264 (accessed on 14 April 2022).
  9. ANSI/ASHRAE/ASHE Standard 170-2021; Ventilation of Health Care Facilities. ASHRAE: Atlanta, GA, USA, 2021; Volume 54.
  10. ASHRAE. HVAC Design Manual for Hospitals and Clinics, 2nd ed.; ASHRAE: Atlanta, GA, USA, 2013. [Google Scholar]
  11. Gormley, T.; Markel, T.A.; Jones, H.; Greeley, D.; Ostojic, J.; Clarke, J.H.; Abkowitz, M.; Wagner, J. Cost-benefit analysis of different air change rates in an operating room environment. Am. J. Infect. Control 2017, 45, 1318–1323. [Google Scholar] [CrossRef] [PubMed]
  12. Woods, J.E.; Reynolds, G.L.; Montag, G.M.; Braymen, D.T.; Rasmussen, R.W. Ventilation requirements in hospital operating rooms—Part II: Energy and economic implications. ASHRAE Trans. 1986, 92, 427–449. [Google Scholar]
  13. Tschudi, W.; Faulkner, D.; Hebert, A. Energy Efficiency Strategies for Cleanrooms without Compromising Environmental conditions. ASHRAE Trans. 2005, 111, 476–484. [Google Scholar]
  14. Castro Ruiz, F.; San José-Alonso, J.F.; Villafruela Espina, J.M.; Guijarro Rubio, Á. Manual de Diseño de la Climatización y Ventilación de Quirófanos y Habitaciones en Centros Hospitalarios en Castilla y León; Mata Digital: Valladolid, Spain, 2011. [Google Scholar]
  15. Wang, F.J.; Chang, T.B.; Lai, C.M.; Liu, Z.Y. Performance improvement of airflow distribution and contamination control for an unoccupied operating room. Int. Build. Perform. Simul. Assoc. 2012. Available online: http://www.ibpsa.org/proceedings/asim2012/0130.pdf (accessed on 14 April 2022).
  16. Cacabelos-Reyes, A.; López-González, J.L.; González-Gil, A.; Febrero-Garrido, L.; Eguía-Oller, P.; Granada-Álvarez, E. Assessing the energy demand reduction in a surgical suite by optimizing the HVAC operation during off-use periods. Appl. Sci. 2020, 10, 2233. [Google Scholar] [CrossRef] [Green Version]
  17. Loomans, M.G.L.C.; Molenaar, P.C.A.; Kort, H.S.M.; Joosten, P.H.J. Energy demand reduction in pharmaceutical cleanrooms through optimization of ventilation. Energy Build. 2019, 202, 109346. [Google Scholar] [CrossRef]
  18. Porowski, M. Energy optimization of HVAC system from a holistic perspective: Operating theater application. Energy Convers. Manag. 2019, 182, 461–496. [Google Scholar] [CrossRef]
  19. Sánchez-Barroso Moreno, G.; García-Sanz Calcedo, J.; González, A.G.; Salgado, D.R. Sustainable solutions for thermal energy saving in hospital operating theatres. E3S Web Conf. 2019, 85, 01002. [Google Scholar] [CrossRef] [Green Version]
  20. John, D.A.; Faris, E.; Sipes, J.M.; Pich, D.; Holdaway, R.G.; Richardson, G.; Tosh, M.M. ASHRAE Design Guide for Air Terminal Units. Selection, Application, Control, and Commissioning; ASHRAE: Atlanta, GA, USA, 2018. [Google Scholar]
  21. Spanish Standard UNE 171340:2020 Validación y Cualificación de Salas de Ambiente Controlado en Hospitales. 2021. Available online: https://www.une.org/encuentra-tu-norma/busca-tu-norma/norma?c=N0064465 (accessed on 14 April 2022).
  22. Rey-Martínez, F.J.; SanJosé-Alonso, J.F.; Velasco-Gómez, E.; Tejero-González, A.; Esquivias, P.M.; Rey-Hernández, J.M. Energy consumption reduction of a chiller plant by adding evaporative pads to decrease condensation temperature. Energies 2020, 13, 2218. [Google Scholar] [CrossRef]
  23. ASHRAE. Chapter 1: Psychrometrics. In ASHRAE Fundamentals; ASHRAE: Atlanta, GA, USA, 2019. [Google Scholar]
  24. IDAE. Factores de emisión de CO2 y coeficientes de paso a energía primaria de diferentes fuentes de energía final consumidas en el sector de edificios en España. In Documento reconocido del Reglamento de Instalaciones Térmicas en los Edificios (RITE); Government of Spain: Madrid, Spain, 2016. [Google Scholar]
  25. Wang, C. Ventilation Performance in Operating Rooms: A Numerical Assessment. Ph.D. Thesis, KTH, School of Architecture and the Built Environment (ABE), Stockholm, Sweden, 2019. [Google Scholar]
Figure 1. Scheme of the OR air handling units.
Applsci 12 04098 g001
Figure 2. Systems affected by the ventilation setback and the energy demand and supply.
Applsci 12 04098 g002
Figure 3. Nonconforming pressure relationships (% time) and average pressure differences registered.
Applsci 12 04098 g003
Figure 4. Pressure relationships registered in OR1 during test 1.
Applsci 12 04098 g004
Figure 5. Hourly energy savings achieved at each OR during the summer and winter periods.
Applsci 12 04098 g005
Table 1. Measured parameters in the OR through the SCADA.
Measured ConditionsVariables
AHU operating conditionsSupply fan frequency converter (Hz)
Return fan frequency converter (Hz)
Pre-heating coil valve (%)
Humidifier (%)
Cooling coil valve (%)
Heating coil valve (%)
Indoor conditionsDry Bulb Temperature (°C)
Relative Humidity (%)
Overpressure (Pa)
Supply conditionsDry Bulb Temperature (°C)
Relative Humidity (%)
Volume airflow (m3/h)
Outdoor conditionsDry Bulb Temperature (°C)
Relative Humidity (%)
Table 2. Controlled parameters in the OR through the SCADA.
Controlled VariablesSet Value
Supply volume airflow2500 m3/h
Indoor overpressure15 Pa
Supply Dry Bulb TemperatureDuring occupation: 22.0 °C
During non-occupation: 19.0 °C (winter),
25 °C (summer)
Min. 14.0 °C
Max. 28.0 °C
Supply Relative HumidityMax. 60%
Indoor Relative Humidity35%
Table 3. Tests dates and duration.
TestDuration (hours)Dates
178.77–10 December
283.317–21 January
313.67–8 April
465.526–29 July
58315–19 August
Table 4. Ventilation requirements in operating rooms (ORs).
StandardOR Type/Ventilation ModeMinimum Total Air (ach) 1Pressure
Relationship to Adjacent Areas
Minimum Pressure
Differential
UNE 171340:2020 (Spain) [21]High risk ORs/
unidirectional airflows
20206 Pa
High risk ORs/
mixing ventilation
2015
General1510
ANSI/ASHRAE/ASHE Standard 170-2021 (USA) [9]All ORs/Unidirectional airflow20Positive2.5 Pa
1 ach: air changes per hour.
Table 5. Results for the pressure relationships registered during the tests.
TestORVentilation ModeTotal Time (h)Average Pressure
Difference (ΔP)
Average Values
Nonconforming
Pressure Differences 1
(Pa)
Minimum Values
Nonconforming
Pressure Differences 1
(Pa)
1OR1Regular26.515.71.40.0
Setback52.215.5nana
OR2Regular0.817.2nana
Setback77.914.9nana
2OR1Regular24.115.71.30.0
Setback59.215.1nana
OR2Regular8.715.4nana
Setback74.614.9nana
3OR1Regular13.615.11.70.0
Setback0.0nanana
OR2Regular5.914.6nana
Setback7.215.4nana
4OR1Regular20.015.01.10.0
Setback45.515.1nana
OR2Regular4.516.7nana
Setback60.914.8nana
5OR1Regular40.715.21.30.0
Setback42.315.10.00.0
OR2Regular8.315.20.90.1
Setback74.714.8nana
1 Total time when the pressure differences registered are below 6 Pa. na: not applicable/no cases registered.
Table 6. Energy and emissions savings under the setback operation.
TestORSetback
Operation (%Time)
Natural Gas
Energy Savings (kWh)
Fans Electric Energy Savings (kWh)Total Electric Energy Savings (kWh)Total Carbon
Emissions (kgCO2)
1OR166%541.054.954.9149.1
OR299%517.476.776.7150.6
2OR171%614.958.658.6168.2
OR290%489.370.170.1141.6
3OR10%nananana
OR255%155.529.429.447.3
4OR169%50.847.578.428.1
OR293%97.960.586.543.7
5OR151%32.941.675.021.7
OR290%50.271.6130.835.8
na: not applicable/no cases registered.
Table 7. Average OR occupation periods registered in 1 week (general use ORs).
MondayTuesdayWednesdayThursdayFridaySaturdaySunday
Average (h)8899712
Standard deviation (h)1.52.12.11.91.70.92.8
Publisher’s Note: MDPI stays neutral with regard to jurisdictional claims in published maps and institutional affiliations.

