Article

Influence of Vegetation Filter Strip on Slope Runoff, Sediment Yield and Nutrient Loss

Research Center for Engineering Ecology and Nonlinear Science, North China Electric Power University, Beijing 102206, China
*
Author to whom correspondence should be addressed.
Appl. Sci. 2022, 12(9), 4129; https://doi.org/10.3390/app12094129
Submission received: 4 March 2022 / Revised: 15 April 2022 / Accepted: 18 April 2022 / Published: 20 April 2022
(This article belongs to the Special Issue Overexploitation and Restoration of Natural Resources)

Abstract

:
It is an important branch of erosion research to control soil erosion on eroded gullies and slopes by using vegetation filter strip. Several simulated rainfall experiments were carried out in soil tanks filled with loess sandy loam taken from a typical eroded gully area with less vegetation coverage in Yanghe hilly basin in Xuanhua District, Zhangjiakou City, Hebei Province. The soil and water conservation effects of two different vegetation setting modes were compared under the same vegetation strip width and different rainfall intensities and slopes. During the rainfall process, the changes of runoff and sediment yield and nutrient loss were not stable, but the same erosion index had similar variation trends under different combinations of rainfall intensity, slope and vegetation coverage. Multiple regression results showed that runoff and sediment production in eroded gully can be effectively reduced through vegetation filter strips, which are jointly affected by rainfall intensity and slope. There was no significant difference in the amount of runoff and sediment yield between the two vegetation setting modes. Rainfall intensity and slope gradient showed different strengths of impact on nutrient loss. Through cluster analysis, the results showed that the impacts of rainfall intensity, slope gradient and vegetation setting modes on soil and water loss on slope can be equal or offset. In general, setting vegetation filter strips can offset the effects of rainfall intensity and slope, but vegetation regulation of erosion was not obvious under extreme rainfall and steep slope conditions. What’s more, rainfall intensity had a dominant effect on erosion. The results in this research may provide reference for practical application of vegetation filter strips on eroded slopes.

1. Introduction

Soil erosion is one of the major ecological and environmental problems worldwide, which has severely restricted the sustainable development of agriculture and disturbed the balance of terrestrial and aquatic ecosystems [1,2,3,4]. For controlling the soil erosion, vegetative filter strips (VFSs) are often adopted as an effective management practice. From long-term practices, it has been proved that the VFSs are the best eco-friendly and economical way which has been widely welcomed in dealing with the problem of soil erosion [5,6].
The VFS is a belt-shaped vegetation area often located at the lower edge of a field [7,8]. It can reduce surface runoff and sediments through biological, chemical, physical and other means, relieving the pressure on aquatic environment [9,10]. For example, the VFS can increase hydraulic resistance to surface flows and therefore reduce the surface flow velocity, promoting infiltration and decreasing sediment transport [11]. Moreover, VFS exerts effective influences on source pollution via removing suspended solids, nutrients and pesticides from runoff [12,13,14]. Many studies show that VFS has a good interception on sediments, nitrogen, phosphorus and other pollutants and plays an important role in protecting water bodies [15,16].
The effect of VFS is related to a few influencing factors, including plant species, vegetation density, bandwidth, slope angle, slope length, surface roughness, inflow discharge, soil properties and so on [7,17,18,19,20,21,22]. Essentially, the characteristics of VFS have determinative effects on runoff and sediment trapping. First of all, the species-specific performance is most important responsible for the VFS characteristics [7,23]. Studies have measured that VFS of grass can reduce runoff and sediment up to 60% and 80%, respectively, by filtration, deposition, and infiltration [24,25]. Zuazo et al. [26] conducted experiments on the slopes of olive groves and found that the sand reduction rate of ryegrass strips was 71%, while that of mixed strips of oat grass and thyme was only 59%. By comparing different plants, it was found that the creeping plants with large leaves have a better sand blocking effect than the straight plants [27]. Generally, the biomass in VFS is linearly correlated with the interception effect of suspended particulate matter [28]. Another important characteristic of VFS is bandwidth. An experiment showed that 53% of soluble N and P can be removed from runoff with 0.7 m wide fescue filter strips [29]. In the experiment of Dillaha et al. [30], they measured the effect of the VFS width: when the width was 9.1 m, the VFS could effectively intercept 91% of solid sediment, 69% of phosphorus and 74% of nitrogen in the wastewater; when the width was 4.6 m, 81% of solid sediment, 58% of phosphorus and 64% of phosphorus in wastewater could be effectively intercepted.
In addition to the self-characteristics of the VFS, the effects of external factors such as inflow discharge, soil property, rainfall intensity and slope gradient are also quantitatively determined in numerous experiments. Li et al. [31] and She et al. [32] studied how inflow discharge influences the purification effect of VFS on suspended particulate matter and nutrient salts in runoff. She et al. [32] measured that when the inflow was 200, 400 and 600 L·h−1, the interception rates of the simulated VFS for N were 74.9%, 62.0% and 58.3%, and the interception rates for P were 85.0%, 75.6% and 72.0%, respectively. The interception effect is significant when the incoming water flow is low. Klatt et al. [33] found the removal of nitrate through denitrification in VFS mainly depends on the physical and chemical properties of soil. VFS can remove larger sediment particles of sand and silt primarily, while clay particles may be partially removed depending on strip width. The factors of rainfall intensity and slope gradient affect the effectiveness of VFS through inflow velocity, hydraulic retention time and infiltration rate [34].
Previous studies have made achievements in quantitatively determining the relationship between VFS effect on soil erosion and single influencing factor under specific conditions. Nevertheless, erosion is affected by multiple factors, and the contribution rates of rainfall intensity, slope and vegetation are different under diverse conditions. For preventing and controlling soil erosion provided in specific conditions, multiple plans need to be considered since the construction of slope ecological projects was often limited by actual topographic and meteorological conditions. Considering that VFS effects are influenced by many factors, it would be helpful to design effective VFS for different situations to understand how these factors jointly influence VFS erosion control. On the basis of the existing research, it is worth further exploring the mutual influence or offset effect among the various factors on soil erosion. In this study, under the conditions of different slopes and rainfall intensities, the effects of VFS with different setting modes on runoff and sediment reduction and interception of nutrient loss were studied. Combined with the method of multiple regression and cluster analysis, the comprehensive influence of multiple factors on the effect of VFS was discussed. It is confirmed that effects of various factors on erosion can be equal or offset, which may provide interesting reference for the practical application of vegetation filter strips.

2. Materials and Methods
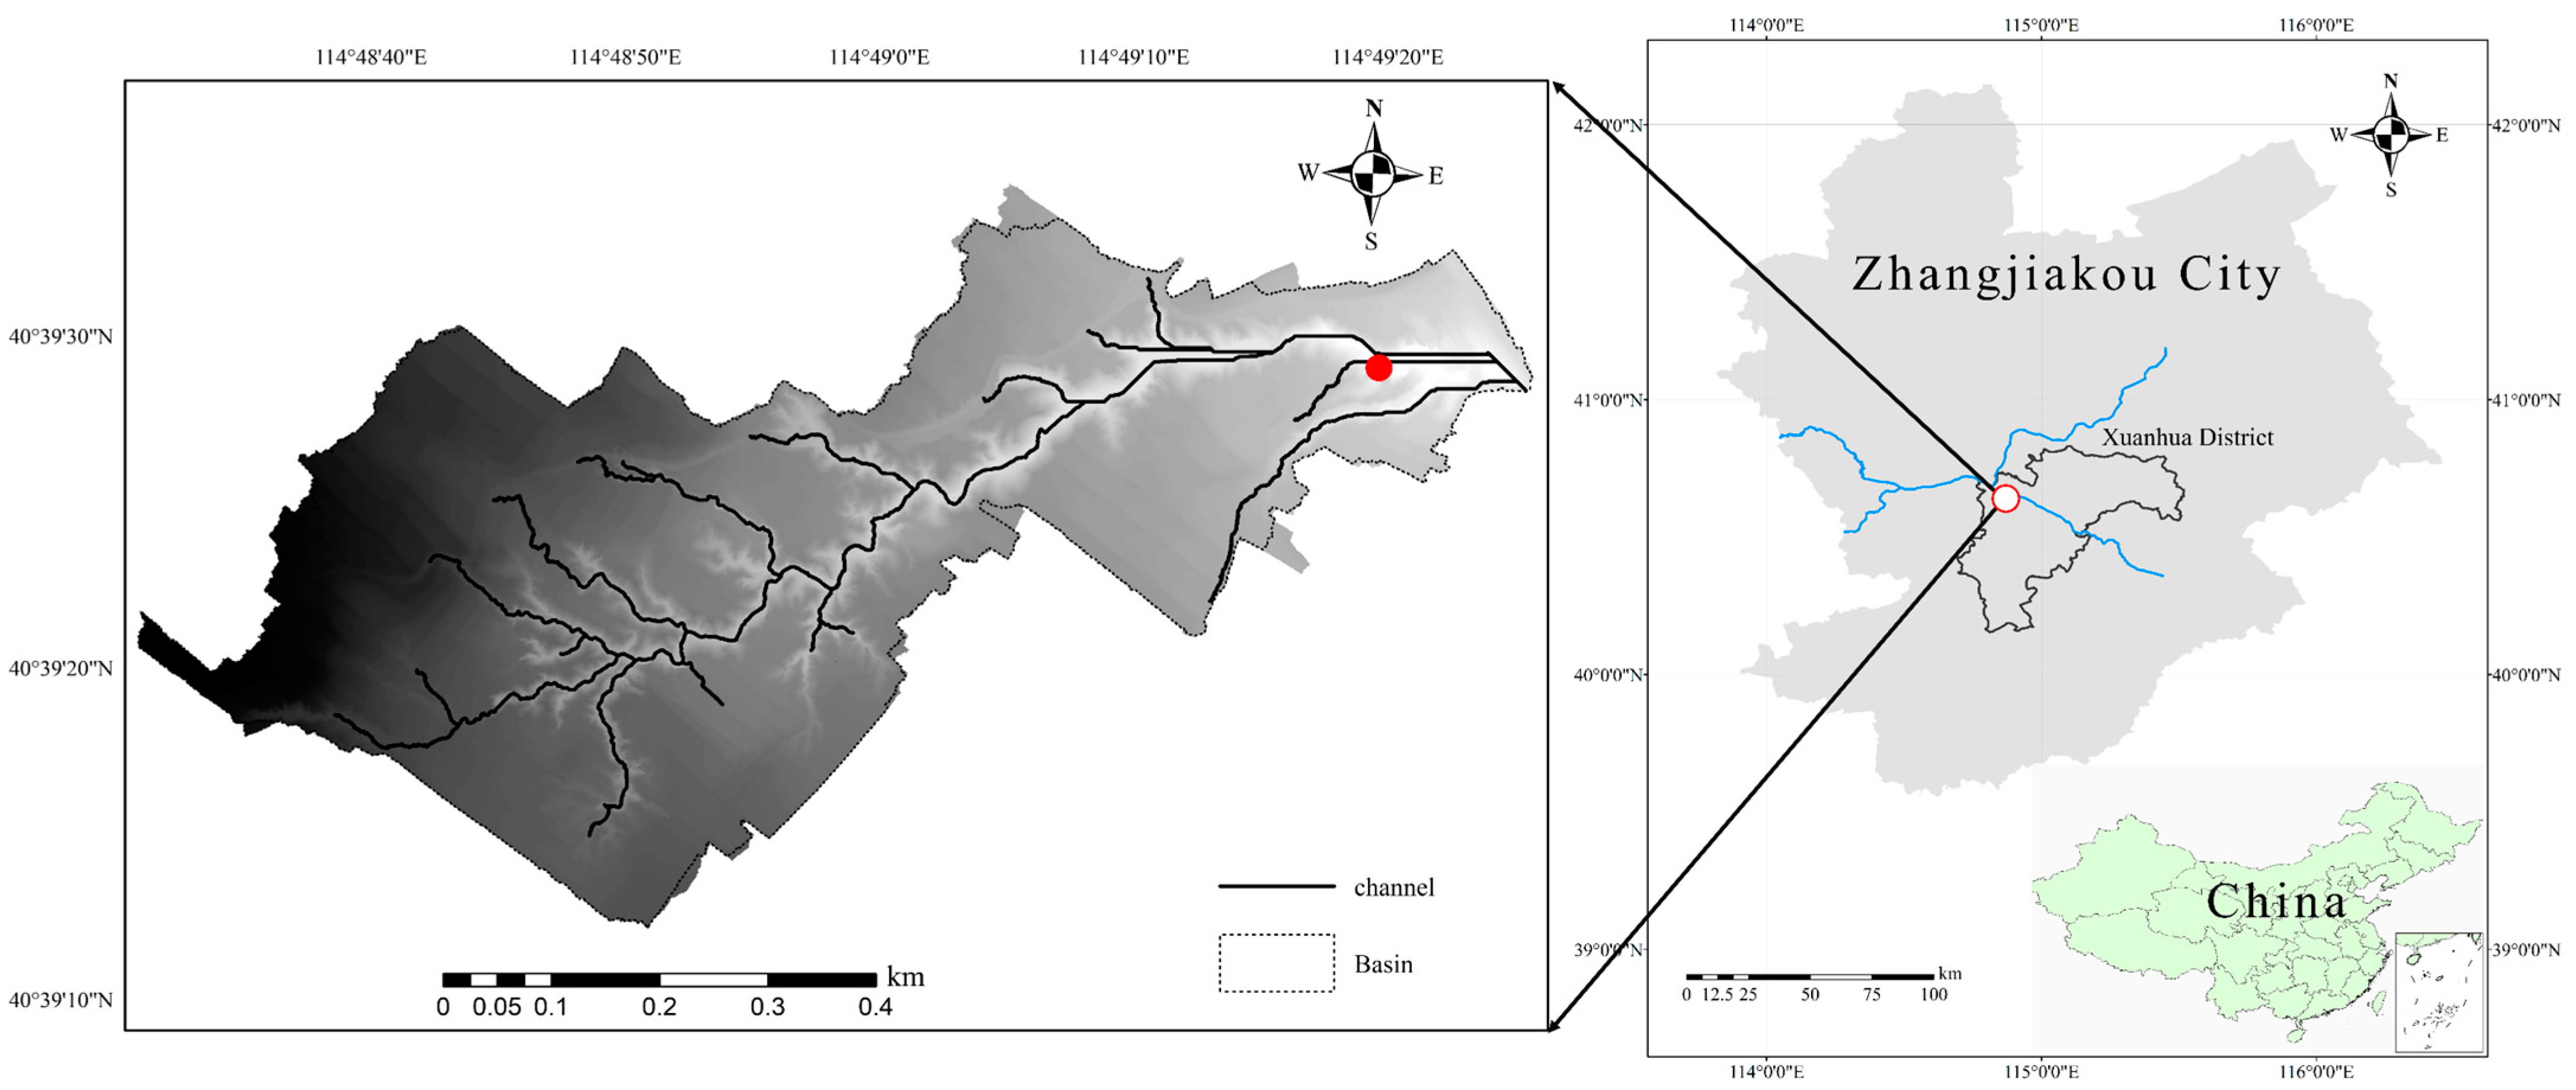
2.1. Study Area

The soil erosion experiment was carried out at a gully area test station in Xuanhua District, Zhangjiakou City, Hebei Province, China. The study area (Figure 1) located in the south of the Yanghe Basin, with an area of about 0.39 km2, the landform type is typical hills. The main river channel in the study area is a non-permanent gully, with a length of nearly 1 km from north to south, and several tributaries (114°48′31″ E–114°49′25″ E, 40°39′12″ N–40°39′34″ N). The climate features are continental, semi-arid and monsoon climate. The mean annual precipitation is 353.77 mm (mainly occurring between July and August), and the mean annual temperature is 5.8 ℃. The soil in this area is mainly loess, which has the nature of sandy loam, loose structure, coarse soil particles, ordinary water-holding capacity and easy erosion. Sand had the highest particle-size fraction (85.0%), followed by clay (8.0%) and then silt (7.0%) in the 0–40 cm soil layer. The steady permeability is about 16.2 mm h−1 and the bulk density is 1.28 g cm−3. The percentage of organic matter in the topsoil (0–10 cm) is 1.41%. In addition, the total nitrogen (TN) content in the original soil is 1.10 g/kg and the total phosphorus (TP) content is 1.23 g/kg.

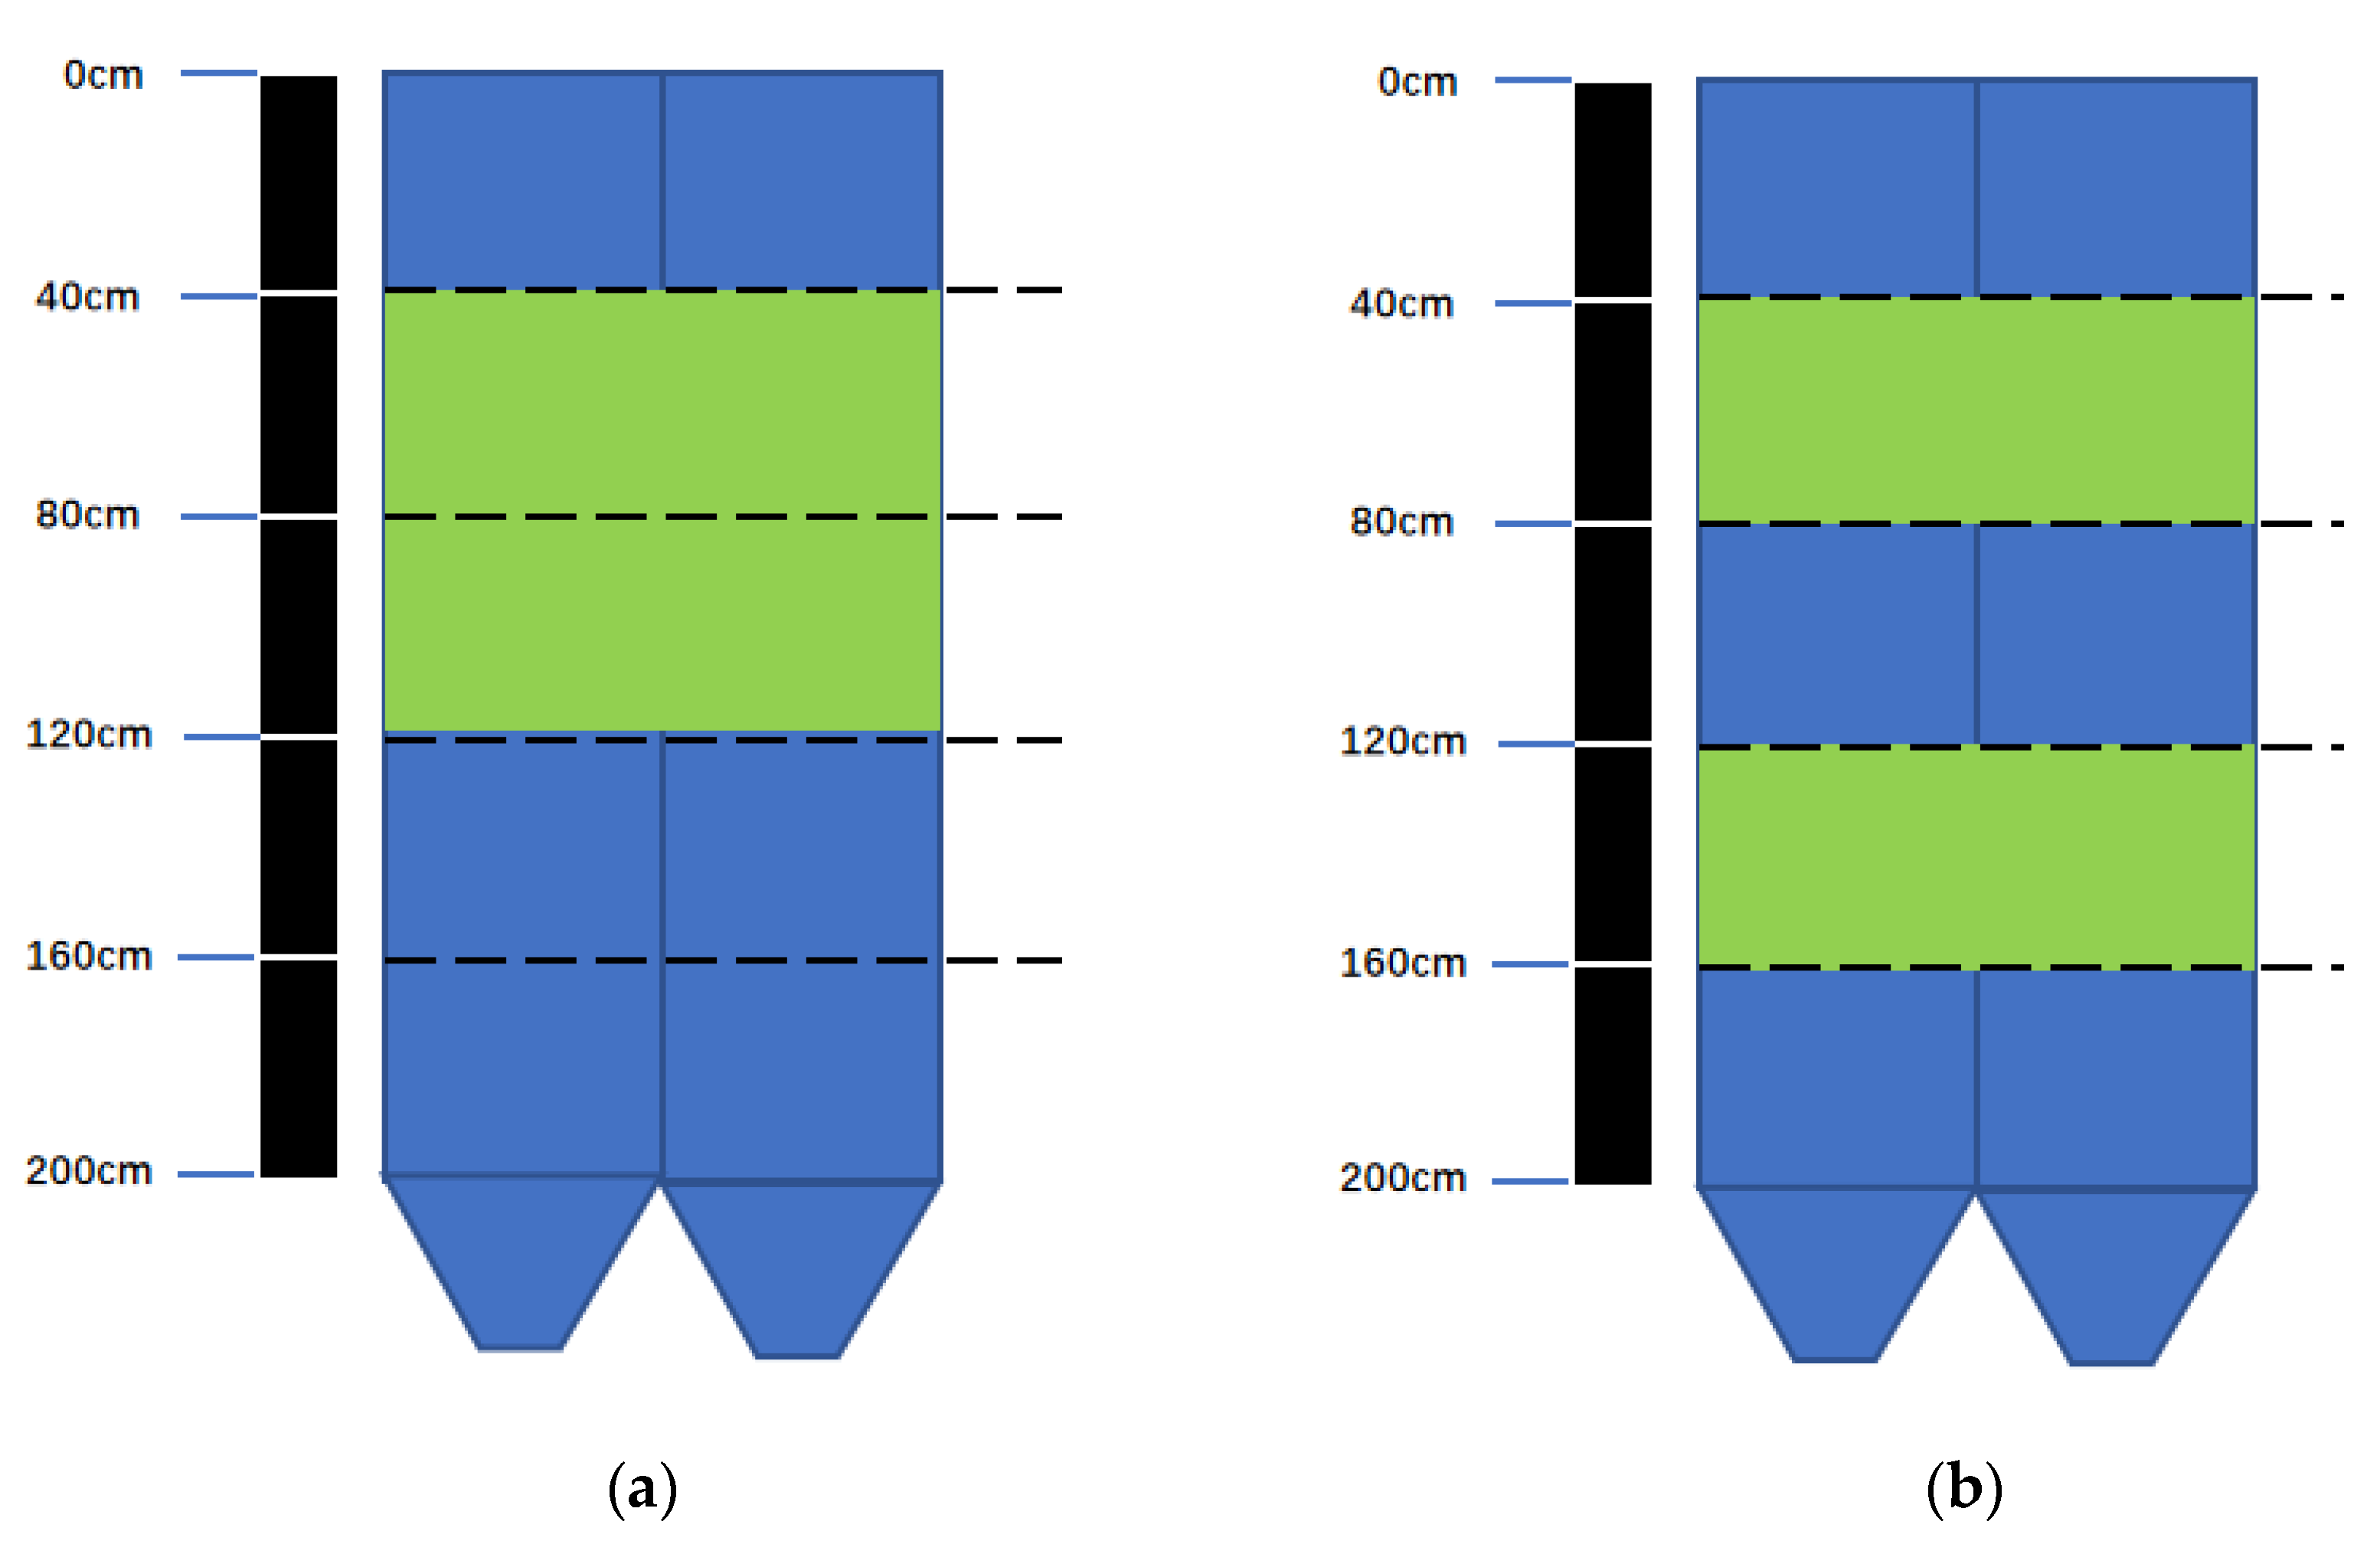
2.2. Experimental Design and Measurement

The experiment was based on three independent variables that included the setting modes of VFS, the slope gradient and the rainfall intensity. Through the analysis of the terrain slope of the study area, three gradient variables of 5°, 20°, 35° were selected; according to the rainfall data of meteorological station set in the study area, three rainfall intensities of 30, 60, and 90 mm/h were selected. In order to study the effects of vegetative filter strips with different settings, the two VFSs were set up as shown in Figure 2 and were named VFS1 and VFS2, respectively.
Based on a field survey on the entire area of the eroded gully, the representative herb that grows well in the area, Stipa benthamiana, was selected as the vegetation for the experiment. Stipa benthamiana is a grassy herb widely distributed in arid regions, sensitive to water conditions and holding strong tillering ability. In the experiment, after the tanks were filled with soil, the trench was opened according to the setting modes of the vegetation filter strip. Then, Stipa benthamiana was excavated from the waste slope of the study plot, and the bottom root system was retained and transplanted with soil into the tank. The distances of plant stems in the VFS were the same as the original growth conditions surveyed in the field. After the vegetation was transplanted, enough water was sprinkled on the slope to ensure that the basic experimental conditions of the slope were consistent.
The soil tank (Figure 3) used in the experiment was a two-in-one runoff tank with variable slope and the tank size was length × width × depth 2 m × 1 m × 0.4 m. This time, the combination of the two tanks was selected, that is, the actual width of each simulated micro-runoff plot was 0.5 m. The settings of the two sub-tanks in a radial flow tank were exactly the same. A confluence is provided at the lower end of every runoff tank and every exit is equipped with a bucket for collecting surface runoff generated by rainfall. The nozzle height of artificial simulated rainfall system can be adjusted within 3–6 m, and the terminal velocity of raindrop is close to that of natural rainfall. It can control the rainfall intensity of 20–200 mm/h, and the rainfall uniformity is 65–95%, which can basically meet the test requirements. The soil used in the experiment was taken from the gully slope of the study area. The soil was stratified with 10 cm as the standard and kept consistent with the bulk density of the original soil.
Considering the influence of wind and natural rainfall, the tests were conducted in the morning without wind or rain in 2019–2020. The rain intensity was calibrated before the formal test. After the calibration, the slope of the flume was adjusted from left to right in a sequence of 5°, 20° and 35°. When the water flow on the slope was laminar, it was regarded as the beginning of runoff production. After recording the time required for runoff production, a bucket was placed at the outlet to collect runoff and sediment samples. After the production flow stabilized, the time for each test began and lasted 30 min (excluding the production flow time). The discharge outlet was directly connected with the 100 mL sampling bottle to take the discharge sediment mixture for 1, 7, 13, 19 and 25 min after retiming, and there were buckets placed at the outlet to receive the runoff in the rest of the time. The end flow time and water level in the bucket were recorded at the end of rainfall. Then we mixed the water sample in the bucket and took a mixed water sample in a 500 mL sampling bottle. Since the slope was not changed after setting, the experimental combination mode was shown in Table 1.
After the end of the experiment, put the mud-water mixture sample for 6 h and let it stand for clarification until the sediment is completely precipitated, then slowly pour out the supernatant, transfer it to the weighed beaker and wash the sampling bottle 3 times. The samples were dried (105 °C, 6 h) and weighed, and the dried sediments were passed through a 100-mesh sieve to determine the total nitrogen and total phosphorus concentrations in runoff and sediments, respectively. The total phosphorus content in runoff was determined by over-flow injection-ammonium moly date spectrophotometry, and the total nitrogen content in runoff was determined by alkaline potassium persulfate digestion ultraviolet spectrophotometry. Furthermore, the content of total phosphorus and total nitrogen of sediment were determined by acid hydrolysis method and semi-trace Kelvin method, respectively.

2.3. Data Analysis

2.3.1. Multiple Regressions

Multiple regression analysis was used to analyze the relationship between rainfall intensity, slope gradient, vegetation and erosion indexes. The vegetation coverage types including bare land (L), one filter zone (Z) and two filter zones (Z′) in this research belong to qualitative variables, which need to be converted into dummy variables and then introduced into equations, so that the regression results obtained had clear explanatory significance [25]. Usually, it is necessary to set n−1 dummy variables for qualitative variables with n types [25]. In this research, dummy variables V0 and V1 were used to assign values to vegetation.
V 0 = 1 ,   L 0 ,   not   L V 1 = 1 ,   Z 0 ,   not   Z
The multiple linear regression model was established as follows:
Y = a 0 + a 1 × R + a 2 × S + a 3 × V 0 + a 4 × V 1
where Y is the erosion index, R is the rainfall intensity (mm/h), S is the slope gradient (°), ai (I = 1, 2, 3, 4) is regression coefficient of the corresponding factor and a0 is a constant term.
Describing the relationship between erosion and rainfall intensity and slope gradient under different vegetation coverage types can reflect the vegetation benefits more clearly and explain the difference in the impact of two vegetation setting modes on erosion control. The following regression equation was used under different vegetation coverage types:
Y = a 0 + a 1 × R + a 2 × S
where the explanation of the symbols is the same with Equation (2).

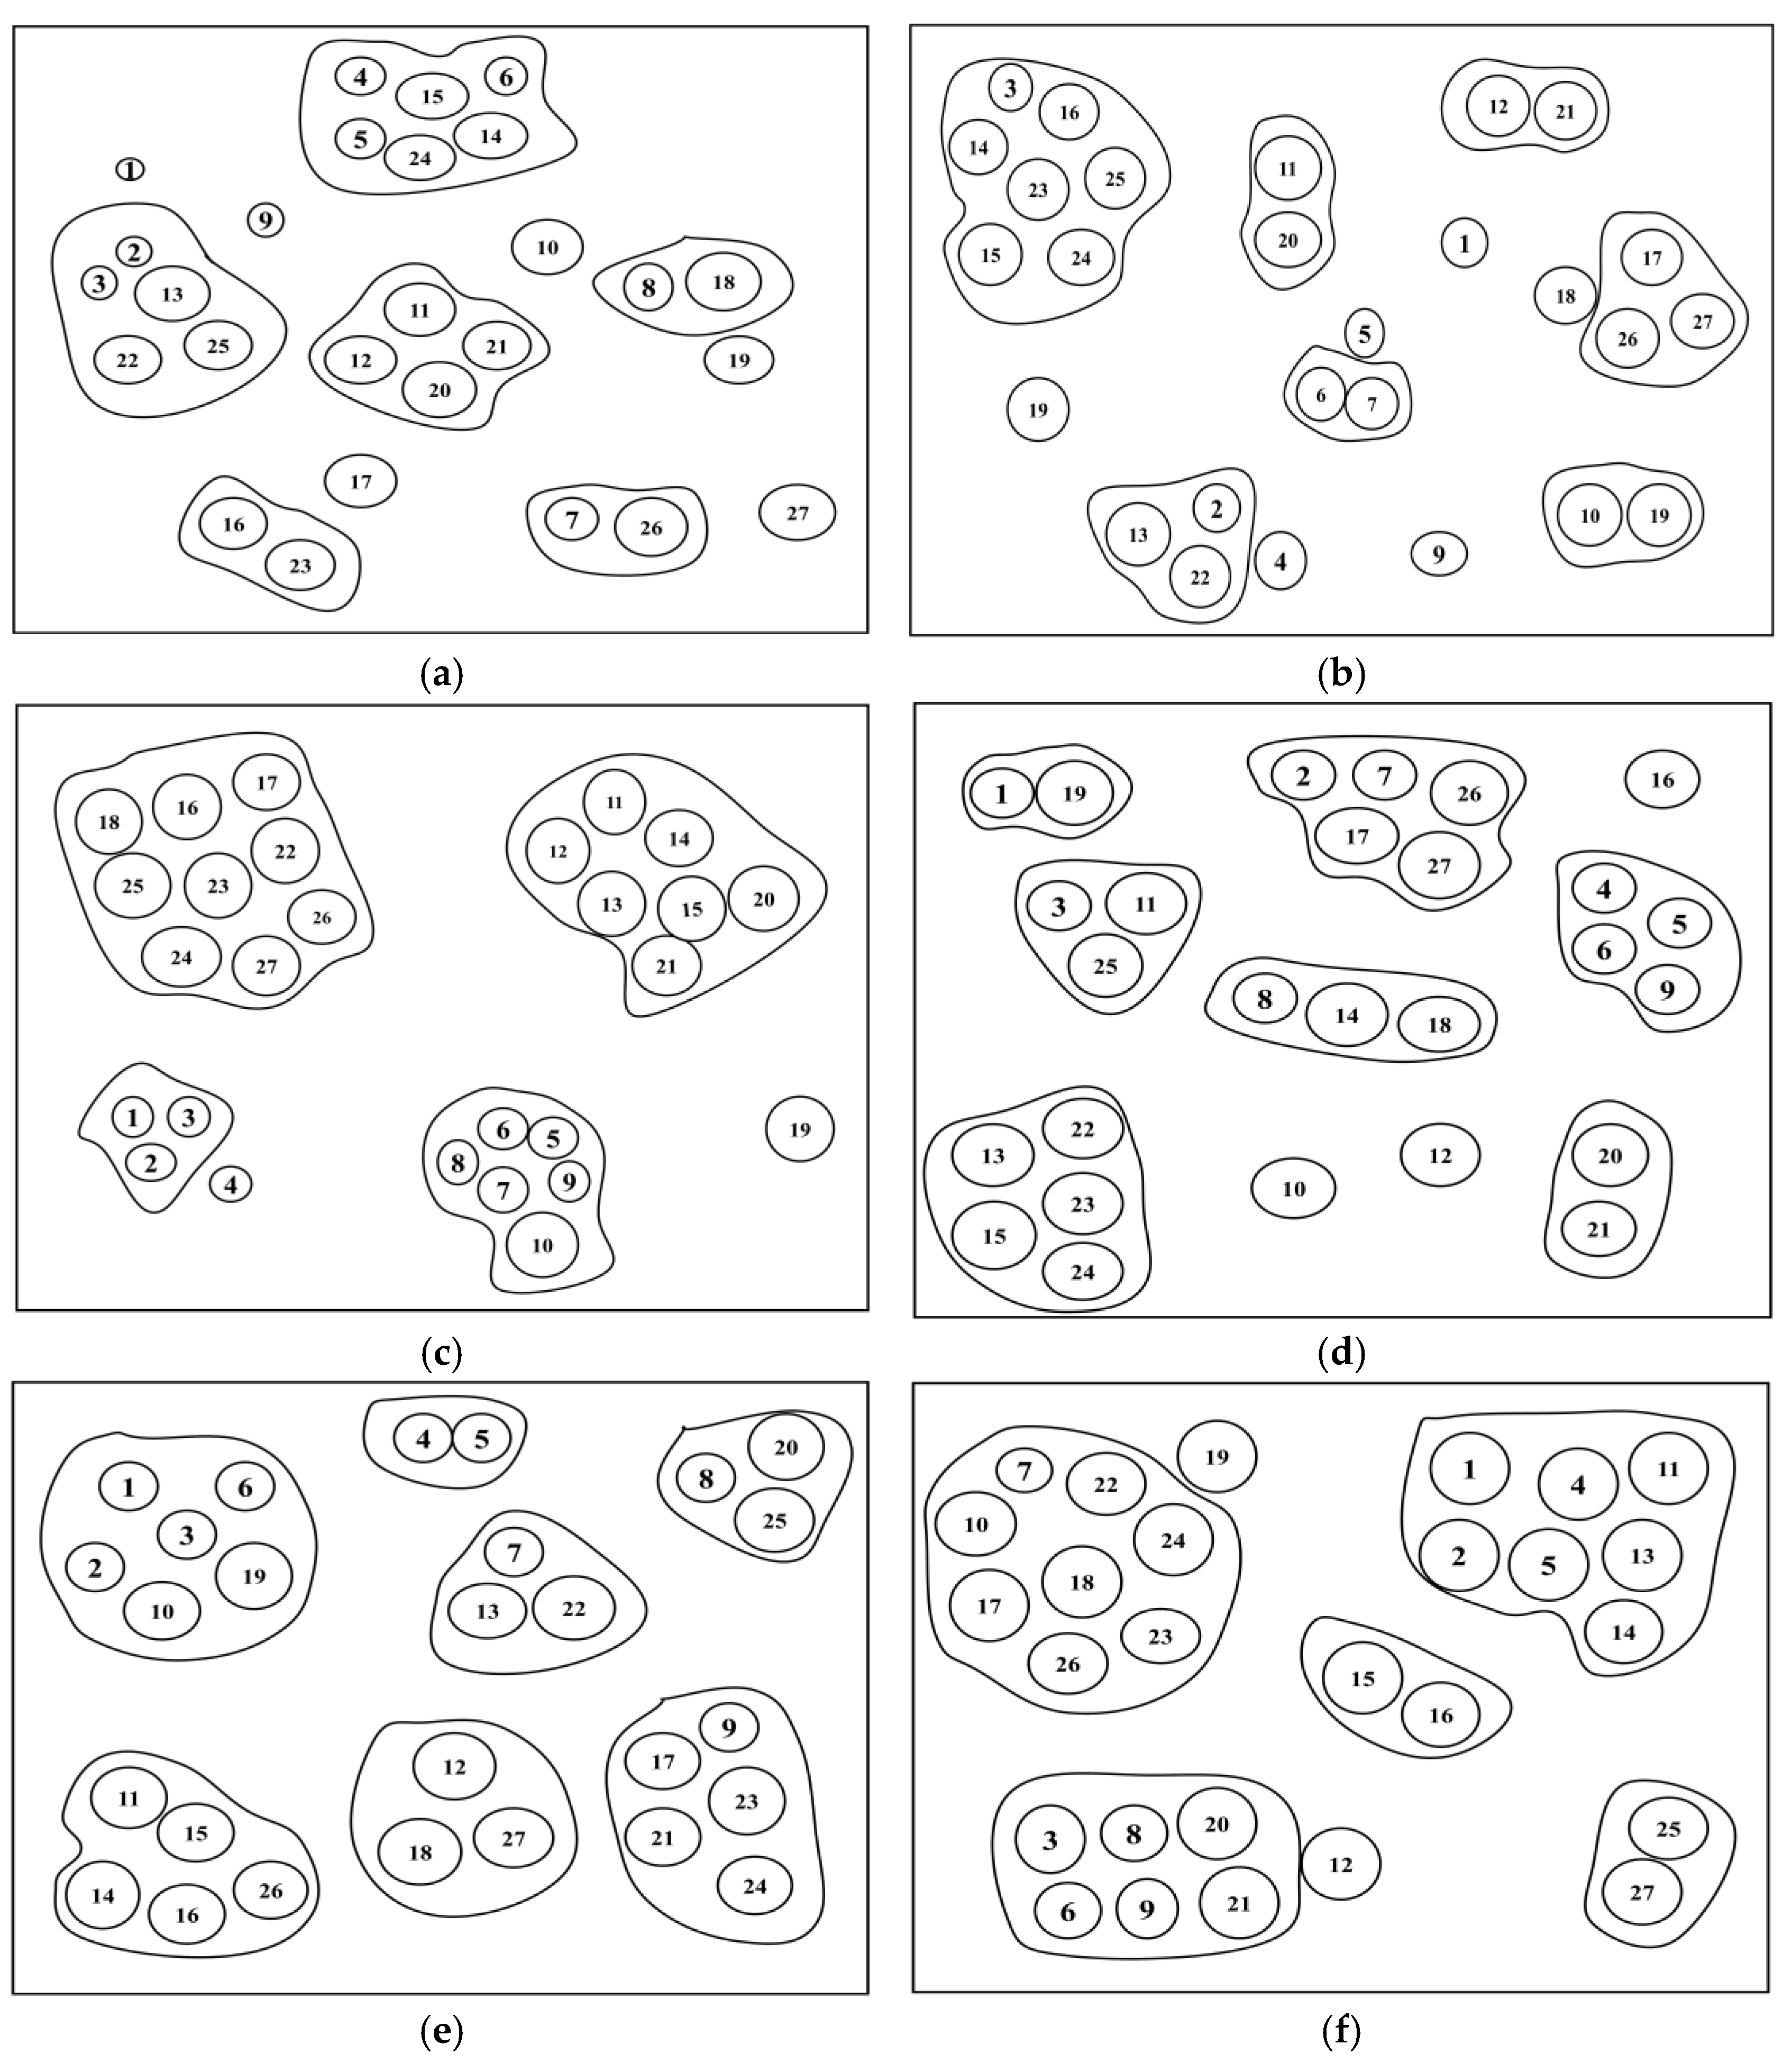
2.3.2. Cluster Analysis

The test results of the samples corresponding to the two sub-tanks were averaged, and these average values obtained were used as a basis for analysis. In order to analyze the comprehensive effects of rainfall intensity, slope gradient and vegetation coverage type on soil erosion and nutrient loss on slope surface, clustering analysis method in data mining was adopted [35].
Clustering is the process of dividing data objects into classes or clusters, which makes the objects in the same cluster have a high degree of similarity, while the objects in different clusters have a high degree of difference. As a function of data mining, cluster analysis can be used as an independent tool to obtain data distribution, to observe the characteristics of each cluster, and to focus on certain specific clusters for further analysis. However, the clustering analysis of data needs to calculate dissimilarity matrix first. The dissimilarity matrix is usually represented by an n × n table:
0 d 2 , 1 0 d ( 3 , 1 ) d ( 3 , 2 ) 0 d ( n , 1 ) d ( n , 2 ) 0
where d(I, j) is the measurement difference or divergence between objects I and j, and is usually a non-negative value. The more similar or “close” objects I and j are, the closer the value is to 0; the more different the two objects, the greater the value. Since d(I, j) = d(j, i) and d(I, i) = 0, we have the above matrix. The dissimilarity is evaluated based on the attribute value describing the object, usually using a distance metric. In addition, d(I, j) is generally calculated by Euclidean distance (Han and Micheline, 2006):
d i , j = x i 1 x j 1 2 + x i 2 x j 2 2 + + x i n x j n 2
where I = (xi1, xi2, …, xin) and j = (xj1, xj2, …, xjn) are two n-dimensional data objects.
The calculation method of dissimilarity varies according to the variable describing the object. Furthermore, the method of ratio-scaled variable was selected to calculate the dissimilarity matrix according to the experimental results. The ratio-scaled variable takes a positive measurement value on a nonlinear scale (such as an exponential scale). Through logarithmic transformation of the ratio-scaled variable, the value obtained can be regarded as an interval value, and the distance calculation method is used for processing. Thus, the dissimilarity between objects described by ratio-scaled variable can be calculated.
The dissimilarity matrix related to various index (runoff yield, sediment yield, TN content, TP content) was calculated to determine the similarity between different treatment methods.

3. Results

In this section, the analysis results of runoff production, sediment yield and nutrient loss were described for different combinations of rainfall intensity, slope gradient and vegetation settings. The effects of VFS on the runoff production and the sediment yield were shown in Figure 4 and Figure 5, while the effects of VFS on nutrient loss indexed by TN and TP were then shown in Figure 6 and Figure 7.

3.1. The Effects of VFS on Runoff Production and Sediment Yield

3.1.1. The Effects of the VFS on Runoff Production

As shown in Figure 4a, under the condition of 30 mm/h rainfall intensity and of 5° slope, runoff yields for VFS1 and VFS2 were 3.82 L and 3.38 L, respectively, reducing by 31% and 39% in comparison with the control. In such case, it can be seen that the effect of VFS2 on runoff reduction was better than that of VFS1. However, under the same rainfall intensity but the slope gradient increased to 20°, the runoff reduction of VFS1 turned to be higher than that of VFS2. Compared with the control, the reduction rates of runoff production under both VFSs were 52% and 47%, respectively. When the slope gradient increased from 20° to 35°, a similar result was reached for the comparison of VFSs effect. Under 60 mm/h rainfall intensity (Figure 4b), VFS1 reduced 33%, 3% and 10% runoff production on three slope gradients compared with the control, and VFS2 showed a 14% higher effect than that of VFS1 on 20° slope and a weaker effect on 5° and 35° slope. Under 90 mm/h rainfall intensity (Figure 4c), the comparison of VFS1 and VFS2 demonstrated opposite results to that of 60 mm/h rainfall intensity for the three slope gradients (Figure 4c). The reduction of runoff production under VFS2 was 13% less on 20° slope and 8% more on 5° and 35° slope than that under VFS1.
Based on the analysis of the experimental results, we did not reach a consistent conclusion on the interception effect of VFS1 and VFS2 on runoff. According to the results of runoff yield, we calculated that when other factors were fixed and rainfall intensity increased from 30 mm/h to 60 mm/h and 90 mm/h, the average interception effect of VFS1 on runoff decreased from 43% to 15% and 36%. When the slope increased from 5° to 20°and 35°, the average interception effect of VFS1 on runoff decreased from 37% to 33% and 24%. A previous study have also shown that VFS can effectively intercept runoff by reducing runoff velocity, and increases the infiltration rate [36]. However, the increase of rainfall intensity and slope gradient affects the runoff interception benefit of VFS [37]. Wen at al. [38] also proved that compared with the bare land control group, the flow reduction effect of grassland filtration zone was significantly reduced after rainfall intensity and slope were increased, respectively. This was close to the result of our research. However, when the VFS was adjusted from VFS1 to VFS2, its interception effect on runoff was different. When the rainfall intensity was small, the closure effect of VFS2 was not as good as that of VFS1 with the increase of slope, which may be due to the small infiltration amount of exposed surface existing in the middle of VFS2, thus increasing the production flow rate. In addition, the closure effect of VFS2 became worse and worse with the increase of slope in the case of heavy rain. However, VFS2 had a more significant closure effect on the 20° slope with moderate rainfall intensity than VFS1, which was contrary to the case with heavy rain intensity. It is speculated that there may be a critical slope gradient of runoff production, which has different effects on the effects of VFS1 and VFS2 under two rain intensity conditions.

3.1.2. The Effects of the VFS on Sediment Yield

When the rainfall intensity was 30 mm/h, as shown in Figure 5a, under three slope conditions, the difference of sediment reduction effect of the two VFSs was consistent with that of runoff reduction effect. However, when the rainfall intensity increased to 60 mm/h, the sediment interception effect of VFS1 and VFS2 showed a completely opposite performance to the interception effect according to Figure 5b. In addition, for three slopes with a rainfall intensity of 90 mm/h (Figure 5c), the effect of the two VFSs in reducing sediment yield can be concluded to be consistent with the rainfall intensity of 60 mm/h. This indicated that the rainfall intensity had a great influence on the sediment interception effect of VFS under the combination of two setting modes and three slope gradients in this study.
According to the results of sediment yield on the slope, the sediment yield on the slope increased with rainfall intensity and slope gradient. Compared with the bare land control, regardless of the rain intensity and slope conditions, VFS can effectively reduce the sediment yield on the slope. VFS can increase surface resistance and promote rainfall infiltration and sediment deposition so as to reduce slope soil loss simply and effectively [39,40]. Similar to the runoff data, there was no linear correlation between the sediment interception effects of the two VFSs. When the slope remained unchanged, the average reduction rate of VFS1 for slope sediment yield was 40%, 33% and 52%, respectively, as the rainfall intensity increased from 30 mm/h to 60 and 90 mm/h. When the rainfall intensity remained unchanged and the slope increased from 5° to 20° and 35°, the average reduction rate of VFS1 for slope sediment yield was 38%, 45% and 42%, respectively. In terms of the overall sediment interception effect of VFS1 and VFS2, the sediment reduction effect was negatively correlated with the slope under the condition of light rainfall intensity, but the steeper the slope was, the smaller the impact of the slope on the sediment reduction rate was. This was consistent with the simulation study [41]. However, with the increase of rainfall intensity, the sediment interception effect of VFS1 increased with the increase of slope. After the rain intensity continued to increase, the effect of VFS1 changed inconsistently at about 20°, so it was speculated that the impact of critical slope might be the same as the runoff yield. This was also reflected in the effects of VFS2. A study showed that when the average stalk spacing of vegetation was greater than 3 cm, soil erosion was likely to occur within the filter strip, leading to an increase in slope sediment yield. In this experiment, the spacing of VFS according to their actual growth distribution may also affect the sediment interception effect of VFS.

3.2. The Effects of the VFS on Nutrient Loss

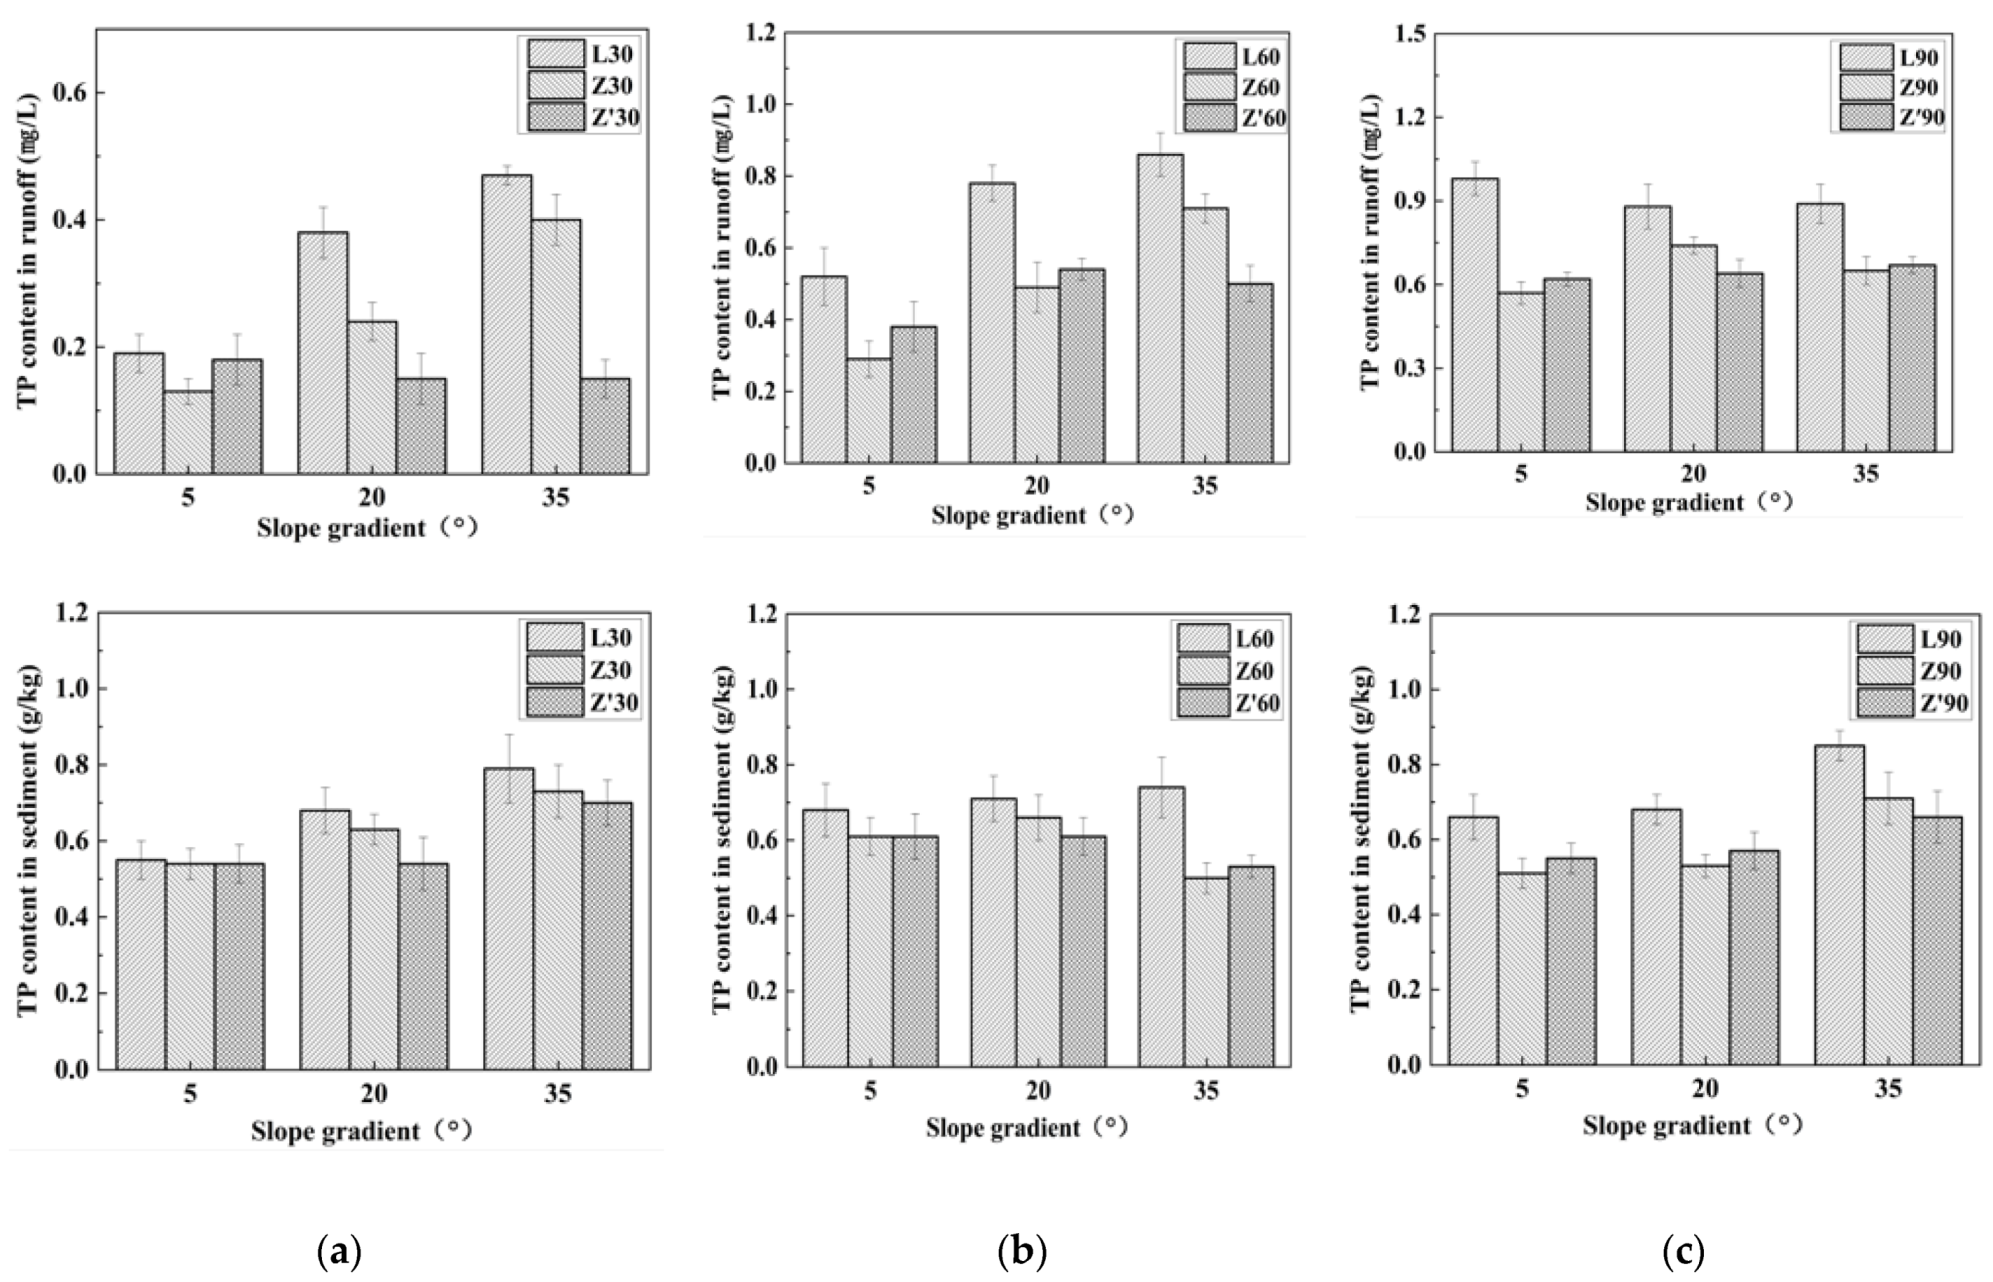
3.2.1. The Effects of the VFS on TP Loss

According to the content of TP in runoff and sediment, the main way of TP loss on slope was sediment carried. When the slope was 5°, 20°, and 35°, the reduction effects of VFS1 and VFS2 on TP in runoff were 39%, 30%, 20% and 23%, 40%, 45%, respectively. As the slope increased, the effects of the two vegetation filter strips showed opposite trends. With the increase of slope, the effect of the two VFS show an opposite trend, which was not completely consistent with the research conclusion that the slower the slope, the better the removal effect of pollutants in the vegetation filter strips [42]. When the rainfall intensity was 30 mm/h, 60 mm/h, and 90 mm/h, the reduction effects of VFS1 and VFS2 on runoff TP were 28%, 33%, 28% and 45%, 33%, and 30%, respectively. It can be seen that the influence of rainfall intensity on the two vegetation filter strips was not synchronous.
As shown in Figure 6, on a 5° slope with a rainfall intensity of 30 mm/h, the TP content of runoff produced by the bare land control group was 0.19 mg/L, while the two VFSs were 0.13 and 0.18 mg/L, respectively. It can be clearly seen that the effect of VFS1 on reducing the TP loss in runoff was more significant. When the slope increased to 20° and 35°, the effect of the VFS1 was 37% and 15%, respectively, while that of VFS2 was 61% and 68%, respectively. Similarly, on a slope of 5°, when the rainfall intensity was 60 and 90 mm/h, it was better to set VFS1 to reduce TP loss in slope runoff. However, the situation was different for slope gradient of 20°: when the rainfall intensity was 60 mm/h, VFS1 reduced the TP loss in runoff by 6% more than VFS2; but VFS2 can help to reduce the loss of TP more with rainfall intensity of 90 mm/h. When the slope continued to increase to 35°, it was more significant to set VFS2 on the slope to reduce TP loss with rainfall intensity of 60 mm/h; while VFS1 can be more effective with rainfall intensity of 90 mm/h.
Less phosphorus than nitrogen loss in the soil due to low content in coarse soil particles. The loss of phosphorus is mainly dominated by particulate phosphorus. However, inorganic phosphorus, which accounts for a high proportion of total soil phosphorus, is mainly present in the mineral state, which combines with cations to form insoluble salts (Table 2). The effect of VFS on reducing the TP in sediment was different from that in runoff. Vegetation stems can intercept granular nitrogen and phosphorus during sediment production, and plants can absorb and utilize available phosphorus to reduce total phosphorus loss. When slope was 5°, 20°, 35°, VFS1 and VFS2 reduced TP in sediment by 12%, 12%, 19% and 10%, 17%, 20%, respectively. When rainfall intensity was 30 mm/h, 60 mm/h, 90 mm/h, VFS1 and VFS2 reduced TP in sediment by 6%, 16%, 20% and 11%, 17%, 18%, respectively. It can be seen that with the increase of slope and rainfall intensity, VFS1 and VFS2 had a more significant effect on reducing TP loss in sediment, which was contrary to the experimental conclusion of [9]. This may be due to the fact that with the increase of slope and rainfall intensity, surface runoff flows through the VFS at a faster speed, and the TP in the soil are not easily released into the VFS. Moreover, the TP content can be reduced through the adsorption of the surface soil, so that the reduction rate increases slightly. According to the Figure 6, when the rainfall intensity was 30 or 60 mm/h, the two types of VFSs set in 5° slope had the same effect. The difference was that the effect of VFS at 60 mm/h was better than that at 30 mm/h, the former reduced by 10%, while the latter only reduced by 2%. As the rainfall intensity added to 90 mm/h, the content of TP in sediment could be more effectively reduced by VFS1 on a 5° slope. On a slope of 20° and rainfall intensity of 30 mm/h, in terms of reducing the loss of TP in the sediment, VFS2 was better than VFS1 because of an additional 13% reduction, and an additional 7% reduction in TP loss under the condition of rainfall intensity of 60 mm/h. However, when the rainfall increased to 90 mm/h, it was more appropriate to set VFS1 on the slope of 20, which can reduce TP loss by 22%, while VFS2 can only reduce TP loss by 16. When the slope was 35 and the rain intensity was 30 or 90 mm/h, VFS2 plays a more significant role in reducing total phosphorus loss in sediment. However, for the 35° slope with rainfall intensity of 60 mm/h, setting VFS1 could reduce the TP loss more.

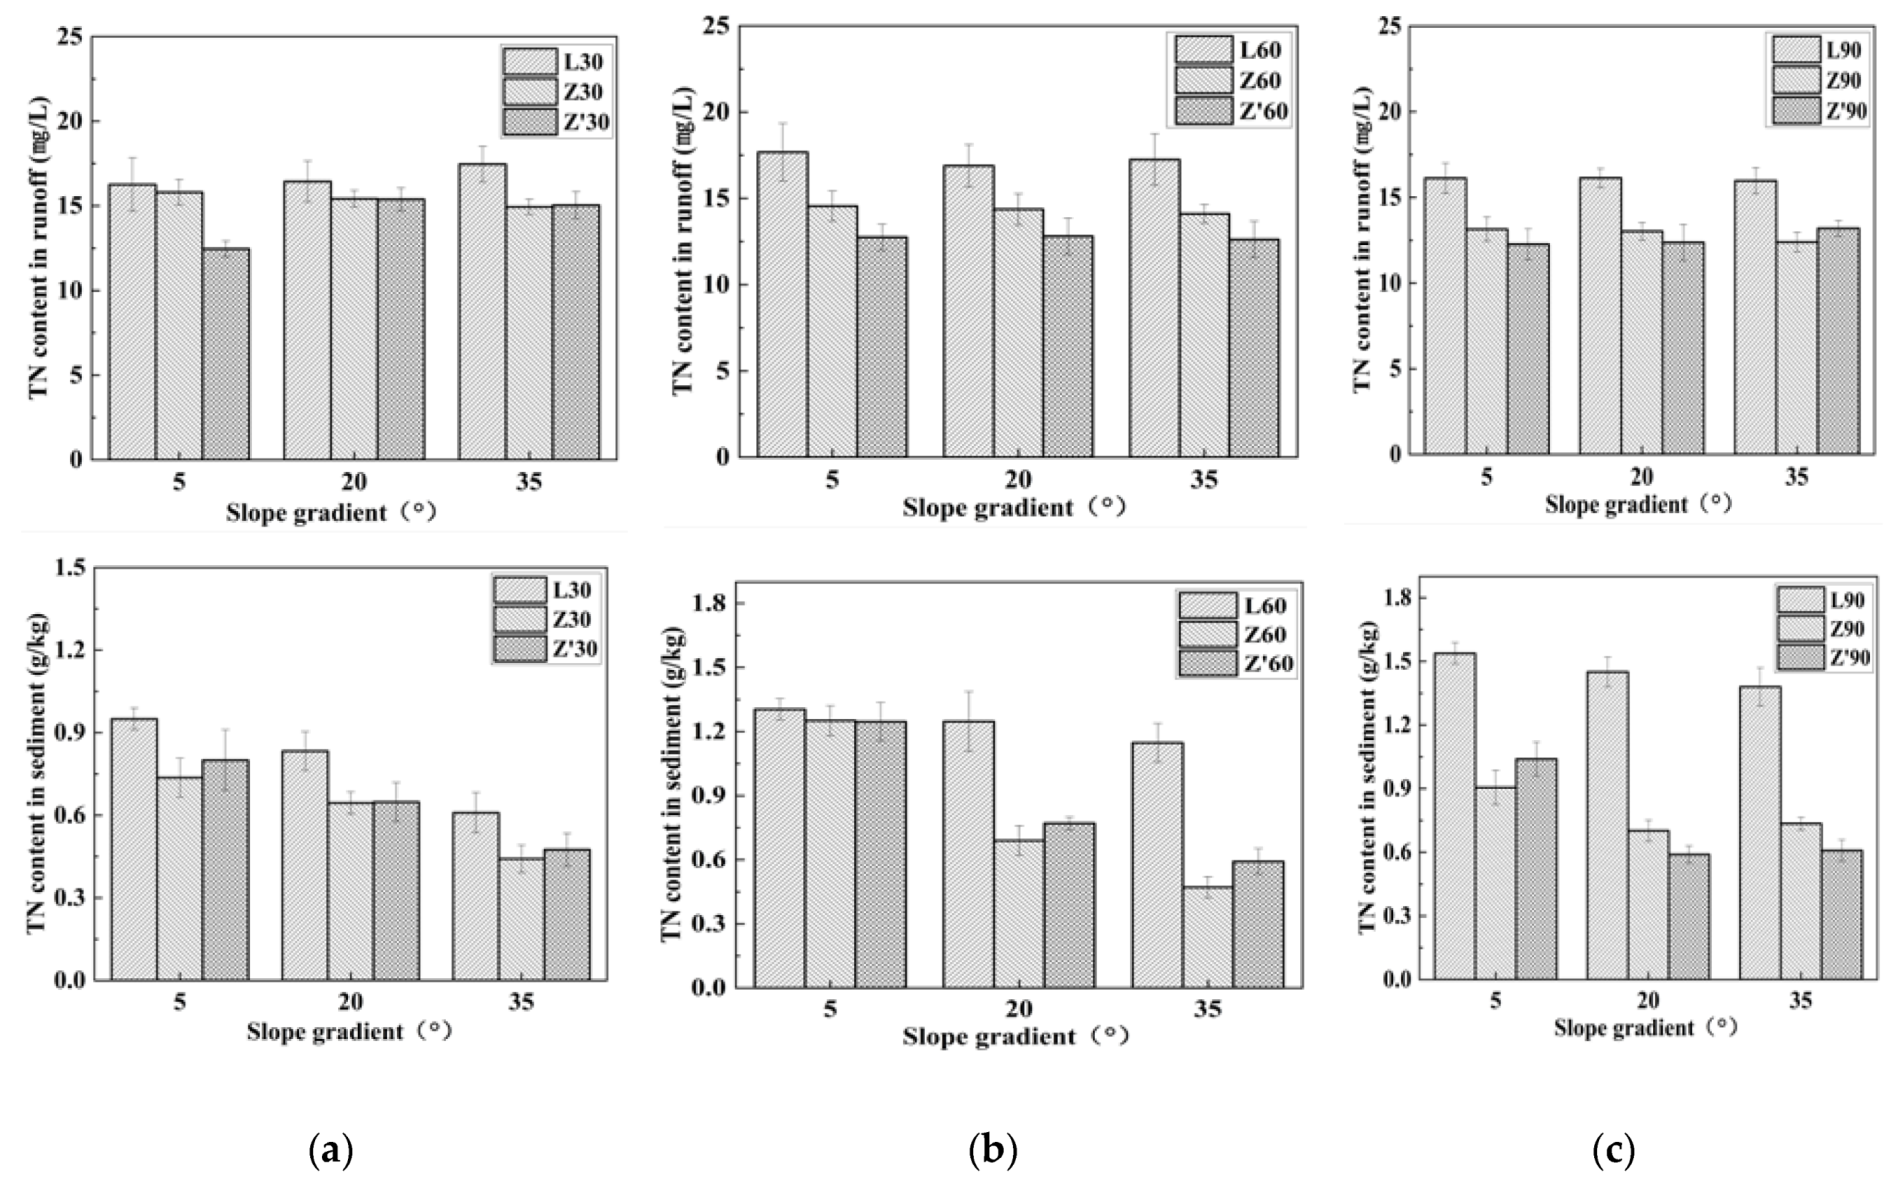
3.2.2. The Effects of the VFS on TN Loss

A previous study have shown that nitrogen loss in runoff is positively related to slope and rainfall intensity [43]. However, in this study, the difference of TN content in runoff under different combinations was not obvious. When the slope was 5°, 20°, and 35°, the reduction effects of VFS1 and VFS2 on TN in runoff were 13%, 13%, 18% and 24%, 18%, 19%, respectively; When the rainfall intensity was 30 mm/h, 60 and 90 mm/h, VFS No. 1 and VFS No. 2 can reduce TN in runoff by 8%, 17%, 20% and 14%, 26% and 21%, respectively. It can be seen that the effect of VFS in reducing runoff TN loss had no clear relationship with slope gradient and rainfall intensity. Furthermore, it can be seen from the Figure 7 that the TN loss of slope was mainly carried by runoff, which was consistent with the conclusions of Qian Jing et al. [44].
Compared with the bare land control group, VFS2 was better than VFS1 in reducing the total nitrogen loss in runoff obviously. When the slope increased to 20° and 35°, there was almost no difference in the effect of the two types of VFS in reducing TN loss. When the rainfall intensity was 60 mm/h, VFS2 was more helpful to reduce the TN loss in the runoff. With rainfall intensity of 90 mm/h and slopes of 5° and 20°, it was also more suitable for laying VFS2. Since in terms of reducing the TN content in runoff, VFS2 was 5% and 4% more than VFS1. However, when the rainfall intensity did not change, the conclusion obtained when the slope gradient was 35° was contrary. The TN content in runoff (12.40 mg/L) of VFS1 was less than that of VFS2 (13.20 mg/L). In general, VFS2 can more effectively reduce TN loss in slope runoff under various combinations of rainfall intensity and slope gradient set in the experiment. It was predicted that the VFS2 was far away from the source area at the bottom, and the path of runoff was long. Nitrogen could be retained or absorbed by plants on the surface of vegetation and soil, leading to less TN content in runoff.
Nitrogen loss from soil is mainly in dissolved form. Dissolved organic nitrogen concentrated in the topsoil accounted for the highest total nitrogen content. Although the content of inorganic nitrogen in total nitrogen is relatively low, unstable nature makes it prone to denitrification and lead to total nitrogen loss. As for VFS to reduce the TN content in the sediment carried by runoff, the conclusions obtained under various conditions were different. When the slope gradient was 5°, 20° and 35°, the reduction effects of VFS1 and VFS2 on TN in sediment were 22%, 40%, 44% and 17%, 40%, 44%, respectively; the rainfall intensity was 30 mm/h, 60 mm/h, 90 mm/h, the reduction effects of VFS1 and VFS2 on TN in sediment were 24%, 30%, 46% and 21%, 30%, 49%, respectively. It can be seen that with the increase of slope and rainfall intensity, the effect of VFS on reducing nutrient (TN and TP) loss in sediment was gradually significant. When the rainfall intensity was 30 mm/h, VFS1 with a slope gradient of 5°or 35° was more effective in reducing the loss of TN in sediment. Furthermore, the two setting modes of VFS were suitable on a slope of 20° similarly. As the rainfall intensity was 60 mm/h, for a slope of 5°, the two types of VFSs had similar effects on reducing the TN content in sediment. Plant can absorb and utilize mainly inorganic nitrogen, and the trunk and root system after vegetation wither is one of the main sources of organic nitrogen. However, when the slope gradient increased to 20° or 35°, the TN loss of VFS1 was reduced by 6% and 10% more than that of VFS2. For a 5° slope with rainfall intensity of 90 mm/h, we can also reach a consistent conclusion: VFS1 was more effective. However, when the rainfall intensity remained unchanged at 90 mm/h and the slope increased to 20° and 35°, under the condition that the width was fixed, the way of laying VFS2 was more conducive to reducing TN loss in sediment. In most cases, setting VFS1 can effectively reduce TN loss in sediment.

4. Discussion

4.1. Relationships between Erosion Indexes and Infuencing Factors

Multivariate regressions were performed to determine the relationship between erosion indexes (sediment and runoff yield, TN and TP loss) and the influencing factors of rainfall intensity, slope gradient and vegetation (Table 3). Except for TP loss in sediment, the coefficient of determination R2 was generally relatively high, which can explain more than 60% of the variability, demonstrating that multiple regression analysis can explain and predict the variation of each erosion index to a large extent. The results of regression coefficient and multivariate analysis of variance showed that rainfall intensity, slope and vegetation had significant effects on sediment yield, runoff yield, TP loss in runoff and TN loss in sediment (p < 0.05), which has been confirmed in previous studies [45]. Cerdan [46] believed that rainfall intensity and slope were positively correlated with erosion. However, in terms of TN loss in runoff and sediment, erosion was negatively correlated with rainfall intensity and slope in this study, respectively. Since vegetation, which is antagonistic to rainfall intensity and slope, was dominant in affecting TN loss.
The modes of soil nutrient loss include runoff and eroded sediment. The former is mainly soluble nutrients, while the latter is mostly mineralizable nutrients [47]. The regression results showed that the slope gradient had no significant effect on TN loss in runoff, which indirectly indicated that TN loss was mainly carried by sediments. The coefficients of dummy variable V0 in the regression equation were all positive, which had a negative impact on erosion, indicating that the erosion of the bare surface increased compared with the vegetation coverage. In addition, the regression coefficient of dummy variable V1 in the linear equation between TN loss in runoff and influencing factors was relatively large, indicating that vegetation setting modes had a certain degree of influence on it. Therefore, it is necessary to continue to analyze the relationship between erosion and rainfall intensity and slope under different vegetation cover types.
Binary regressions of erosion indexes and influencing factors including rainfall intensity and slope were performed in different vegetation coverage type (Table 4). The coefficients of determination R2 of linear equations were generally quite high, indicating a better regression effect. The study found that there were significant differences in the runoff and sediment yield, TN and TP loss in runoff and sediment between vegetation-covered slopes and bare land slopes (p < 0.05). Vegetation canopy and litter form a continuous cover to reduce soil erosion [48]. In addition, the effect of different vegetation settings on erosion was also inconsistent. There was no significant difference in the runoff and sediment yield of two vegetation-covered slopes (p > 0.05).
Previous studies have shown that more than 70% of soil loss variability is attributable to rainfall intensity and slope [49]. Rainfall intensity and slope jointly affected the effect of vegetation to prevent runoff and sediment production, and they played different roles in terms of nutrient loss. According to regression equation coefficients, VFS2 was hardly affected by the slope factor in reducing the runoff TP loss. When the slope was covered by vegetation, rainfall intensity and slope had no obvious effect on the TP content of sediments. The study indicated that root system may be the reason for high content of soil organic carbon and TN in the grassland. The presence of vegetation prolongs the initial runoff time, thereby increasing the soil infiltration rate, and the TN and TP in runoff and sediment will infiltrate. Moreover, it is strongly affected by slope factor when vegetation reduced sediment TN loss, and there was a negative correlation between slope and sediment TN loss. As the slope gradient becomes steeper, higher velocity and volumes of runoff takes away more soil particles [50]. Zhang [51] found that the loss of TN and TP was closely related to soil loss. 57% of TN and 75% of TP were lost with sediment, reflecting that sediment was the main carrier of slope nutrients. Consequently in this research, the reduction of nutrient loss by vegetation on slopes was mainly limited by the slope.

4.2. The Offset Effect of Influencing Factors on Erosion Control

Multiple regression analysis illustrated the correlation between influencing factors and erosion indexes. However, the effects of influencing factors on soil erosion are complex, as they appear to be synergistic and antagonistic. In order to explore the mutual influence or offset effect among the different influencing factors, cluster analysis was further performed to study the dissimilarity of various influencing factors combinations on soil erosion.
A total of 27 combinations which composed of different rainfall intensities (30 mm/h, 60 mm/h and 90 mm/h), slope gradients (5°, 20° and 35°) and vegetation coverage type (bare slope, VFS1 and VFS2) were sorted (Table 5), and the runoff yield, sediment yield, TN and TP content in runoff and sediment under each combination were used as 6 evaluation indicators. By calculating the degree of dissimilarity and analyzing each index one by one, the treatment methods with relatively similar effects in preventing and controlling soil erosion in different combinations can be used to obtain the difference in the comprehensive effects of the three factors. According to the calculation results of the phase dissimilarity matrix, d(I, j) < 0.05 was selected as the standard for the classification of the corresponding soil erosion control measures. The classification results under each index are shown in Figure 8.
From the dissimilarity of runoff yield (Figure 8a), under the combined conditions of different rainfall intensity, slope gradient and vegetation setting mode, the VFS may have the same effect in reducing the runoff yield on the slope. VFS can decrease flow volumes and velocity by increasing surface roughness and augmenting infiltration. This reduces the transport capacity of flow and the yield of runoff on the slope [11,52]. For example, the fact that No. 13 (60 mm/h, 5°, VFS1) and No. 25 (90 mm/h, 5°, VFS2) are in the same group indicates that VFS can effectively reduce the slope runoff during heavy rainfall, and it has been proved by previous studies [53,54]. Moreover, No. 2, 3 (30 mm/h, 20° and 35°, bare slope) and No. 22 (60 mm/h, 5°, VFS2) were also in the same group, indicating that the influence of rainfall intensity on runoff may be equal to the joint influence of VFS and slope gradient. In addition, the dissimilarity of No. 7 (90 mm/h, 5°, and bare slope) was similar to that of No. 26 (90 mm/h, 20°, VFS2). As well as the difference in runoff yield between the 20° exposed slope and the 35° slope with VFS with rainfall intensity of 90 mm/h, it can be proved that under the condition of constant rainfall intensity, the effect of VFS can be equal to the influence of slope increase on runoff. All of these conclusions can be based on the research which proved that the contributions of the independent variables on runoff were in the following order: rainfall intensity > soil protective practice > slope gradient > coverage of alfalfa [55].
From the perspective of sediment yield dissimilarity group (Figure 8a), the effects of rainfall intensity, slope gradient and vegetation setting mode will cancel each other out or have the same effect. According to the dissimilarity group, the sediment yield of No. 3 (30 mm/h, 35°, bare land) was similar to that of No. 15 and 24 (60 mm/h, 35°, VFS1 and VFS2), which indicating that under the condition of a certain slope gradient, the sediment yield on the slope with increased rainfall intensity can be reduced by setting VFSs. The vegetation filter strip can effectively reduce the soil loss on the slope [56,57,58]. The combination represented by No. 3 was similar to No. 14 (60 mm/h, 20°, VFS1) and No. 25 (90 mm/h, 5°, VFS2). According to the research conclusion of Bo Xiao et al. [55], the contribution to soil loss is ranked as runoff > rainfall intensity > slope > alfalfa coverage > soil protection measures in the following order. It can be speculated that the combined effect of VFS and slope gradient can be equivalent to the effect of rainfall intensity on sediment yield. Many studies have confirmed that the presence of plant roots increases soil porosity (through the formation of seepage channels) and retains surface soil particles, thereby reducing runoff and soil erosion. The rainfall intensity, slope gradient and vegetation combinations represented by No. 2, 22 and 23 also supported this view. However, according to the grouping of No. 17, 26 and 27, it was indicated that under the condition of rainfall intensity of 90 mm/h, no matter how the VFS was set, the results of sediment yield at 20° and 35° slope were similar. Therefore, using VFS does not prevent all runoff or soil loss in extreme conditions (such as steep sloping croplands and regions with frequent heavy rain) [55]. The influence of excessive rainfall intensity on slope sediment yield may be greater than that of slope gradient and VFS. However, the effect of No. 6 (60 mm/h, 35°, bare slope) was close to that of No. 7 (90 mm/h, 5°, bare slope), indicating that sediment yield had little change when rainfall intensity increased but slope had a corresponding amplitude of reduction simultaneously. In addition, according to the other three dissimilarity groups, it can be seen that when rainfall intensity was low at 30 mm/h, there was little difference in setting VFS1 or VFS2 on the same slope. It may be due to the small amount of sediment yield on the slope under light rain intensity, and further research is needed to obtain the interaction effect of the three factors.
According to the dissimilarity group of runoff nutrient content, TN and TP content were different in different combinations of rainfall intensity, slope gradient and vegetation setting mode. For TN in runoff (Figure 8c), under the same rain intensity and vegetation coverage, the contents of TN in three slopes were similar. It can be concluded that the influence of slope on TN was not obvious from the group of No. 1, 2, 3; the group of No. 16, 17, 18; the groups of No. 22, 23, 24 and 25, 26, 27. On slope with the same VFS, the contents of runoff TN with 30 mm/h, 60 mm/h and 90 mm/h were in the same group, indicating that rainfall intensity has little influence on TN content in runoff, and its effect can be offset by slope gradient and VFS. For TP content in runoff (Figure 8d), when the rainfall intensity was 30 mm/h, TP contents in runoff of the same slope with and without vegetation (No. 1 and 19) were similar, and TP contents on different slopes with VFS2 (No. 20 and 21) were also similar. It is speculated that the runoff nutrient changes were not obvious due to the small rainfall intensity and little runoff. However, the TP content of No. 2 (30 mm/h, 20°, bare slope) was similar to that of No. 7 (90 mm/h, 5°, bare slope), indicating that the effect of rainfall intensity and slope gradient can be equivalent under certain conditions. These two were in the same group with No. 17, 26 (90 mm/h, 20°, VFS) and No. 27 (90 mm/h, 35°, VFS2), which indirectly indicates that VFS can effectively reduce runoff TP loss [59]. Since the concentration of runoff nutrients increased with the increase of raindrop kinetic energy and decreased with the increase of infiltration rate [60], when the rainfall intensity and slope increased, raindrop kinetic energy increased, and the rapid infiltration of surface runoff decreased, resulting in the increase of TP content in runoff. In terms of runoff nutrient loss, VFS can offset the influence of rainfall intensity and slope on nutrient loss.
From the distribution of TN and TP contents in sediment, the loss of different nutrients in soil was also not completely synchronous. Firstly, from the analysis of TN content (Figure 8e), as far as the group of No. 1 was concerned, when rainfall intensity was 30 mm/h, there was no significant difference on bare slope of any gradient, indicating that the change of slope gradient was not significant for soil TN loss under the condition of light rain intensity. However, the 5° slope with VFS was also distributed in the same group under the same rain intensity. We speculated that VFS had little effect on reducing soil TN loss with the same light rain intensity. The groups including No. 7 (60 mm/h, 5°, VFS1), 13 (60 mm/h, 5°, VFS2) and 22 (90 mm/h, 5°, bare slope) validated a previous study by Wei et al. [61], showing that soil nutrient loss increases with the increase of rainfall intensity. It can be speculated that the installation of VFS can offset the impact of rainfall intensity and significantly reduce sediment loss in surface runoff, thus effectively reducing the loss of soil TN. By analyzing the group of No. 8, 20 and 25, we knew that when rainfall intensity was fixed, slope gradient and VFS had opposite effects on TN loss on slope surface. In addition, when VFS was set in the same way, rainfall intensity and slope gradient also had opposite effects on TN loss. The analysis and summary of other groups can be concluded as follows: when slope gradient was greater than 20°, the effect of setting VFS was not obvious, and the effect of rainfall intensity on TN loss was not significant. For gentle slopes with heavy rainfall, VFS can effectively reduce TN loss, improve runoff water quality, and thus reduce pollution to the downstream areas of the slope [62]. Then, the groups of TP content (Figure 8f) in sediment were analyzed. No. 15 (60 mm/h, 35°, VFS1) and No. 16 (90 mm/h, 5°, VFS1) were in the same group, indicating that the effects of rainfall intensity and slope gradient on soil TP loss were opposite. When the rainfall intensity was and there were two vegetation filter strips on the slope, the TP content of No. 25 (90 mm/h, 5°, VFS2) was similar to that of No. 27 (90 mm/h, 35°, VFS2), which can prove that slope nutrient losses exist critical slope gradient [63], the range of 15~25°, the local surface slope is less than the critical value, the nutrient content in the sediment increased with the increase of slope and when the slope is larger than the critical value, the nutrient content in sediment decreases with the increase of slope. According to the group of No. 1, when rainfall intensity was no more than 60 mm/h and slope was no more than 20°, it can be considered that setting VFS1 had no obvious effect on reducing TP loss on slope surface, and other soil and water conservation measures can be sought to reduce TP loss. By analyzing the group of No. 3, we knew that the effect of rainfall intensity was not prominent when the slope was steep (35°), and it was not suitable to set VFS2 on the slope under the condition of light rainfall intensity. To analysis the group including No. 7, we can also know that under the condition of strong rainfall and relatively steep slope, the difference of setting VFS1 or VFS2 was not big. However, setting VFS can eliminate the influences of increasing rainfall intensity and slope gradient on TP loss in sediment, can effectively reduce the loss of the slope of nutrients, which is beneficial to protect the ecological environment [64,65].

5. Conclusions

The soil and water conservation effects of the two different vegetation setting modes (one block setting and two blocks setting) under the same width were studied by using simulated rainfall with different slope gradients, rainfall intensities in typical eroded gully area of Xuanhua district, Zhangjiakou City, Hebei Province, North China. The following conclusions were drawn:
(1)
For the slope area of eroded gully with severe soil erosion and loss, under the condition of certain width of vegetation filter strip, setting vegetation filter strip can effectively reduce soil erosion and nutrient loss on slope surface. However, the effect of the two setting modes of VFS was affected by rainfall intensity and slope gradient, and the best choice can be made under known meteorological and topographic conditions.
(2)
During the whole rainfall process, within the same time interval after the stable runoff yield, there were also great differences in runoff yield, sediment quantity and nutrient content, and the change of each index over time was not completely stable. This may be related to the change of slope topography during rainfall. However, it was possible to find the same variation trend of the same index in different combinations of rainfall intensity, slope gradient and vegetation coverage.
(3)
Multiple regression analysis was used to describe the correlation between vegetation, rainfall intensity and slope and erosion indexes. The three factors had significant effects on runoff sediment yield, TP loss in runoff and TN loss in sediment. There was no significant difference in the amount of runoff and sediment yield between the two vegetation setting modes. The TN loss in sediment on the bare land was mainly affected by the rainfall intensity, while the vegetation covered slope was affected by the slope gradient obviously. When the slope was covered with vegetation, rainfall intensity and slope had no significant effect on the content of TP loss in sediment.
(4)
Based on the heterogeneity analysis of data mining method, this study believed that the effects of rainfall intensity, slope gradient and vegetation setting mode on soil and water loss on slope can be equal or offset. In general, setting vegetation can offset the effect of rainfall intensity and slope gradient, but the effect of vegetation was not obvious under extreme conditions (heavy rainfall and steep slope), and it was also not obvious under light rainfall intensity, which may be due to the small amount of sediment yield, leading to little difference in various indicators. In some cases, the combined action of VFS and slope can offset the influence of rainfall intensity on soil erosion. In general, the influence of rainfall intensity was dominant in most cases.
(5)
This research mainly analyzed the correlation between rainfall intensity, slope and vegetation and erosion through multiple regression, and used cluster analysis to study the offsetting effect among the factors affecting erosion. However, the analysis in this research was limited by the experiment performed under restricted conditions. Future experiments may be carried out using other dominant plant species such as Salsola found in the study area, and investigation can be made to further explore the mutual influence or offset effect among the different factors on erosion control in subsequent studies.
It is concluded that installing vegetative filter strips on the slope surface can effectively control the soil and water loss in eroded gully, and the effects of various factors on erosion can be equal or offset. The results may provide interesting reference for the practical application of vegetation filter strips, which is beneficial to the implementation of ecological engineering measures.

Author Contributions

Conceptualization, H.Z. and T.H.; methodology, H.Z. and T.H.; software, Q.M. and Q.Y.; writing—original draft preparation, Q.M. and Q.Y.; writing—review and editing, X.Z.; supervision, H.Z. and T.H.; funding acquisition, H.Z. All authors have read and agreed to the published version of the manuscript.

Funding

This research was supported by the National Science and Technology Major Project for Water Pollution Control and Treatment (2017ZX07101003).

Institutional Review Board Statement

Not applicable.

Informed Consent Statement

Not applicable.

Data Availability Statement

Sources of the runoff and sediment yield data and total nitrogen and total phosphorus losses used in this study have been describe in Section 2.2. The data are shown in the figures of the paper and are available through contacting the authors.

Conflicts of Interest

The authors declare no conflict of interest.

References

  1. Doulabian, S.; Toosi, A.S.; Calbimonte, G.H.; Tousi, E.G.; Alaghmand, S. Projected climate change impacts on soil erosion over Iran. J. Hydrol. 2021, 598, 126432. [Google Scholar] [CrossRef]
  2. Kervroëdan, L.; Armand, R.; Rey, F.; Faucon, M. Trait-based sediment retention and runoff control by herbaceous vegetation in agricultural catchments: A review. Land Degrad. Dev. 2021, 32, 1077–1089. [Google Scholar] [CrossRef]
  3. Safwan, M.; Alaa, K.; Omran, A.; Quoc, B.P.; Nguyen, T.T.L.; Van, N.T.; Duong, T.A.; Endre, H. Predicting soil erosion hazard in Lattakia Governorate (W Syria). Int. J. Sediment Res. 2021, 36, 207–220. [Google Scholar] [CrossRef]
  4. Francipane, A.; Fatichi, S.; Ivanov, V.Y.; Noto, L.V. Stochastic assessment of climate impacts on hydrology and geomorphology of semiarid headwater basins using a physically based model: Climate impact on semiarid basins. J. Geophys. Res. Earth Surf. 2015, 120, 507–533. [Google Scholar] [CrossRef] [Green Version]
  5. Mekonnen, M.; Keesstra, S.; Stroosnijder, L.; Baartman, J.; Maroulis, J. Soil Conservation through Sediment Trapping: A Review: Individual, Combined and Integrated Sediment Trapping. Land Degrad. Dev. 2015, 26, 544–556. [Google Scholar] [CrossRef]
  6. Prosdocimi, M.; Cerdà, A.; Tarolli, P. Soil water erosion on Mediterranean vineyards: A review. CATENA 2016, 141, 1–21. [Google Scholar] [CrossRef]
  7. Muñoz-Carpena, R.; Fox, G.A.; Sabbagh, G.J. Parameter Importance and Uncertainty in Predicting Runoff Pesticide Reduction with Filter Strips. J. Environ. Qual. 2010, 39, 630–641. [Google Scholar] [CrossRef] [Green Version]
  8. Chen, H.; Grieneisen, M.L.; Zhang, M. Predicting pesticide removal efficacy of vegetated filter strips: A meta-regression analysis. Sci. Total Environ. 2016, 548–549, 122–130. [Google Scholar] [CrossRef] [PubMed]
  9. Pan, D.; Gao, X.; Wang, J.; Yang, M.; Wu, P.; Huang, J.; Dyck, M.; Zhao, X. Vegetative filter strips-Effect of vegetation type and shape of strip on run-off and sediment trapping. Land Degrad. Dev. 2018, 29, 3917–3927. [Google Scholar] [CrossRef]
  10. Zhang, F.; Yang, M.; Zhang, J. Beryllium-7 in vegetation, soil, sediment and runoff on the northern Loess Plateau. Sci. Total Environ. 2018, 626, 842–850. [Google Scholar] [CrossRef]
  11. Luo, M.; Pan, C.; Cui, Y.; Guo, Y.; Wu, Y. Effects of Different Aboveground Structural Parts of Grass Strips on the Sediment-Trapping Process. Sustainability 2021, 13, 7591. [Google Scholar] [CrossRef]
  12. Sheng, L.; Zhang, Z.; Xia, J.; Liang, Z.; Yang, J.; Chen, X.-A. Impact of grass traits on the transport path and retention efficiency of nitrate nitrogen in vegetation filter strips. Agric. Water Manag. 2021, 253, 106931. [Google Scholar] [CrossRef]
  13. Wang, T.; Fan, Y.; Xu, Z.; Kumar, S.; Kasu, B. Adopting cover crops and buffer strips to reduce nonpoint source pollution: Understanding farmers’ perspectives in the US Northern Great Plains. J. Soil Water Conserv. 2021, 76, 475–486. [Google Scholar] [CrossRef]
  14. Fox, G.; Muñoz-Carpena, R.; Purvis, R.A. Controlled laboratory experiments and modeling of vegetative filter strips with shallow water tables. J. Hydrol. 2018, 556, 1–9. [Google Scholar] [CrossRef]
  15. Flanagan, K.; Branchu, P.; Ramier, D.; Gromaire, M.-C. Evaluation of the relative roles of a vegetative filter strip and a biofiltration swale in a treatment train for road runoff. Water Sci. Technol. 2016, 75, 987–997. [Google Scholar] [CrossRef]
  16. Lambrechts, T.; François, S.; Lutts, S.; Muñoz-Carpena, R.; Bielders, C.L. Impact of plant growth and morphology and of sediment concentration on sediment retention efficiency of vegetative filter strips: Flume experiments and VFSMOD modeling. J. Hydrol. 2014, 511, 800–810. [Google Scholar] [CrossRef]
  17. Duan, J.; Liu, Y.-J.; Wang, L.-Y.; Yang, J.; Tang, C.-J.; Zheng, H.-J. Importance of grass stolons in mitigating runoff and sediment yield under simulated rainstorms. CATENA 2022, 213, 106132. [Google Scholar] [CrossRef]
  18. Wu, L.; Liu, X.; Ma, X. How biochar, horizontal ridge, and grass affect runoff phosphorus fractions and possible tradeoffs under consecutive rainstorms in loessial sloping land? Agric. Water Manag. 2021, 256, 107121. [Google Scholar] [CrossRef]
  19. Carluer, N.; Lauvernet, C.; Noll, D.; Muñoz-Carpena, R. Defining context-specific scenarios to design vegetated buffer zones that limit pesticide transfer via surface runoff. Sci. Total Environ. 2017, 575, 701–712. [Google Scholar] [CrossRef] [PubMed]
  20. García-Serrana, M.; Gulliver, J.; Nieber, J.L. Infiltration capacity of roadside filter strips with non-uniform overland flow. J. Hydrol. 2017, 545, 451–462. [Google Scholar] [CrossRef] [Green Version]
  21. Zhao, X.; Huang, J.; Wu, P.; Gao, X. The dynamic effects of pastures and crop on runoff and sediments reduction at loess slopes under simulated rainfall conditions. CATENA 2014, 119, 1–7. [Google Scholar] [CrossRef]
  22. Zhao, C.; Gao, J.; Huang, Y.; Wang, G.; Zhang, M. Effects of Vegetation Stems on Hydraulics of Overland Flow Under Varying Water Discharges. Land Degrad. Dev. 2016, 27, 748–757. [Google Scholar] [CrossRef]
  23. Pan, D.; Gao, X.; Dyck, M.; Song, Y.; Wu, P.; Zhao, X. Dynamics of runoff and sediment trapping performance of vegetative filter strips: Run-on experiments and modeling. Sci. Total Environ. 2017, 593–594, 54–64. [Google Scholar] [CrossRef] [PubMed]
  24. Gilley, J.E.; Eghball, B.; Kramer, L.A.; Moorman, T.B. Narrow Grass Hedge Effects on Runoff and Soil Loss. J. Soil Water Conserv. 2000, 55, 190–196. [Google Scholar] [CrossRef]
  25. Wu, J.Y.; Huang, D.; Teng, W.J.; Sardo, V.I. Grass hedges to reduce overland flow and soil erosion. Agron. Sustain. Dev. 2010, 30, 481–485. [Google Scholar] [CrossRef]
  26. Durán-Zuazo, V.H.; Pleguezuelo, C.R.; Panadero, L.A.; Raya, A.M.; Martínez, J.F.; Rodríguez, B.C. Soil Conservation Measures in Rainfed Olive Orchards in South-Eastern Spain: Impacts of Plant Strips on Soil Water Dynamics. Pedosphere 2009, 19, 453–464. [Google Scholar] [CrossRef]
  27. Lambrechts, T.; De Braekeleer, C.; Fautsch, V.; Iserentant, A.; Rentmeesters, G.; Lutts, S.; Bielders, C.L. Can vegetative filter strips efficiently trap trace elements during water erosion events? A flume experiment with contaminated sediments. Ecol. Eng. 2014, 68, 60–64. [Google Scholar] [CrossRef]
  28. Jianqiang, W.; Shenfa, H.; Yuchi, H.; Hongyang, W. Effects of pollutant loads and vegetation biomass of buffer strips on runoff purification. Chin. J. Environ. Eng. 2008, 2, 1425–1429. [Google Scholar]
  29. Blanco-Canqui, H.; Gantzer, C.J.; Anderson, S.H.; Alberts, E.E.; Thompson, A.L. Grass Barrier and Vegetative Filter Strip Effectiveness in Reducing Runoff, Sediment, Nitrogen, and Phosphorus Loss. Soil Sci. Soc. Am. J. 2004, 68, 1670–1678. [Google Scholar] [CrossRef]
  30. Dillaha, T.A.; Reneau, R.; Mostaghimi, S.; Lee, D. Vegetative Filter Strips for Agricultural Nonpoint Source Pollution Control. Trans. Am. Soc. Agric. Eng. 1989, 32, 0513–0519. [Google Scholar] [CrossRef]
  31. Li, H.; Deng, N.; Yang, Y.; Shi, D. Clarification Efficiency of Vegetative Filter Strips to Several Pollutants in Surface Runoff. Trans. Chin. Soc. Agric. Eng. 2010, 26, 81–86. [Google Scholar]
  32. She, D.L.; A., L.B.; Chen, Q.; Han, X. Effects of vegetative filter strip on overland flow nitrogen and phosphorus intercepting under different inflow conditions. J. Appl. Ecol. 2018, 29, 3425–3432. [Google Scholar]
  33. Klatt, S.; Kraus, D.; Kraft, P.; Breuer, L.; Wlotzka, M.; Heuveline, V.; Haas, E.; Kiese, R.; Butterbach-Bahl, K. Exploring impacts of vegetated buffer strips on nitrogen cycling using a spatially explicit hydro-biogeochemical modeling approach. Environ. Model. Softw. 2017, 90, 55–67. [Google Scholar] [CrossRef]
  34. Dosskey, M.; Helmers, M.; Eisenhauer, D. A design aid for determining width of filter strips. J. Soil Water Conserv. 2008, 63, 232–241. [Google Scholar] [CrossRef]
  35. Srivastava, A.N.; Kantardzie, M. Data Mining: Concepts, Models, Methods, and Algorithms. J. Comput. Inf. Sci. Eng. 2005, 5, 394–395. [Google Scholar] [CrossRef]
  36. Duchemin, M.; Hogue, R. Reduction in agricultural non-point source pollution in the first year following establishment of an integrated grass/tree filter strip system in southern Quebec (Canada). Agric. Ecosyst. Environ. 2009, 131, 85–97. [Google Scholar] [CrossRef]
  37. McDowell, R.; Sharpley, A.N. Soil phosphorus fractions in solution: Influence of fertiliser and manure, filtration and method of determination. Chemosphere 2001, 45, 737–748. [Google Scholar] [CrossRef]
  38. Wen, Y.F.; Gao, P.; Mu, X.M.; Zhao, G.J.; Sun, W.Y. Experimental Study on Runoff and Sediment Yield in Runoff Plot Under Field Simulated Rainfall Condition. Res. Soil Water Conserv. 2018, 25, 23–29. [Google Scholar] [CrossRef]
  39. Pan, C.; Ma, L.; Wainwright, J.; Shangguan, Z. Overland flow resistances on varying slope gradients and partitioning on grassed slopes under simulated rainfall. Water Resour. Res. 2016, 52, 2490–2512. [Google Scholar] [CrossRef] [Green Version]
  40. Otto, S.; Vianello, M.; Infantino, A.; Zanin, G.; Di Guardo, A. Effect of a full-grown vegetative filter strip on herbicide runoff: Maintaining of filter capacity over time. Chemosphere 2008, 71, 74–82. [Google Scholar] [CrossRef]
  41. Yang, F.S.; Cao, M.M.; Li, H.E.; Yang, X.D.; Sun, S.Z.; Zhang, H.M. Modeling the Sediment Retention Effect of the Vegetative Filter Strip Composed of Seabuckthorn-Shrub and Herbaceous Vegetation. J. Arid. Land Resour. Environ. 2017, 31, 71–75. [Google Scholar] [CrossRef]
  42. Schmitt, T.J.; Dosskey, M.G.; Hoagland, K.D. Filter Strip Performance and Processes for Different Vegetation, Widths, and Contaminants. Pap. Nat. Resour. 1999, 28, 1479–1489. [Google Scholar] [CrossRef] [Green Version]
  43. Shen, H.; Zheng, F.; Wen, L.; Han, Y.; Hu, W. Impacts of rainfall intensity and slope gradient on rill erosion processes at loessial hillslope. Soil Tillage Res. 2016, 155, 429–436. [Google Scholar] [CrossRef]
  44. Qian, J.; Zhang, L.; Wang, W.; Liu, Q. Simulated Rainfall Experiment on the Nitrogen Loss in Sloping Vegetable Fields Under Different Conditions of Fertilization. J. Soil Water Conserv. 2015, 29, 248–253. [Google Scholar] [CrossRef]
  45. Han, D.; Deng, J.; Gu, C.; Mu, X.; Gao, P.; Gao, J. Effect of shrub-grass vegetation coverage and slope gradient on runoff and sediment yield under simulated rainfall. Int. J. Sediment Res. 2021, 36, 34–42. [Google Scholar] [CrossRef]
  46. Cerdan, O.; Govers, G.; Le Bissonnais, Y.; Van Oost, K.; Poesen, J.; Saby, N.; Gobin, A.; Vacca, A.; Quinton, J.; Auerswald, K.; et al. Rates and spatial variations of soil erosion in Europe: A study based on erosion plot data. Geomorphology 2010, 122, 167–177. [Google Scholar] [CrossRef]
  47. Hayat, W.; Khan, S.; Hayat, M.T.; Pervez, R.; Ahmad, S.; Iqbal, A. The effect of deforestation on soil quality in Lesser-Himalayan community forests of Abbottabad, Pakistan. Arab. J. Geosci. 2021, 14, 1919–1933. [Google Scholar] [CrossRef]
  48. Niu, X.-Y.; Wang, Y.-H.; Yang, H.; Zheng, J.-W.; Zou, J.; Xu, M.-N.; Wu, S.-S.; Xie, B. Effect of Land Use on Soil Erosion and Nutrients in Dianchi Lake Watershed, China. Pedosphere 2015, 25, 103–111. [Google Scholar] [CrossRef]
  49. Watson, D.A.; Laflen, J.M. Soil Strength, Slope, and Rainfall Intensity Effects on Interrill Erosion. Trans. ASAE 1986, 29, 0098–0102. [Google Scholar] [CrossRef]
  50. Akbarimehr, M.; Jalilvand, H. Considering the Relationship of Slope and Soil Loss on Skid Trails in the North of Iran (A Case Study). J. For. Sci. 2013, 78, 339–344. [Google Scholar] [CrossRef] [Green Version]
  51. Zhang, G.; Zhang, X.; Hu, X. Runoff and soil erosion as affected by plastic mulch patterns in vegetable field at Dianchi lake’s catchment, China. Agric. Water Manag. 2013, 122, 20–27. [Google Scholar] [CrossRef]
  52. Rose, C.W.; Hogarth, W.L.; Ghadiri, H.; Parlange, J.-Y.; Okom, A. Overland flow to and through a segment of uniform resistance. J. Hydrol. 2002, 255, 134–150. [Google Scholar] [CrossRef]
  53. Kemper, D.; Dabney, S.; Kramer, L.; Dominick, D.; Keep, T. Hedging against Erosion. J. Soil Water Conserv. 1992, 47, 284–288. [Google Scholar]
  54. Baudry, J.; Bunce, R.; Burel, F. Hedgerows: An international perspective on their origin, function and management. J. Environ. Manag. 2000, 60, 7–22. [Google Scholar] [CrossRef]
  55. Xiao, B.; Wang, Q.; Wang, H.; Wu, J.; Yu, D. The effects of grass hedges and micro-basins on reducing soil and water loss in temperate regions: A case study of Northern China. Soil Tillage Res. 2012, 122, 22–35. [Google Scholar] [CrossRef]
  56. Hargrave, A.P.; Shaykewich, C.F. Rainfall induced nitrogen and phosphorus losses from Manitoba soils. Can. J. Soil Sci. 1997, 77, 59–65. [Google Scholar] [CrossRef]
  57. Dabney, S.; Liu, Z.; Lane, M.; Douglas, J.; Zhu, J.; Flanagan, D. Landscape benching from tillage erosion between grass hedges. Soil Tillage Res. 1999, 51, 219–231. [Google Scholar] [CrossRef]
  58. Bhattarai, R.; Kalita, P.K.; Patel, M.K. Nutrient transport through a Vegetative Filter Strip with subsurface drainage. J. Environ. Manag. 2009, 90, 1868–1876. [Google Scholar] [CrossRef]
  59. Andraski, B.J.; Mueller, D.H.; Daniel, T.C. Phosphorus Losses in Runoff as Affected by Tillage. Soil Sci. Soc. Am. J. 1985, 49, 1523–1527. [Google Scholar] [CrossRef]
  60. Snyder, J.K.; Woolhiser, D.A. Effects of Infiltration on Chemical Transport into Overland Flow. Trans. ASAE 1985, 28, 1450–1457. [Google Scholar] [CrossRef]
  61. Wei, W.S.; Tong, J.X.; Yang, R.; Zhang, X.W.; Yun, L.J. Experimental Study on the Migration of Solutes in Soil Under Simulated Rainfall. China Rural. Water Hydropower 2016, 9, 168–173. [Google Scholar] [CrossRef]
  62. Campo-Bescós, M.A.; Muñoz-Carpena, R.; Kiker, G.A.; Bodah, B.W.; Ullman, J.L. Watering or buffering? Runoff and sediment pollution control from furrow irrigated fields in arid environments. Agric. Ecosyst. Environ. 2015, 205, 90–101. [Google Scholar] [CrossRef] [Green Version]
  63. Meng, Q.; Fu, B.; Tang, X.; Ren, H. Effects of land use on phosphorus loss in the hilly area of the Loess Plateau, China. Environ. Monit. Assess. 2008, 139, 195–204. [Google Scholar] [CrossRef]
  64. Kuo, Y.-M.; Muñoz-Carpena, R. Simplified modeling of phosphorus removal by vegetative filter strips to control runoff pollution from phosphate mining areas. J. Hydrol. 2009, 378, 343–354. [Google Scholar] [CrossRef]
  65. Lovell, S.T.; Sullivan, W.C. Environmental benefits of conservation buffers in the United States: Evidence, promise, and open questions. Agric. Ecosyst. Environ. 2006, 112, 249–260. [Google Scholar] [CrossRef]
Figure 1. The location of the study gully area which is located in Xuanhua district, Zhangjiakou City, Hebei Province, China. The red dot represents the experimental station in the gully area.
Applsci 12 04129 g001
Figure 2. Two different vegetation cover modes: (a) VFS with whole piece named VFS1; (b) VFS with two pieces named VFS2. Note: the green stands for vegetation filter; and the blue stands for bare ground.
Applsci 12 04129 g002
Figure 3. The soil tank used in the experiment.
Applsci 12 04129 g003
Figure 4. Effect of rainfall intensity, slope gradient on runoff in two different vegetation cover modes and the control plots: (a) Rain intensity is 30 mm/h; (b) Rain intensity is 60 mm/h; (c) Rain intensity is 90 mm/h.
Applsci 12 04129 g004
Figure 5. Effect of rainfall intensity, slope gradient on sediment yield in two different vegetation cover modes and the control plots: (a) Rain intensity is 30 mm/h. (b) Rain intensity is 60 mm/h. (c) Rain intensity is 90 mm/h.
Applsci 12 04129 g005
Figure 6. Effect of rainfall intensity, slope gradient on TP loss in runoff and sediment under different vegetation coverage types: (a) Rain intensity is 30 mm/h; (b) Rain intensity is 60 mm/h; (c) Rain intensity is 90 mm/h.
Applsci 12 04129 g006
Figure 7. Effect of rainfall intensity, slope gradient on TN loss in runoff and sediment under different vegetation coverage types: (a) Rain intensity is 30 mm/h; (b) Rain intensity is 60 mm/h; (c) Rain intensity is 90 mm/h.
Applsci 12 04129 g007
Figure 8. The groups of the phase dissimilarity of 6 evaluation indicators. (a) The groups of the phase dissimilarity of the runoff yield. (b) The groups of the phase dissimilarity of the sediment yield. (c) The groups of the phase dissimilarity of the TN content in runoff. (d) The groups of the phase dissimilarity of the TP content in runoff. (e) The groups of the phase dissimilarity of the TN content in sediment. (f) The groups of the phase dissimilarity of the TP content in sediment.
Applsci 12 04129 g008
Table 1. The experimental combinations.
Number123456789
Rain intensity mm/h306090306090306090
Vegetation coverage typeLLLZZZZ′Z′Z′
Note: L stands for bare slope, Z stands for VFS1, and Z′ stands for VFS2.
Table 2. Total loss of TN and TP in runoff and sediment under different combinations of factors.
Vegetation Coverage TypeRainfall Intensity (mm/h)TP in Runoff (mg)TP in Sediment (g)TN in Runoff (mg)TN in Sediment (g)
Slope (°)Slope (°)Slope (°)Slope (°)
52035520355203552035
L301.0174.9786.4500.0020.0090.02999.279226.009245.1100.0040.0040.004
608.47515.50318.3320.0120.0510.071308.764339.164362.2960.0110.0110.011
9030.43837.81242.7380.0740.2990.624499.226721.918765.8690.0230.0230.023
Z300.4691.6402.9780.0010.0040.01859.30699.326110.3600.0230.0230.023
604.0499.53813.8780.0080.0280.029198.789271.852272.5940.0900.0900.090
908.98417.37725.2080.0270.1310.250197.454320.725483.8190.1080.1080.108
Z’300.5771.2771.3040.0010.0040.02243.015119.691128.1780.1690.1690.169
605.5008.6089.4630.0070.0280.030182.819208.062257.1740.6810.6810.681
908.30719.40524.2340.0260.1440.196159.286379.565471.5161.0401.0401.040
Note: L stands for bare slope; Z stands for VFS1; and Z′ stands for VFS2.
Table 3. Relationship between erosion indexes and rainfall intensity, slope and vegetation coverage type.
Erosion IndexRegression EquationDetermination Coefficient R2p ValueN
Sediment (g)Y = −288.547 + 4.478 × R + 5.229 × S + 86.496 × V0 + 2.516 × V10.6170.00054
Runoff (L)Y = −13.743 + 0.387 × R + 0.348 × S + 7.422 × V0 – 0.035 × V10.8500.00054
TP in runoff (mg/L)Y = −0.172 + 0.008 × R + 0.006 × S + 0.223 × V0 + 0.044 × V10.8390.00054
TP in sediment (g/kg)Y = 0.510 + 0.004 × S + 0.118 × V0 + 0.020 × V10.4340.00054
TN in runoff (mg/L)Y = 14.769−0.028 × R + 0.011 × S + 3.454 × V0 + 0.812 × V10.6970.00054
TN in sediment (g/kg)Y = 0.675 + 0.005 × R – 0.012 × S + 0.413 × V0 – 0.014 × V10.7140.00054
Note: Y stands for the corresponding erosion index; R stands for rainfall and S stands for slope; V0 and V1 stand for the two dummy variables.
Table 4. Relationship between erosion indexes and rainfall intensity and slope under different vegetation coverage type.
Erosion IndexVegetation Coverage TypeMeanRegression EquationDetermination Coefficient R2p ValueN
Sediment (g)L171.232 aY = −416.856 + 7.100 × R + 8.323 × S0.6820.00018
Z87.252 bY = −193.807 + 3.399 × R + 3.938 × S0.7060.00018
Z’84.736 bY = −180.704 + 3.255 × R + 3.661 × S0.7000.00018
Runoff (L)L23.882 aY = −11.687 + 0.504 × R + 0.306 × S0.8930.00018
Z16.425 bY = −11.157 + 0.347 × R + 0.377 × S0.8580.00018
Z’16.460 bY = −10.784 + 0.336 × R + 0.388 × S0.8680.00018
TP in runoff (mg/L)L0.648 aY = −0.040 + 0.010 × R + 0.006 × S0.8650.00018
Z0.469 bY = −0.085 + 0.007 × R + 0.009 × S0.8780.00018
Z’0.425 cY = −0.067 + 0.008 × R +0.001 × S0.9420.00018
TP in sediment (g/kg)L0.701 aY = 0.583 + 0.001 × R + 0.005 × S0.6260.00118
Z0.603 bY = 0.599 – 0.001 × R + 0.004 × S0.2840.08118
Z’0.583 bY = 0.572 + 0.000 × R + 0.002 × S0.2120.16818
TN in runoff (mg/L)L16.754 aY = 18.224 – 0.017 × R + 0.003 × S0.2160.16118
Z14.112 bY = 17.334 – 0.042 × R−0.019 × S0.9100.00018
Z’13.300 bY = 14.448 – 0.027 × R + 0.040 × S0.4710.00818
TN in sediment (g/kg)L1.165 aY = 0.656 + 0.011 × R – 0.006 × S0.9300.00018
Z0.739 bY = 0.856 + 0.003 × R – 0.013 × S0.6280.00118
Z’0.752 bY = 1.020 + 0.002 × R – 0.016 × S0.6960.00018
a b c Within a erosion index, means followed by the same letter are not significantly different. Note: Y stands for the corresponding erosion index; R stands for rainfall; S stands for slope; L stands for bare slope; Z stands for VFS1; and Z′ stands for VFS2.
Table 5. Different sequence of combinations (rainfall intensity, slope and vegetation cover type).
Number 123456789101112131415161718192021222324252627
Rainfall intensity
(mm/h)
30
60
90
Slope
gradient
(°)
5
20
35
Vegetation coverage
type
L
Z
Z′
Note: L stands for bare slope, Z stands for a single piece of vegetation filter strip, and Z′ stands for two pieces of vegetation filter strip.
Publisher’s Note: MDPI stays neutral with regard to jurisdictional claims in published maps and institutional affiliations.

