1. Introduction
Sleep apnea (SA) is a common sleep disorder, also commonly known as obstructive sleep apnea (OSA) [
1]. OSA occurs due to the abnormal function of the upper respiratory tract. When the hard palate muscles at the back of the throat that support the soft palate relax, the soft palate blocks the passage of air into the respiratory system. The clinical manifestation of SA is a cessation of nasal airflow or a decrease in airflow intensity by more than 30% compared to the base level, but the corresponding breathing movements are maintained [
2]. At the same time, oxygen saturation decreases by more than 4% for more than 10 s. The prevalence of OSA in adults ranges from 9% to 38% and increases with age [
3]. Low quality sleep accompanied by apnea usually leads directly to poor concentration, memory loss, slow response, and depression [
4]. In addition, OSA is a potential threat to many physiological systems of the human body, especially the cardiovascular system. It can induce hypertension, heart failure, coronary artery disease, diabetes, and other diseases, which seriously threaten the health of patients [
5]. If patients are identified and then treated at an early stage of OSA, the health risks can be reduced. Therefore, timely diagnosis of patients with OSA is essential.
Clinically, polysomnography (PSG) is the reference standard for the diagnosis of SA. PSG is effective in monitoring sleep conditions by collecting various physiological signals such as electrocardiogram (ECG), electroencephalogram (EEG), electromyogram (EMG), blood oxygen saturation (SpO2), airflow signals, respiratory effort, etc. [
6]. However, wearing too many sensors during physiological signal collection can cause discomfort to the patient. In addition, the diagnosis of OSA requires sleep specialists to spend a lot of time manually analyzing PSG data [
7]. Therefore, automatic detection of SA using fewer signals is necessary.
Researchers have typically developed SA detection algorithms using ECG signals. ECG is a non-invasive technique for recording the electrical activity of heart and the physiological activity of heart is regulated under the autonomic nervous system (ANS). Studies have shown that hypoxia caused by SA can lead to the dysregulation of the ANS. Clinically, heart rate variability (HRV) is an important indicator of the outcome of ANS regulation [
8]. Therefore, it is feasible to screen for apnea by monitoring ECG during sleep [
9]. Yet, ECG signals are easily influenced by cardiovascular disease status. This makes the diagnosis of SA more challenging. Apart from ECG signals, SpO2 signals are also widely used to detect SA as the lack of airflow due to SA events can lead to a decrease in SpO2. Repetitive oxygen desaturation is highly specific for apnea. However, the sensitivity of oximetry is usually low, as not all apnea events lead to discernible desaturations [
7]. Thus, SpO2 alone or ECG alone can be used as a potential diagnostic means of SA, but not as a reliable means.
With technological advances in sensors and low-power embedded systems, the collection of physiological signals has become easier and more economical [
10]. Therefore, we consider using multiple signals to develop a more reliable detection algorithm of SA, rather than being limited to a single signal.
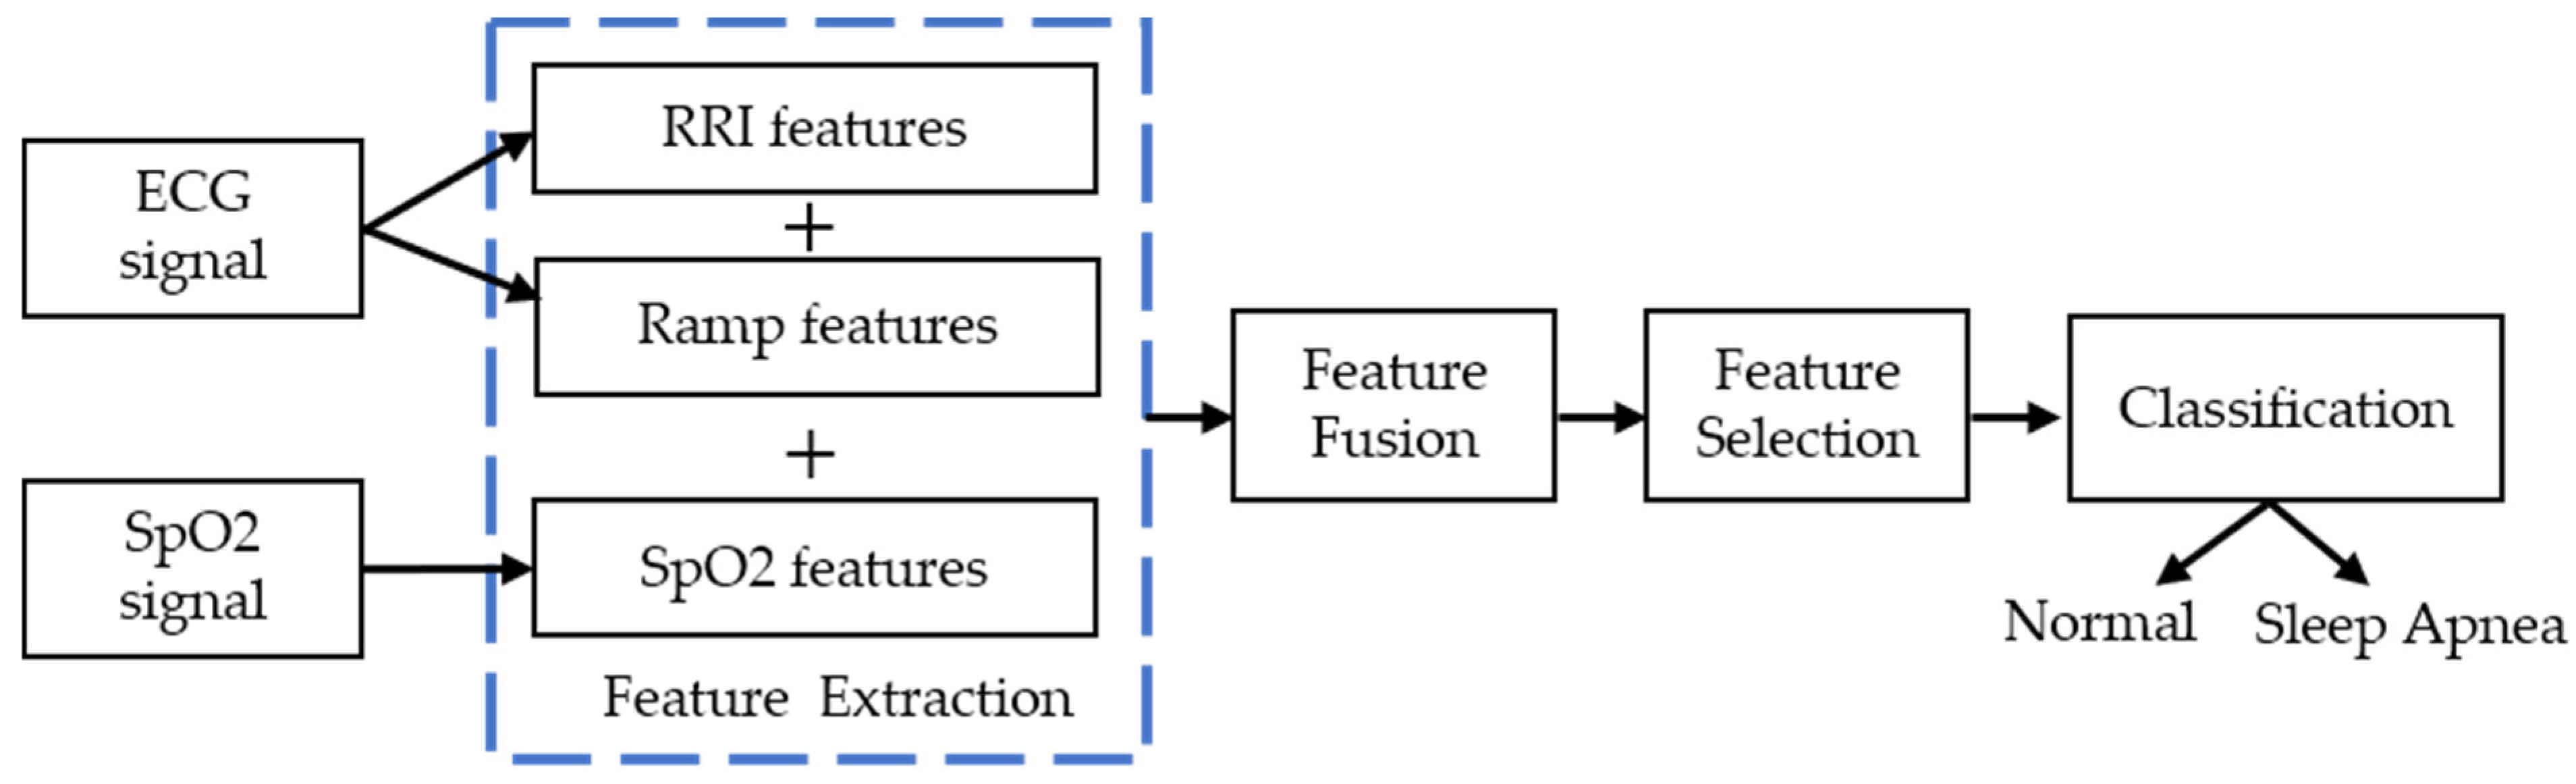
This study explores the efficiency and reliability of a multimodal approach to the automated detection of SA events using a combined channel of ECG and SpO2. To this end, we extracted features from ECG signal and SpO2 signal separately, and then fused the features of the two different modalities. Feature selection was performed using the recursive feature elimination with cross-validation (RFECV) algorithm. Then, the selected features were fed to the RF classifier to identify sleep apnea events.
Our study provides three main contributions to research. First, we verify the complementarity of ECG and SpO2 signals to automatically detect SA. When the two signals are combined, the diagnostic ability is increased. Second, the RFECV algorithm is employed to select the most important features. The proposed SA detection technique uses a smaller number of features and is computationally inexpensive compared to most of the existing methods. Third, we enrich the method in the field of the automated detection of SA by applying a multimodal approach to fuse ECG and SpO2 signals at the feature level. So far, most of the extant literature primarily used SpO2 alone or ECG alone, but did not consider the combination of ECG and SpO2.
The rest of this paper is organized as follows. The related works of SA detection are explored in
Section 2. The explanation of the dataset, preprocessing steps, and the introduced SA detection technique is presented in
Section 3. The Results and Discussions are presented in
Section 4 and
Section 5, respectively. Finally,
Section 6 concludes the paper.
2. Related Works
Over past studies, various physiological signals (e.g., ECG, EEG, SpO2, snoring or airflow) have been used to develop SA detection algorithms [
11], the most widely used of which are ECG signal and SpO2 signal.
For ECG signal-based methods, the shallow characteristic signals of the ECG are usually analyzed in the time domain, frequency domain or nonlinear domain. The time intervals between successive heartbeats are sequentially combined to form the RR interval signal [
12]. HRV analysis refers to the analysis of changes in the RR interval signal. Nakayama et al. [
9] proposed a method for detecting sleep apnea based on HRV analysis. Their method was successfully applied to clinical PSG data and the performance was comparable to portable monitoring devices in sleep laboratories. ECG-derived respiratory (EDR) signals reflecting respiratory activity can be used as complementary information to HRV [
13]. Khandoker et al. [
14] analyzed the EDR signal and RR interval with wavelet transform and used SVM classifier to identify OSA patients. In their work, more than 90% of subjects in the test set were correctly classified. Further, Bsoul et al. [
15] extracted a complete feature set containing 111 features from RR and EDR time series using time-frequency analysis methods. Sharma et al. [
16] developed a SA detection model using Hermite basis functions. Sharma mainly considered the morphological changes occurring in the QRS wave complex of the ECG.
The occurrence of apnea is usually accompanied by a decrease in oxygen saturation, hence the SpO2 signal has been used in several studies. Some of these studies employed statistical methods to quantify the variation in oxygen saturation over time. For example, Ulysses et al. [
17] used time spent below a certain level saturation (TSA), the saturation variability index and other indicators to evaluate AHI, and compared the diagnostic performance of SA under different metrics. The oxygen desaturation index (ODI) is defined as the number of oxyhemoglobin desaturation below a certain threshold [
18]. Ling et al. [
19] found that the use of ODI improved the accuracy of moderate and severe OSA detection. However, the ODI index is more suitable for prolonged SpO2 signals. In addition, some studies have explored nonlinear parameters. Alvarez et al. [
20] used central tendency measure (CTM) and Lempel–Ziv (LZ) complexity to identify OSA and showed that the sensitivity obtained using CTM and LZ complexity, respectively, was 90.1% and 86.5%. Hornero et al. [
21] performed a time series analysis of the SpO2 signal by approximate entropy and obtained a sensitivity of 82.09% and a specificity of 86.96% on training set.
To conclude our brief review of SA detection algorithms, we have found that screening for SA using either ECG or SpO2 signals is effective, but the majority of the previous studies focused only on a single data modality. However, several machine learning tasks in other fields (e.g., medical image analysis, sentiment recognition, etc.) have demonstrated that fusing information from multiple data modalities can enhance the robustness of a model [
22]. Therefore, our proposed multimodal approach for the detection of SA is more advanced.
4. Results
After the preprocessing step, the published set consisted of 3903 1-min samples, of which 2308 were normal samples and 1595 were sleep apnea samples. Three sets of features extracted from each sample were fused and fed into a classifier for sleep apnea detection after feature selection. During the experiment, the dataset was divided into a training set (80%) and a test set (20%) by a stratified sampling method. On the training set, five-fold cross validation was used to select optimal features, optimize classifier parameters, and model training. Accuracy, sensitivity, specificity, and AUC were used on the test set to evaluate the model performance.
The experimental environment is based on the Windows 10 operating system, the software used to develop the algorithm is python 3.6, and the hardware configuration is Xeon E5-2640v4 CPU, Nvidia GeForce RTX2080Ti GPU, and 32GB RAM.
4.1. Feature Selection and KW-ANOVA Test
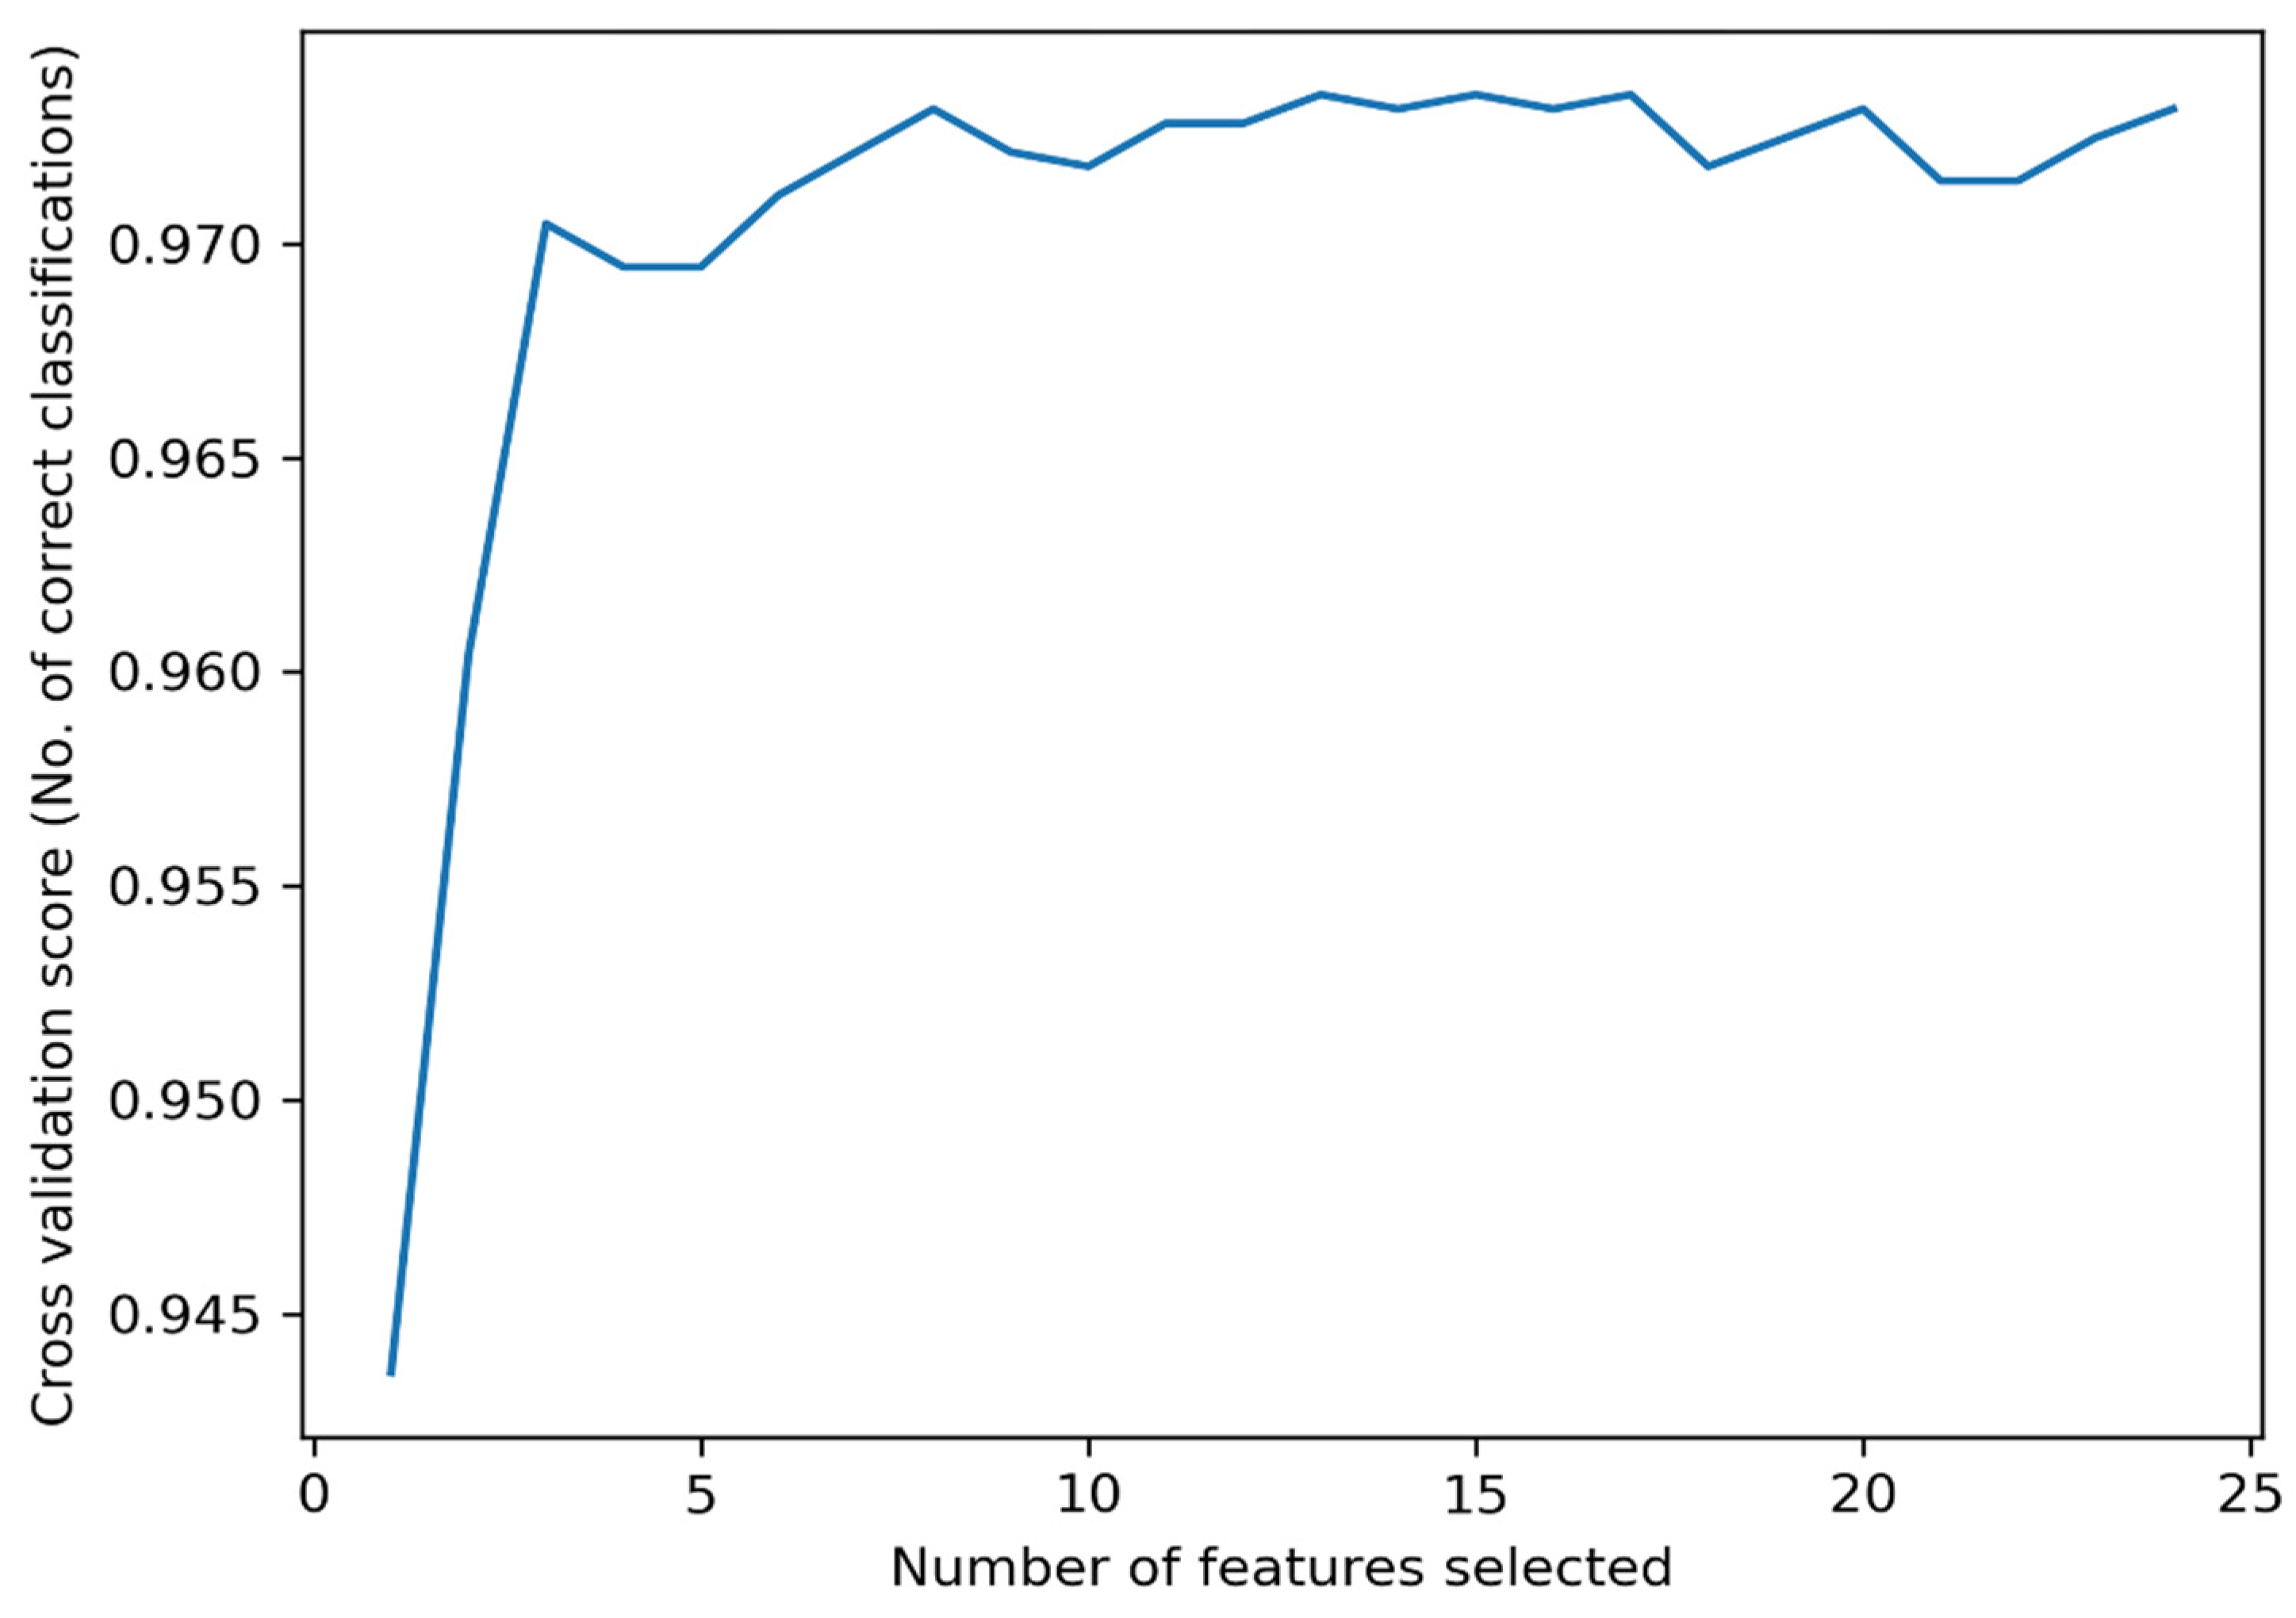
As mentioned before, the optimal subset of features was selected using the RFECV algorithm and the features were statistically analyzed by the KW-ANOVA test. The optimal subset of features reduces the complexity of the model while maintaining the classification accuracy. The relationship between the number of selected features and the classification accuracy is illustrated in
Figure 4. In
Figure 4, the cross-validation score fluctuates as the number of features decreases, which is caused by the change in the data distribution during the five-fold cross validation process. From
Figure 4, the highest accuracy is obtained by selecting 13 features. The selected features are as follows:
RMSSD,
pNN50,
HR,
VLF 1,
HF 1,
LFnorm 1, and
HFnorm 1 in the ECG feature set;
Smin,
Smean,
Svar,
ApEn, LZC, and
CTM in the SpO2 feature set. The number corresponding to each feature is presented in
Table 3.
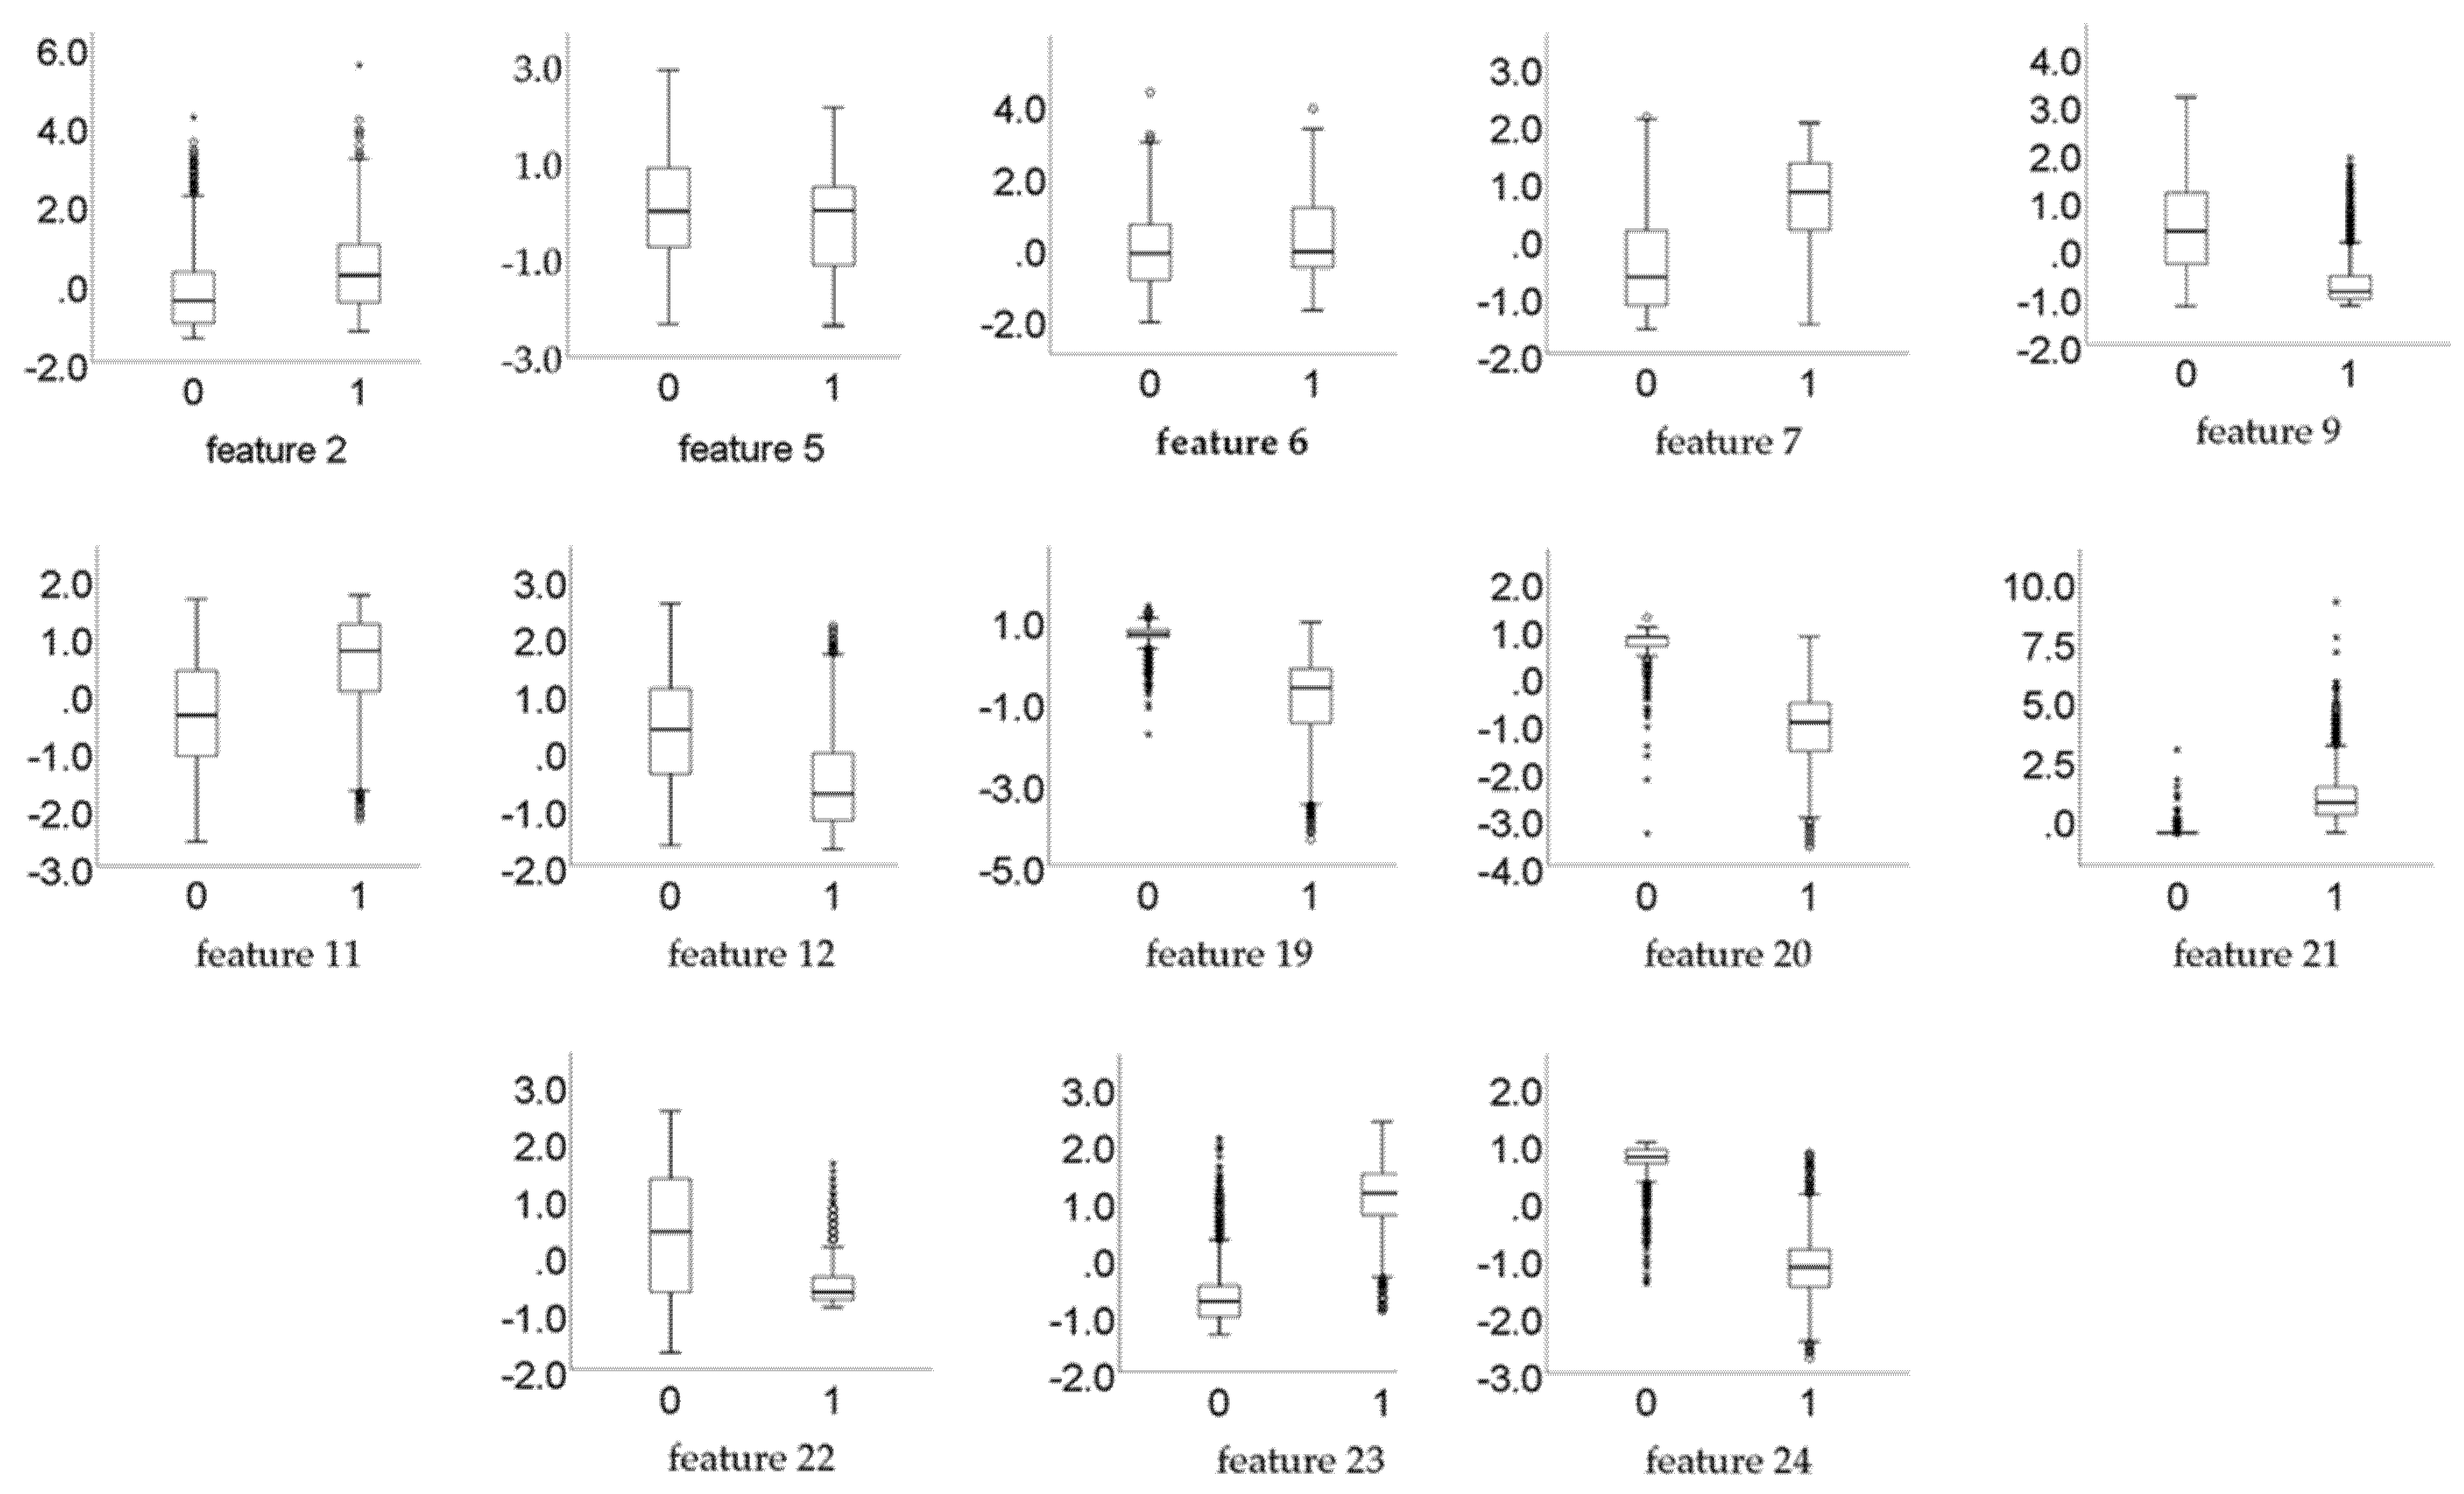
The results of the KW-ANOVA test shows that for all the 13 selected features,
p << 0.01, which means that the selected features are statistically significantly different in discriminating between normal and SA classes. Furthermore,
Figure 5 exhibits the box plots of the selected features, to verify that these features have significant differences.
4.2. Using Conbined ECG and SpO2 Feature Set
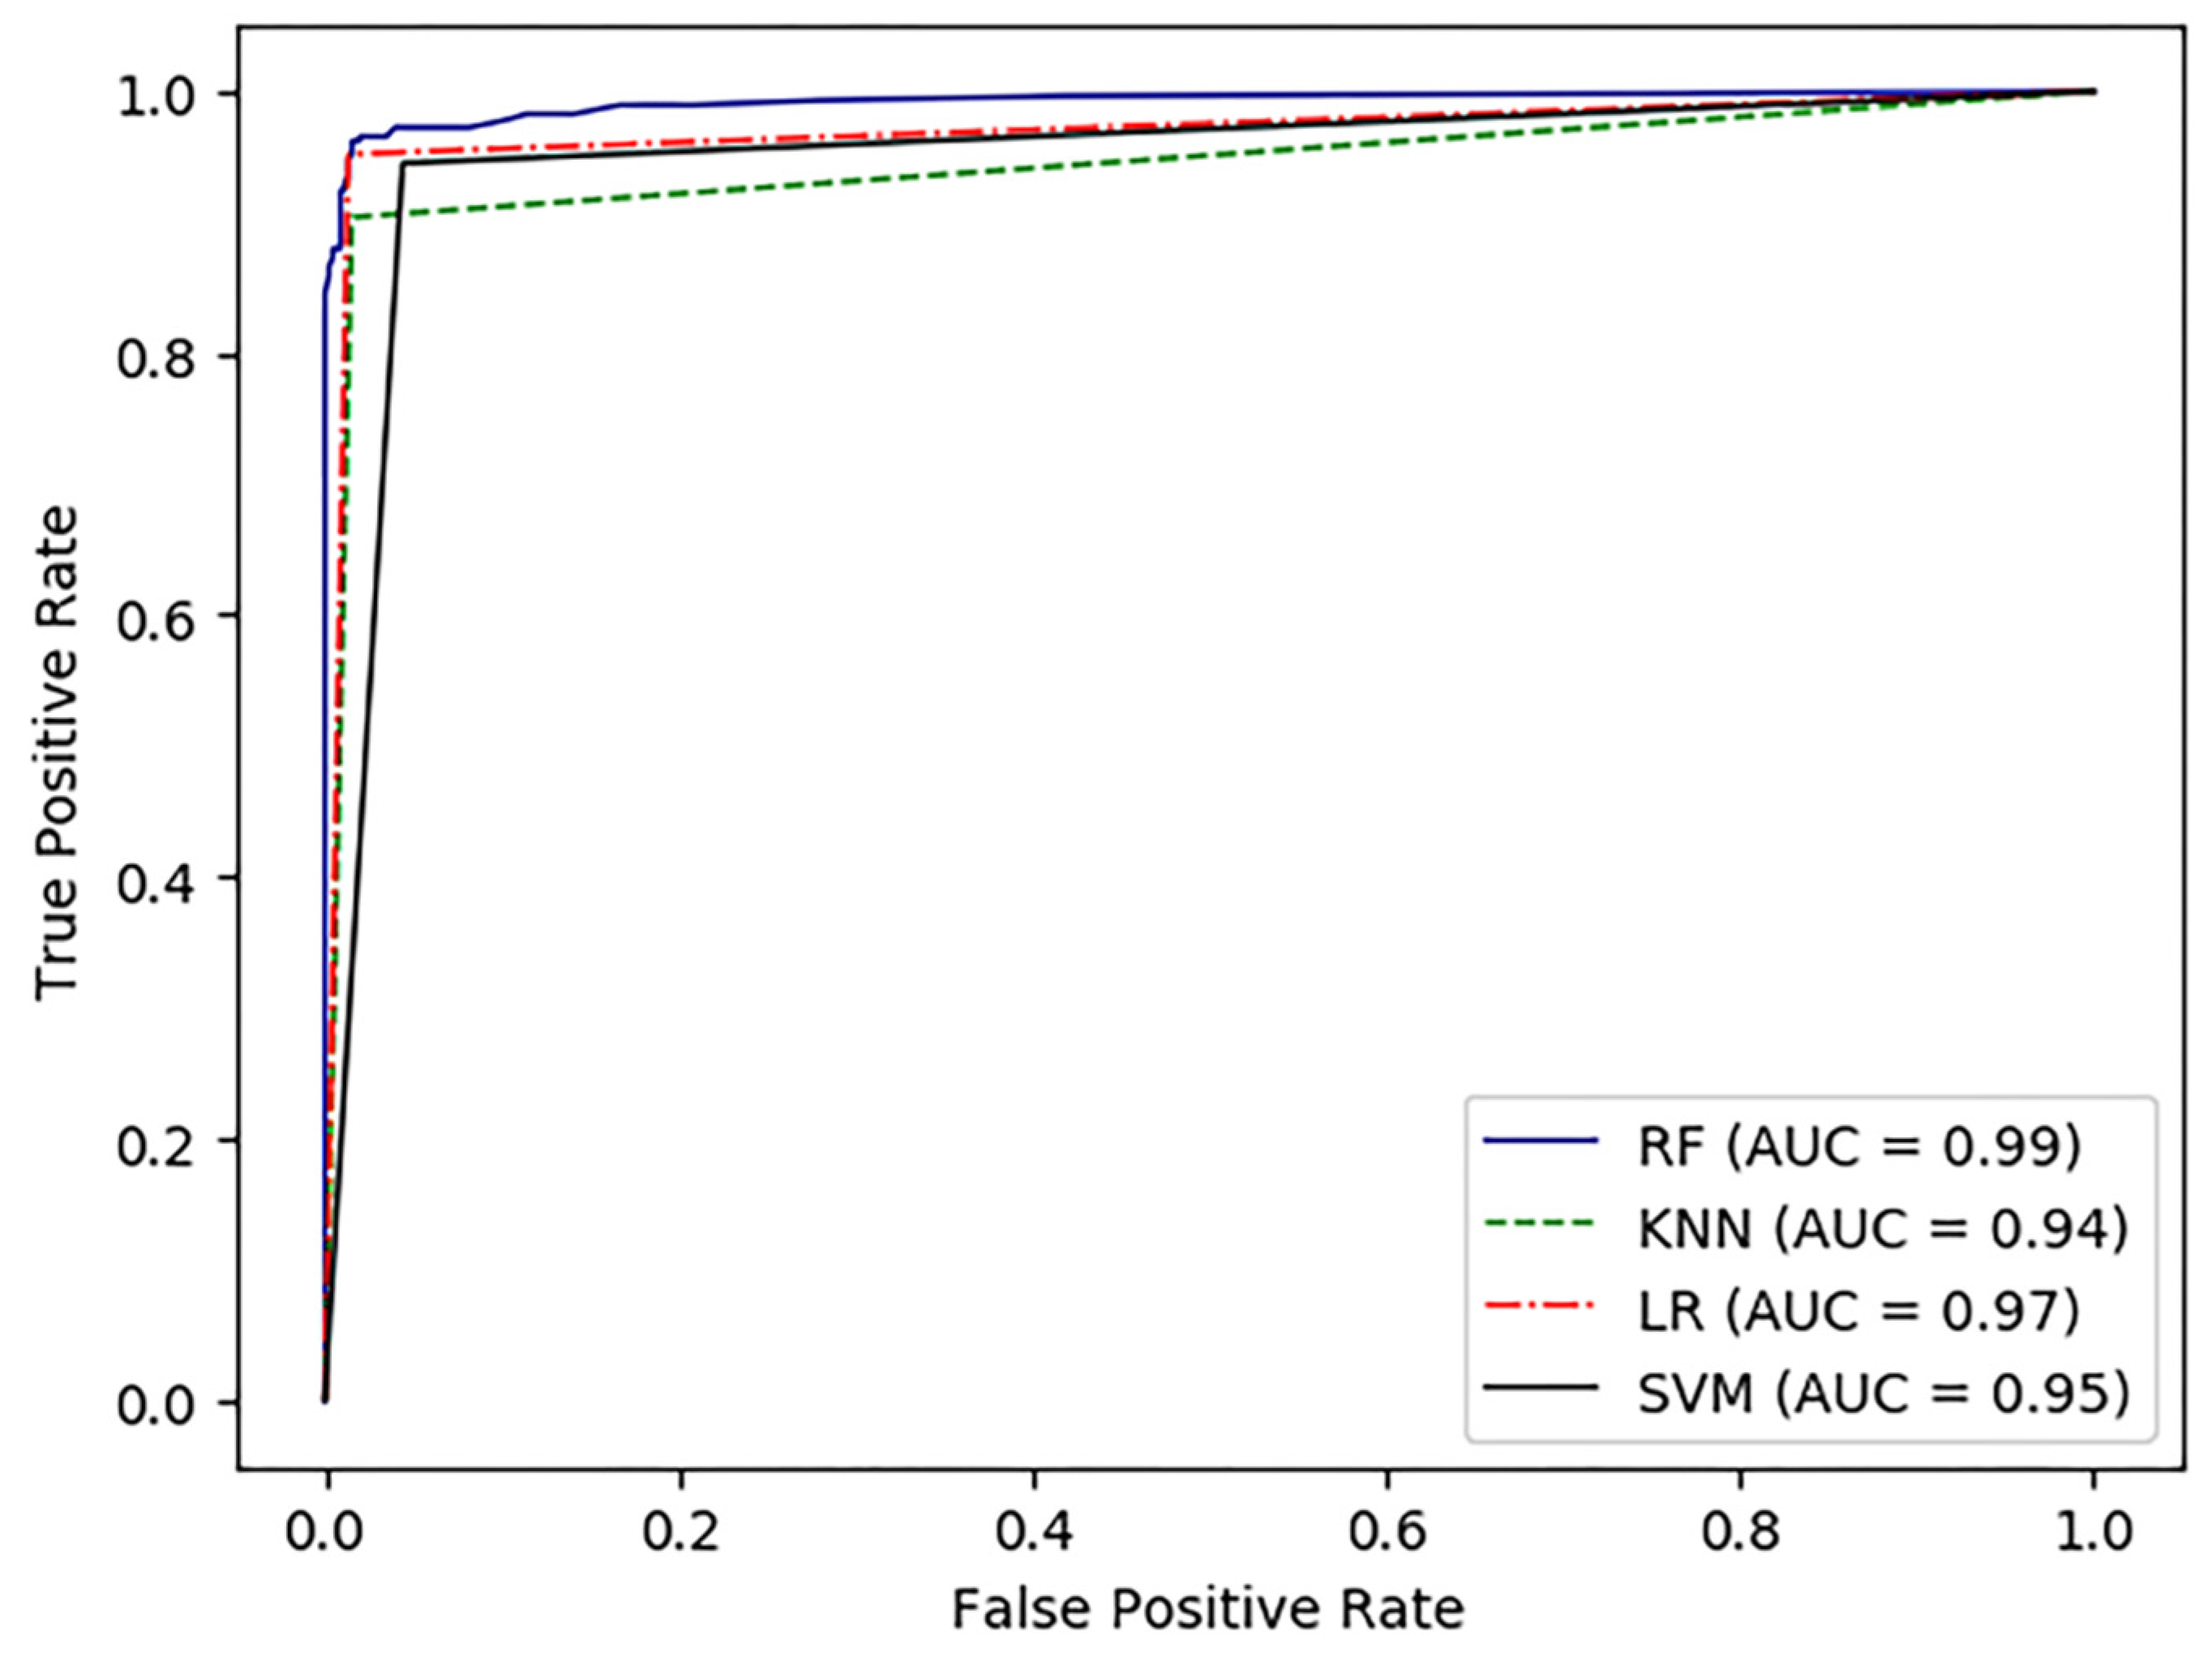
The classification results of per-minute segment are shown in
Table 4. According to
Table 4, the proposed method provided an accuracy of 97.5%, sensitivity of 95.9%, specificity of 98.4%, and AUC of 99.2% using RF classifier. In addition, we used some other classical classifiers (including SVM, KNN, and LR) to compare with the RF classifier. Although these classifiers also achieved satisfactory results, the RF classifier still had the highest accuracy of 97.5%. Furthermore, sensitivity, specificity, and AUC using the RF classifier were also higher than the other classifiers. The ROC curves of the four classifiers are plotted in
Figure 6. Thus, in this study, the RF classifier is more suitable for SA detection than the other machine learning algorithms mentioned above.
4.3. Using either ECG or SpO2 Feature Set
To compare the SA detection performance of different signals, the ECG features and SpO2 features from the optimal feature set were used for SA detection, respectively. From
Table 4, it was clear that the RF classifier outperforms the other classifiers. Therefore, the experiments in this section were conducted using the RF classifier alone.
Table 5 shows the accuracy, sensitivity, specificity, and AUC using either the ECG feature set or the SpO2 feature set.


