
A Dermoscopic Inspired System for Localization and Malignancy Classification of Melanocytic Lesions


 ,
, 
 , and
, and 
Abstract
:1. Introduction
1.1. Motivation
1.2. Related Work
1.3. Problem Statement
- Provide automated localization of the lesions.
- The features extracted need to hold clinical significance.
- Result in a balance between sensitivity and specificity for distinguishing the lesion classes.
1.4. Contributions
1.5. Summary
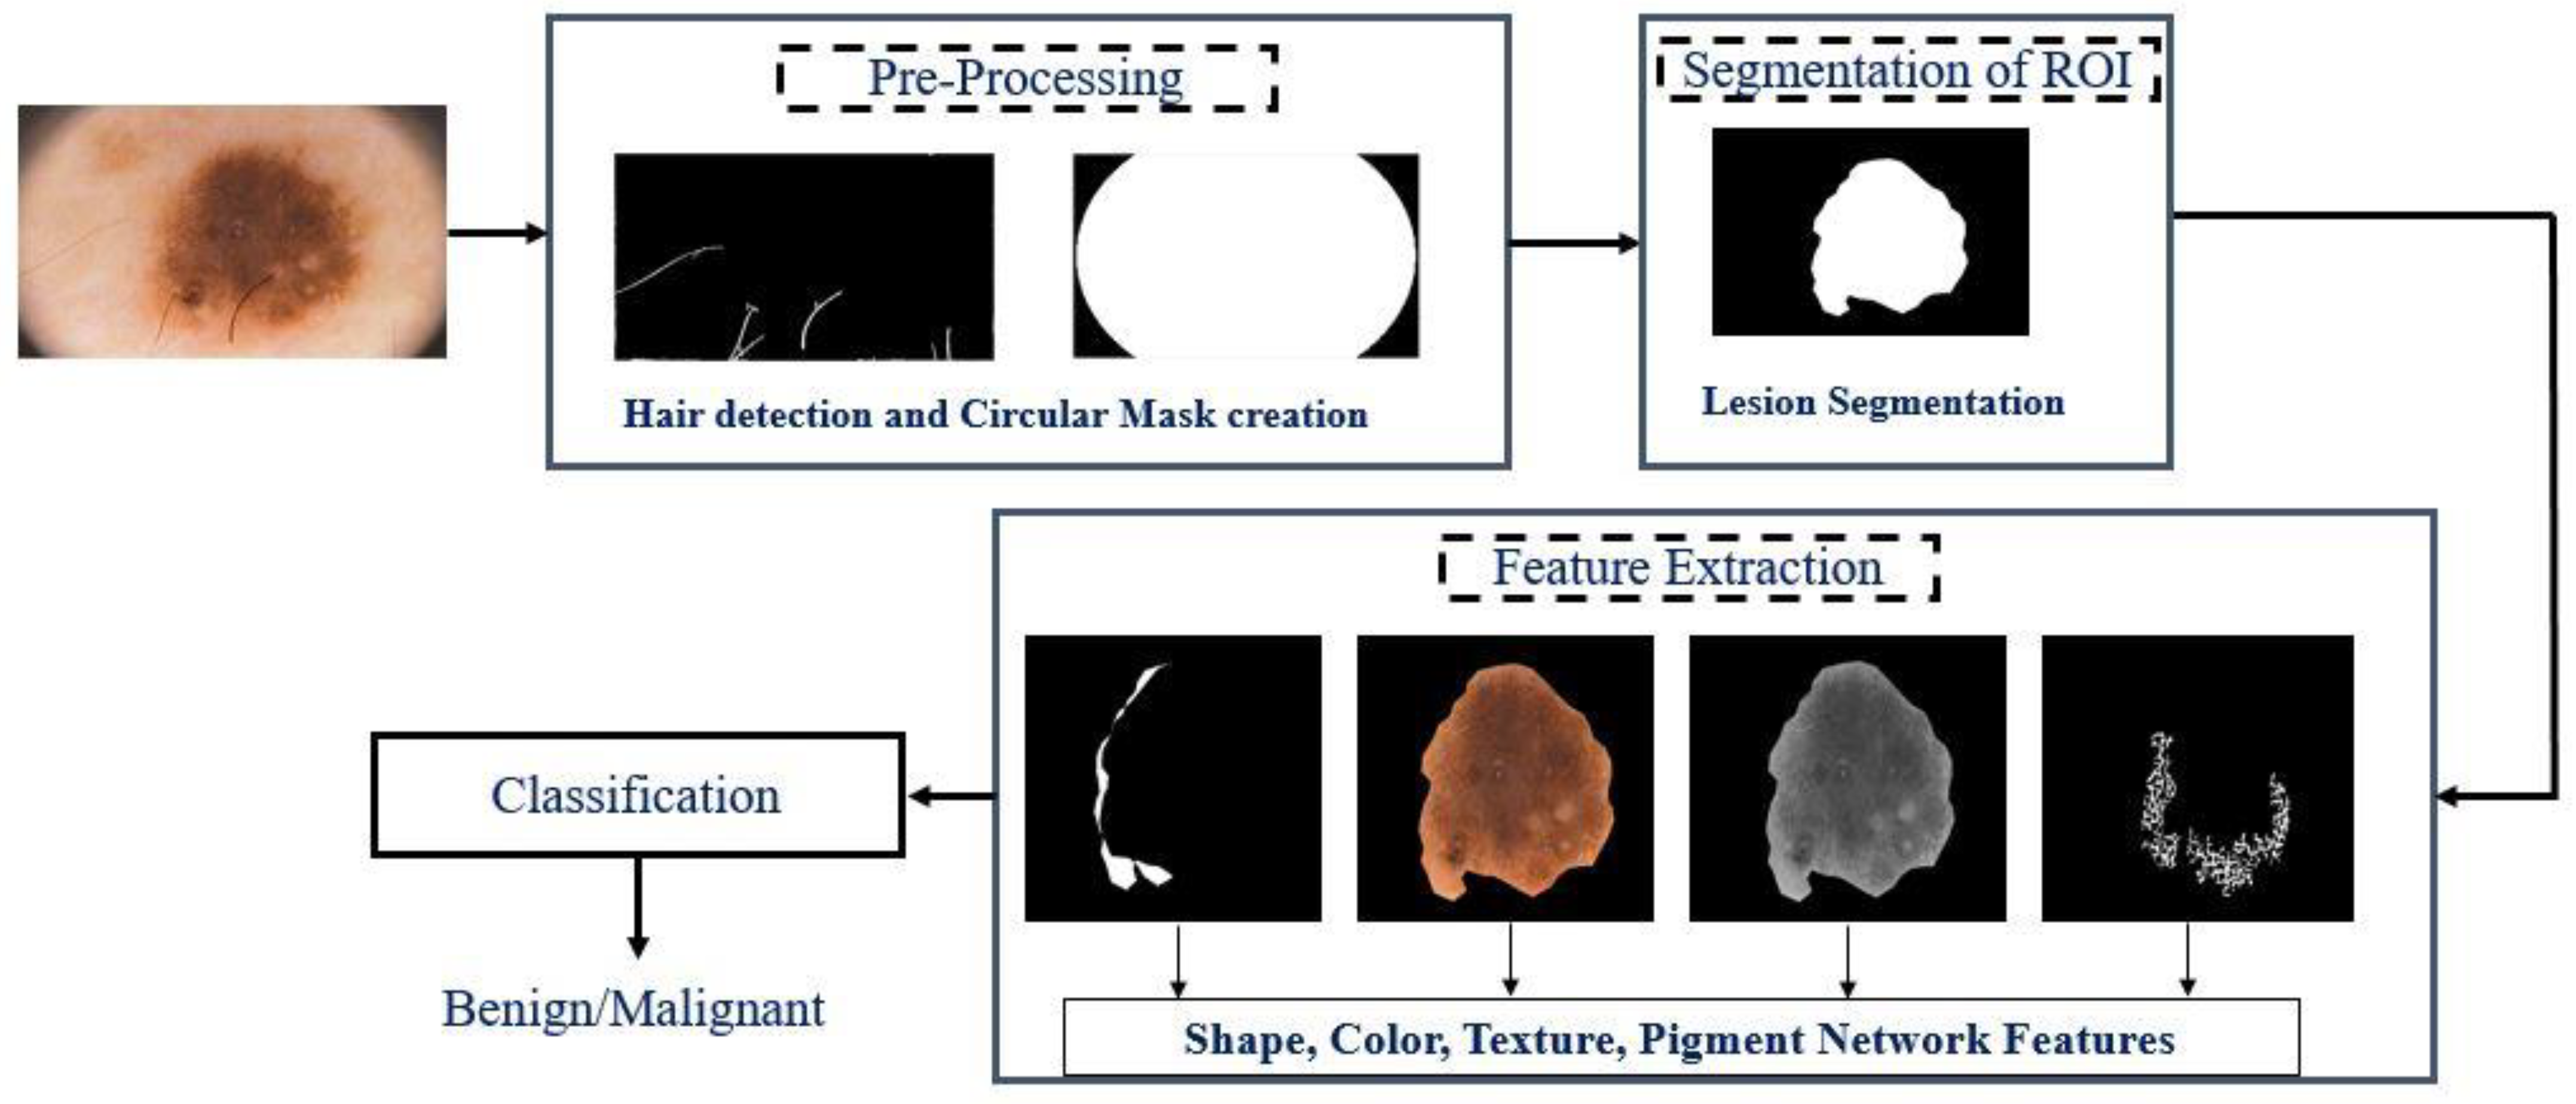
2. Methods
2.1. Detection and Removal of Hair
2.2. Extraction and Classification of Features
2.2.1. Color Features
| Algorithm 1. Color Similarity Index Calculation |
| |
2.2.2. Texture Features
2.2.3. Shape Features
2.2.4. Detection of the Pigment Network
2.2.5. Classification and Diagnosis
3. Results
3.1. Dataset and Evaluation Metrics
3.2. Evaluation of Hair Detection and Lesion Segmentation: Results
3.3. Evaluation of Features Extracted and Lesion Classification: Results
4. Discussion
5. Conclusions
Author Contributions
Funding
Institutional Review Board Statement
Informed Consent Statement
Data Availability Statement
Conflicts of Interest
References
- The Medical Futurist. Amazing Technologies Changing the Future of Dermatology—The Medical Futurist. 2017. Available online: http://medicalfuturist.com/future-of-dermatology/ (accessed on 24 September 2017).
- Pathan, S.; Prabhu, K.G.; Siddalingaswamy, P.C. Techniques and algorithms for computer aided diagnosis of pigmented skin lesions—A review. Biomed. Signal Process. Control 2018, 39, 237–262. [Google Scholar] [CrossRef]
- Abbas, Q.; Celebi, M.E.; García, I.F. Skin tumor area extraction using an improved dynamic programming approach. Ski. Res. Technol. 2011, 18, 133–142. [Google Scholar] [CrossRef] [PubMed]
- Abbas, Q.; Celebi, M.E.; Garcia, I.F.; Ahmad, W. Melanoma recognition framework based on expert definition of ABCD for dermoscopic images. Ski. Res. Technol. 2013, 19, e93–e102. [Google Scholar] [CrossRef] [PubMed]
- Barata, C.; Celebi, M.E.; Marques, J. Development of a clinically oriented system for melanoma diagnosis. Pattern Recognit. 2017, 69, 270–285. [Google Scholar] [CrossRef]
- Garnavi, R.; Aldeen, M.; Bailey, J. Computer-Aided Diagnosis of Melanoma Using Border- and Wavelet-Based Texture Analysis. IEEE Trans. Inf. Technol. Biomed. 2012, 16, 1239–1252. [Google Scholar] [CrossRef] [PubMed]
- Kostopoulos, S.A.; Asvestas, P.A.; Kalatzis, I.K.; Sakellaropoulos, G.C.; Sakkis, T.H.; Cavouras, D.A.; Glotsos, D.T. Adaptable pattern recognition system for discriminating Melanocytic Nevi from Malignant Melanomas using plain photography images from different image databases. Int. J. Med. Inform. 2017, 105, 1–10. [Google Scholar] [CrossRef] [PubMed]
- Ferris, L.K.; Harkes, J.A.; Gilbert, B.; Winger, D.G.; Golubets, K.; Akilov, O.; Satyanarayanan, M. Computer-aided classification of melanocytic lesions using dermoscopic images. J. Am. Acad. Dermatol. 2015, 73, 769–776. [Google Scholar] [CrossRef]
- Kasmi, R.; Mokrani, K. Classification of malignant melanoma and benign skin lesions: Implementation of automatic ABCD rule. IET Image Process. 2016, 10, 448–455. [Google Scholar] [CrossRef]
- Celebi, M.E.; Kingravi, H.A.; Uddin, B.; Iyatomi, H.; Aslandogan, Y.A.; Stoecker, W.V.; Moss, R.H. A methodological approach to the classification of dermoscopy images. Comput. Med. Imaging Graph. 2007, 31, 362–373. [Google Scholar] [CrossRef] [Green Version]
- Abuzaghleh, O.; Barkana, B.D.; Faezipour, M. Noninvasive Real-Time Automated Skin Lesion Analysis System for Melanoma Early Detection and Prevention. IEEE J. Transl. Eng. Health Med. 2015, 3, 4300212. [Google Scholar] [CrossRef]
- Bozorgtabar, B.; Sedai, S.; Roy, P.K.; Garnavi, R. Skin lesion segmentation using deep convolution networks guided by local unsupervised learning. IBM J. Res. Dev. 2017, 61, 6:1–6:8. [Google Scholar] [CrossRef]
- Premaladha, J.; Ravichandran, K.S. Novel Approaches for Diagnosing Melanoma Skin Lesions Through Supervised and Deep Learning Algorithms. J. Med. Syst. 2016, 40, 96. [Google Scholar] [CrossRef]
- Celebi, M.E.; Iyatomi, H.; Stoecker, W.V.; Moss, R.H.; Rabinovitz, H.S.; Argenziano, G.; Soyer, H.P. Automatic detection of blue-white veil and related structures in dermoscopy images. Comput. Med. Imaging Graph. 2008, 32, 670–677. [Google Scholar] [CrossRef] [Green Version]
- Barata, C.; Marques, J.S.; Rozeira, J. A System for the Detection of Pigment Network in Dermoscopy Images Using Directional Filters. IEEE Trans. Biomed. Eng. 2012, 59, 2744–2754. [Google Scholar] [CrossRef]
- Abbas, Q.; Celebi, M.E.; García, I.F. Hair removal methods: A comparative study for dermoscopy images. Biomed. Signal Process. Control 2011, 6, 395–404. [Google Scholar] [CrossRef]
- Toossi, M.T.B.; Pourreza, H.R.; Zare, H.; Sigari, M.-H.; Layegh, P.; Azimi, A. An effective hair removal algorithm for dermoscopy images. Ski. Res. Technol. 2013, 19, 230–235. [Google Scholar] [CrossRef]
- Liu, Z.-Q.; Cai, J.-H.; Buse, R. Hand-writing Recognition: Soft Computing and Probablistic Approaches, 1st ed.; Springer: Berlin/Heidelberg, Germany, 2003. [Google Scholar]
- Rakowska, A. Trichoscopy (hair and scalp videodermoscopy) in the healthy female. Method standardization and norms for measurable parameters. J. Dermatol. Case Rep. 2019, 3, 14. [Google Scholar] [CrossRef] [Green Version]
- Ma, Z.; Tavares, J.M.R.S. A Novel Approach to Segment Skin Lesions in Dermoscopic Images Based on a Deformable Model. IEEE J. Biomed. Health Inform. 2016, 20, 615–623. [Google Scholar] [CrossRef] [Green Version]
- Weatherall, I.L.; Coombs, B.D. Skin Color Measurements in Terms of CIELAB Color Space Values. J. Investig. Dermatol. 1992, 99, 468–473. [Google Scholar] [CrossRef] [Green Version]
- Chan, T.F.; Vese, L.A. Active contours without edges. IEEE Trans. Image Process. 2001, 10, 266–277. [Google Scholar] [CrossRef] [Green Version]
- Tamura, H.; Mori, S.; Yamawaki, T. Textural Features Corresponding to Visual Perception. IEEE Trans. Syst. Man Cybern. 1978, 8, 460–473. [Google Scholar] [CrossRef]
- Lee, T.K.; McLean, D.I.; Atkins, M.S. Irregularity index: A new border irregularity measure for cutaneous melanocytic lesions. Med. Image Anal. 2002, 7, 47–64. [Google Scholar] [CrossRef]
- Eltayef, K.; Li, Y.; Liu, X. Detection of Pigment Networks in Dermoscopy Images. J. Physics Conf. Ser. 2017, 787, 012033. [Google Scholar] [CrossRef] [Green Version]
- Platt, J. Probabilistic outputs for support vector machines and comparisons to regularized likelihood methods. In Advances in Large Margin Classifiers; The MIT Press: Cambridge, MA, USA, 2000; pp. 61–74. [Google Scholar]
- Pathan, S.; Prabhu, K.G.; Siddalingaswamy, P.C. Hair detection and lesion segmentation in dermoscopic images using domain knowledge. Med. Biol. Eng. Comput. 2018, 56, 2051–2065. [Google Scholar] [CrossRef]
- Mendonca, T.; Ferreira, P.M.; Marques, J.S.; Marcal, A.R.S.; Rozeira, J. PH2-A dermoscopic image database for research and benchmarking. In Proceedings of the 2013 35th Annual International Conference of the IEEE Engineering in Medicine and Biology Society (EMBC), Osaka, Japan, 3–7 July 2013; pp. 5437–5440. [Google Scholar] [CrossRef]
- ISIC 2016: Skin Lesion Analysis Towards Melanoma Detec-tion. Available online: https://challenge.kitware.com/#challenge/n/ISBI_2016%3A_Skin_Lesion_Analysis_Towards_Melanoma_Detection (accessed on 24 September 2017).
- Codella, N.C.F.; Gutman, D.; Celebi, M.E.; Helba, B.; Marchetti, M.A.; Dusza, S.W.; Kalloo, A.; Liopyris, K.; Mishra, N.; Kittler, H.; et al. Skin Lesion Analysis Toward Melanoma Detection: A Challenge at the 2017 International Symposium on Biomedical Imaging (ISBI), Hosted by the International Skin Imaging Collaboration (ISIC). arXiv 2017, arXiv:1710.05006. [Google Scholar]
- Yu, L.; Chen, H.; Dou, Q.; Qin, J.; Heng, P.-A. Automated Melanoma Recognition in Dermoscopy Images via Very Deep Residual Net-works. IEEE Trans. Med. Imaging 2017, 36, 994–1004. [Google Scholar] [CrossRef]
- Pathan, S.; Prabhu, K.G.; Siddalingaswamy, P. A methodological approach to classify typical and atypical pigment network patterns for melanoma diagnosis. Biomed. Signal Process. Control 2018, 44, 25–37. [Google Scholar] [CrossRef]
- Pennisi, A.; Bloisi, D.D.; Nardi, D.; Giampetruzzi, A.R.; Mondino, C.; Facchiano, A. Skin lesion image segmentation using Delaunay Triangulation for melanoma detection. Comput. Med. Imaging Graph. 2016, 52, 89–103. [Google Scholar] [CrossRef] [Green Version]


| Feature Type | Description (Number) |
|---|---|
| Shape | Shape Asymmetry Index (1), Compactness Index (1), and Fractal Dimensions (1) |
| Color | Color Asymmetry Index (4), Color similarity score (6), Color variation (8), color entropy (4), color co-relation (12), and PCA (3), |
| Texture | Coarseness (1), Contrast (1), and Directionality (1) |
| Dermoscopic Structure | Pigment Network (5) |
| F | Mean | SD | F | Mean | SD |
|---|---|---|---|---|---|
| AI | 0.69 | 0.94 | VRI | 1509.015 | 1368.13 |
| CI | 2.63 | 3.21 | VGI | 1834.916 | 1303.59 |
| FD | 26.31 | 9.30 | PC1 | 2910.31 | 1911.63 |
| T1 | 39.80 | 17.70 | PC2 | 116.10 | 100.96 |
| T3 | 13.42 | 12.77 | PC3 | 11.62 | 7.95 |
| Cx1 | 13.57 | 12.89 | ER | 6.54 | 0.65 |
| W | 0.10 | 0.31 | EB | 6.62 | 0.44 |
| K | 0.24 | 0.42 | ERI | 6.19 | 0.75 |
| BG | 0.94 | 0.21 | EBI | 6.80 | 0.47 |
| CRG | 0.01 | 0.14 | F1 | 7361.83 | 22,929.7 |
| CGB | 0.94 | 0.05 | F2 | 0.08 | 0.17 |
| CBR | 0.95 | 0.09 | F3 | 0.52 | 0.39 |
| CRK | 0.85 | 0.10 | F4 | 0.06 | 0.43 |
| CGK | 0.99 | 0.05 | F5 | 0.14 | 0.16 |
| CBK | 0.94 | 0.06 | |||
| CRGI | 0.93 | 0.05 | |||
| CBRI | 0.86 | 0.10 | |||
| VR | 1032.02 | 832.46 | |||
| VG | 1032.52 | 702.47 | |||
| VK | 974.10 | 652.87 |
| Set-Up | SE (%) | SP (%) | ACC (%) |
|---|---|---|---|
| 90.4 | 82.7 | 83.5 | |
| 88.8 | 92.8 | 91.9 | |
| 78.7 | 85.4 | 84.4 | |
| 88.7 | 84.2 | 86.5 | |
| 95.6 | 95.1 | 95.3 |
| Dataset | SE (%) | SP (%) | ACC (%) |
|---|---|---|---|
| PH2 | 95.6 | 95.1 | 95.3 |
| ISBI 2016 + 2017 | 83.4 | 93.7 | 85.4 |
| Combined | 83.8 | 88.3 | 86 |
| Dataset | SE (%) | SP (%) | ACC (%) |
|---|---|---|---|
| ISBI on PH2 | 80.5 | 81.5 | 80.7 |
| PH2 on ISBI | 90 | 75 | 81.2 |
Publisher’s Note: MDPI stays neutral with regard to jurisdictional claims in published maps and institutional affiliations. |
© 2022 by the authors. Licensee MDPI, Basel, Switzerland. This article is an open access article distributed under the terms and conditions of the Creative Commons Attribution (CC BY) license (https://creativecommons.org/licenses/by/4.0/).
Share and Cite
Pathan, S.; Ali, T.; Vincent, S.; Nanjappa, Y.; David, R.M.; Kumar, O.P. A Dermoscopic Inspired System for Localization and Malignancy Classification of Melanocytic Lesions. Appl. Sci. 2022, 12, 4243. https://doi.org/10.3390/app12094243
Pathan S, Ali T, Vincent S, Nanjappa Y, David RM, Kumar OP. A Dermoscopic Inspired System for Localization and Malignancy Classification of Melanocytic Lesions. Applied Sciences. 2022; 12(9):4243. https://doi.org/10.3390/app12094243
Chicago/Turabian StylePathan, Sameena, Tanweer Ali, Shweta Vincent, Yashwanth Nanjappa, Rajiv Mohan David, and Om Prakash Kumar. 2022. "A Dermoscopic Inspired System for Localization and Malignancy Classification of Melanocytic Lesions" Applied Sciences 12, no. 9: 4243. https://doi.org/10.3390/app12094243
APA StylePathan, S., Ali, T., Vincent, S., Nanjappa, Y., David, R. M., & Kumar, O. P. (2022). A Dermoscopic Inspired System for Localization and Malignancy Classification of Melanocytic Lesions. Applied Sciences, 12(9), 4243. https://doi.org/10.3390/app12094243