Abstract
The spread of emerging self-limiting infectious diseases is closely related to medical resources. This paper introduces the concept of safe medical resources, i.e., the minimum medical resources that are needed to prevent the overburden of medical resources, and explores the impacts of medical resources on the spread of emerging self-limiting infectious diseases. The results showed that when the isolation rate of hospitalized patients who have mild infections is low, increasing the isolation rate of patients with severe infections requires safe more medical resources. On the contrary, when the isolation rate of hospitalized patients with mild infections is at a high level, increasing the isolation rate of patients with severe infections results in a decrease in safe medical resources. Furthermore, when the isolation rates of patients with mild and severe infections increase simultaneously, safe medical resources decrease gradually. That is to say, when the medical resources are at a low level, it is more necessary to improve the isolation rates of infected individuals so as to avoid the phenomenon of overburdened medical resources and control the spread of emerging infectious diseases. In addition, overwhelmed medical resources increase the number of deaths. Meanwhile, for different emerging self-limiting infectious diseases, as long as the recovery periods are the same, safe medical resources also remain the same.
1. Introduction
For some emerging infectious diseases, infected individuals can be cured through self-healing after a certain period of time. Such infectious diseases are called self-limiting infectious diseases. For example, hand, foot and mouth disease, chicken pox, the Zika virus, acute gastroenteritis, CHIKV, SARS, H1N1 influenza, coronavirus pneumonia, etc. [1,2,3,4,5,6,7,8,9,10,11,12,13]. The majority of patients throughout the latest outbreak of COVID-19 presented with a very mild, self-limiting viral respiratory illness. The statistics indicate that the average recovery period for mildly and moderately infected individuals is days and that the average recovery period for severely infected individuals is days or 2–3 weeks [14,15,16].
In the event of an emerging epidemic, vaccines are unlikely to be available in the short term and so, it could pose a great challenge to the susceptible population, medical resources and medical staff. For example, the H1N1 influenza has a severe impact on the weakest and oldest among the population. This is associated with a higher number of winter hospitalizations, an increased death rate and severe disruptions to routine health services. When the number of severely infected individuals increases and there are insufficient medical resources, the death rate can soar [17,18,19,20,21,22]. The ongoing outbreak of COVID-19 in 2019 has posed a huge challenge to human life and livelihoods. The existing literature has mainly used mathematical models to predict the incidence levels of COVID-19, the trend of spread, the peak times and the impacts of control measures on the pandemic [23,24,25,26,27,28,29]. These models usually assume that the population is well mixed. As the results of these models are sensitive to initial values and assumptions, there are wide variations between models, especially in the estimates of the basic regeneration number (the number of people infected per infected person within a susceptible population), which suggest that somewhere between 25% and 70% of the population will eventually become infected. The GEP model that was proposed by Salgotra et al. can serve as a benchmark for time series prediction. The model results showed that only strict lockdown measures and social distancing restrictions could effectively control and contain the pandemic [30]. The data in these models also require a lot of information for training [31]. As of 14 April 2022, there have been 500,186,525 cumulative COVID-19 cases and more than 6,190,349 cumulative deaths that were related to COVID-19 globally and it is still in the pandemic phase, with more than 900,000 new cases per day [32]. During this emerging infectious disease pandemic, there have been growing concerns about the adequacy of resources for the treatment of infected individuals due to the limited protective efficacy of the vaccines and the limited availability of vaccination resources. Hospital beds, ICUs and ventilators are essential for the treatment of severely infected individuals and the number of ICU beds that were required at the peak of the pandemic exceeded current capacity. In the absence of self-isolation, twice as many ICU beds were needed at the peak of the COVID-19 pandemic [33,34]. Pan et al. established differential equations to discuss the impacts of isolation rates in hospitals and the timing of the implementation of control measures on the development of the pandemic for mildly and severely infected individuals [35]. COVID-19 is a serious threat to healthcare resources, which reduces the availability of personal protective equipment and limits the use of N95 respirators [36,37]. Zhang et al. found that the provision of medical resources, including the reallocation of acute care beds and the rapid construction of new hospitals, could control the spread of the pandemic [38]. Based on a series of scenarios in the early stages of the pandemic, Wood et al. used a time-driven simulation model to estimate the impact of the selective waiting of the healthcare system in England on the pandemic [34]. Wirawan et al. believed that the treatment of infected individuals should be strengthened to maximize the improvement of the healthcare system in Paris [39]. Bartsch et al. developed a Monte Carlo simulation model to estimate the resource usage and direct healthcare costs for infected individuals with each symptom. If 80% of the U.S. population were infected, the result could be 44.6 million hospitalizations, 10.7 million intensive care unit (ICU) admissions, 6.5 million patients on ventilators, 249.5 million occupied hospital beds and USD 654 billion in direct medical costs [40]. Ferguson et al. found that under an optimistic ICU demand scenario, the increase in general ward and ICU beds would be at least eight times greater. Moreover, even if all of the infected individuals were treated, it is predicted that 250,000 people would die in the UK and 1.1–1.2 million people would die in the US from COVID-19 [24]. The current omicron strain of COVID-19 has a stronger transmission rate and COVID-19 continues to place long-term pressure on healthcare systems and resources due to the limited protective efficacy of the vaccines. Therefore, it is of great significance to study the influence of medical resources on the spread of emerging self-limiting infectious diseases.
2. Model
According to the classical compartment model of infectious diseases, the total population of an area is assumed to be N, the individuals within a population who can be classified susceptible is S, the number of exposed individuals is E, the number of mildly infected individuals is , the number of severely infected individuals is , the number of hospitalized and isolated patients with mild infections is , the number of hospitalized and isolated patients with severe infections is , the number of recovered cases is R and the death rate is D. In this study, it was assumed that the population was well mixed and had a fixed number of individuals and the vaccination of susceptible individuals was not considered. The probability of susceptible individuals becoming infected is independent of their age, gender, etc. This paper only considered contact infection, not immune loss. It was also supposed that the susceptible individuals would be infected with a probability of after contact with mildly or severely infected individuals. The decreasing proportion of infectivity during the incubation period was assumed to be and the incidence rate of exposed individuals was . When exposed individuals showed symptoms, they had a probability of q of becoming mildly infected or a probability of of becoming severely infected. and represent the isolation rates of hospitalized mildly and severely infected individuals, respectively. The model parameters are shown in Table 1 and the transformation relationship of populations is shown in Figure 1.

Table 1.
Descriptions of the variables and parameters.
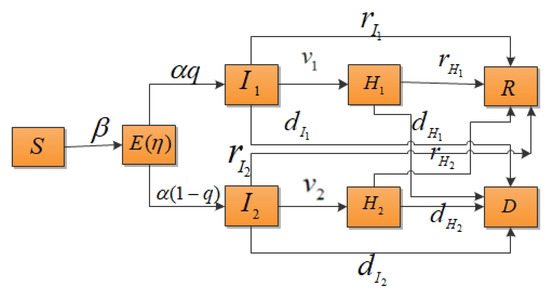
Figure 1.
Compartment model of infectious disease transmission considering the isolation of hospitalized mildly and severely infected individuals.
When considering emerging self-limiting infectious diseases, we let the sum of the time from the onset of the disease to self-healing and the time from the onset of the disease to death for mildly and severely infected individuals be and , respectively. The sum of the time from isolation to self-healing and the time from isolation to death for mildly and severely hospitalized isolated were and , respectively. According to the characteristics of emerging self-limiting infectious diseases, it could be assumed that , , and . Based on the above transformation diagram, a differential equation model could be established as follows:
.
3. Results
The term “medical resources” in this paper refers to the number of hospital beds that can be used to treat severely infected individuals per unit time, which is denoted as M. It was assumed that the recovery period of an emerging self-limiting infectious disease is relatively fixed for mildly and severely infected individuals and is not affected by medical resources. So, for the convenience of analysis, we let and . Assuming that the mildly infected and hospitalized mildly infected individuals who were isolated could always be cured, then , and . It was assumed that severely infected individuals outside of the hospital environment would die if they did not receive prompt treatment, so and . The cure rate and mortality rate of hospitalized severely infected individuals who were isolated were satisfied by , where denotes the cure characteristics of infectious diseases under the condition of adequate medical resources. Different k values can be understood as different infectious diseases with the same recovery period. In what follows, we used model (1) to study the impacts of the isolation rates of hospitalized mildly and severely infected individuals on the emerging infectious diseases. Taking the parameters and , the evolution results of the population are presented in Figure 2a, where and medical resources are sufficient (). The evolution results of isolated mildly and severely infected individuals are shown in Figure 2b, where .
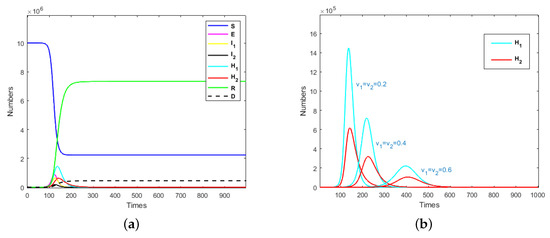
Figure 2.
(a) Evolution results of the population when and ; (b) evolution results of isolated mildly and severely infected individuals when .
It can be seen from Figure 2a that an exposed individual could cause an outbreak of an infectious disease in a short time. Nearly 80% of susceptible individuals would be infected when medical resources are adequate. After the system stabilizes, the ratio of recovered cases to deaths would be about 17:1.
In Figure 2b, it can be seen that with the increase in isolation rate, the peak time of isolated mildly and severely individuals would be delayed and the peak would also decrease with the increase in isolation rate. This means that in the event of an emerging infectious disease pandemic, a rapid increase in isolation rates could reduce the number of infected individuals and thus, reduce the number of isolated individuals. When the peak time of isolated individuals is delayed, more time could be devoted to the replenishment of quarantined resources and medical resources. This also indicates that when developing prevention and control strategies for emerging infectious diseases, the isolation rate should be raised to a higher level; then, the total required quarantined and medical resources would be significantly reduced.
When the number of hospitalized and isolated severely infected individuals is less than M, the cure rate would be determined by the recovery period of the self-limiting infectious disease. When the number of hospitalized and isolated severely infected individuals is greater than M, the cure rate would decrease to and the mortality rate would be . The evolution results of the number of recovered cases and deaths when , under the above parameters, are shown in Figure 3.
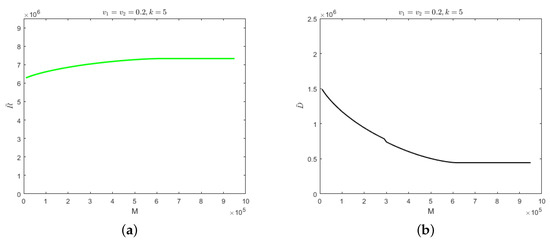
Figure 3.
(a) Evolution results of the recovered cases when the medical resources is . (b) Evolution results of the deaths when the medical resources is .
As can be seen from Figure 3, the number of recovered cases would increase with the increase in medical resources and the number of deaths would decrease gradually. When the medical resources value is , the number of recovered cases would reach its maximum and stabilize whereas the number of deaths would reach its minimum and stabilize. Further increases in medical resources would have no effect on the number of recovered cases or the number of deaths. This indicates that when medical resources are greater than , they would be sufficient for the treatment of patients. The numbers of recovered cases and deaths would be determined by the characteristics of each specific infectious disease. When the medical resources are less than , the reduction in medical resources would result in fewer recovered cases and more deaths. Due to overburdened medical resources, patients would not receive timely treatment. In this paper, the minimum amount of medical resources at which medical resources would not be overwhelmed is called “safe medical resources”, which is denoted as .
For self-limiting infectious diseases, the sum of the numbers of recovered cases and deaths is constant; so, the influence of the parameters and M on the number of deaths is considered below. First of all, we considered the case in which the isolation rates of hospitalized mildly and severely infected individuals were the same, i.e., . We let and Figure 4 shows the evolution results of the number of deaths according to medical resources at the different isolation rates of hospitalized individuals and the evolution results of safe medical resources according to those isolation rates.
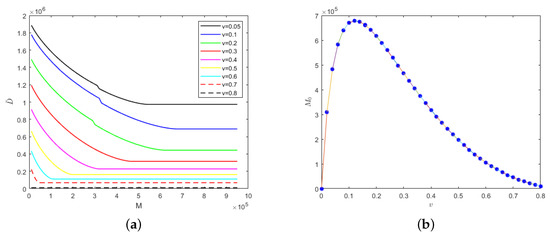
Figure 4.
With the fixed parameter : (a) evolution results of the number of deaths according to medical resources at the different isolation rates of hospitalized individuals; (b) evolution results of safe medical resources according to those isolation rates.
In Figure 4a, the greater the isolation rates of hospitalized mildly and severely infected individuals, the fewer the deaths. When the isolation rate is fixed, the number of deaths would decrease gradually with the increase in medical resources and when the medical resources increase to a certain value, the number of deaths would remain unchanged. This is because when the medical resources are few, they would be overwhelmed and when the medical resources reach the safe value, the timely treatment of hospitalized and isolated individuals would be guaranteed, which would result in the number of deaths remaining unchanged. Interestingly, safe medical resources are non-monotonic in relation to the isolation rates of hospitalized individuals, as shown in Figure 4b. When the isolation rate of hospitalized individuals is less than 0.12, the safe medical resources would increase with the increase in isolation rate. However, when the isolation rate of hospitalized individuals is greater than 0.12, the safe medical resources would begin to decrease gradually. In other words, the fewer medical resources there are, the more necessary it would be to increase the isolation rate of hospitalized individuals so that medical resources would not be overwhelmed.
Secondly, we considered the situation in which the isolation rate of hospitalized mildly infected individuals was not as same as the isolation rate of hospitalized severely infected individuals. The relationship between safe medical resources and the isolation rate of hospitalized severely infected individuals and the evolution results of the number of deaths in regard to medical resources for different isolation rates of severely infected individuals are shown in Figure 5, where the isolation rate of hospitalized mildly infected individuals is 0.1 and 0.4.
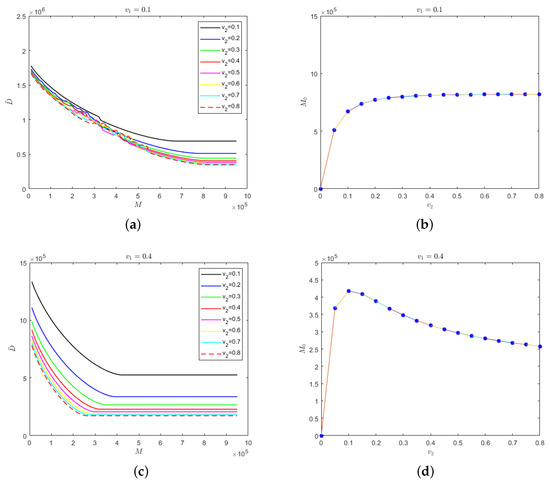
Figure 5.
(a) Evolution results of the number of deaths in regard to the medical resources for different isolation rates of hospitalized severely infected individuals when the isolation rate of hospitalized mildly infected individuals is 0.1; (b) the relationship between safe medical resources and the isolation rate of hospitalized severely infected individuals when the isolation rate of hospitalized mildly infected individuals is 0.1; (c) evolution results of the number of deaths in regard to the medical resources for different isolation rates of hospitalized severely infected individuals when the isolation rate of hospitalized mildly infected individuals is 0.4; (d) the relationship between safe medical resources and the isolation rate of hospitalized severely infected individuals when the isolation rate of hospitalized mildly infected individuals is 0.4.
In Figure 5a, the isolation rate of hospitalized mildly infected individuals is small. When medical resources are insufficient, an increase in the isolation rate of the hospitalized severely infected individuals would have a small influence on the final number of deaths; however, when medical resources are sufficient, the final number of deaths would be strongly influenced by the isolation rate of hospitalized severely infected individuals. The higher the isolation rate of hospitalized severely infected individuals, the fewer the deaths. For different isolation rates of severely infected individuals, there would be different values for safe medical resources to ensure that the number of deaths would not change and the medical resources would not be overwhelmed. As shown in Figure 5b, the value of safe medical resources would increase gradually with the increase in the isolation rate of hospitalized severely infected individuals. However, there would be no significant difference in the value of safe medical resources when the isolation rate of hospitalized severely infected individuals is high. Figure 5c shows that when , the isolation rate of hospitalized severely infected individuals would have a greater impact on the number of deaths, regardless of the value for safe medical resources. In Figure 5d shows that when the isolation rate of hospitalized severely infected individuals is greater than 0.1, the value for safe medical resources would decrease monotonically.
The evolution results of the number of deaths in regard to medical resources for different isolation rates of hospitalized mildly infected individuals and the relationship between safe medical resources and the isolation rate of hospitalized mildly infected individuals are shown in Figure 6, where the isolation rate of hospitalized severely infected individuals is 0.1 and 0.6.
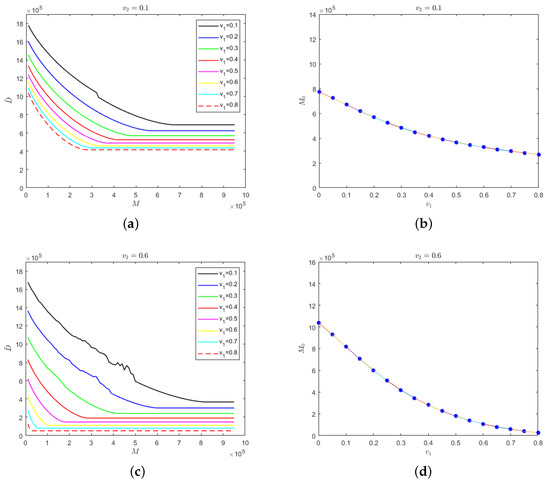
Figure 6.
(a) Evolution results of the number of deaths in regard to the medical resources for different isolation rates of hospitalized mildly infected individuals when the isolation rate of hospitalized severely infected individuals is 0.1; (b) the relationship between safe medical resources and the isolation rate of hospitalized mildly infected individuals when the isolation rate of hospitalized severely infected individuals is 0.1; (c) evolution results of the number of deaths in regard to the medical resources for different isolation rates of hospitalized mildly infected individuals when the isolation rate of hospitalized severely infected individuals is 0.6; (d) the relationship between safe medical resources and the isolation rate of hospitalized mildly infected individuals when the isolation rate of hospitalized severely infected individuals is 0.6.
The results that are presented in Figure 6a,c are relatively similar. When the isolation rate of hospitalized severely infected individuals is fixed at a certain level and when medical resources increase to the value of safe medical resources, the number of deaths would remain stable. Meanwhile, the greater the isolation rate of hospitalized mildly infected individuals, the fewer the deaths. In Figure 6b,d, it can be seen that regardless of whether the isolation rate of hospitalized severely infected individuals is at a low or high level, the value of safe medical resources would decrease with the increase in the isolation rate of hospitalized mildly infected individuals. This conclusion has a strong practical significance, which illustrates the effectiveness of establishing mobile “cabin” hospitals to treat mildly infected individuals to inhibit the spread of COVID-19.
We also considered the relationship between k and medical resources when the isolation rates of hospitalized mildly and severely infected individuals were fixed at the same level, i.e., , as shown in Figure 7.
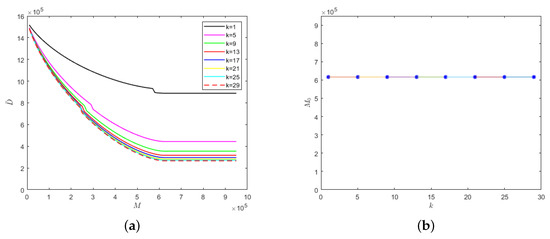
Figure 7.
With the fixed parameter : (a) evolution results of the number of deaths in regard to medical resources; (b) the relationship between safe medical resources and the k value.
The lower the k value, the lower the cure rate and the greater the mortality rate of the hospitalized and isolated severely infected individuals. Therefore, the number of deaths would increase with the decrease in the k value, as shown in Figure 7a. Similarly, there would be different safe medical resource values for different k values. When the medical resources exceed the safe medical resource value, the number of deaths would no longer decrease but would stabilize. As can be seen from Figure 7b, when the recovery periods of different emerging infectious diseases are the same, then the safe medical resource values would also be the same. Therefore, for different emerging infectious diseases, the phenomenon of overwhelmed medical resources could be avoided when the value of M reaches the value of safe medical resources, which would provide theoretical support for medical institutions to reasonably allocate resources and be able to treat patients in time.
4. Conclusions
This paper studied the impacts of medical resources on emerging self-limiting infectious diseases and performed a numerical analysis using the SEIHR model. The results showed that for emerging self-limiting infectious diseases, ensuring a safe amount of medical resources could effectively deal with the outbreak of infectious diseases and reduce the number of deaths. When the isolation rate of hospitalized mildly infected individuals is small, the value for safe medical resources would increase with the increase in the isolation rate of hospitalized severely infected individuals. On the contrary, when the isolation rate of hospitalized mildly infected individuals is high, the value for safe medical resources would decrease with the increase in the isolation rate of hospitalized severely infected individuals. When the isolation rates of hospitalized severely infected individuals are at different levels, increasing the isolation rate of hospitalized mildly infected individuals would significantly reduce the value for safe medical resources.
In conclusion, the isolation rates for hospitalized mildly and severely infected individuals should be increased, even with fewer medical resources. For the COVID-19 pandemic, the initial toxic strain has evolved into the faster spreading omicron strain. The protective effectiveness of the vaccines decreases over time. Most people are still at risk and many people who become infected have no symptoms but are still contagious. The results provided in this paper have a certain practical significance for guiding pandemic prevention and control measures. For example, the establishment of special isolation points and makeshift hospitals, the improvement in the frequency and scope of screening tests and the isolation of asymptomatic and mildly infected individuals could effectively control the spread of a pandemic and decrease the number of infected individuals, thus greatly reducing the risk of death among the elderly and children.
In this paper, a differential equation model was established that was based on the compartment theory under the condition of a well-mixed population and the effects of isolation rates on medical resources was discussed in terms of the simulation results. The mathematical theories of the basic regeneration number, the stability of the disease-free equilibrium point and the local and global stability of the model could be further discussed. In addition, this paper only considered the spreading process of emerging self-limiting infectious diseases under different isolation rates of hospitalized mildly and severely infected individuals. Most of the parameters that were set in this paper were assumed values. Specific patient data and the protective effects of the vaccines, as well as the rules of transmission based on network transmission, were not involved, but would be worth further discussion.
Author Contributions
Conceptualization, D.Z. and L.G.; methodology, M.H.; software, D.Z.; writing—original draft preparation, D.Z. and L.G.; writing—review and editing, D.Z. and L.G.; formal analysis, Q.P. All authors have read and agreed to the published version of the manuscript.
Funding
This research received no external funding.
Institutional Review Board Statement
Not applicable.
Informed Consent Statement
Informed consent was obtained from all subjects who were involved in this study.
Data Availability Statement
Not applicable.
Conflicts of Interest
The authors declare no conflict of interest.
References
- Clementz, G.C.; Mancini, A.J. Nail Matrix Arrest Following Hand-Foot-Mouth Disease: A Report of Five Children. Pediatr. Dermatol. 2000, 17, 7–11. [Google Scholar] [CrossRef] [PubMed]
- Ke, Y.; Liu, W.; He, Z.; Liu, M.; Tan, S.Y.; Tan, Y.W.; Chan, X.Y.; Fan, Y.; Huang, E.K.; Chen, H.; et al. Enterovirus A71 Infection Activates Human Immune Responses and Induces Pathological Changes in Humanized Mice. J. Virol. 2019, 93, e01066. [Google Scholar] [CrossRef] [PubMed]
- Zhang, C.; Chen, S.; Zhou, G.; Jin, Y.; Zhang, R.; Yang, H.; Xi, Y.; Ren, J.; Duan, G. Involvement of the renin-angiotensin system in the progression of severe hand-foot-and-mouth disease. PLoS ONE 2018, 13, e0197861. [Google Scholar]
- Sakkas, H.; Bozidis, P.; Franks, A.; Papadopoulou, C. Oropouche Fever: A Review. Viruses 2018, 10, 175. [Google Scholar] [CrossRef]
- Al-Turab, M.; Chehadeh, W. Varicella infection in the Middle East: Prevalence, complications, and vaccination. J. Res. Med. Sci. 2018, 23, 19. [Google Scholar] [CrossRef]
- Cohen, J.I.; Brunell, P.A.; Straus, S.E.; Krause, P.R. Recent Advances in Varicella-Zoster Virus Infection. Ann. Intern. Med. 1999, 130, 922–932. [Google Scholar] [CrossRef]
- Caian, L.V.; María, B.A.; Breno, L.; Oliveira, J.V.; Santos, C.S.; Calcagno, J.I.; Carvalho, T.X.; Giovanetti, M.; Alcantara, L.C.J.; de Siqueira, I.C.; et al. Newborns with Zika Virus-Associated Microcephaly Exhibit Marked Systemic Inflammatory Imbalance. J. Infect. Dis. 2020, 222, 670–680. [Google Scholar]
- Maslow, J. Zika Vaccine Development-Current Progress and Challenges for the Future. Trop. Med. Infect. Dis. 2019, 4, 104. [Google Scholar] [CrossRef]
- Liu, Z.; Shi, W.; Qin, C. The evolution of Zika virus from Asia to the Americas. Nat. Rev. Microbiol. 2019, 17, 131–139. [Google Scholar] [CrossRef]
- Rushton, S.; Sanderson, R.; Reid, W.D.K.; Shirley, M.D.F.; Harris, J.P.; Hunter, P.R.; O’Brien, S.J. Transmission routes of rare seasonal diseases: The case of norovirus infections. Philos. Trans. R. Soc. B Biol. Sci. 2019, 374, 20180267. [Google Scholar] [CrossRef]
- Cunha, M.; Costa, P.; Correa, I.; de Souza, M.R.M.; Calil, P.T.; da Silva, G.P.D.; Costa, S.M.; Fonseca, V.W.P.; da Costa, L.J. Chikungunya Virus: An Emergent Arbovirus to the South American Continent and a Continuous Threat to the World. Front. Microbiol. 2020, 11, 1297. [Google Scholar] [CrossRef] [PubMed]
- Blumental, S.; Huisman, E.; Cornet, M.C.; Ferreiro, C.; Schutter, I.D.; Reynders, M.; Wybo, I.; Kabamba-Mukadi, B.; Armano, R.; Hermans, D.; et al. Pandemic A/H1N1v influenza 2009 in hospitalized children: A multicenter Belgian survey. BMC Infect. Dis. 2011, 11, 313. [Google Scholar] [CrossRef] [PubMed]
- Stukel, T.A.; Schull, M.J.; Guttmann, A.; Alter, D.A.; Li, P.; Vermeulen, M.J.; Manuel, D.G.; Zwarenstein, M. Health impact of hospital restrictions on seriously ill hospitalized patients: Lessons from the Toronto SARS outbreak. Med. Care 2008, 46, 991–997. [Google Scholar] [CrossRef] [PubMed]
- Voinsky, I.; Baristaite, G.; Gurwitz, D. Effects of age and sex on recovery from COVID-19: Analysis of 5769 Israeli patients. J. Infect. 2020, 18, 102–103. [Google Scholar] [CrossRef]
- Riggioni, C.; Comberiati, P.; Giovannini, M. A compendium answering 150 questions on COVID-19 and SARS-CoV-2. Allergy 2020, 75, 2503–2541. [Google Scholar] [CrossRef]
- Rubulotta, F.; Soliman-Aboumarie, H.; Filbey, K.; Geldner, G.; Kuck, K.; Ganau, M.; Hemmerling, T.M. Technologies to Optimize the Care of Severe COVID-19 Patients for Health Care Providers Challenged by Limited Resources. Anesth. Analg. 2020, 131, 351–364. [Google Scholar] [CrossRef]
- Rubinson, L.; Mutter, R.; Viboud, C.; Hupert, N.; Uyeki, T.; Creanga, A.; Finelli, L.; Iwashyna, T.J.; Carr, B.; Merchant, R.; et al. Impact of the fall 2009 influenza A(H1N1)pdm09 pandemic on US hospitals. Med. Care 2013, 51, 259–265. [Google Scholar] [CrossRef]
- Quinn, S.C.; Kumar, S.; Freimuth, V.S.; Musa, D.; Casteneda-Angarita, N.; Kidwell, K. Racial Disparities in Exposure, Susceptibility, and Access to Health Care in the US H1N1 Influenza Pandemic. Am. J. Public Health 2011, 101, 285–293. [Google Scholar] [CrossRef]
- Adeniji, K.A.; Cusack, R. The Simple Triage Scoring System (STSS) successfully predicts mortality and critical care resource utilization in H1N1 pandemic flu: A retrospective analysis. Crit. Care 2011, 15, R39. [Google Scholar] [CrossRef]
- Nuno, M.; Reichert, T.A.; Chowell, G. Protecting residential care facilities from pandemic influenza. Proc. Natl. Acad. Sci. USA 2008, 105, 10625–10630. [Google Scholar] [CrossRef]
- Mody, L.; Langa, K.M.; Malani, P.N. Impact of the 2004-2005 Influenza Vaccine Shortage on Immunization Practices in Long-Term Care Facilities. Infect. Control Hosp. Epidemiol. 2006, 27, 383–387. [Google Scholar] [CrossRef] [PubMed][Green Version]
- Fleming, D.M.; Elliot, A.J. The impact of influenza on the health and health care utilisation of elderly people. Vaccine 2005, 23, S1–S9. [Google Scholar] [CrossRef] [PubMed]
- Li, R.; Pei, S.; Chen, B.; Song, Y.; Zhang, T.; Yang, W.; Shaman, J. Substantial undocumented infection facilitates the rapid dissemination of novel coronavirus (SARS-CoV2). Science 2020, 368, 489–493. [Google Scholar] [CrossRef] [PubMed]
- Ferguson, N.M.; Laydon, D.; Nedjati-Gilani, G.; Imai, N.; Ainslie, K.; Baguelin, M.; Bhatia, S.; Boonyasiri, A.; Cucunubá, Z.; Cuomo-Dannenburg, G.; et al. Impact of Non-Pharmaceutical Interventions (NPIs) to Reduce COVID-19 Mortality and Healthcare Demand; Imperial College London COVID-19 Response Team: London, UK, 2020; pp. 1–20. [Google Scholar]
- Binti Hamza, F.; Lau, C.; Nazri, H.; Ligot, D.V.; Lee, G.; Tan, C.L.; Shaib, M.K.B.M.; Zaidon, U.H.; Abdullah, A.B.; Chun, M.H.; et al. CoronaTracker: World-wide COVID-19 Outbreak Data Analysis and Prediction. Bull. World Health Organ. 2020, 1, 1–33. [Google Scholar] [CrossRef]
- Tsai, T.C.; Jacobson, B.; Jha, A.K. American hospital capacity and projected need for COVID-19 patient care. Health Affairs, 17 March 2020. [Google Scholar]
- Kucharski, A.J.; Russell, T.W.; Diamond, C.; Liu, Y.; CMMID nCoV Working Group; Edmunds, J.; Funk, S.; Eggo, R.M. Early dynamics of transmission and control of COVID-19: A mathematical modelling study. Lancet Infect. Dis. 2020, 20, 553–558. [Google Scholar] [CrossRef]
- Wu, J.T.; Leung, K.; Leung, G.M. Nowcasting and forecasting the potential domestic and international spread of the 2019-nCoV outbreak originating in Wuhan, China: A modelling study. Lancet 2020, 395, 689–697. [Google Scholar] [CrossRef]
- Alanazi, S.A.; Kamruzzaman, M.M.; Alruwaili, M.; Alshammari, N.; Alqahtani, S.A.; Karime, A. Measuring and Preventing COVID-19 Using the SIR Model and Machine Learning in Smart Health Care. J. Healthc. Eng. 2020, 4, 1–12. [Google Scholar] [CrossRef]
- Salgotra, R.; Gandomi, M.; Gandomi, A.H. Time Series Analysis and Forecast of the COVID-19 Pandemic in India using Genetic Programming. Chaos Solitons Fractals 2020, 138, 109945. [Google Scholar] [CrossRef]
- Chin, V.; Samia, N.; Marchant, R.; Rosen, O.; Ioannidis, J.P.A.; Tanner, M.A.; Cripps, S. A case study in model failure? COVID-19 daily deaths and ICU bed utilisation predictions in New York state. Eur. J. Epidemiol. 2020, 35, 733–742. [Google Scholar] [CrossRef]
- WHO Coronavirus Disease (COVID-19) Dashboard. Available online: https://covid19.who.int/ (accessed on 14 April 2022).
- Bardi, T.; Gomez-Rojo, M.; Candela-Toha, A.M.; de Pablo, R.; Martinez, R.; Pestañaa, D. Rapid response to COVID-19, escalation and de-escalation strategies to match surge capacity of Intensive Care beds to a large scale epidemic. Rev. Esp. Anestesiol. Reanim. 2021, 68, 21–27. [Google Scholar] [CrossRef]
- Wood, R. Modelling the impact of COVID-19 on elective waiting times. J. Simul. 2022, 16, 101–109. [Google Scholar] [CrossRef]
- Pan, Q.H.; Gao, T.; He, M.F. Influence of isolation measures for patients with mild symptoms on the spread of COVID-19. Chaos Solitons Fractals 2020, 139, 110022. [Google Scholar] [CrossRef] [PubMed]
- Chien, L.C.; Bey, C.K.; Koenig, K.L. A Positive-Pressure Environment Disposable Shield (PEDS) for COVID-19 Health Care Worker Protection. Prehosp. Disaster Med. 2020, 35, 434–437. [Google Scholar] [CrossRef] [PubMed]
- Gibson, C.; Ventura, C.; Collier, G.D. Emergency Medical Services resource capacity and competency amid COVID-19 in the United States: Preliminary findings from a national survey. Heliyon 2020, 6, e05409. [Google Scholar] [CrossRef]
- Zhang, Z.Q.; Yao, W.; Wang, Y.; Long, C.; Fu, X. Wuhan and Hubei COVID-19 mortality analysis reveals the critical role of timely supply of medical resources. J. Infect. 2020, 81, 170–172. [Google Scholar] [CrossRef]
- Wirawan, I.; Januraga, P. Forecasting COVID-19 Transmission and Healthcare Capacity in Bali, Indonesia. J. Prev. Med. Public Health 2020, 53, 158–163. [Google Scholar] [CrossRef]
- Bartsch, S.M.; Ferguson, M.C.; McKinnell, J.A.; O’Shea, K.J.; Wedlock, P.T.; Siegmund, S.S.; Lee, B.Y. The Potential Health Care Costs and Resource Use Associated with COVID-19 In The United States. Health Aff. 2020, 39, 927–935. [Google Scholar] [CrossRef]


Publisher’s Note: MDPI stays neutral with regard to jurisdictional claims in published maps and institutional affiliations. |
© 2022 by the authors. Licensee MDPI, Basel, Switzerland. This article is an open access article distributed under the terms and conditions of the Creative Commons Attribution (CC BY) license (https://creativecommons.org/licenses/by/4.0/).