Abstract
Hypertension is a major cause of mortality of millions of people worldwide. Cerebral vascular changes are clinically observed to precede the onset of hypertension. The early detection and quantification of these cerebral changes would help greatly in the early prediction of the disease. Hence, preparing appropriate medical plans to avoid the disease and mitigate any adverse events. This study aims to investigate whether studying the cerebral changes in specific regions of human brains (specifically, the anterior, and the posterior compartments) separately, would increase the accuracy of hypertension prediction compared to studying the vascular changes occurring over the entire brain’s vasculature. This was achieved by proposing a computer-aided diagnosis system (CAD) to predict hypertension based on cerebral vascular changes that occur at the anterior compartment, the posterior compartment, and the whole brain separately, and comparing corresponding prediction accuracy. The proposed CAD system works in the following sequence: (1) an MRA dataset of 72 subjects was preprocessed to enhance MRA image quality, increase homogeneity, and remove noise artifacts. (2) each MRA scan was then segmented using an automatic adaptive local segmentation algorithm. (3) the segmented vascular tree was then processed to extract and quantify hypertension descriptive vascular features (blood vessels’ diameters and tortuosity indices) the change of which has been recorded over the time span of the 2-year study. (4) a classification module used these descriptive features along with corresponding differences in blood pressure readings for each subject, to analyze the accuracy of predicting hypertension by examining vascular changes in the anterior, the posterior, and the whole brain separately. Experimental results presented evidence that studying the vascular changes that take place in specific regions of the brain, specifically the anterior compartment reported promising accuracy percentages of up to . However, studying the vascular changes occurring over the entire brain still achieve the best accuracy (of up to ) in hypertension prediction compared to studying specific compartments.
1. Introduction
Hypertension is one of the severest and most common diseases nowadays. It is considered one of the leading contributors to death worldwide [1]. Severe adverse events of hypertension include strokes, dementia, heart failure, kidney dysfunction, cognitive impairment, and vision loss [2]. According to a 2017 guideline [3], categories of hypertension are as follows: normal (<120/<80 mmHg), elevated or prehypertension (120–129/<80 mmHg), hypertension stage 1 (130–139 mmHg systolic blood pressure (BP) or 80–89 mmHg diastolic BP), and hypertension stage 2 (≥140 mmHg systolic BP or ≥90 mmHg diastolic BP). Current blood pressure diagnosis tools such as sphygmomanometers can detect the disease only after its onset. Recent studies observed that cerebral vascular changes start to develop years before the onset of hypertension [4,5]. Change in blood vessels size has been reported in the literature and linked to elevation of blood pressure in animals [6] and in humans [7]. Vascular tortuosity excess and abnormalities have been correlated to several vascular and non-vascular diseases including hypertension [8,9]. Additionally, the correlation between cerebral vascular changes and hypertension detection has been studied and validated in [10]. Thus, quantifying and tracking changes in vessels diameters and tortuosity could be used as predictors for hypertension development. Most importantly, the early detection and quantification of these cerebrovascular changes would help physicians to recommend medical protocols to control the development of the disease and hopefully to mitigate adverse events. Nevertheless, the process of extracting and quantifying these features requires the accurate segmentation of cerebral vasculature at first. This makes the extraction process a challenging task because there is a limitation of accurate cerebrovascular segmentation algorithms in the literature. The need for an automatic segmentation algorithm for the brain’s vascular system is inevitable. Vascular segmentation is a basic step in almost every medical imaging analysis system. However, segmentation of cerebral blood vessels is a very challenging task due to the complex geometry of human brains’ vasculature, the dynamic range of intensities, the density of tiny vessels, in addition to the inherent challenges in the Magnetic Resonance Angiography (MRA) scans such as noise artifacts, bias, and acquisition errors. Unfortunately, existing cerebrovascular segmentation methods suffer from limitations due to one or more of the aforementioned problems. Additionally, most algorithms are not suitable for pathological vessels because of adopted assumption of the vessel circular cross section which is only valid for healthy blood vessels. For instance, Phellan et al. [11] have proposed an automatic vascular segmentation algorithm using a deep convolutional neural network (CNN) that was able to segment cerebrovasculature with a Dice Similarity Coefficient (DSC) ranging between and . However, their algorithm was tested using MRA dataset of healthy subjects only. Zhao et al. [12] have proposed a 2-D segmentation algorithm where they first separated vessels from background using volume projection, 2-D segmentation, and back projection procedures. Then, they utilized a stochastic expectation maximization algorithm to estimate the probability density function of the remaining undetected vessels. While their method was able to detect vessels even in low-contrast images, it was computationally expensive. Feng et al. [13] have proposed a statistical analysis method to segment brain blood vessel based on vessels’ intensities. Using vessels’ intensities only in the segmentation process is not sufficient due to the wide range of intensity values, in addition to the change of vessels’ intensities according to the velocity of the blood flow. Specifically, the velocity of blood flow in vessels, particularly small ones, is slow which makes the intensity of these vessels similar to other brain tissues. Thus, some vascular details could not be detected. Besides, manual and semi-automatic segmentation methods which are the gold standards, are error-prone, time consuming, tedious, and may suffer from intra- or inter-observer variability.
The blood supply to the brain is provided by two arterial axes on each side of the neck, the internal carotid giving origin to the anterior circulation (AC) and vertebral arteries giving origin to the posterior circulation (PC). Hypertension and intracranial large artery atherosclerosis are well known risk factors for cerebrovascular diseases including both hemorrhagic and ischemic strokes [14]. Systemic hypertension is also involved in the development of aneurysms via increased shear stress and pressures on the arterial wall, and change in the shear stress gradients precipitate the aneurysms development [15]. Differential associations with vascular risk factors and stroke mechanisms have been cited between the posterior and anterior intracranial vasculatures, and pathological evidence exists that more advanced brain arterial aging is noted in the posterior circulation compared with the anterior circulation [14]. Anterior and posterior circulation (PC) strokes are reviewed as separate entities, with different underlying pathogenesis, natural histories, and potential responsiveness to interventions such as anticoagulation [16]. Also interestingly, hypertensive disease-induced primary intracerebral hemorrhage occurs mainly at the small penetrating blood vessels in the posterior cerebral circulation rather than the anterior cerebral circulation. This may be explained by the fact that the responses of the posterior cerebral blood flow (CBF) in several physiological conditions (e.g., orthostatic stress, hypoxia, dynamic resistance exercise, heat stress, etc.) are different from those of the anterior CBF and posterior cerebral vasculature may not be able to properly regulate an elevation in blood pressure compared with the anterior cerebral vasculature [17]. Another difference between the anterior and posterior circulations is that intracranial aneurysms arise from the anterior cerebral circulation more than the posterior circulation and the AC aneurysms tend to have higher risk of rupture [18]. Based on that , it is obvious that several cerebrovascular diseases have different impacts on the anterior and posterior compartments in human brains and are also affected differently by the anterior and posterior blood circulations. Thus, there is a possibility that hypertension-related cerebrovascular changes may affect one compartment more than the other. In this case, the study of cerebrovascular changes in each compartment independently may improve the clinical and prognostic value of hypertension diagnosis. In this manuscript, we present a computer-aided diagnosis (CAD) system that aims at investigating whether studying the cerebral changes in specific regions of human brains ( specifically, the anterior, and the posterior compartments) separately, would increase the accuracy of hypertension prediction compared to studying vascular changes occurring over the entire brain’s vasculature.
2. Methods
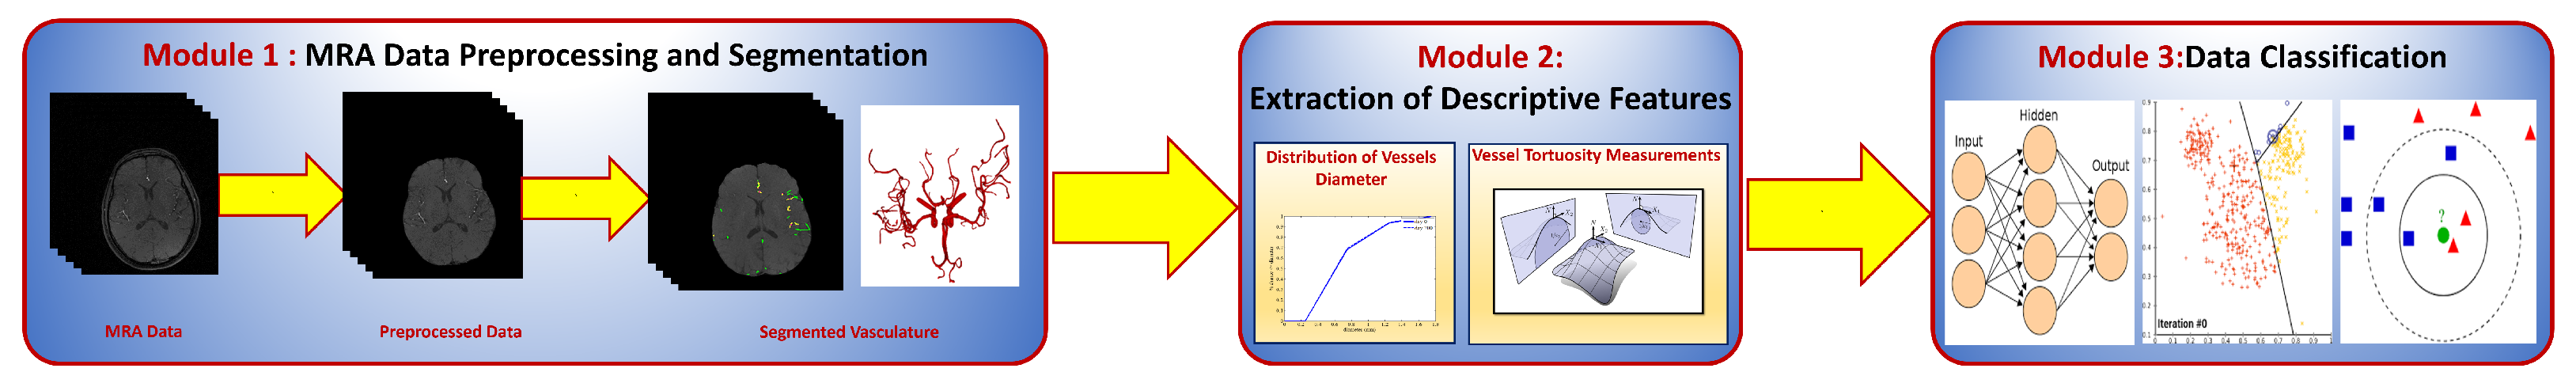
Hypertension is predicted in this study through the extraction and quantification of cerebral vascular changes occurring over a 2-year study in human brains. Descriptive hypertension-related cerebral features (explained in Section 2.2) are estimated and used to build a feature vector for each subject. Feature vectors (explained in Section 2.3) are processed by classifiers to determine whether each subject is normal, prehypertensive, or hypertensive. The ground truth actual class labels are already known for each subject, and we provide the class label for all subjects to the classifiers as well. Classifiers then process the feature vectors and decide on a predicted class label for each subject. Predicted labels are then compared to actual/real class labels and the classification accuracy is determined. The proposed CAD system for the early detection of hypertension is composed of three different modules (Figure 1).
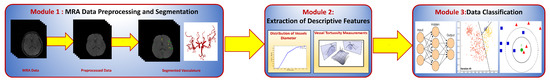
Figure 1.
A block diagram showing different modules of the proposed CAD system for classifying hypertension data.
The first module is used for preprocessing and segmenting MRA scans to delineate the cerebral vasculature of each subject. The second module quantifies and estimates the vascular features that describe the vascular changes that are observed to precede the onset of hypertension. The third module is a classification module that processes MRA data and blood pressure measurements, and reports the accuracy of hypertension prediction based on the analysis of the extracted descriptive features in different regions of human brains. In this section, the three modules of the proposed CAD system are explained in detail.
2.1. Cerebral Vasculature Segmentation
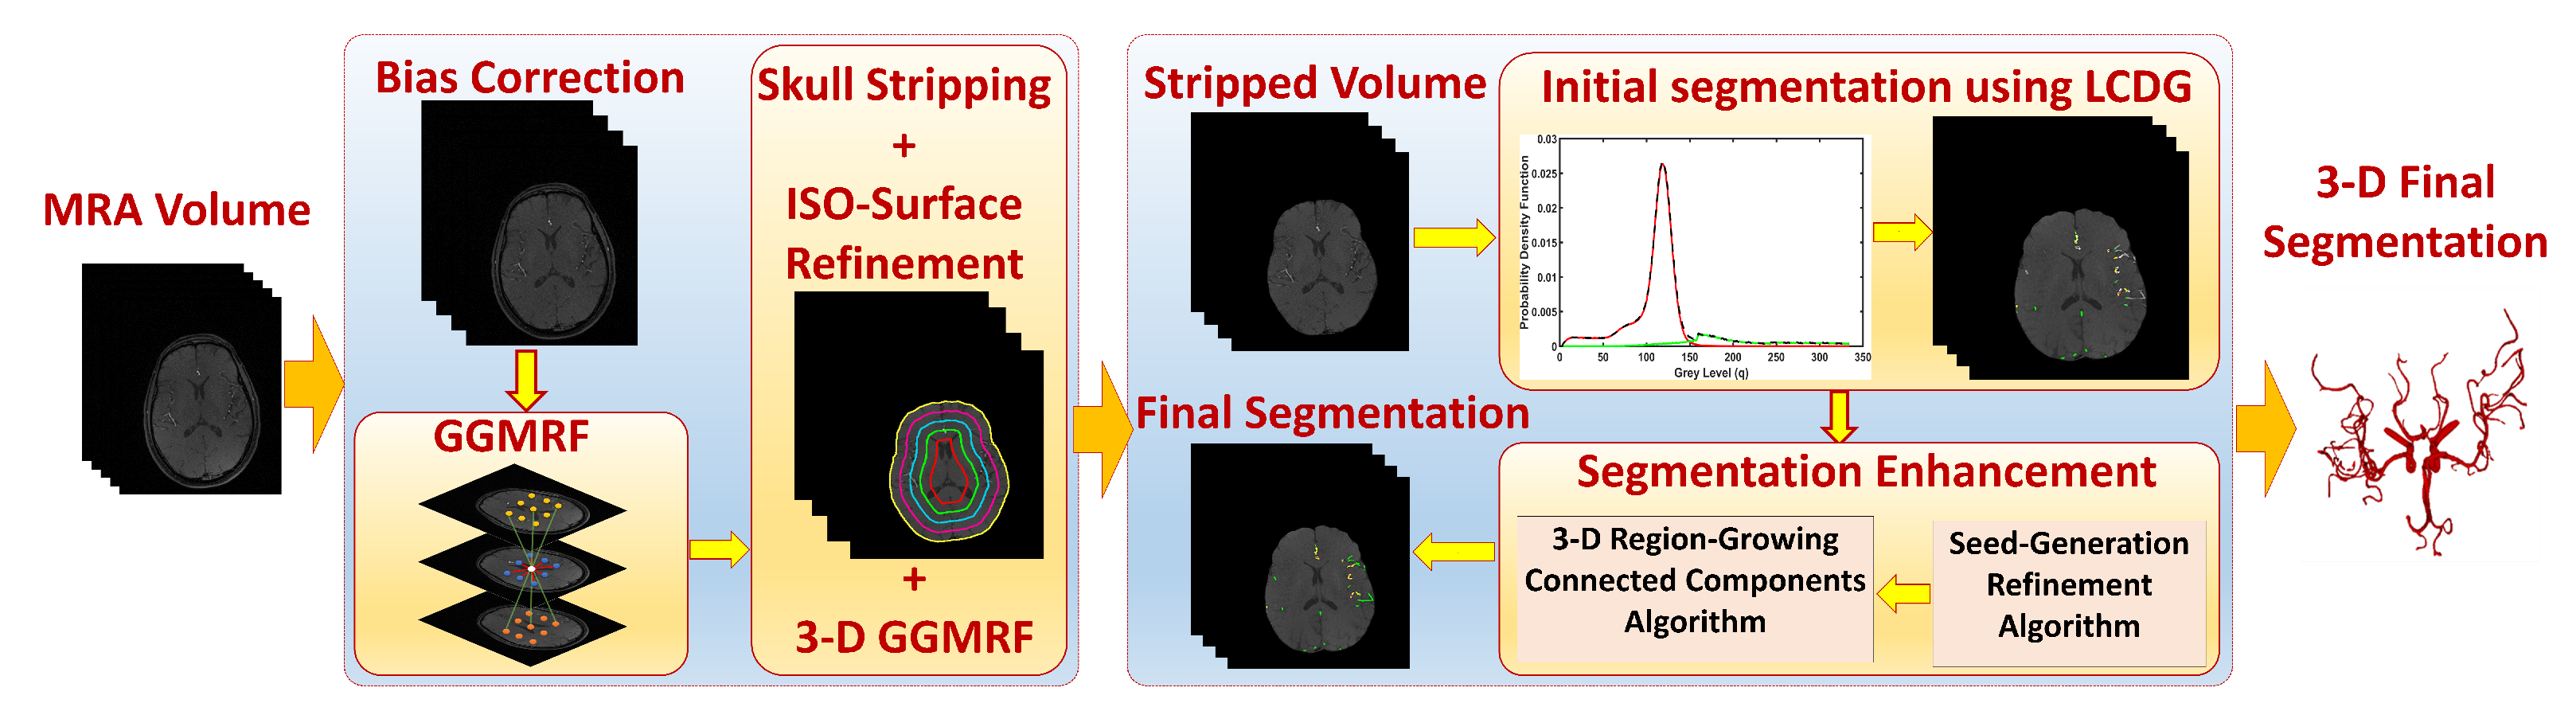
The segmentation algorithm presented in this manuscript is automatic, adaptive, and accurate in delineating cerebral vasculature [10]. As shown in Figure 2, the algorithm starts with a preprocessing step to eliminate noise artifacts such as acquisition errors and image biasing that might result from the magnetic field of the MRA scanner. In this step, a bias correction algorithm was used to resolve inconsistencies of data [19]. Then, to enhance image homogeneity, the 3D Generalized Gauss-Markov Random Field (3D GGMRF) was employed. The 3D GGMRF model analyzes the spatial homogeneous pairwise interactions between each voxel and its 26 neighborhood system and minimizes differences between the voxel and its neighbors [20]. A skull stripping approach [21] was then applied on the enhanced images to remove cerebral fat tissues that usually look like cerebral blood vessels. This approach employs a Markov-Gibbs Random Field (MGRF) model and a geometric deformable (brain iso-surface) model to preserve the topology of the cerebral vasculature during the skull stripping.
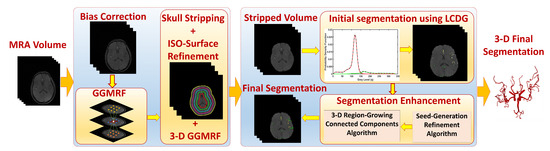
Figure 2.
Module 1: MRA data preprocessing and segmentation.
After data preprocessing, the vasculature tree was delineated in two steps. First, a Linear Combination of Discrete Gaussians (LCDG) [22] was used to produce the initial segmentation of the vascular tree by estimation of the marginal probability density of MRA voxel values for brain vessels and other cerebral tissues. This initial segmentation, however, may miss some tiny blood vessels in the vascular tree. This is why the second step in the segmentation process is very essential. In the second step, a 3D local adaptive segmentation algorithm [21] was applied to refine the initial segmented vasculature by finding any missing details, specifically the small vessels. This adaptive algorithm divides each image into a set of connected components. Then, an adaptive search window is centered over each connected component where a new threshold is calculated to separate blood vessels from other brain tissues. Cerebral segmentation using this algorithm achieved a sensitivity of , a specificity of , a dice similarity coefficient of , and an average volume difference of compared to state of the art algorithms [10]. Figure 3 and Figure 4 present an output sample of the segmentation module. Additionally, this algorithm is fully automatic and thus, it resolves the associated problems of semi-automatic and automatic segmentation methods such as time-consuming and inter-observer variability. Unlike most vascular segmentation algorithms in the literature [23], this algorithm has no constraints regarding the linearity or the circular cross-sections of blood vessels because it can segment both healthy and unhealthy blood vessels accurately and efficiently. The algorithm is also able to delineate even tiny blood vessels (≤1 mm) which makes it a very good fit in the proposed CAD system because it is clinically known that the impact of hypertension development mainly affects tiny blood vessels [24,25]. In addition, the segmentation approach overcomes and handles the noise in the MRA (e.g., microscopic, or mesoscopic noisy disturbance) images through homogeneity enhancement using the 3D GGMRF model which minimizes the energy between each voxel and its 26-neighborhood to enhance the homogeneity and remove any noise.
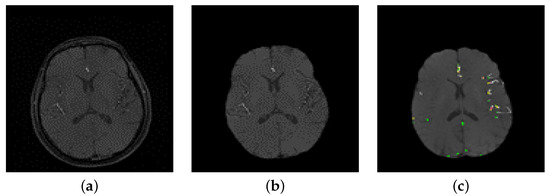
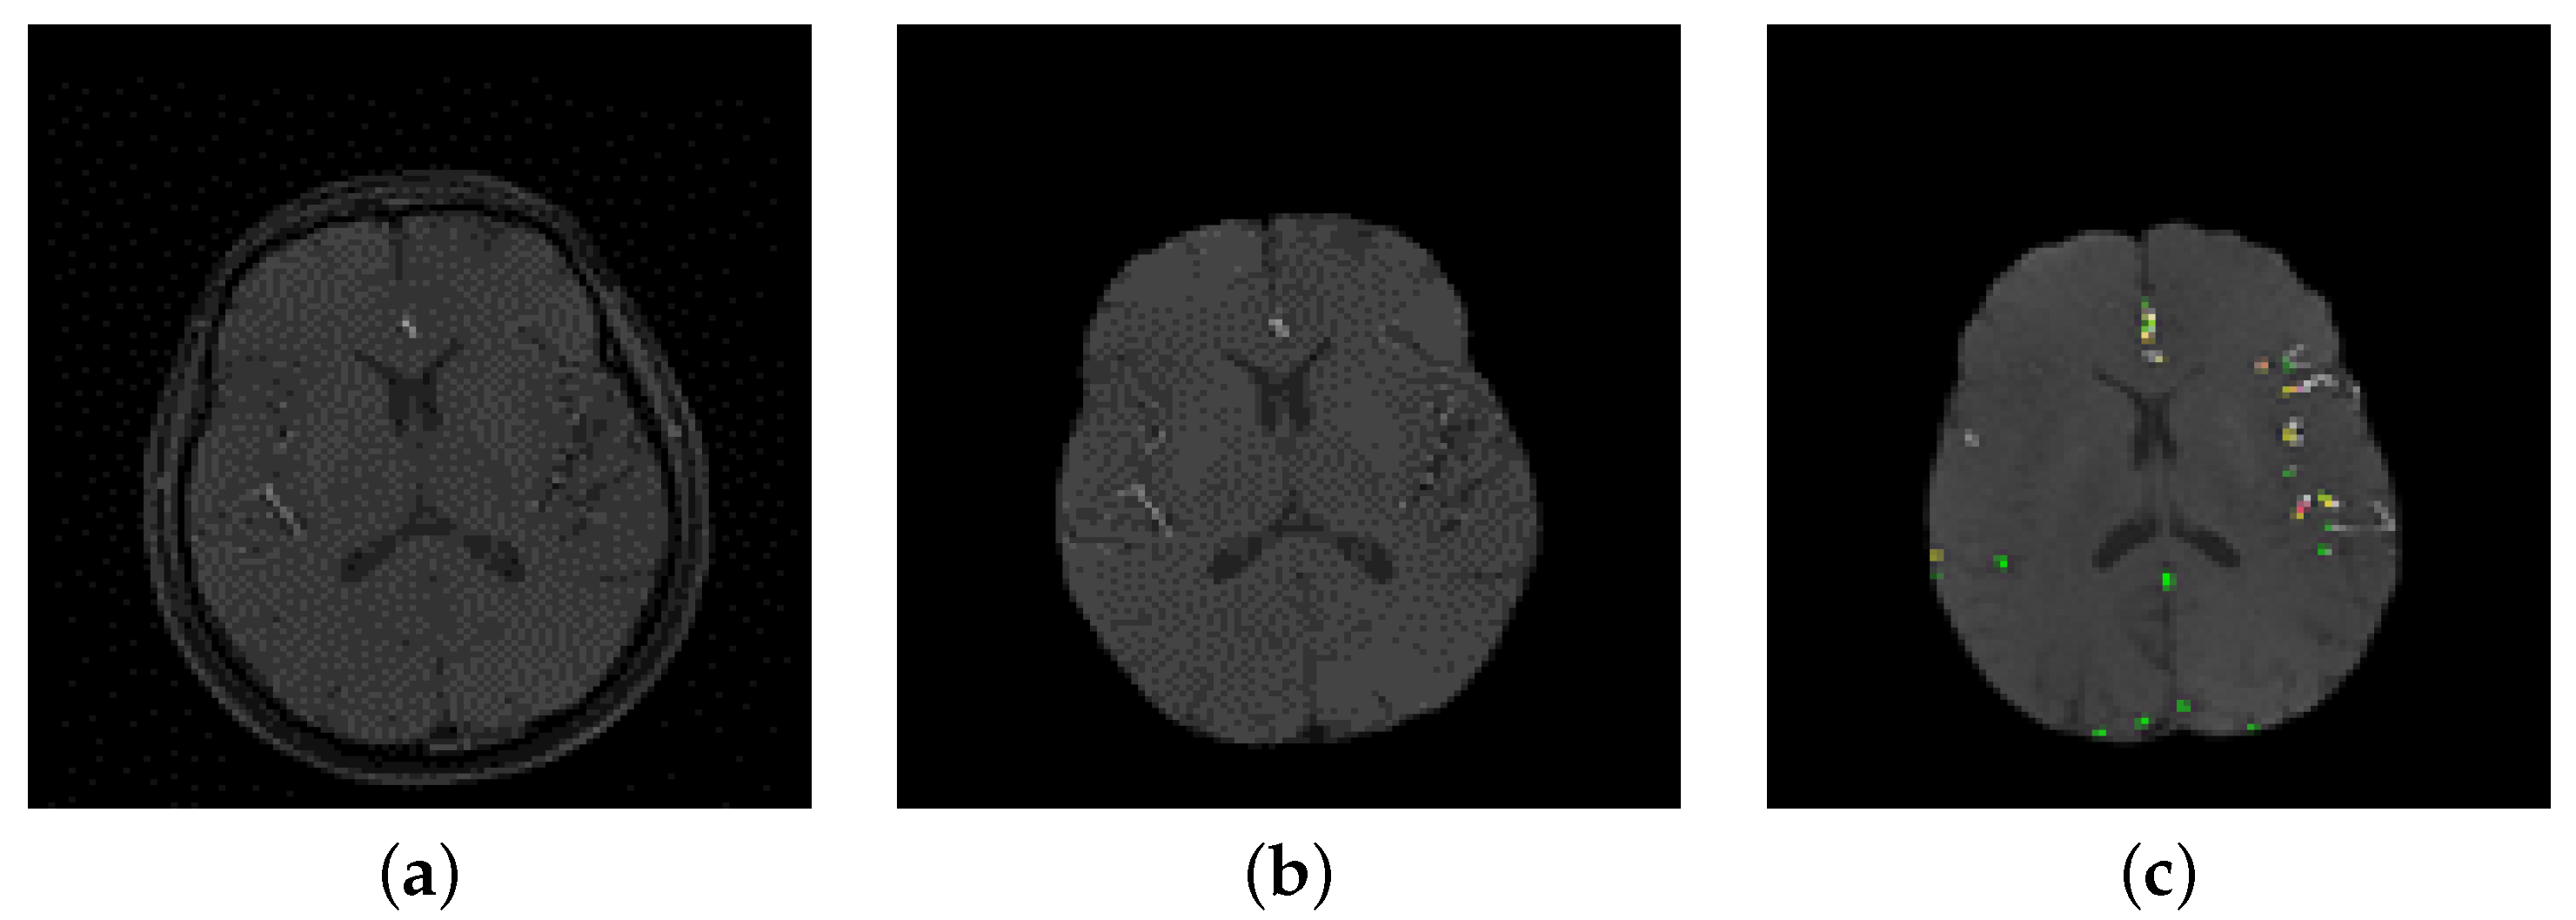
Figure 3.
(a) A sample of a 2D raw image, (b) After preprocessing, (c) Initial segmentation using LCDG.

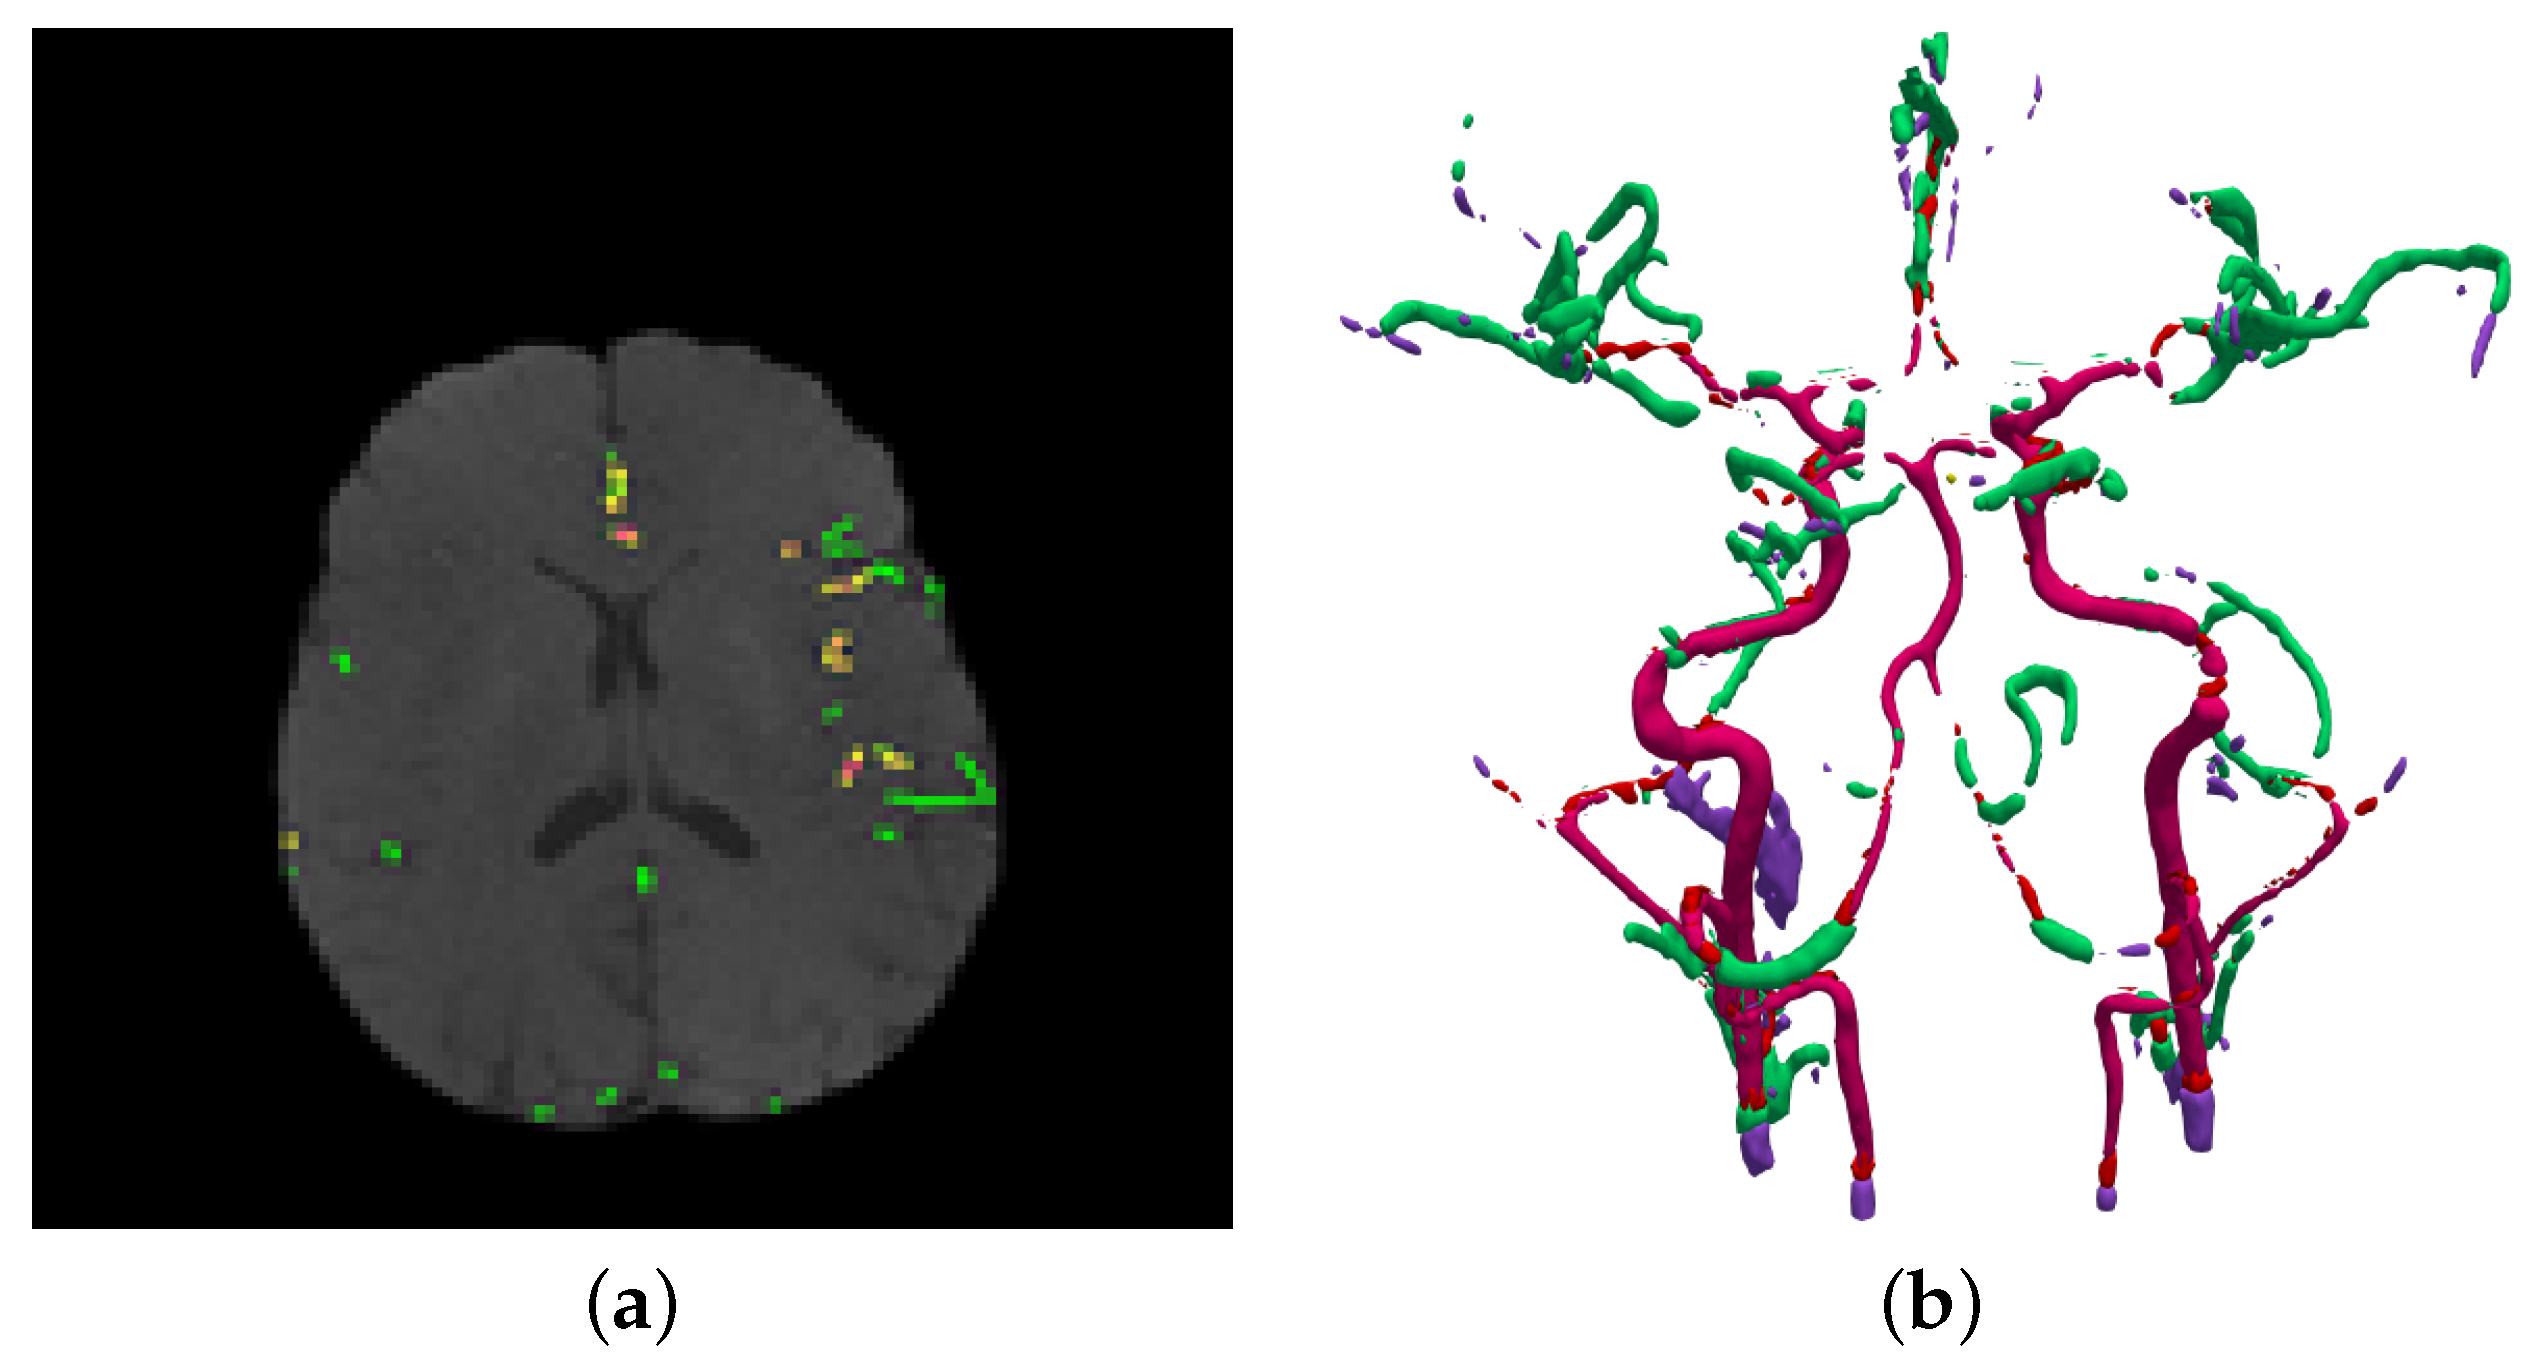
Figure 4.
(a) Final result using 3D adaptive segmentation algorithm, (b) A 3D visualization of (a) using a growing tree model.
2.2. Extraction of Cerebrovascular Descriptive Features
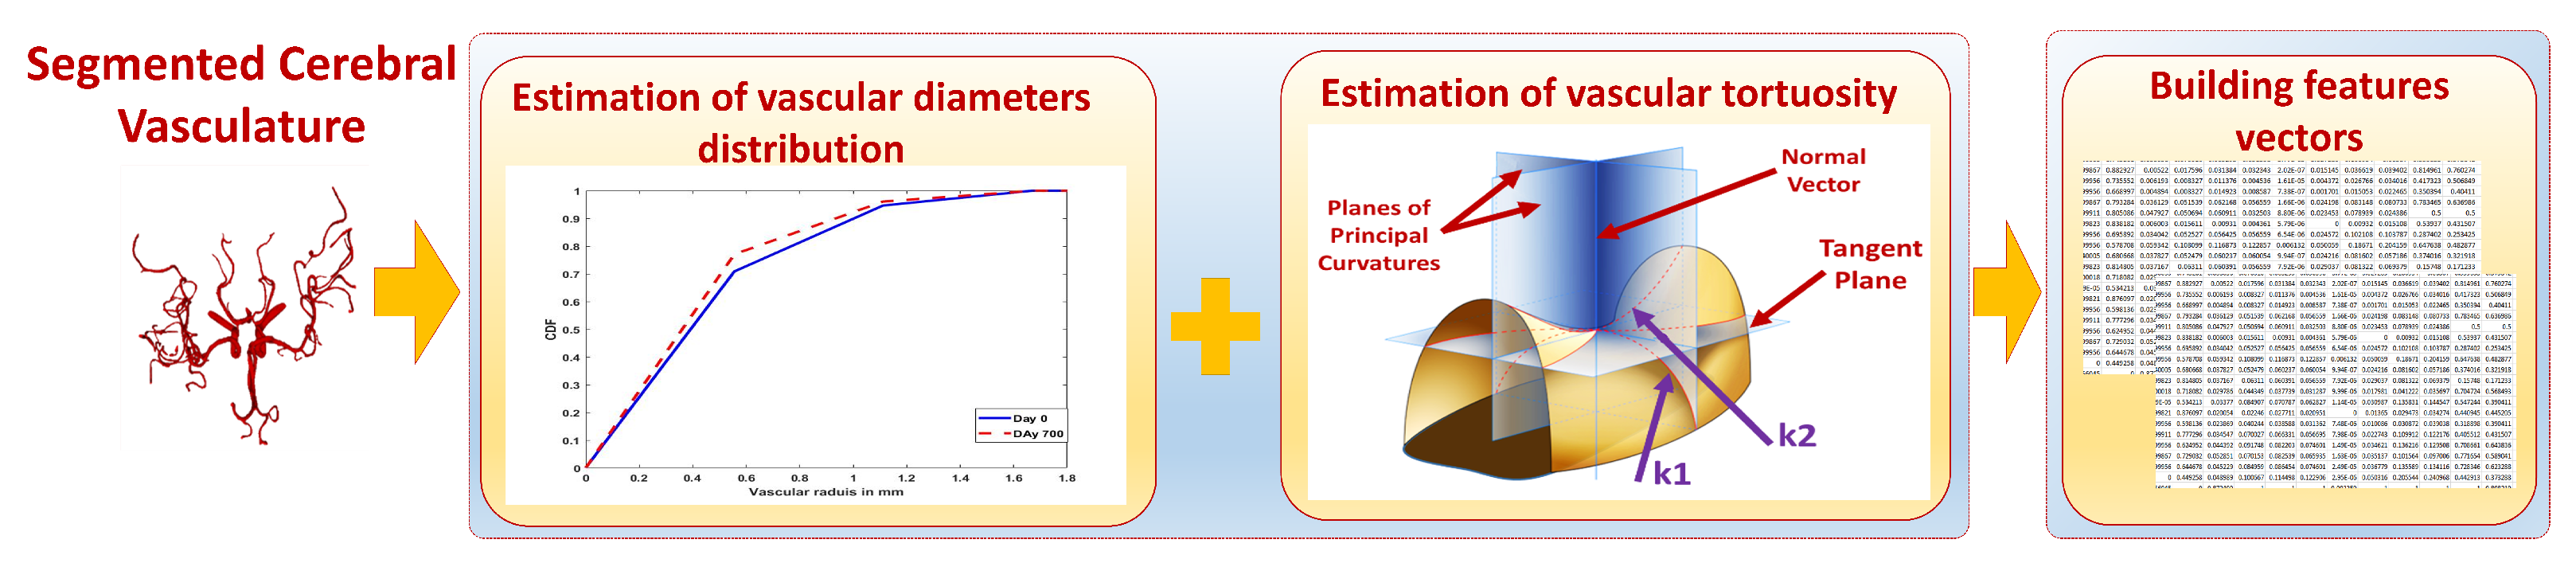
The change in cerebral vascular tree was quantified by the estimation of the changes in blood vessel diameter and tortuosity [10]. The change in vascular diameter was estimated by calculating medians of the vascular radii. The cumulative distribution function (CDF) of the radii was estimated using the cumulative distribution of the probability distribution function (PDF). A CDF value associated with each MRA volume defines the average of blood vessel diameters in that volume. It gives a probability estimate for vessels existing at or below a specific diameter value.
Vascular tortuosity changes were quantified using two of the significant types of curvatures in surface theory, namely, Mean and Gaussian curvatures. Two curvature metrics suffice to completely describe the curvature of a two-dimensional manifold. These could be the principal curvatures or two independent functions thereof. Gaussian and mean curvatures are both traditional, which allows for easy comparison of our results with those obtained by other means, and intuitive, being the determinant and half-trace of the shape operator of the surface. Besides that, Gaussian curvature is significant as an intrinsic (scalar) metric of curvature that does not depend on the embedding. In Contrast, the mean curvature is an extrinsic measure that depends on the embedding. Using both extrinsic and intrinsic measures would provide a comprehensive means for quantifying the change in vascular tortuosity. Estimation of these curvatures was done across the entire cerebral vascular tree for each subject. Mean curvature is computed as the average of the principal curvatures , , while the Gaussian curvature is computed as the multiplication of , . Mean curvature = ( + )/2; Gaussian curvature = ∗ . As shown in Figure 5, the estimated features for each subject in the dataset are used along with the corresponding blood pressure measurements to build the features vectors which will be used in the classification process.
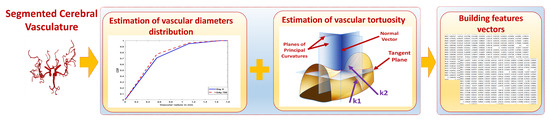
Figure 5.
Module 2: Estimation of descriptive vascular features and building feature vectors.
2.3. Data Preparation and Classification
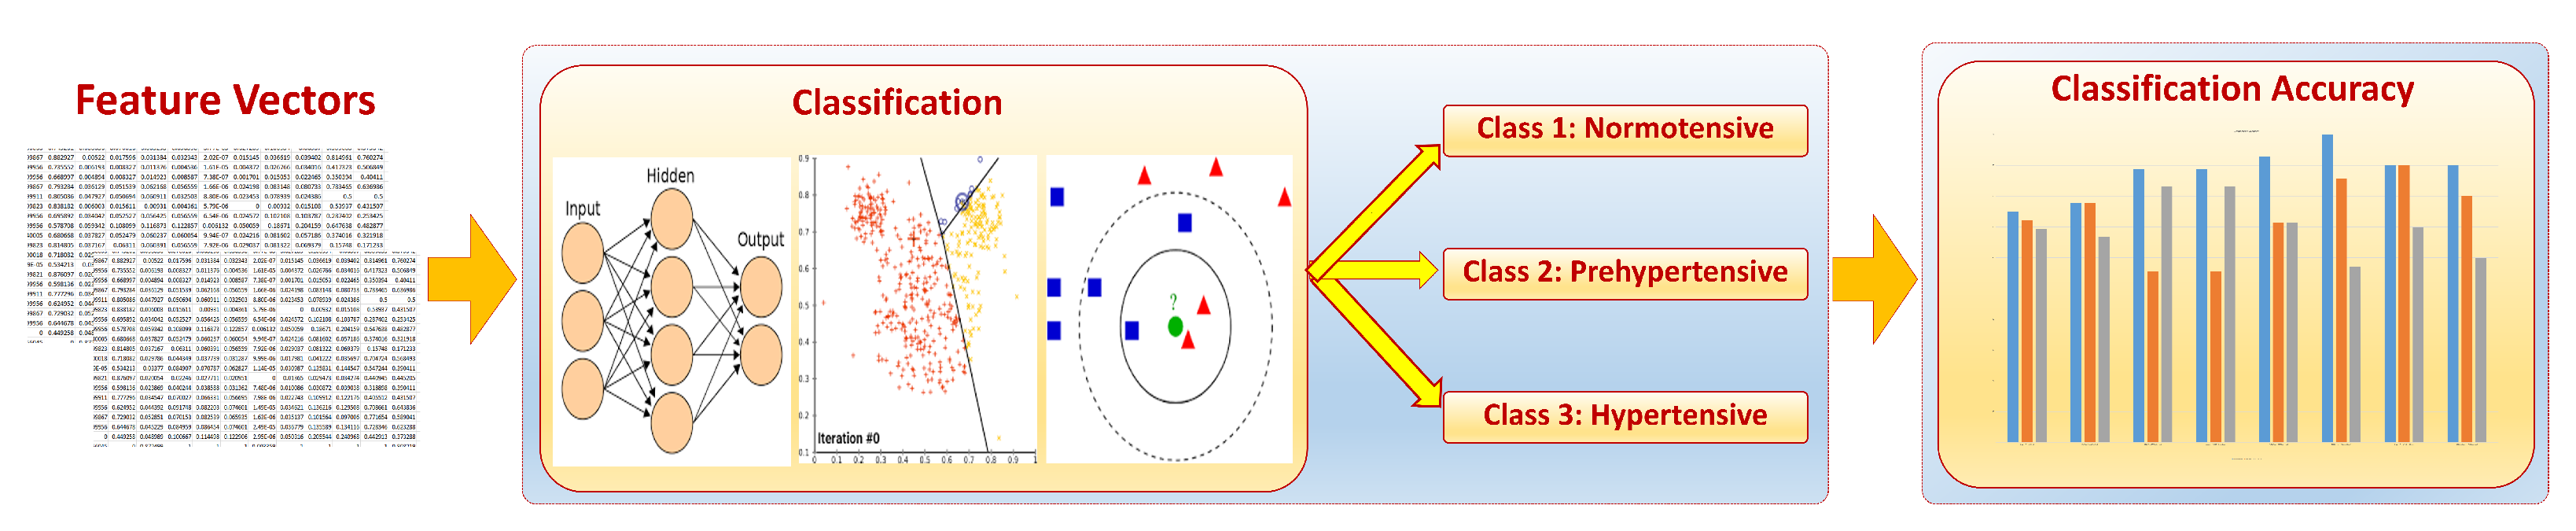
The classification module (Figure 6) was used to classify the elements in the MRA dataset into either normal, prehypertensive, or hypertensive subjects. The inputs for this module were the feature vectors built in module 2. We classify subjects based on these features for two reasons: (1) these features were clinically observed to precede the onset of hypertension, (2) we wanted to prove the efficacy of using these features to predict hypertension before its symptomatic onset. Using supervised learning techniques, classification results could compare predicted labels to actual labels. The reported classification accuracy would measure the efficacy of using the selected vascular features in the early detection of hypertension. Each feature vector was built using values that represent the change in vascular diameters, vascular tortuosity, and differences between blood pressure measurements taken at two time points(, ) separated by approximately 700 days. Blood pressure measurement information from both the baseline and the follow-up have been used in the classification process to determine whether a change in the blood pressure has occurred or not (either decrease or increase). This was done by incorporating the differences between blood pressure measurements taken at baseline and follow-up with a sign (−/+) included to determine if the change was an increase or a decrease. For instance, in Table 1, delta MAP (Mean Arterial Pressure) refers to the difference between MAP values at and . Similarly, detla SBP/delta DBP refers to the difference of the systolic BP/diastolic BP values at and . Some statistical values (i.e., average, and median) were also calculated for vascular diameter and tortuosity changes and included in each feature vector. Additionally, values in feature vectors have gone through a normalization process to remove any outliers or biasing and to enhance the homogeneity of data. Feature normalization was performed using the scaling (min-max) method that scales the values of each feature in a range between the minimum and maximum values of that feature for all dataset subjects. Each feature vector was assigned a label that indicates to which class each specific subject belongs. The three class labels are: normal, prehypertensive, and hypertensive, and were defined based on the blood pressure readings and the 2017 hypertension guidelines [3]. Different linear and non-linear classifiers with different parameters and validation scenarios were used in this module to test the accuracy of the classification based on the cerebral vascular changes occurring over the 700 day period.
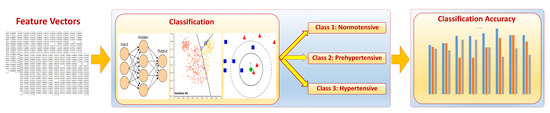
Figure 6.
Module 3: Classification of data into normal, prehypertensive, and hypertensive.

Table 1.
Classification Accuracy based on the whole brain, anterior compartment, and posterior compartment.
3. Experimental Results
3.1. Material and Procedure
A dataset of 72 subjects of middle age (age: 35:62 years) was used in this study. The dataset includes an MRA scan and blood pressure measurements for each subject. The dataset was acquired and approved by the Institutional Review Board (IRB) at the university of Pittsburgh with accordance to relevant regulations and guidelines. Initial screening via phone calls was made with each participant to ensure eligibility. All participants provided informed consent before any study procedures. Participants were enrolled in the study with the following exclusion criteria: (1) general medical conditions: ischemic coronary artery disease, pregnancy, chronic liver disease, cancer (treatment < 12 months), diabetes mellitus (fasting blood glucose > 125 mg/dL), or chronic kidney disease (creatinine > 1.2 mg/dL); (2) neuropsychiatric conditions: multiple sclerosis, stroke, epilepsy, serious head injury, brain tumor, and major mental illness; (3) using prescription medications for hypertension and psychotropic drugs. MRA scans were acquired using a 3T Trio TIM scanner with a 12-channel phased-array head coil. Each MRA scan is composed of about 160 slices with a thickness of 0.5 mm, a resolution of 384 × 448, a flip angle of 15 degrees, a repetition time of 21 ms, and an echo time of 3.8 ms. MRA scans were acquired two times separated by approximately 700 days. Blood pressure measurements were gathered using the auscultatory technique with cuff size appropriate to patient arm after giving him/her a seated rest of 5-min two times over the 700 days too. In each time, four readings were taken from each patient in two consecutive days (two readings taken in each day separated by at least 1-min), and the final measurement was calculated from the arithmetic average of the four readings. MAP was calculated from the blood pressure readings as, .
3.2. Classification Results
Three different experiments have been conducted in this study and were implemented using the built-in classification learner, MATLAB R2021b, using a set of linear and non-linear classifiers available with default parameters of the classification learner and with different available validation scenarios. The first experiment was conducted using the MRA scan for the entire brain. In the other two experiments, only part of the brain was studied. Only the anterior region of the brain was included in the second experiment, while the third experiment was conducted using the posterior region of the brain only. Table 1 presents the results in terms of the accuracy percentages achieved in each experiment using different classifiers with different parameters and validation scenarios. A general look at Table 1 will show that the analysis of the cerebral vascular changes in the whole brain resulted in the best accuracy in classifying the data into either normal, prehypertensive, and hypertensive. Actually, six out of the eight classification scenarios achieved the best accuracy in the whole brain experiment. In the remaining two scenarios, the first and second experiments achieved the same accuracy percentages. Classification using ensemble random forest (Bagged trees) classifier with a hold-out validation scenario recorded accuracy of in both the first experiment (whole brain) and the second experiment (anterior region) . While using K-nearest neighbour (KNN) classifier with a distance weight (weighted) and a 10-fold validation scenario, achieved accuracy in both the first and second experiment. No other classification scenarios in the second (anterior region) or third (posterior region) experiments outperformed the results of the first (whole brain) experiment in terms of recorded accuracy percentages.
In addition, the accuracy percentages resulted in the second experiment (anterior region) from ensemble (bagged trees), KNN (weighted), and ensemble random undersampling boosting (RUSBoosted) classifiers were higher than accuracy percentages resulted in the third experiment (posterior region). Whereas using the KNN classifier with a cosine distance metric (cosine) resulted in accuracy in both the second and third experiments. In contrast, the third experiment (posterior region) outperformed the second experiment (anterior region) in only two cases; using the subspace ensemble with nearest neighbor learners (subspace KNN) classifier, and the KNN with k set to equal 1 (fine) classifier with accuracy of in both cases.
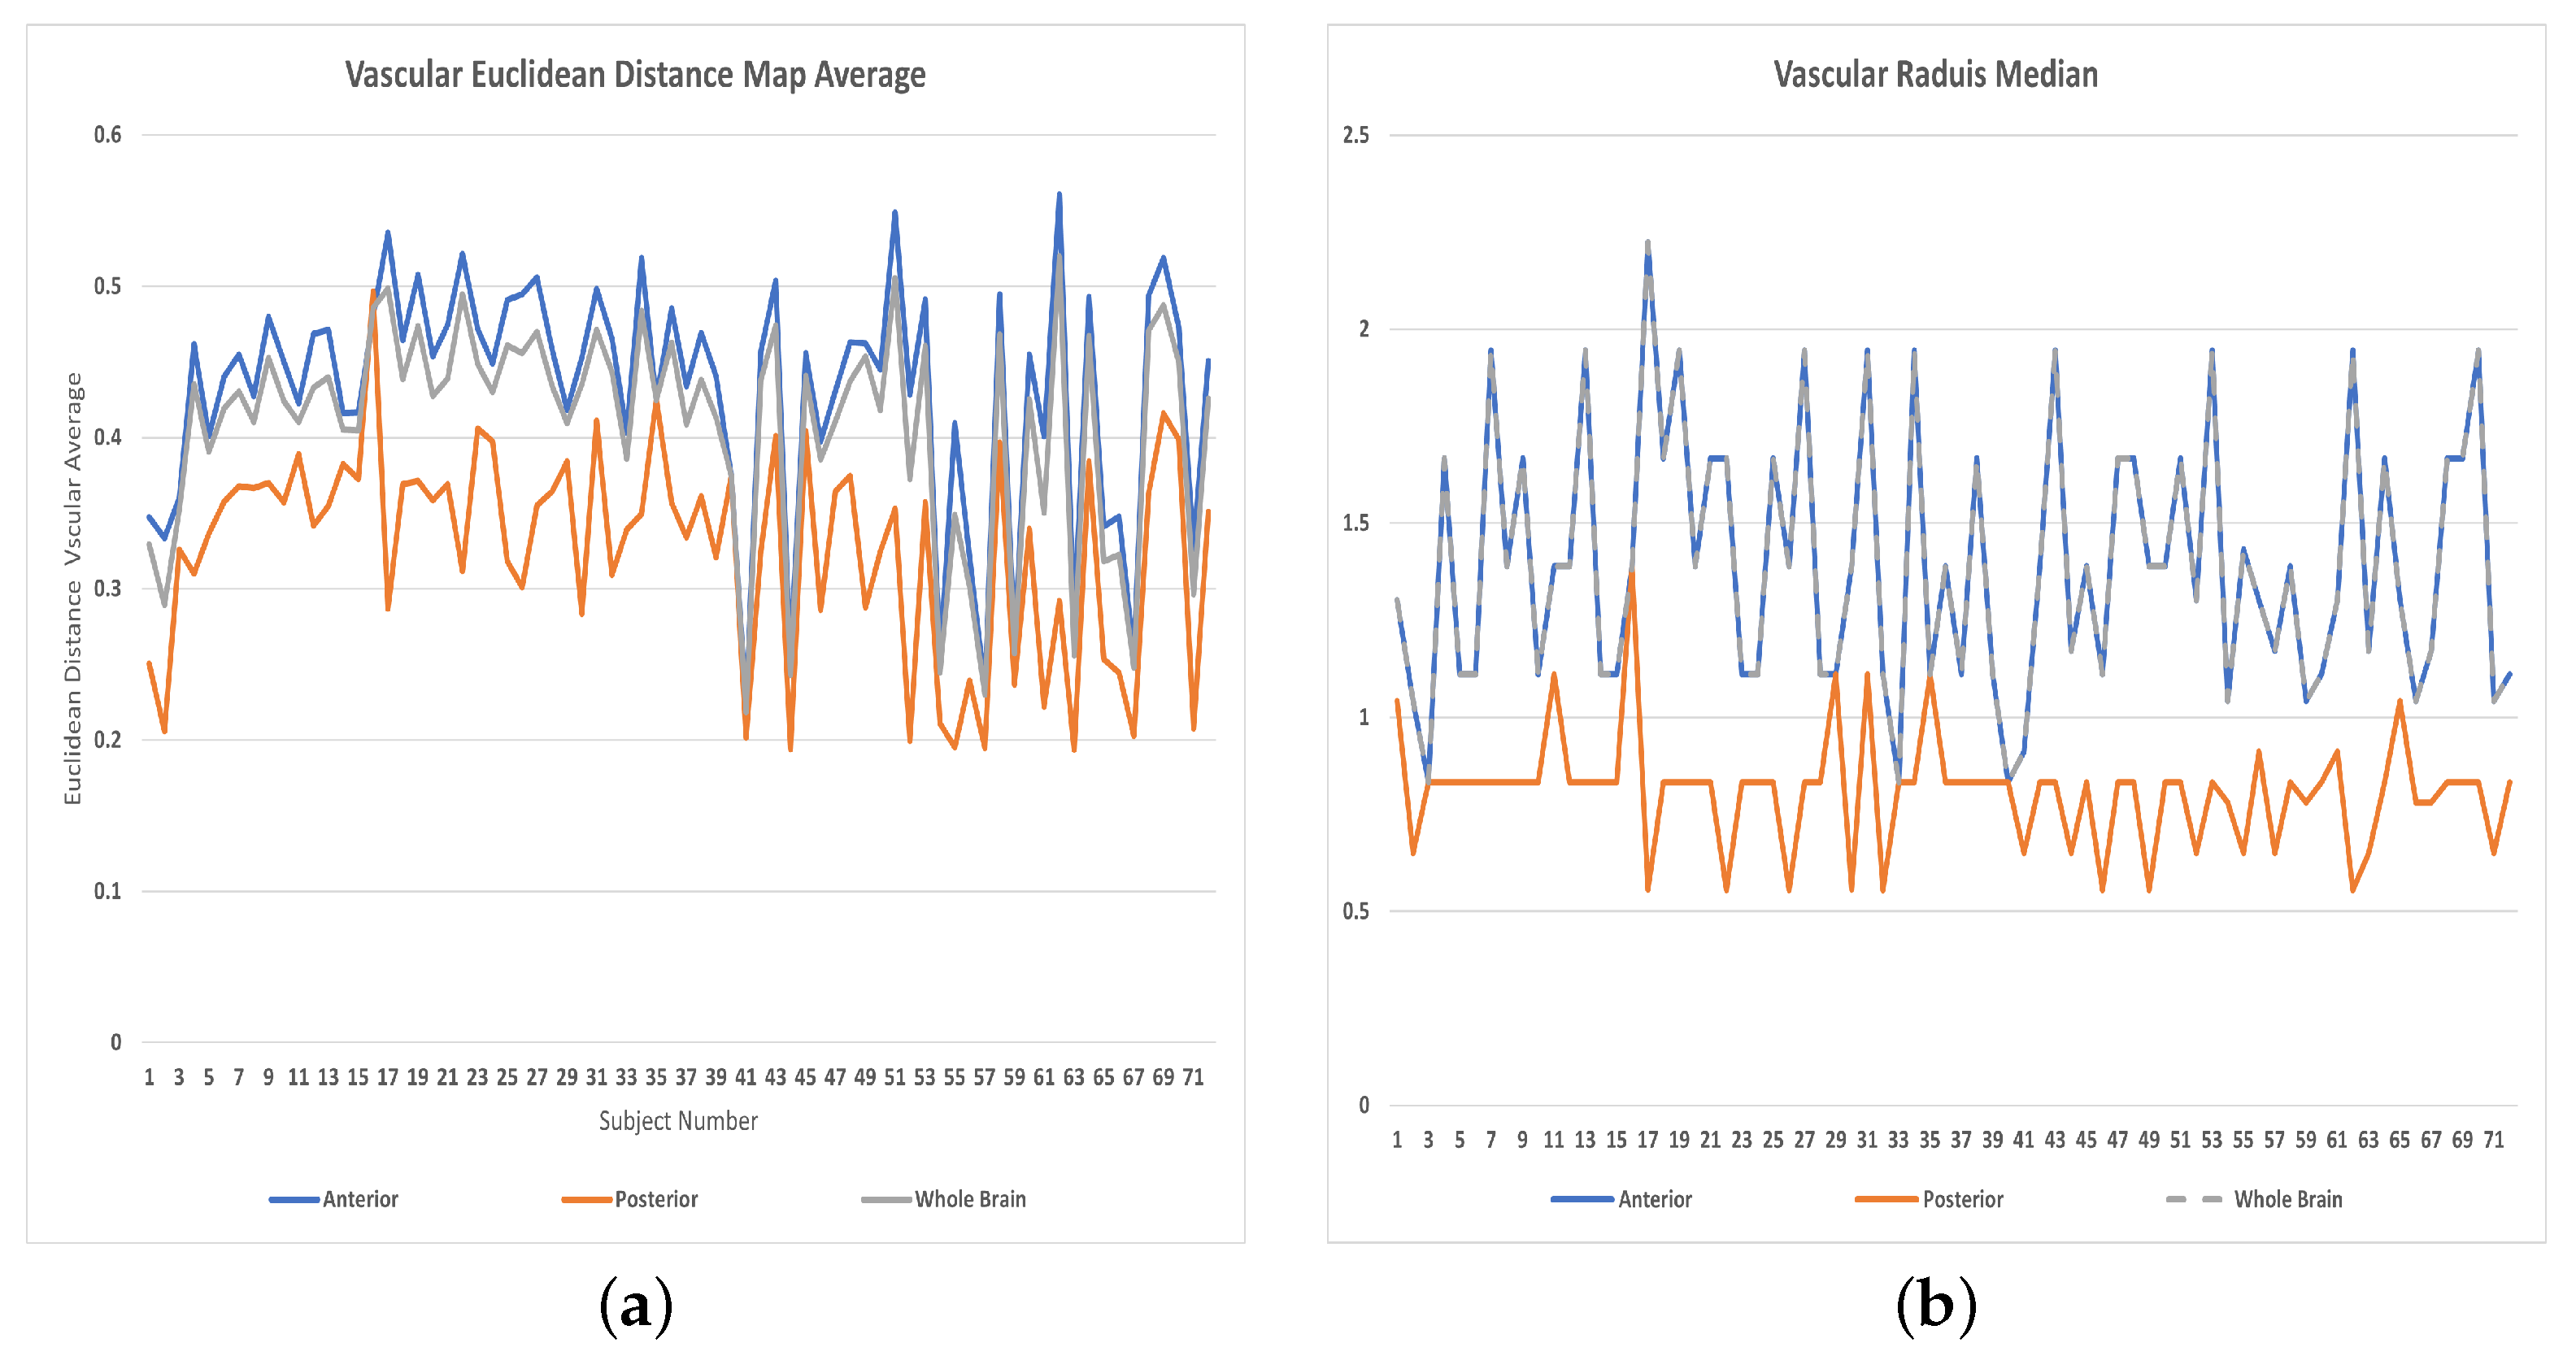
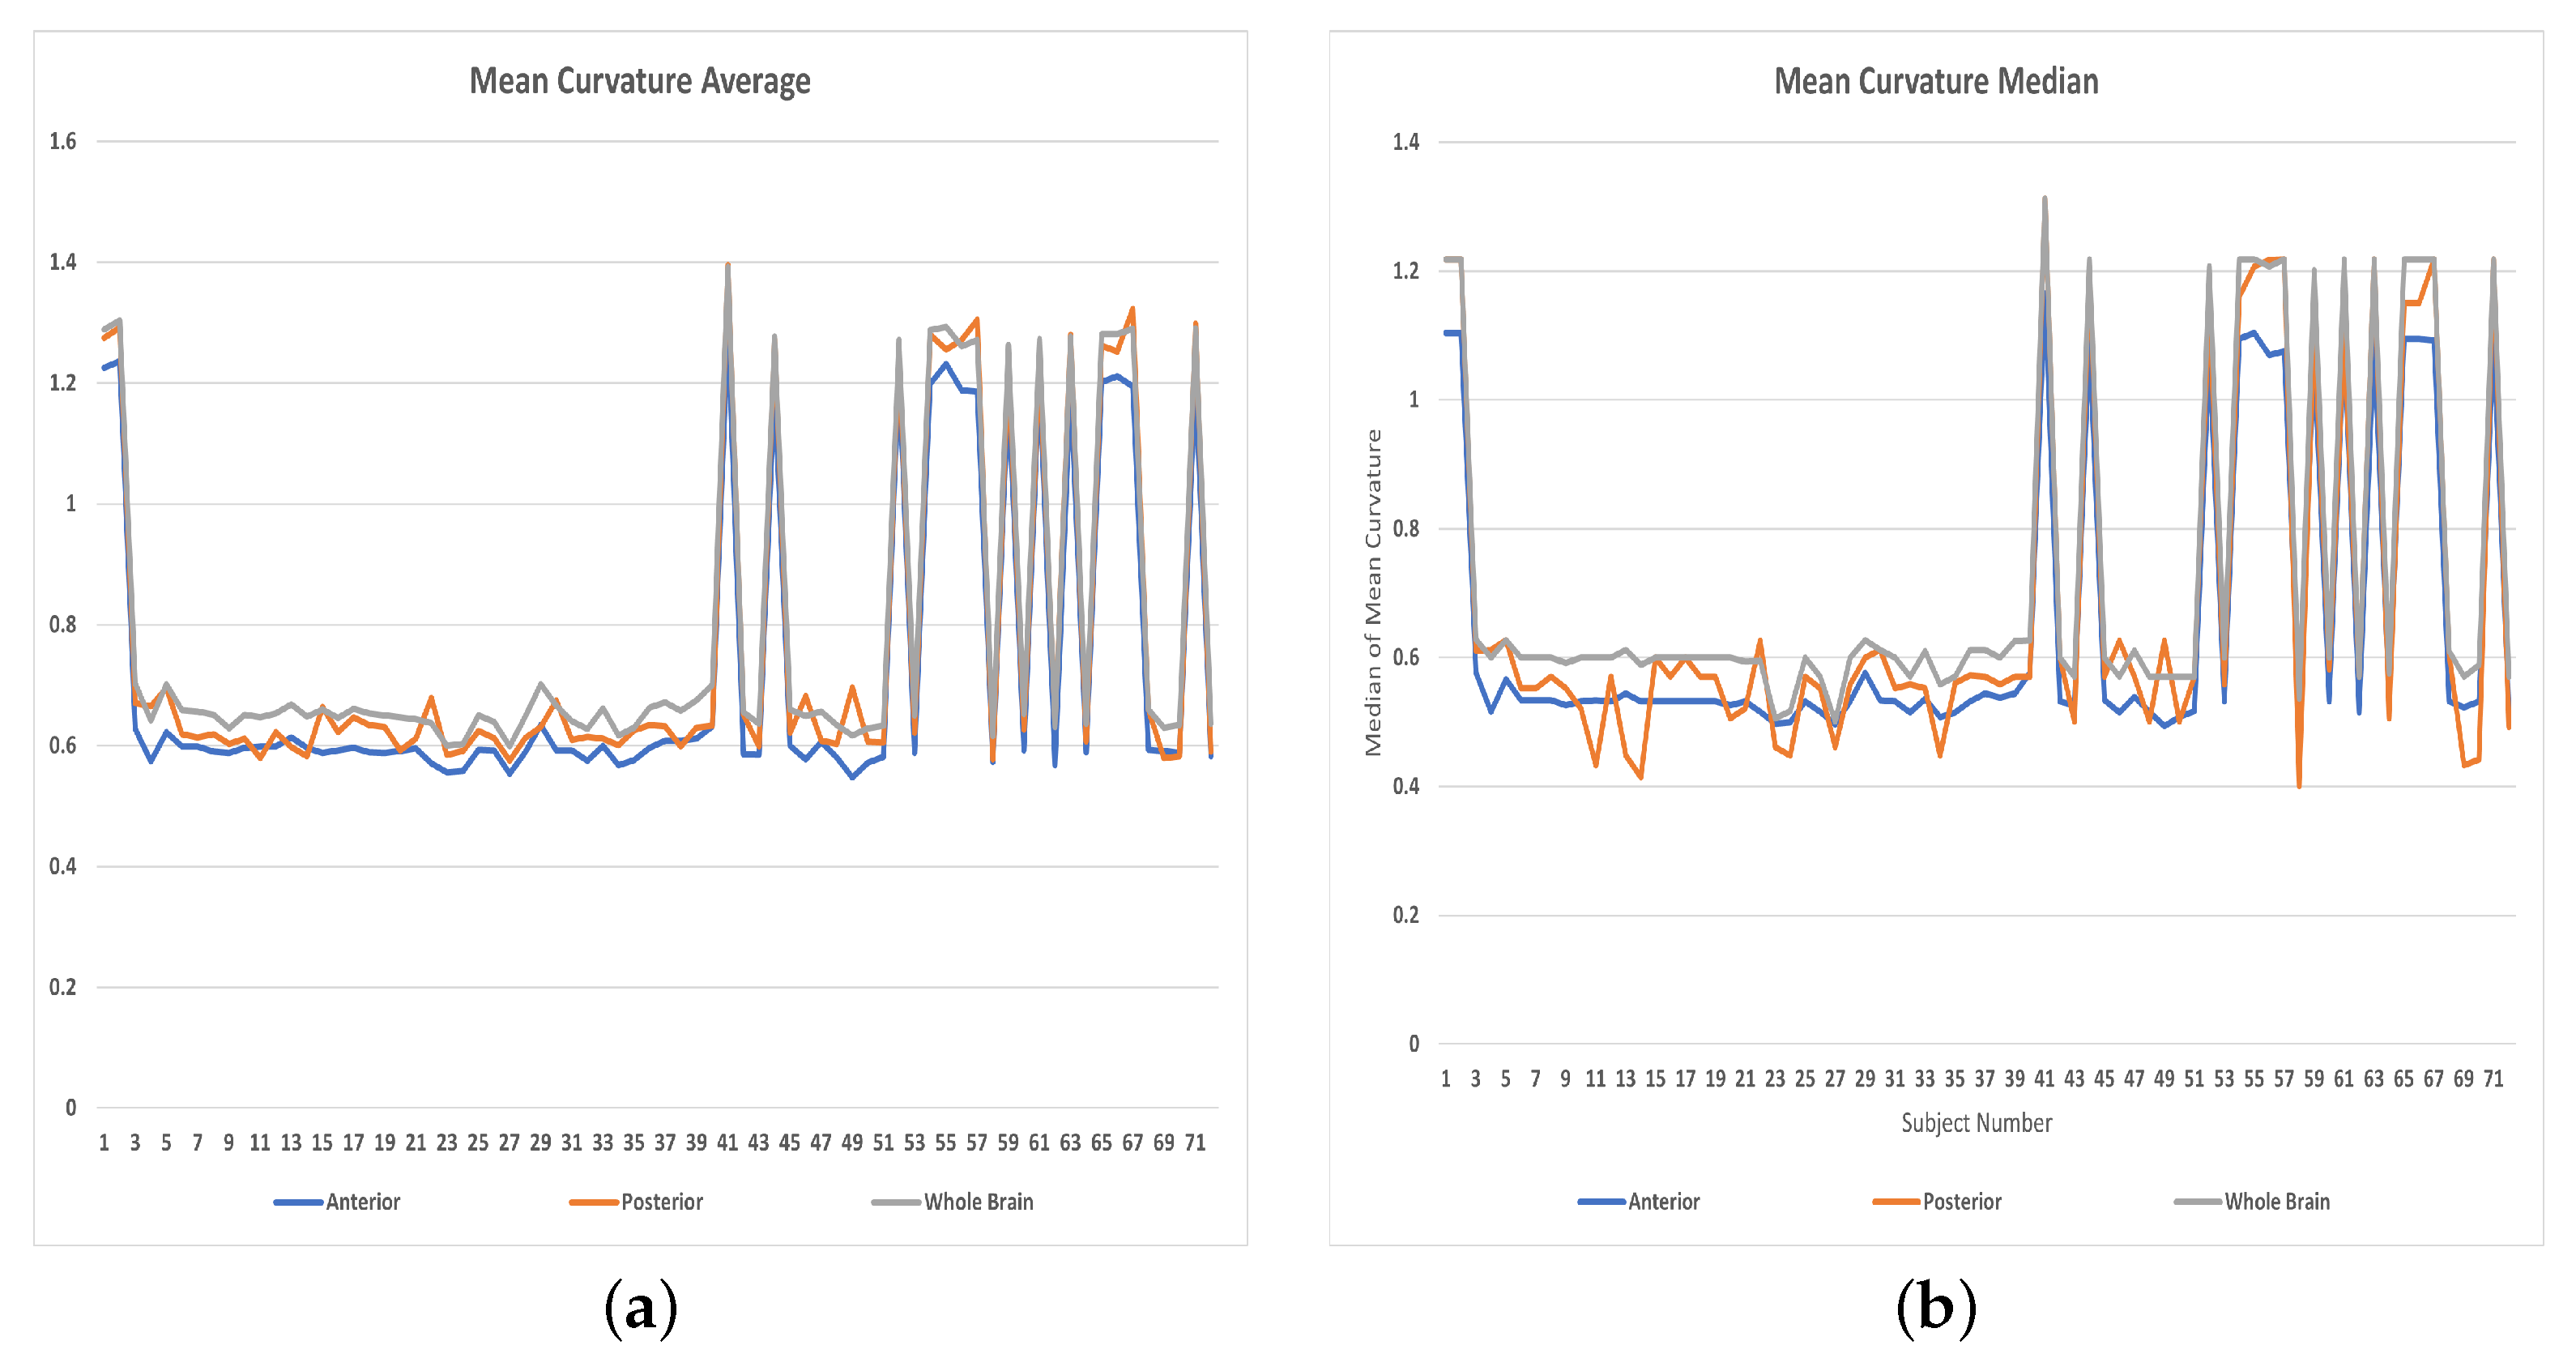
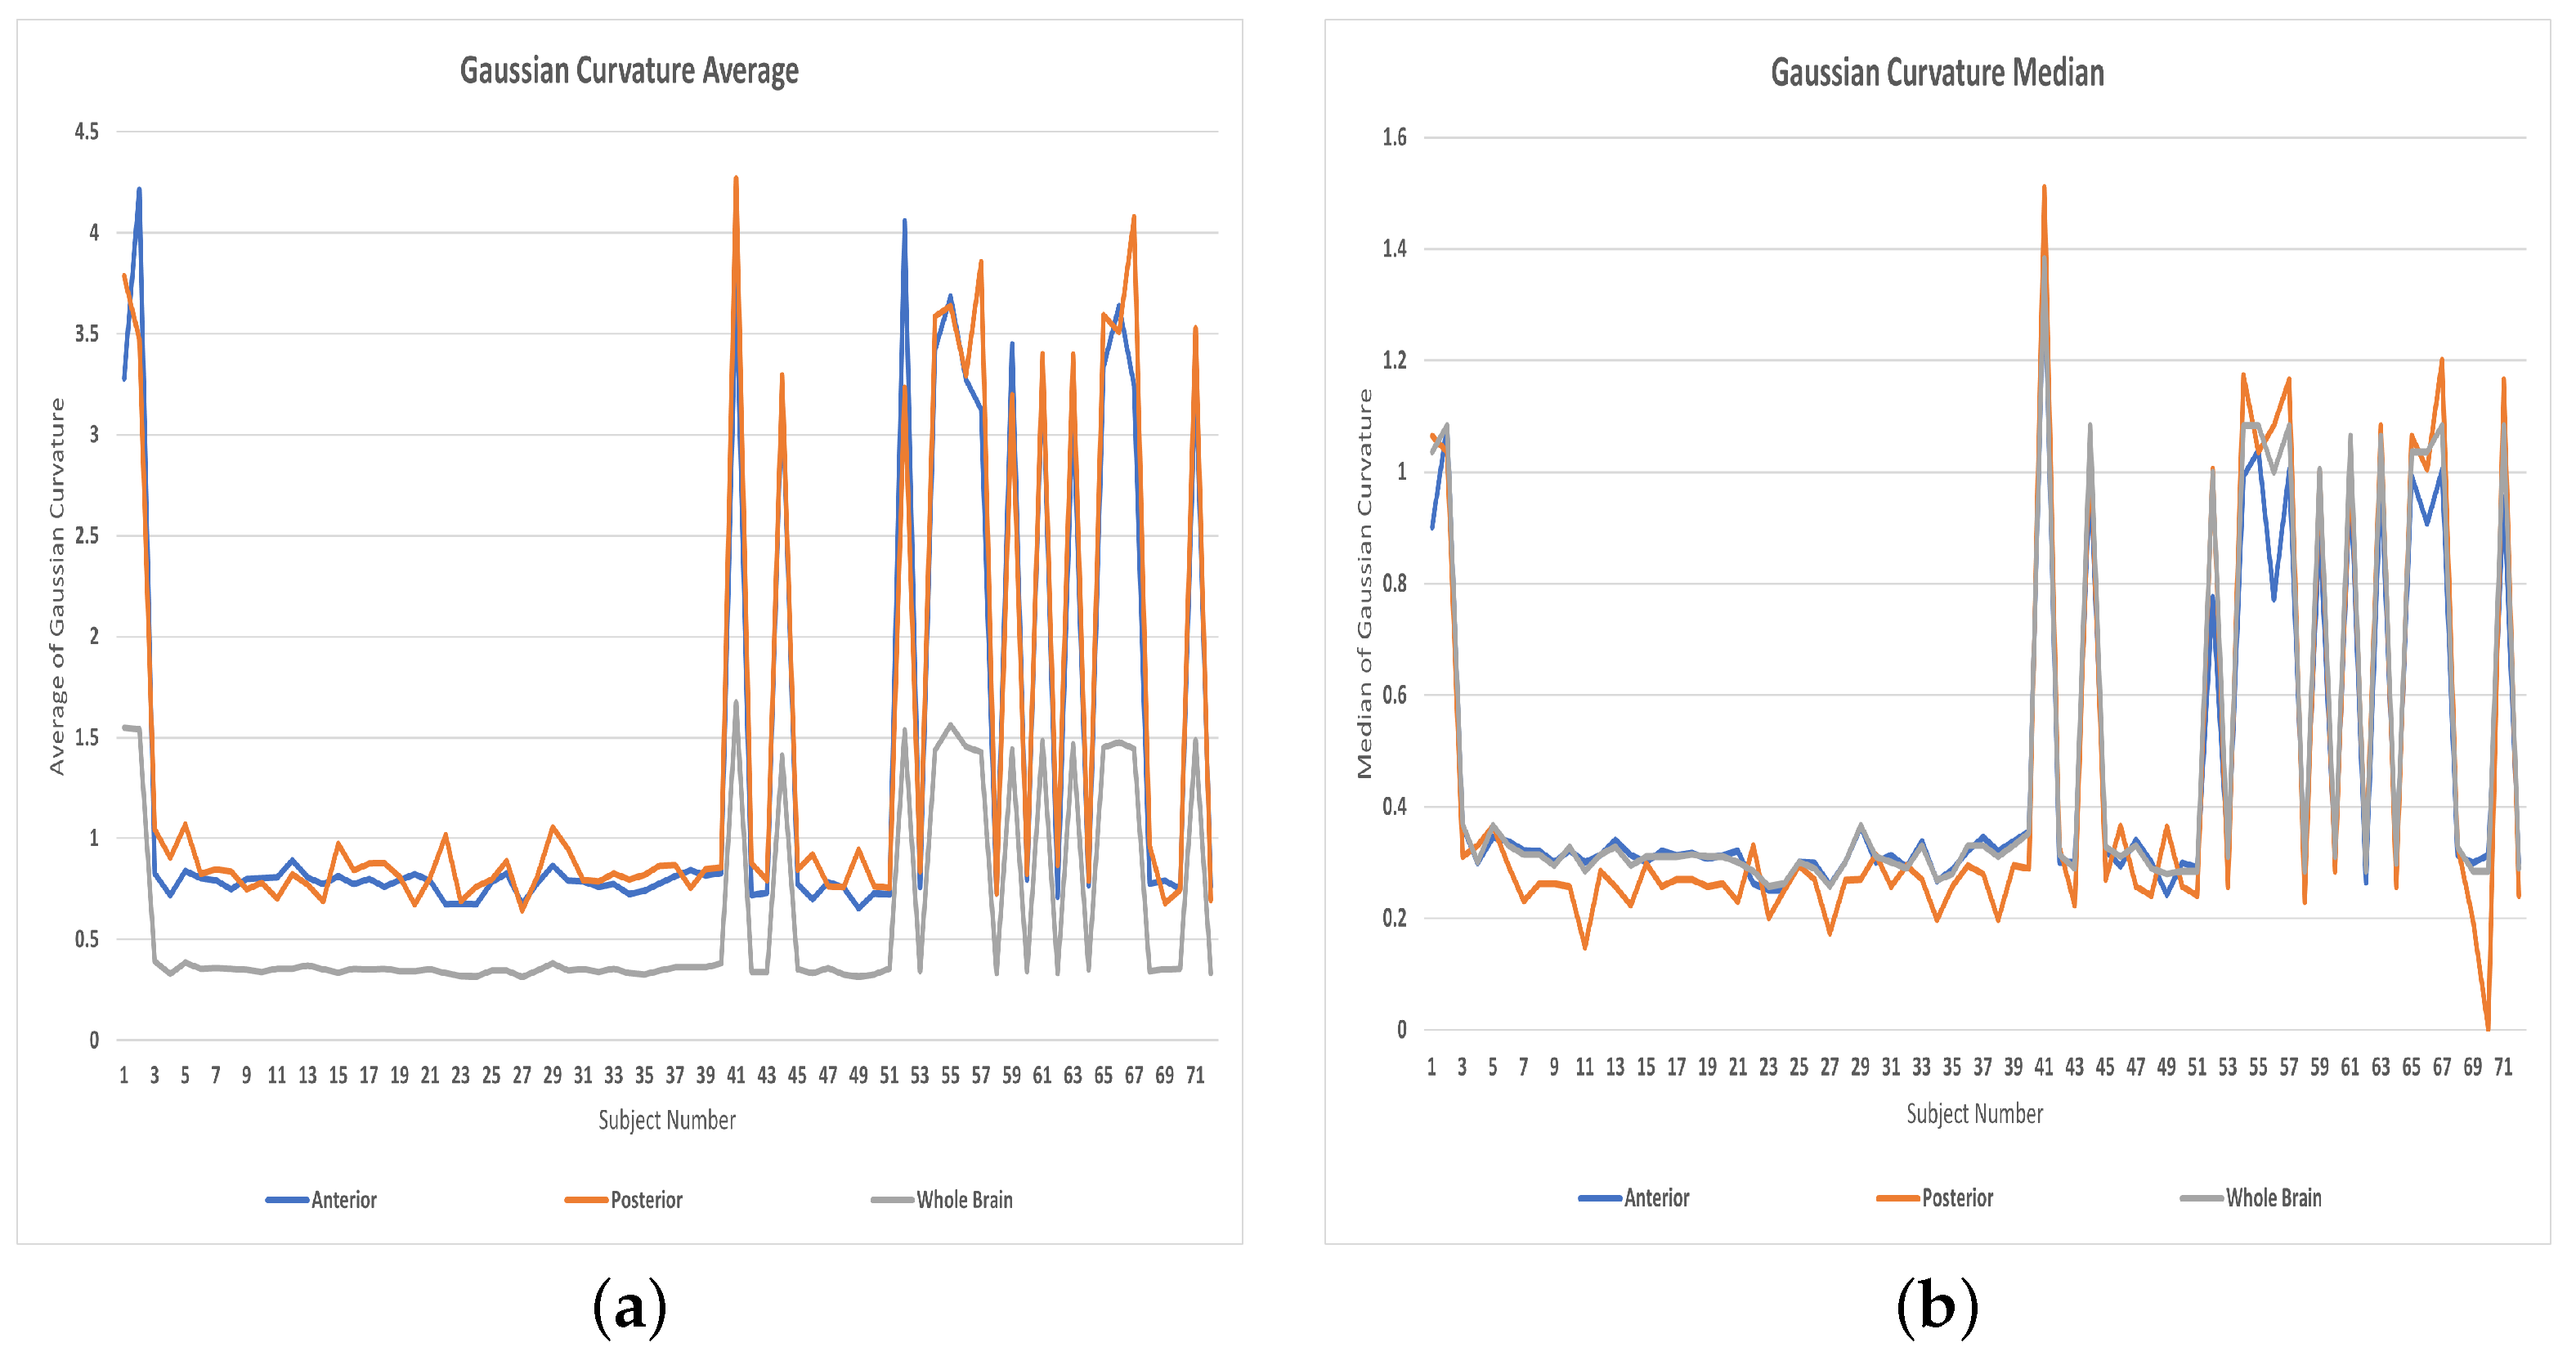
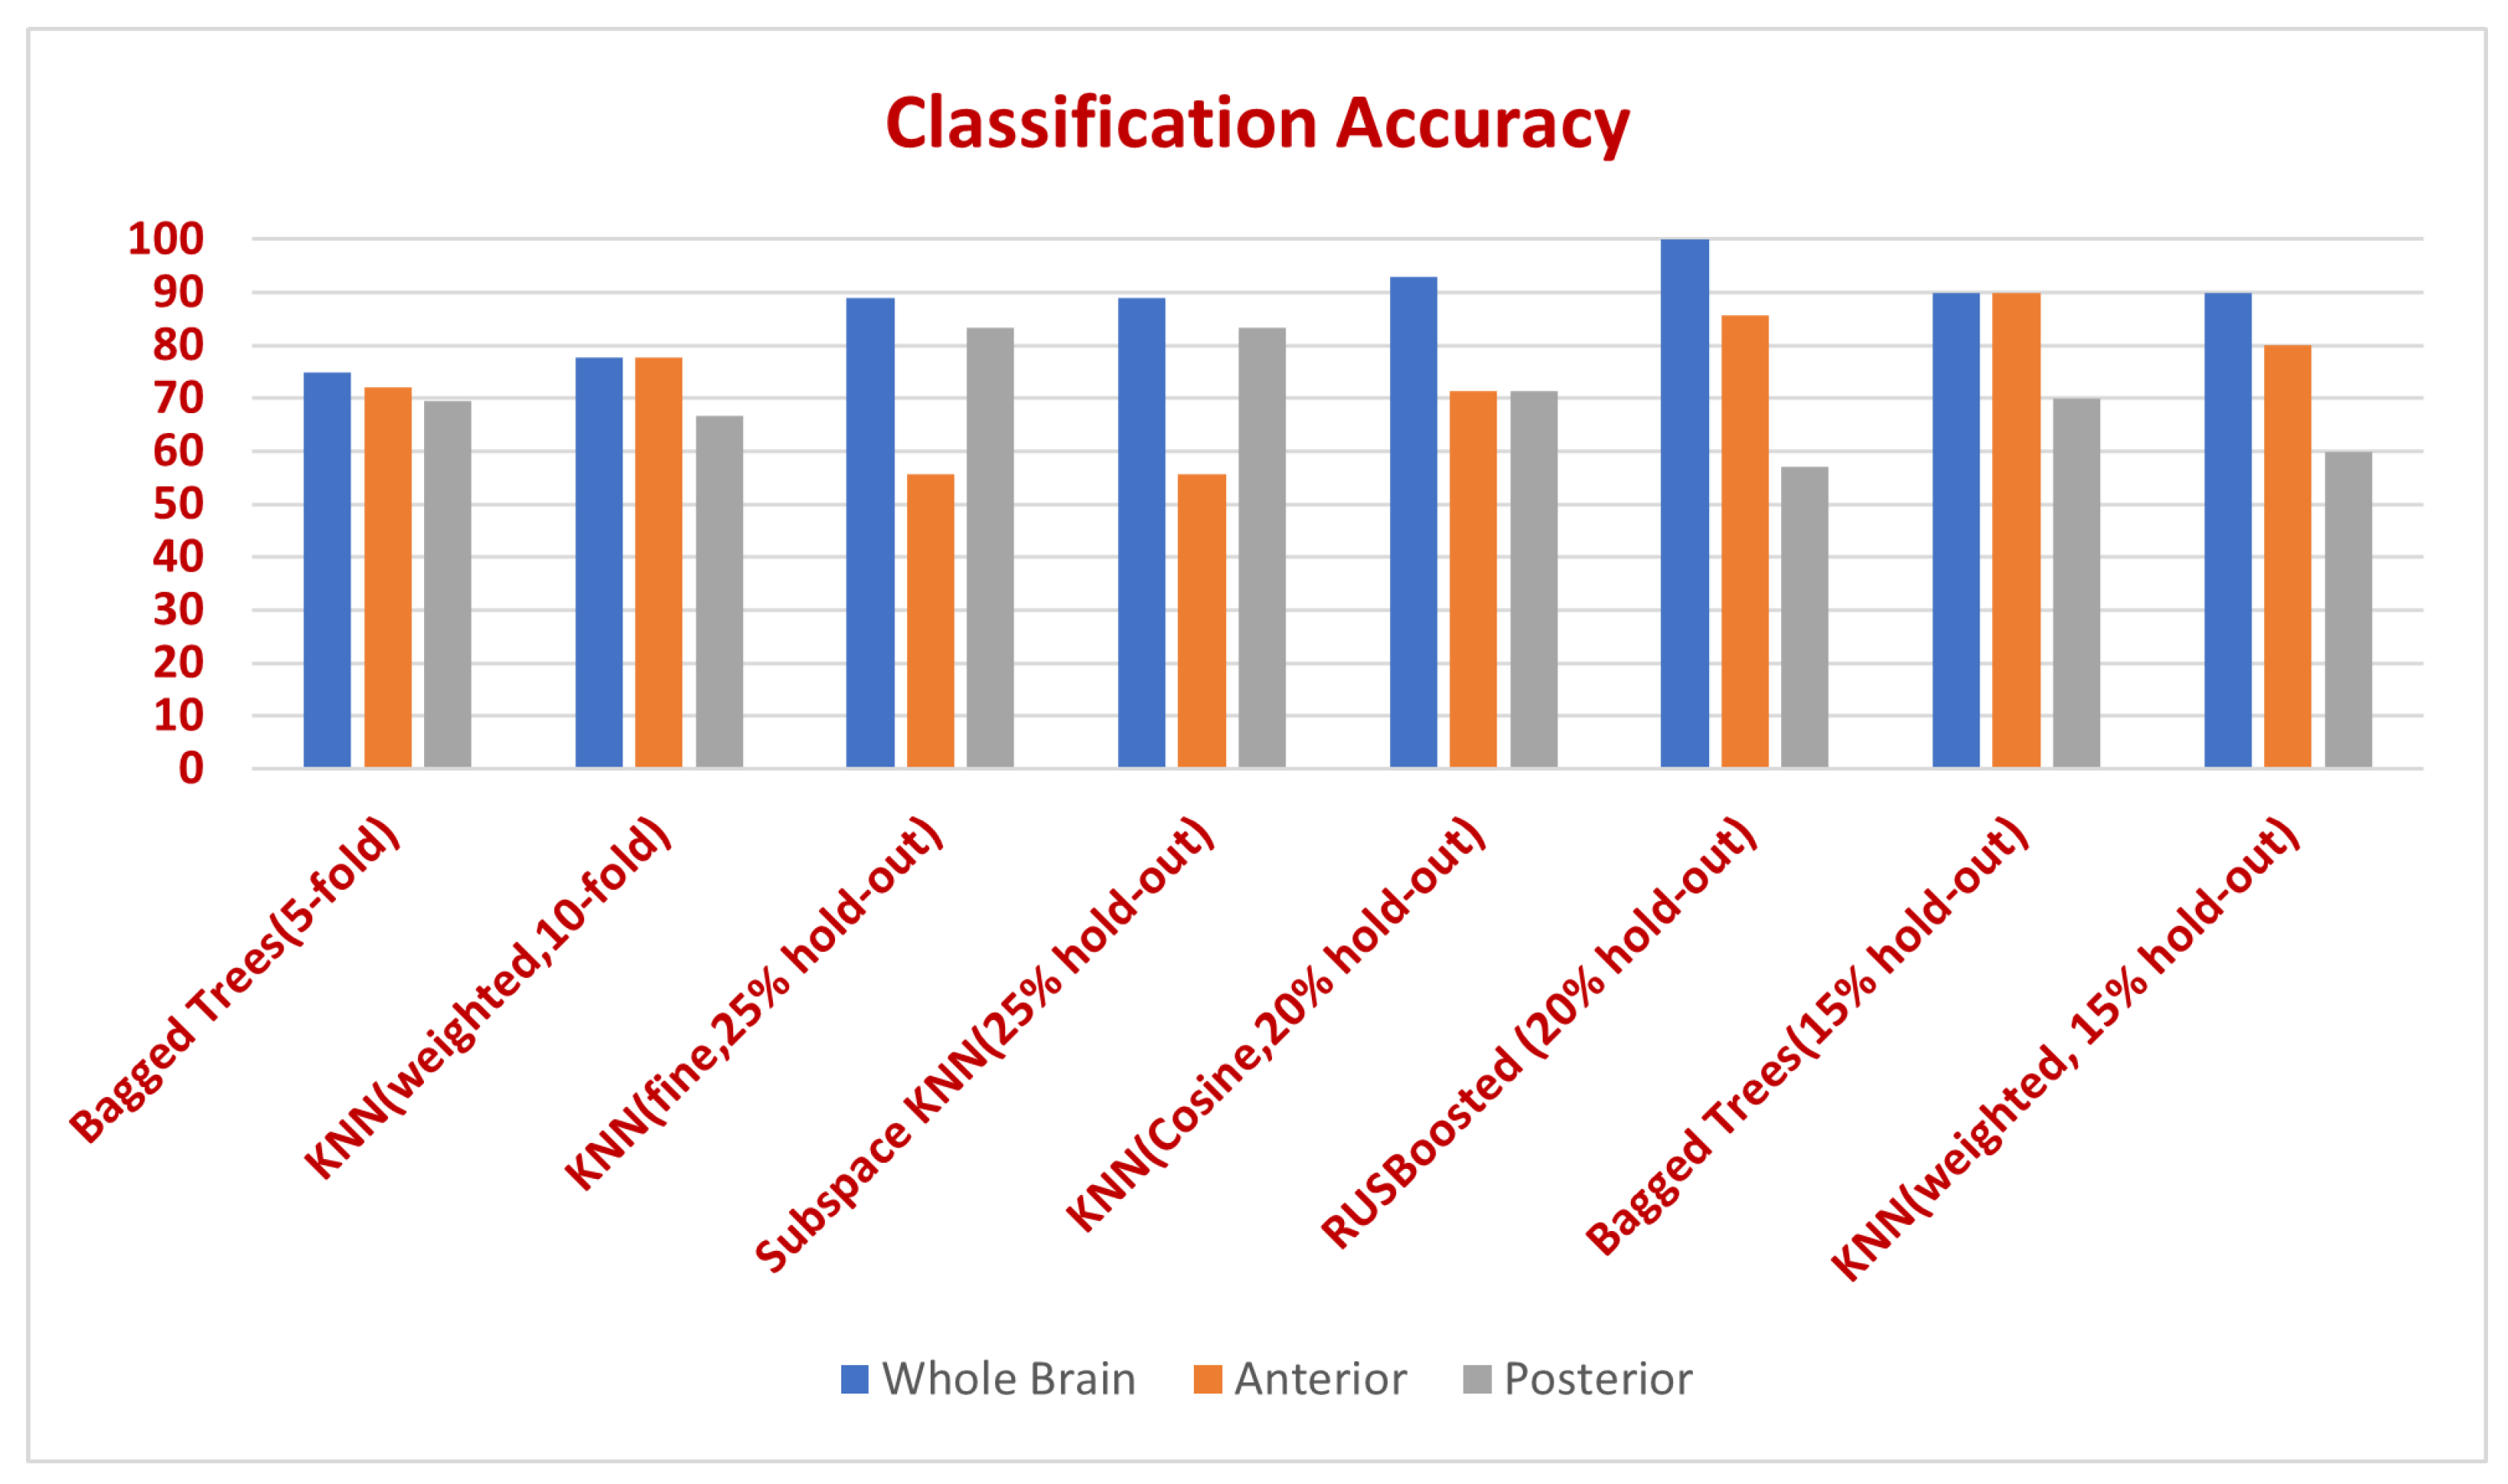
The features used in the classification had an impact on the results as shown in Table 1. (The distributions of the vascular diameters and tortuosity features are shown in Figure 7, Figure 8 and Figure 9). The best accuracy percentages resulted in each of the experiments were achieved using the set of features that included values to represent vascular diameter change, vascular tortuosity change, delta MAP, delta SBP, and delta DBP. The best accuracy recorded was in the first experiment using ensemble (RUSBoosted) classifier, in the second experiment using ensemble (bagged trees) classifier, and in the third experiment using either KNN (fine) or ensemble (subspace KNN) classifiers. Whereas using the feature set that included only the median of vascular diameters, median of tortuosity index, delta MAP, delta SBP, and delta DBP resulted in decreased accuracy percentages in all three experiments as follows: , , and for the first, second, and third experiment, respectively. Similarly, using a feature set that combines the average of vascular diameter, average of vascular tortuosity, delta MAP, delta SBP, and delta DBP only, recorded accuracy of in the first and second experiments and for the third experiment. To sum up, the first experiment that studied the whole brain vasculature achieved the best accuracy in the majority of classification scenarios, followed by the second experiment where the anterior compartment in human brain was studied. Whereas the third experiment where the posterior compartment was studied reported the least accuracy percentages (Figure 10).

Figure 7.
Features distributions: (a) Averages of vascular radii, (b) Medians of vascular radii.
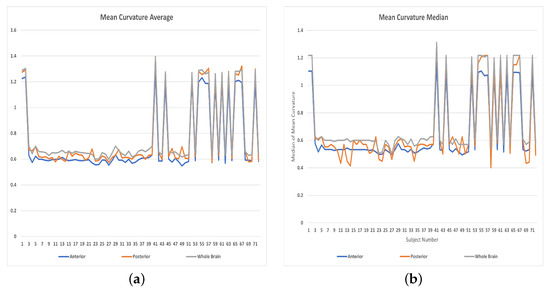
Figure 8.
Features distributions: (a) Averages of Mean curvatures, (b) Medians of Mean curvatures.
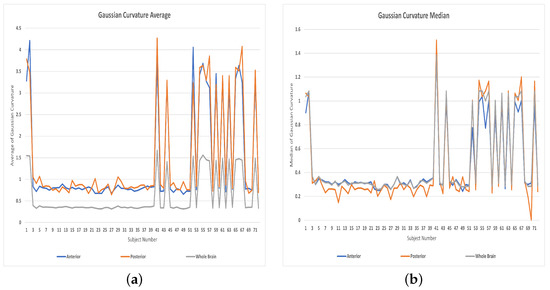
Figure 9.
Features distributions: (a) Averages of Gaussian curvatures, (b) Medians of Gaussian curvatures.
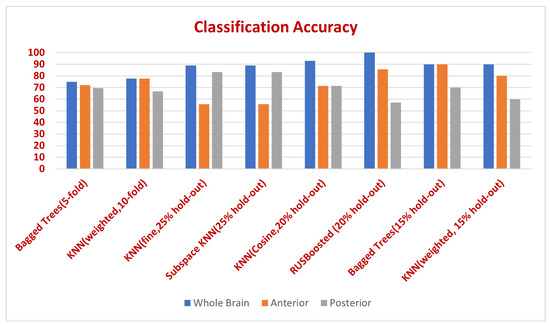
Figure 10.
Classification accuracy in whole brain, anterior, and posterior compartments for different classifiers and validation scenarios.
4. Discussion
To the best of our knowledge this is the first study to investigate the cerebrovascular changes in different parts of human brains and their role in hypertension prediction. The question raised in this study was: would the independent study of cerebral vascular changes in the anterior or the posterior compartments improve the accuracy of hypertension prediction or not compared to studying changes over the entire brain. Answering this question will help clinicians in determining which part of human brains is more vulnerable (anterior, posterior, or the entire brain) to hypertension-related cerebrovascular changes. This could help them figure out the best protocols in dealing with this medical concern. The experimental results answered this question by proving that the changes taking place in the entire cerebral vasculature contribute to the development of hypertension and are more descriptive than changes occurring in either the anterior or the posterior compartments only. Additionally, it shows evidence that hypertension development is contributing to cerebral changes in the entire brain rather than affecting local specific compartments. One challenge in studying the change of cerebrovasculature of human brains is that we cannot claim a specific cut-off for the cerebral changes that indicates whether a specific individual will be hypertensive or not. This is due to the high inter-variability between individuals’ cerebrovasculatures, which was considered one of the main obstacles in the road of developing accurate and automatic cerebrovascular segmentation algorithms. High inter-person variability of the vascular tree hinders the creation of a common atlas to be used for segmentation, as done for other human organs. However, in our current study, this burden is carried out and solved by the neural networks and classification algorithms. We provided these classifiers with a part of the available data along with the actual class labels for each subject. The discriminative power of these classifiers was used to investigate these data and build patterns and associations describing what a normal cerebrovasculature looks like and what a hypertensive cerebrovasculature looks like. After the classifiers find these patterns and associations and build their own models, we have presented new unidentified data (without class labels) to them, and they could successfully predict the actual true class labels with higher accuracy as indicated in the results section. This means that the classification algorithms could successfully use the cerebral vascular change data and find appropriate patterns for how an individual is either normal or hypertensive. Therefore, the generated classification models are considered reliable for the hypertension prediction task. Additionally, the high classification accuracy means that the cerebral features (that describe the cerebral vascular changes that lead to hypertension development) used in the classification could successfully be used to predict hypertension before its onset. Using these features and a trained classifier allows the CAD system to be able to tell whether a person with these specific cerebral vascular features a potential hypertensive patient is or not. Another limitation of our study is that the size of the MRA data was limited to 72 patients. However, this study required a long-term follow-up period of more than 700 days. This follow-up period enabled us to measure, track, and quantify cerebral vascular changes but limited the number of patients we could recruit and successfully follow-up after 700 days. In addition, and to the best of our knowledge, there are no free standard databases available in this field. Despite this limitation, the cerebral vascular changes in the 72 subjects were adequate to enable classifiers to draw successful patterns, rules, and associations for discriminating between normal, prehypertensive, and hypertensive subjects.
5. Conclusions
An MRA-based CAD system has been presented in this manuscript to analyze the impact of vascular changes occurring over time in different regions of human brains on the development of hypertension. The study analyzed the effectiveness of considering vascular changes that occur in the entire brain versus considering vascular changes occurring at local regions of the brain, specifically, the anterior and posterior compartments, in predicting hypertension. Using supervised classification techniques, the study tested the accuracy of using descriptive vascular features in the entire brain, and in its different local compartments in classifying data into either normotensive, prehypertensive, or hypertensive. Experimental results showed that the vascular changes that occurred in the anterior compartment are more predictive of hypertension development than vascular changes occurring in the posterior compartment. Moreover, results prove that the analysis of the vasculature changes occurring in whole brain might be more predictive of hypertension than just looking at changes at specific compartments. This means that the changes taking place in the entire cerebral vasculature contribute to the development of hypertension. In addition, the adverse effects of hypertension development are likely extending to harm the whole vascular system in human brains rather than causing harm to specific compartments.
Author Contributions
Conceptualization, H.K., A.S. (Ahmed Soliman), N.E., N.S.A., A.M., F.T. and A.E.-B.; Data curation, H.K.; Investigation, H.K. and A.E.-B.; Methodology, H.K., A.S. (Ahmed Soliman), N.E., N.S.A., A.M., F.T. and A.E.-B.; Project administration, A.E.-B.; Software, H.K.; Supervision, A.E.-B.; Validation, H.K., A.S. (Ahmed Soliman), N.E., A.S. (Ahmed Saied); N.S.A., A.M., F.T. and A.E.-B.; Visualization, H.K. and A.S. (Ahmed Soliman); Writing—original draft, H.K.; Writing—review & editing, H.K., A.S. (Ahmed Soliman), N.E., N.S.A., A.M., F.T. and A.E.-B. All authors have read and agreed to the published version of the manuscript.
Funding
Princess Nourah bint Abdulrahman University Researchers Supporting Project number (PNURSP2022R40), Princess Nourah bint Abdulrahman University, Riyadh, Saudi Arabia.
Institutional Review Board Statement
The study was conducted according to the guidelines of the Declaration of Helsinki, and approved by the Institutional Review Board at the university of Pittsburgh.
Informed Consent Statement
Informed consent was obtained from all subjects involved in the study.
Data Availability Statement
The data presented in this study are available on request from the corresponding author.
Conflicts of Interest
The authors declare no conflict of interest.
References
- Control CfD. About Underlying Cause of Death, Hypertension, Available via National Center for Health Statistics. 2015. Available online: http://wonder.cdc.gov/ucd-icd10.html (accessed on 18 January 2018).
- Iadecola, C.; Davisson, R.L. Hypertension and cerebrovascular dysfunction. Cell Metab. 2008, 7, 476–484. [Google Scholar] [CrossRef] [PubMed] [Green Version]
- Whelton, P.K.; Carey, R.M.; Aronow, W.S.; Casey, D.E.; Collins, K.J.; Himmelfarb, C.D.; DePalma, S.M.; Gidding, S.; Jamerson, K.A.; Jones, D.W.; et al. 2017 ACC/AHA/AAPA/ABC/ACPM/AGS/APhA/ASH/ASPC/NMA/PCNA guideline for the prevention, detection, evaluation, and management of high blood pressure in adults: A report of the American College of Cardiology/American Heart Association Task Force on Clinical Practice Guidelines. J. Am. Coll. Cardiol. 2018, 71, e127–e248. [Google Scholar] [PubMed]
- Barnes, J.N.; Harvey, R.E.; Zuk, S.M.; Lundt, E.S.; Lesnick, T.G.; Gunter, J.L.; Senjem, M.L.; Shuster, L.T.; Miller, V.M.; Jack, C.R.; et al. Aortic hemodynamics and white matter hyperintensities in normotensive postmenopausal women. J. Neurol. 2017, 264, 938–945. [Google Scholar] [CrossRef] [PubMed] [Green Version]
- Launer, L.J.; Lewis, C.E.; Schreiner, P.J.; Sidney, S.; Battapady, H.; Jacobs, D.R.; Lim, K.O.; D’Esposito, M.; Zhang, Q.; Reis, J.; et al. Vascular factors and multiple measures of early brain health: CARDIA brain MRI study. PLoS ONE 2015, 10, e0122138. [Google Scholar] [CrossRef] [PubMed] [Green Version]
- Hayashi, K.; Makino, A.; Kakoi, D. Remodeling of arterial wall: Response to changes in both blood flow and blood pressure. J. Mech. Behav. Biomed. Mater. 2018, 77, 475–484. [Google Scholar] [CrossRef] [PubMed]
- Ussavarungsi, K.; Whitlock, J.P.; Lundy, T.A.; Carabenciov, I.D.; Burger, C.D.; Lee, A.S. The significance of pulmonary artery size in pulmonary hypertension. Diseases 2014, 2, 243–259. [Google Scholar] [CrossRef] [Green Version]
- Han, H.C. Twisted blood vessels: Symptoms, etiology and biomechanical mechanisms. J. Vasc. Res. 2012, 49, 185–197. [Google Scholar] [CrossRef] [Green Version]
- Abdalla, M.; Hunter, A.; Al-Diri, B. Quantifying retinal blood vessels’ tortuosity. In Proceedings of the 2015 Science and Information Conference (SAI), London, UK, 28–30 July 2015; pp. 687–693. [Google Scholar]
- Kandil, H.; Soliman, A.; Ghazal, M.; Mahmoud, A.; Shalaby, A.; Keynton, R.; Elmaghraby, A.; Giridharan, G.; El-Baz, A. A novel framework for early detection of hypertension using magnetic resonance angiography. Sci. Rep. 2019, 9, 11105. [Google Scholar] [CrossRef] [PubMed] [Green Version]
- Phellan, R.; Peixinho, A.; Falcão, A.; Forkert, N.D. Vascular Segmentation in TOF MRA Images of the Brain Using a Deep Convolutional Neural Network. In Intravascular Imaging and Computer Assisted Stenting, and Large-Scale Annotation of Biomedical Data and Expert Label Synthesis; Springer: Berlin/Heidelberg, Germany, 2017; pp. 39–46. [Google Scholar]
- Zhao, S.; Tian, Y.; Wang, X.; Xu, P.; Deng, Q.; Zhou, M. Vascular Extraction Using MRA Statistics and Gradient Information. Math. Probl. Eng. 2018, 2018, 6131325. [Google Scholar] [CrossRef] [Green Version]
- Xu, F.; Wang, X.C.; Zhou, M.Q.; Wu, Z.; Liu, X.Y. Segmentation algorithm of brain vessel image based on SEM statistical mixture model. In Proceedings of the 2010 Seventh International Conference on Fuzzy Systems and Knowledge Discovery, Yantai, China, 10–12 August 2010; Volume 4, pp. 1830–1833. [Google Scholar]
- Roth, W.; Morgello, S.; Goldman, J.; Mohr, J.P.; Elkind, M.S.; Marshall, R.S.; Gutierrez, J. Histopathological differences between the anterior and posterior brain arteries as a function of aging. Stroke 2017, 48, 638–644. [Google Scholar] [CrossRef] [PubMed] [Green Version]
- Huttunen, T.; von und zu Fraunberg, M.; Frösen, J.; Lehecka, M.; Tromp, G.; Helin, K.; Koivisto, T.; Rinne, J.; Ronkainen, A.; Hernesniemi, J.; et al. Saccular intracranial aneurysm disease: Distribution of site, size, and age suggests different etiologies for aneurysm formation and rupture in 316 familial and 1454 sporadic eastern Finnish patients. Neurosurgery 2010, 66, 631–638. [Google Scholar] [CrossRef] [PubMed]
- Libman, R.; Kwiatkowski, T.; Hansen, M.; Clarke, W.; Woolson, R.; Adams, H. Differences between anterior and posterior circulation stroke in TOAST. Cerebrovasc. Dis. 2001, 11, 311–316. [Google Scholar] [CrossRef] [PubMed]
- Washio, T.; Watanabe, H.; Ogoh, S. Dynamic cerebral autoregulation in anterior and posterior cerebral circulation during cold pressor test. J. Physiol. Sci. 2020, 70, 1–8. [Google Scholar] [CrossRef] [PubMed]
- Varble, N.; Rajabzadeh-Oghaz, H.; Wang, J.; Siddiqui, A.; Meng, H.; Mowla, A. Differences in morphologic and hemodynamic characteristics for “PHASES-based” intracranial aneurysm locations. Am. J. Neuroradiol. 2017, 38, 2105–2110. [Google Scholar] [CrossRef] [PubMed] [Green Version]
- Tustison, N.J.; Avants, B.B.; Cook, P.A.; Zheng, Y.; Egan, A.; Yushkevich, P.A.; Gee, J.C. N4ITK: Improved N3 bias correction. IEEE Trans. Med. Imaging 2010, 29, 1310–1320. [Google Scholar] [CrossRef] [PubMed] [Green Version]
- Bouman, C.; Sauer, K. A generalized Gaussian image model for edge-preserving MAP estimation. IEEE Trans. Image Process. 1993, 2, 296–310. [Google Scholar] [CrossRef] [PubMed] [Green Version]
- Kandil, H.; Soliman, A.; Fraiwan, L.; Shalaby, A.; Mahmoud, A.; ElTanboly, A.; Elmaghraby, A.; Giridharan, G.; El-Baz, A. A novel MRA framework based on integrated global and local analysis for accurate segmentation of the cerebral vascular system. In Proceedings of the 2018 IEEE 15th International Symposium on Biomedical Imaging (ISBI 2018), Washington, DC, USA, 4–7 April 2018; pp. 1365–1368. [Google Scholar]
- El-Baz, A.; Gimel’farb, G. EM based approximation of empirical distributions with linear combinations of discrete Gaussians. In Proceedings of the 2007 IEEE International Conference on Image Processing, San Antonio, TX, USA, 16 September–19 October 2007; Volume 4, pp. 300–373. [Google Scholar]
- Moccia, S.; De Momi, E.; El Hadji, S.; Mattos, L.S. Blood vessel segmentation algorithms—Review of methods, datasets and evaluation metrics. Comput. Methods Programs Biomed. 2018, 158, 71–91. [Google Scholar] [CrossRef] [PubMed] [Green Version]
- Kang, C.K.; Park, C.A.; Lee, H.; Kim, S.H.; Park, C.W.; Kim, Y.B.; Cho, Z.H. Hypertension correlates with lenticulostriate arteries visualized by 7T magnetic resonance angiography. Hypertension 2009, 54, 1050–1056. [Google Scholar] [CrossRef] [PubMed]
- Chen, Y.C.; Li, M.H.; Li, Y.H.; Qiao, R.H. Analysis of correlation between the number of lenticulostriate arteries and hypertension based on high-resolution MR angiography findings. Am. J. Neuroradiol. 2011, 32, 1899–1903. [Google Scholar] [CrossRef] [PubMed] [Green Version]
Publisher’s Note: MDPI stays neutral with regard to jurisdictional claims in published maps and institutional affiliations. |
© 2022 by the authors. Licensee MDPI, Basel, Switzerland. This article is an open access article distributed under the terms and conditions of the Creative Commons Attribution (CC BY) license (https://creativecommons.org/licenses/by/4.0/).